
Post-Earthquake Damage Assessment—Case Study of the Educational Building after the Zagreb Earthquake


Abstract
1. Introduction
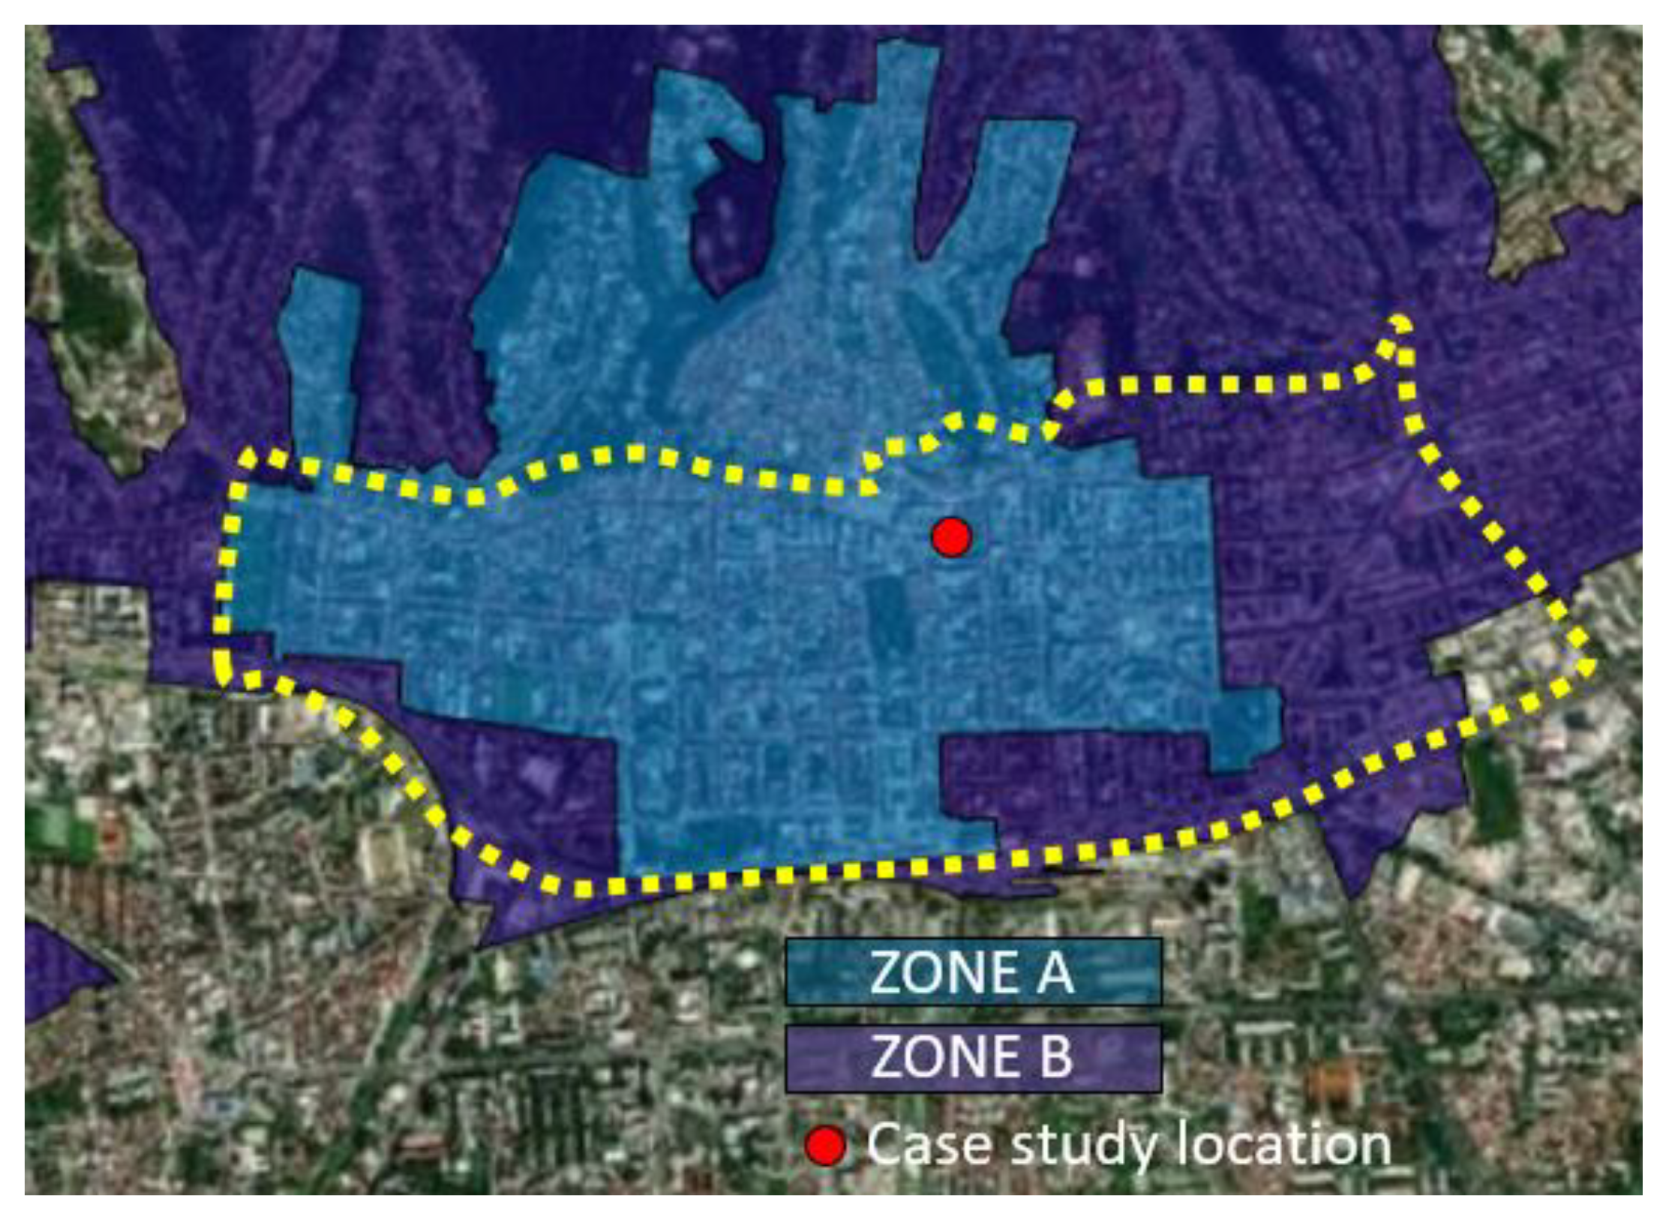
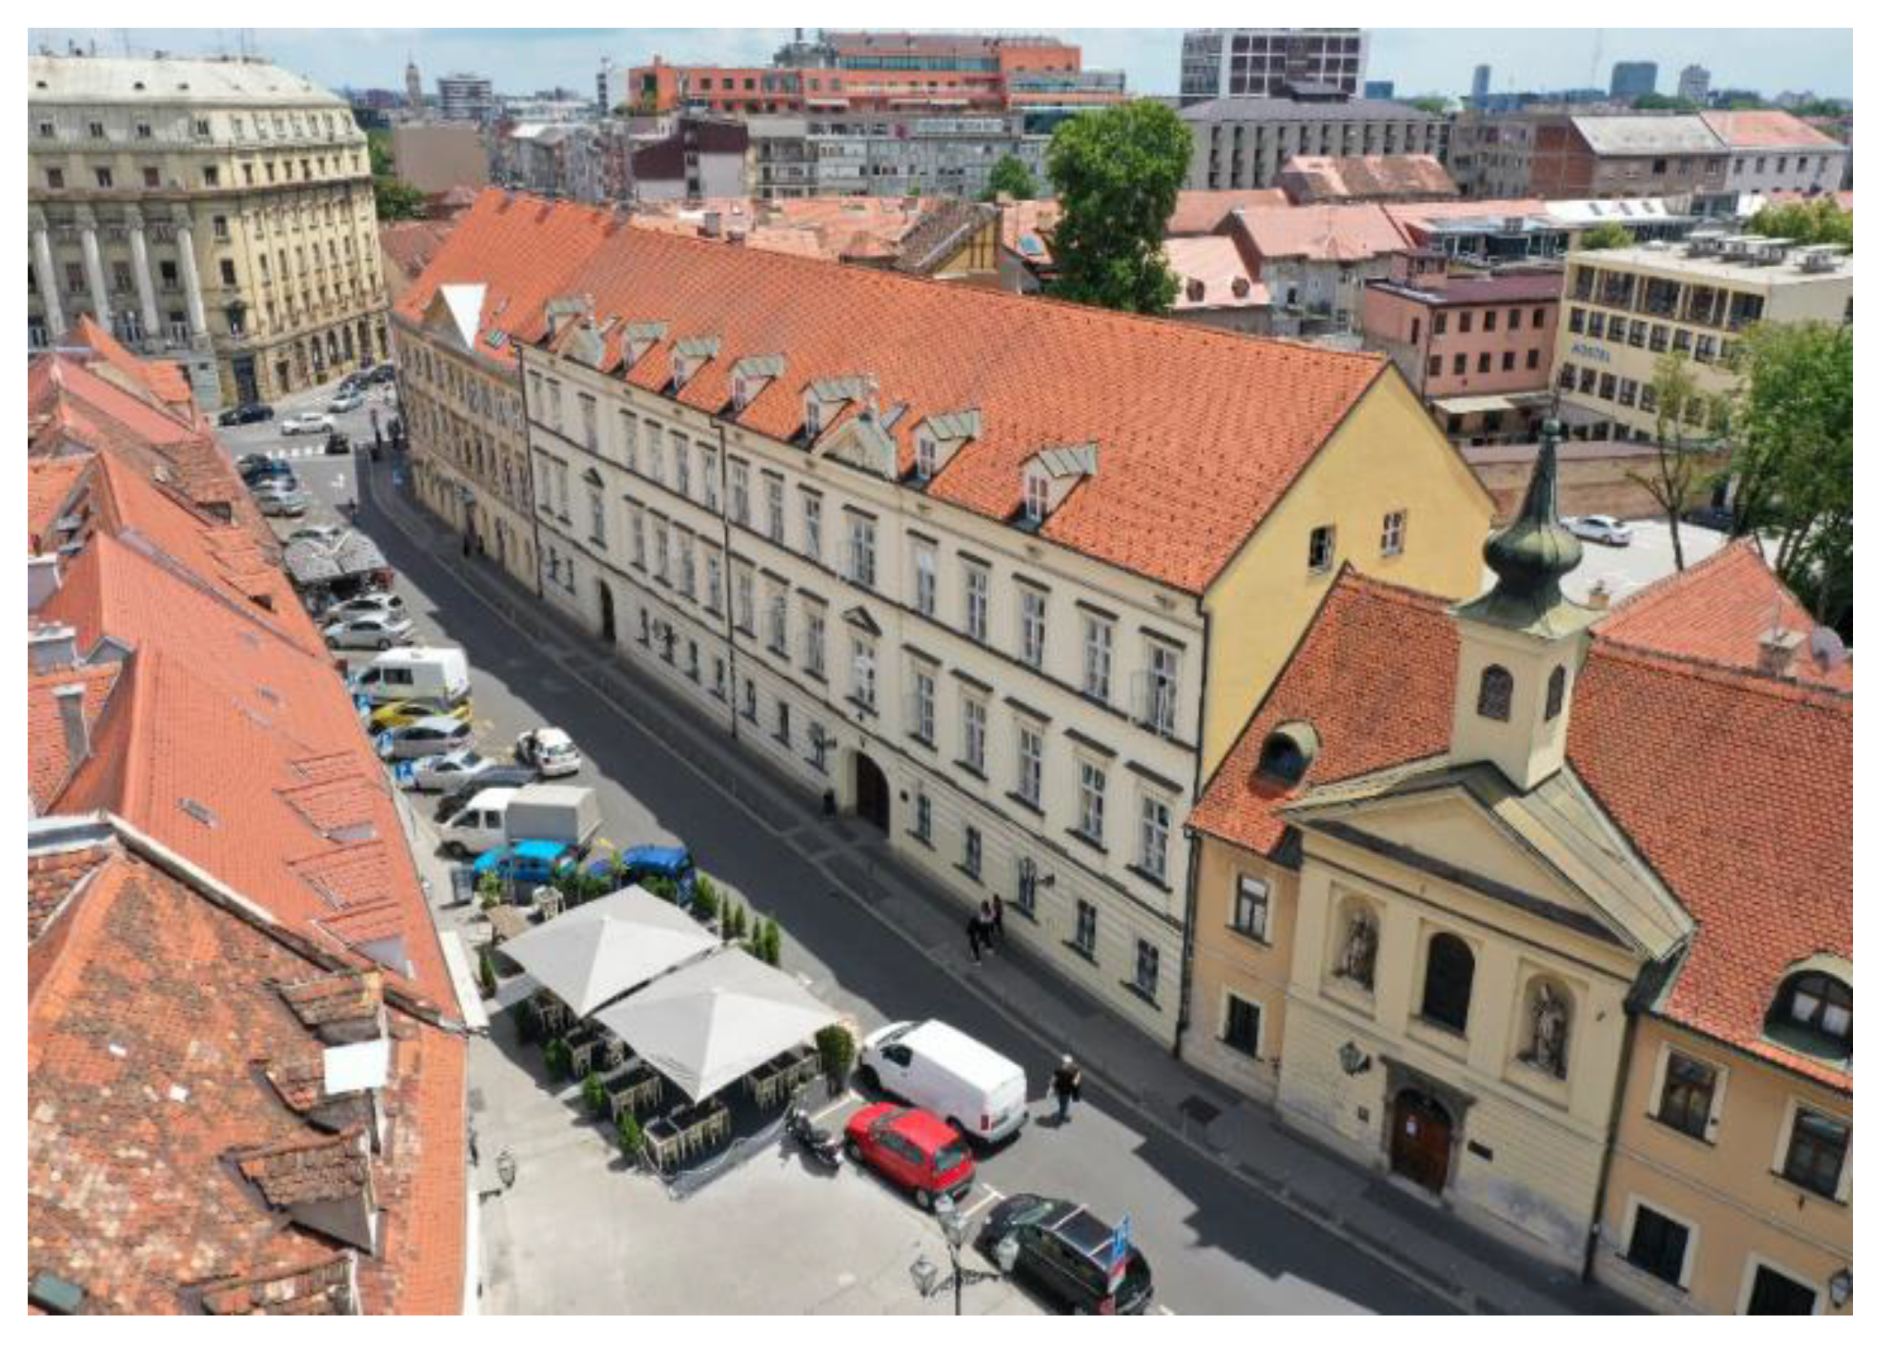
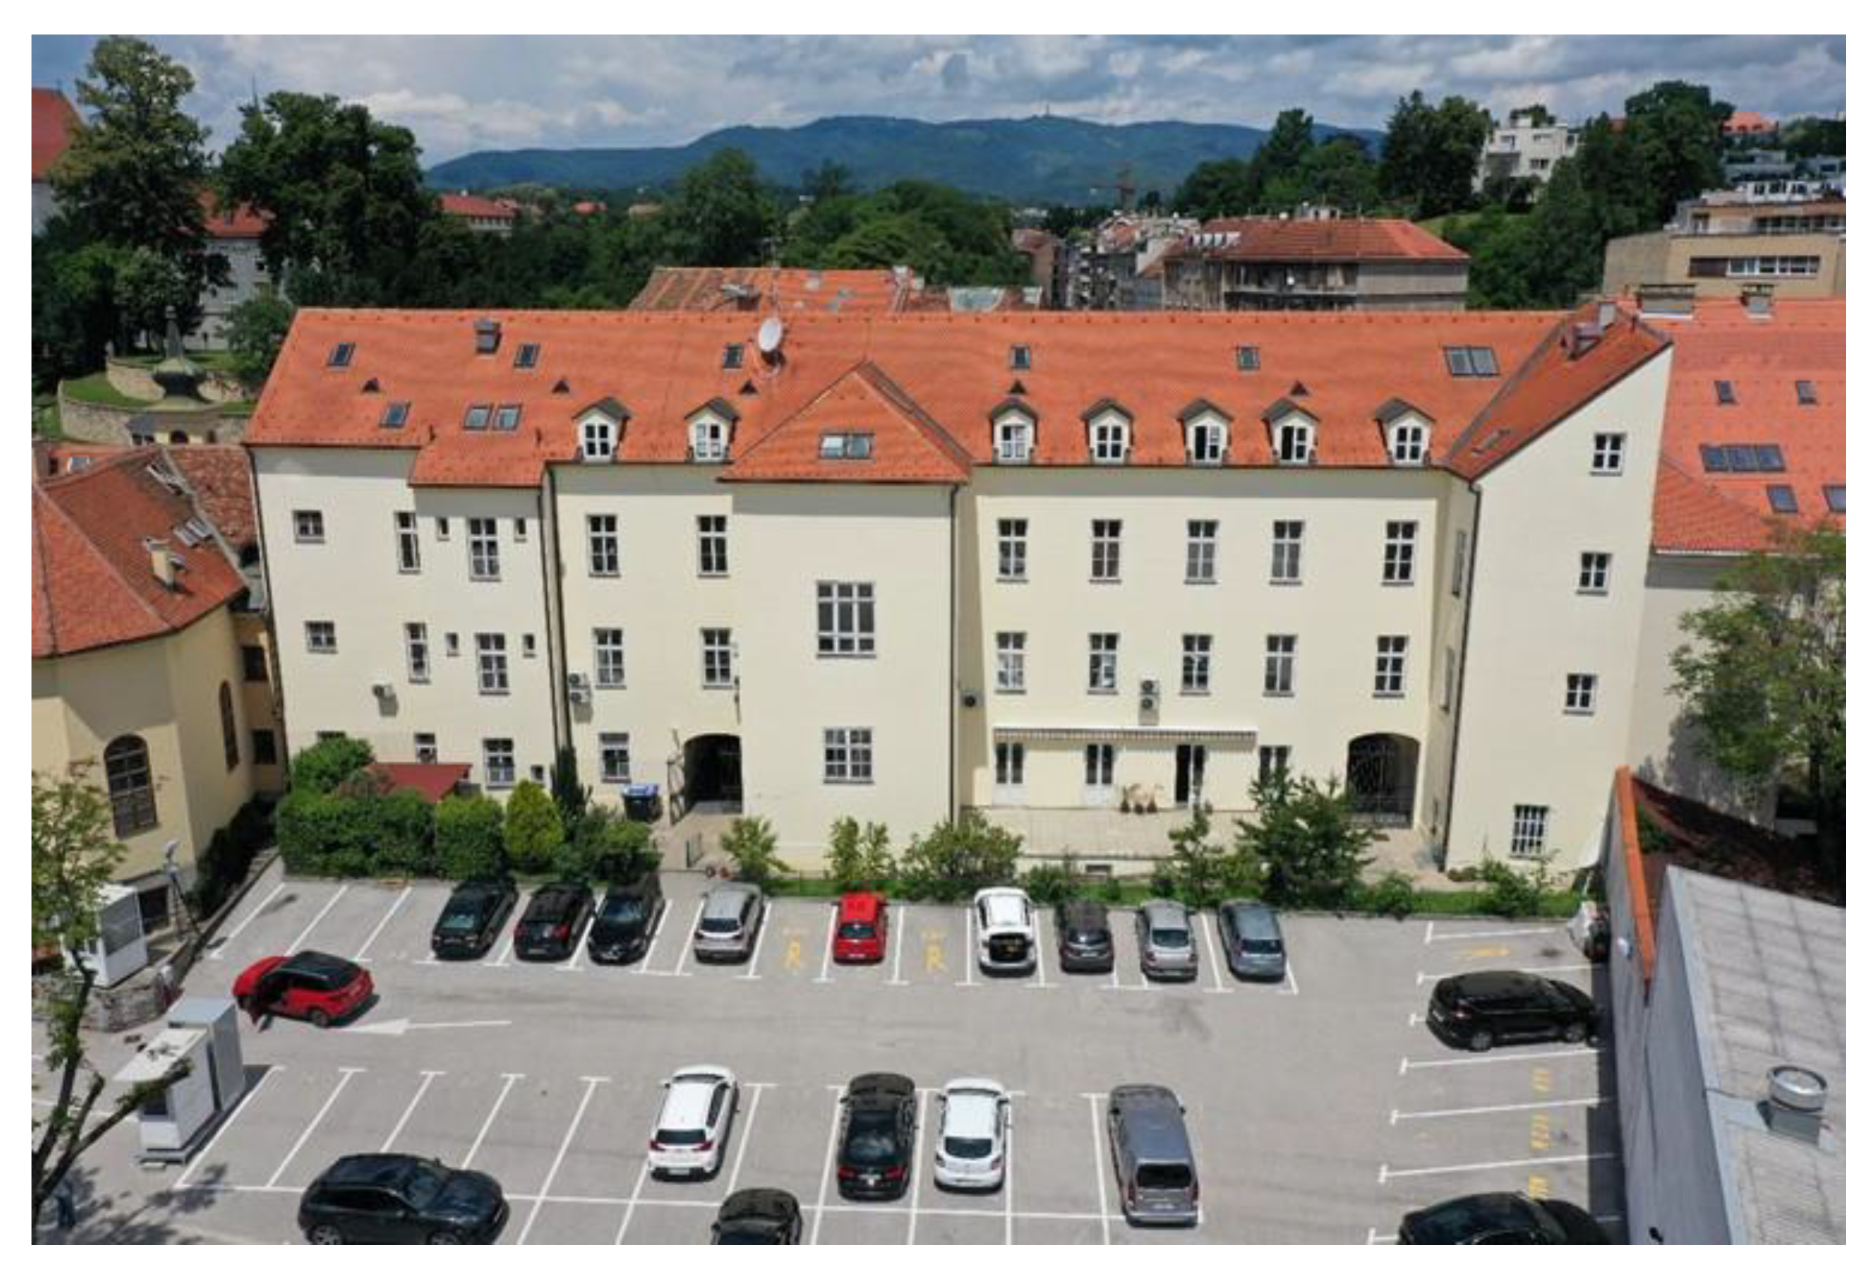
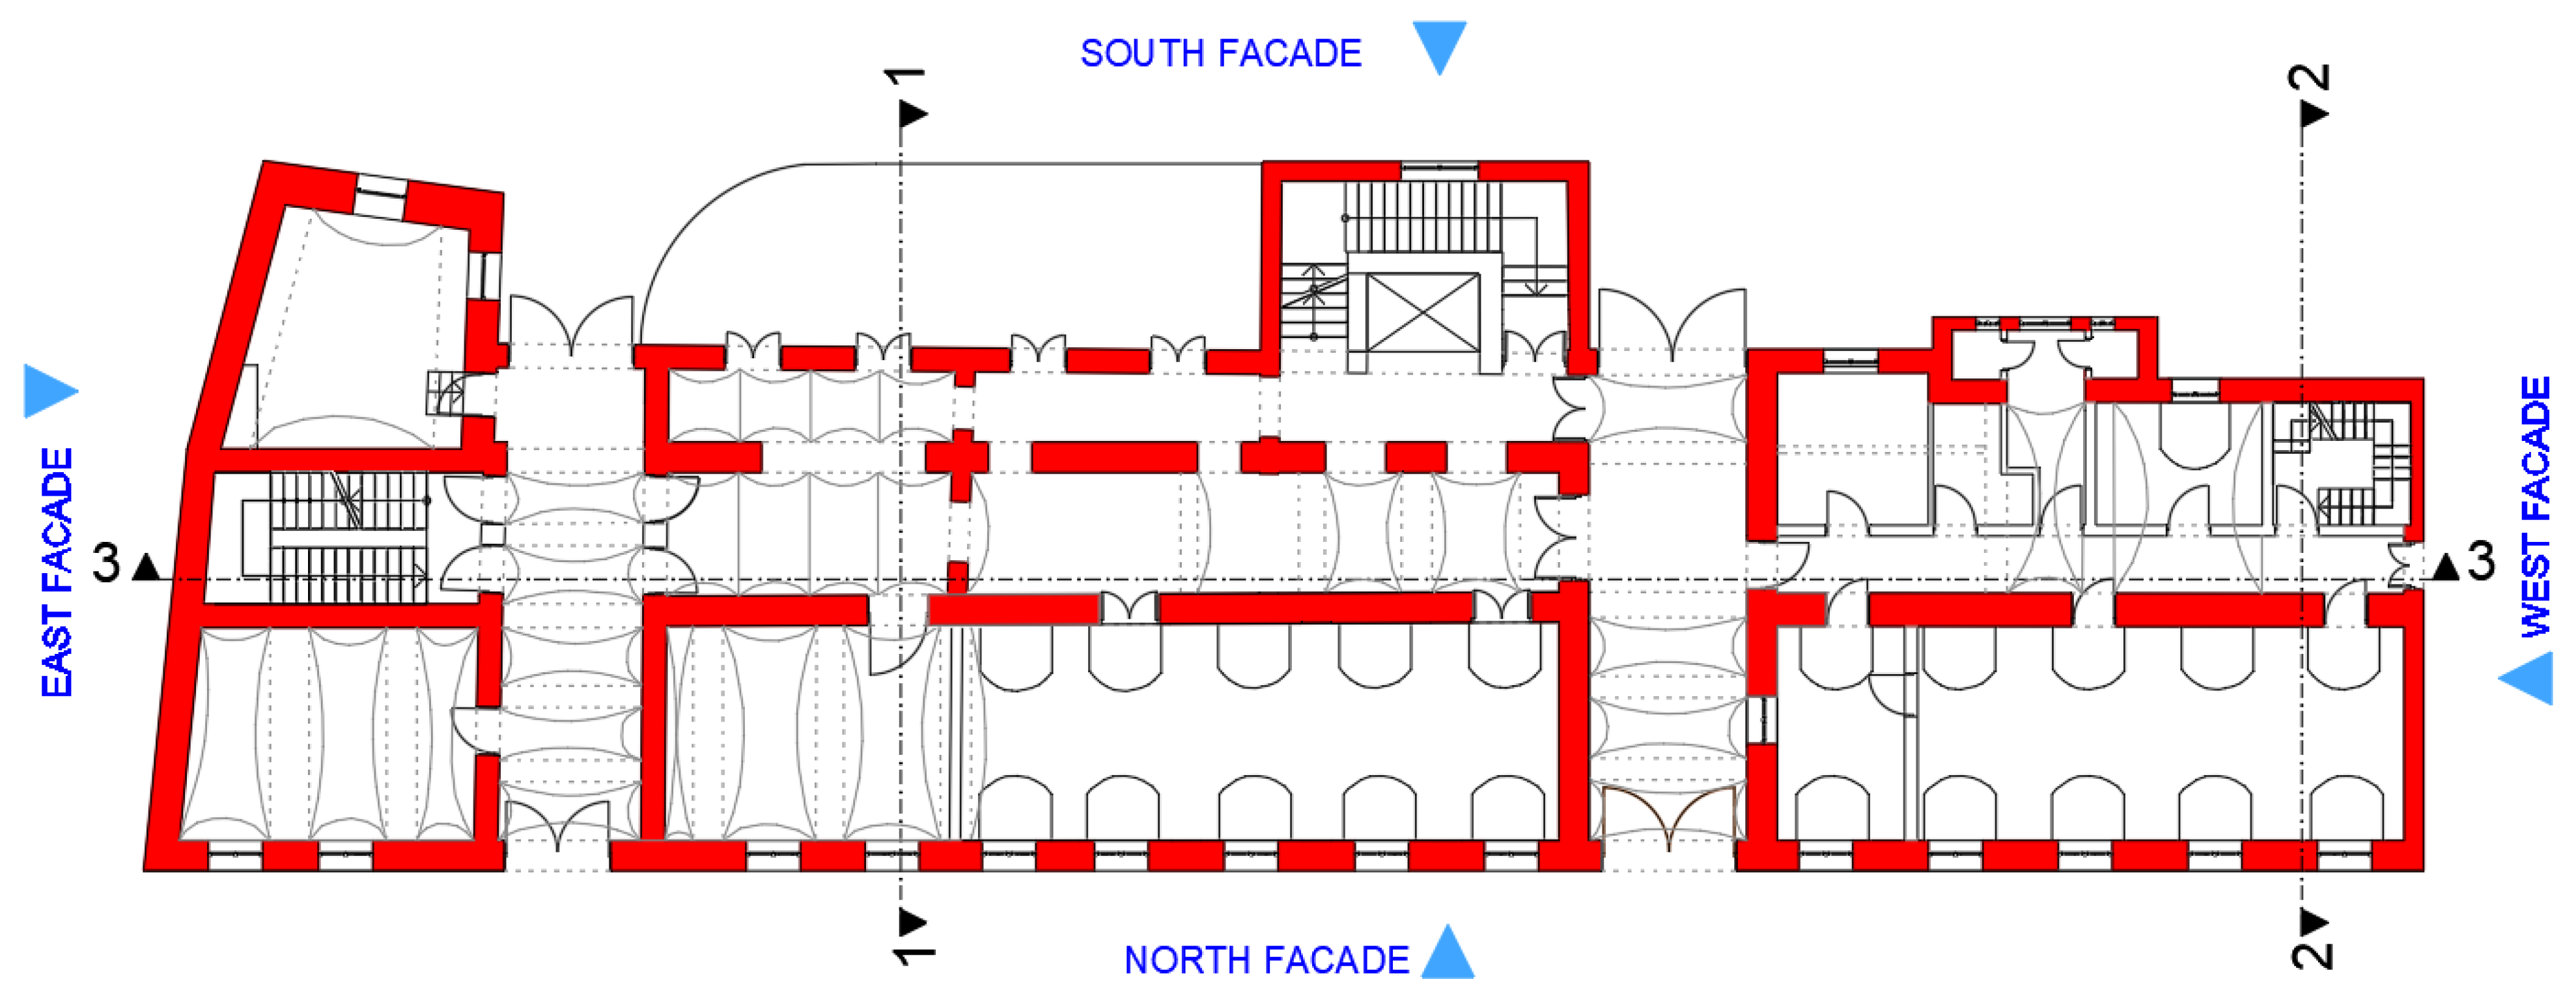
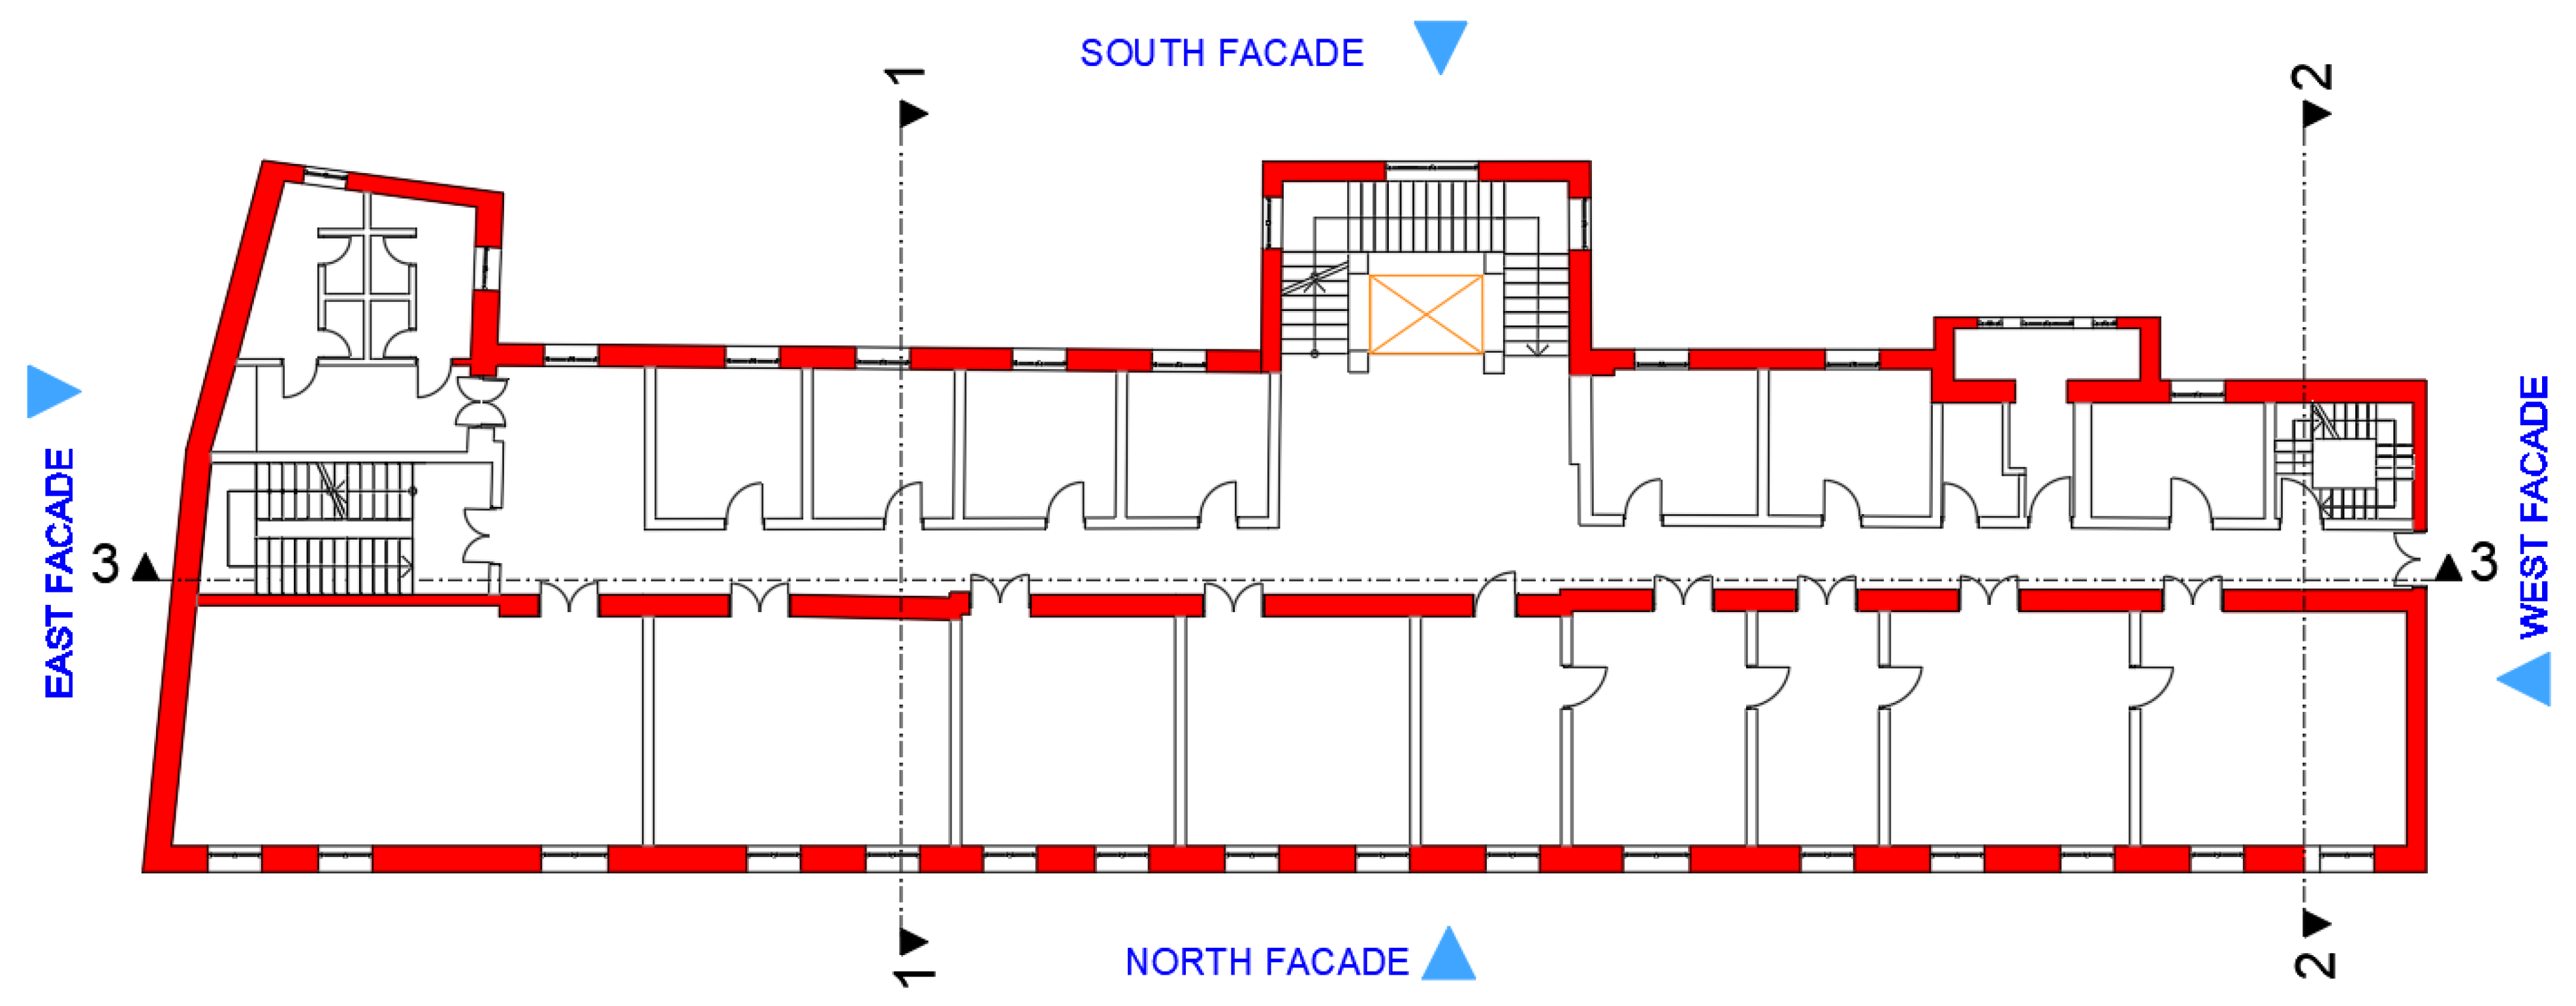
2. The Case Study
3. Methodology
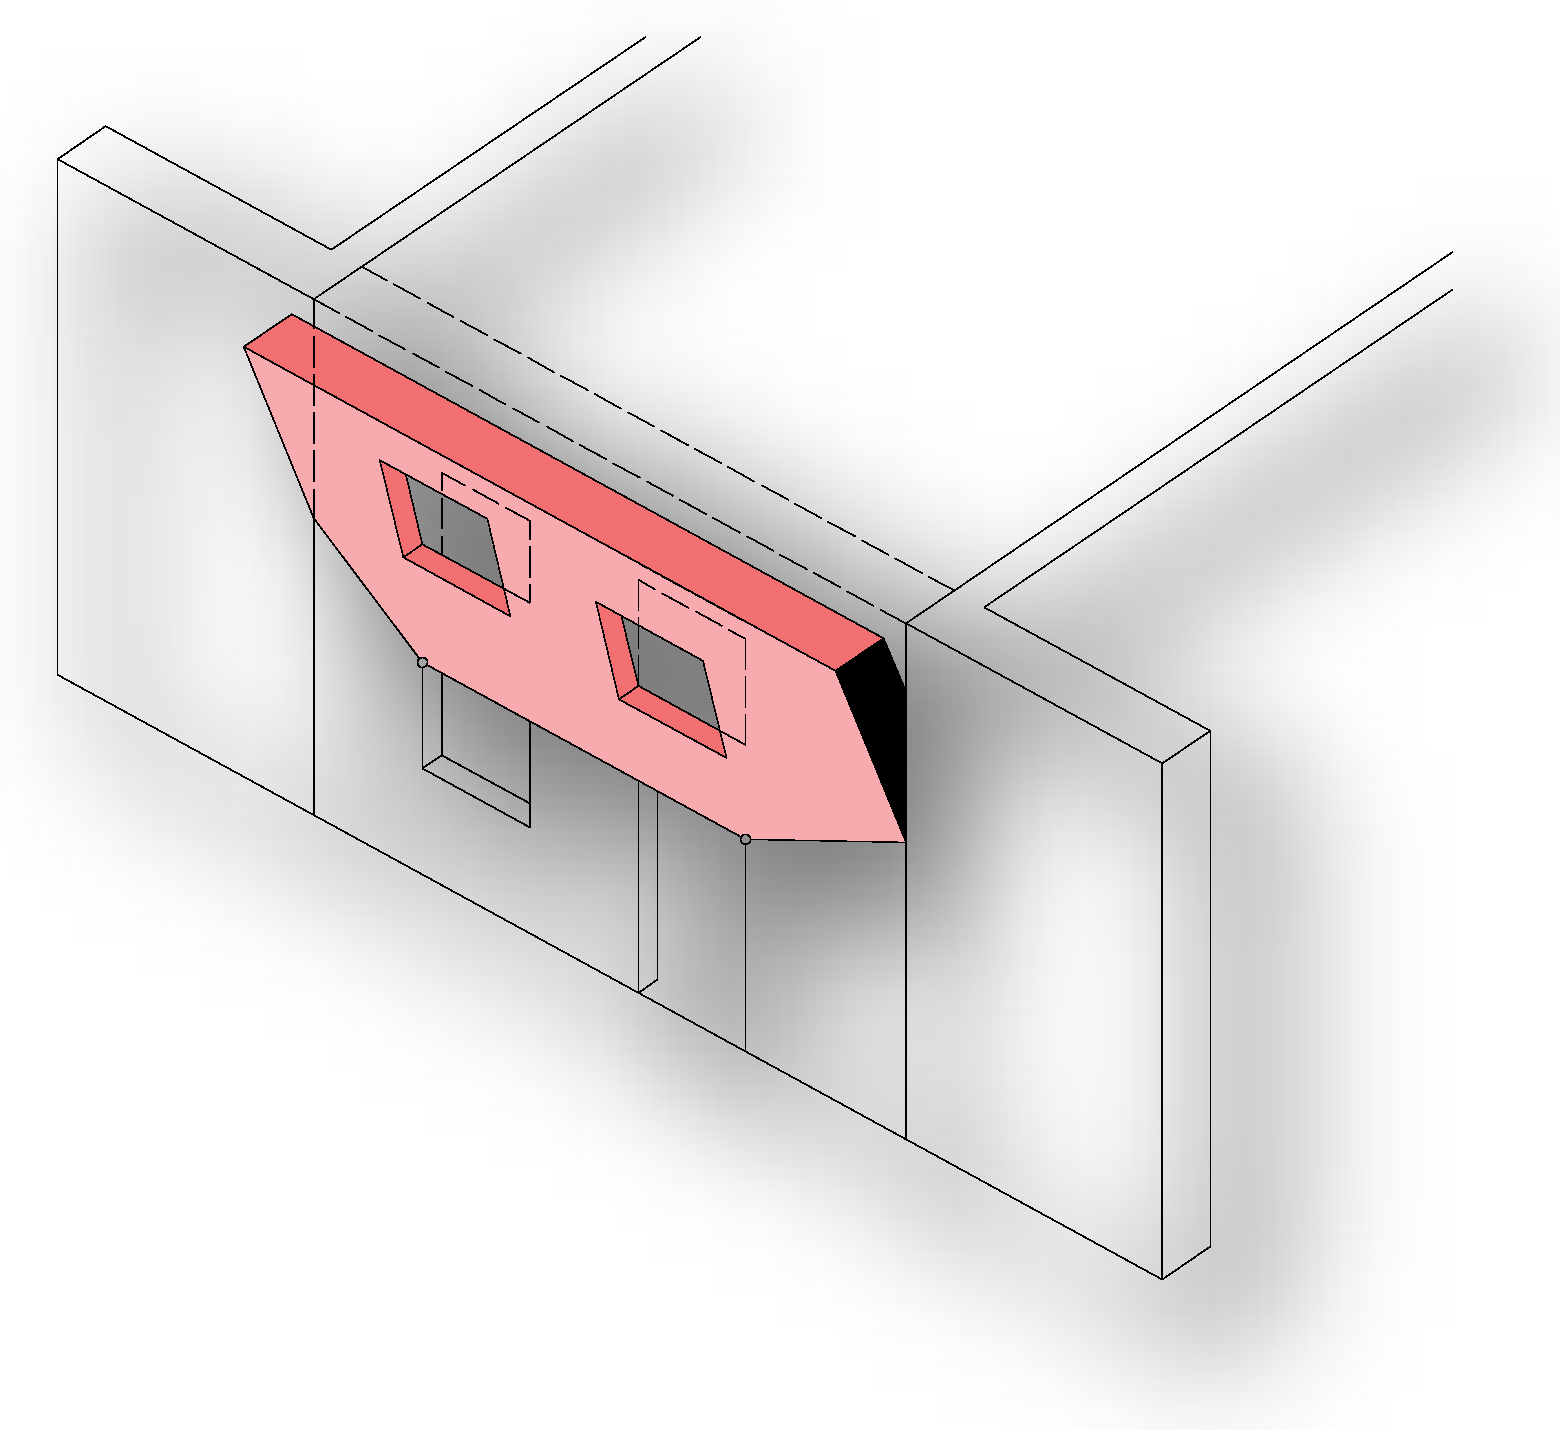
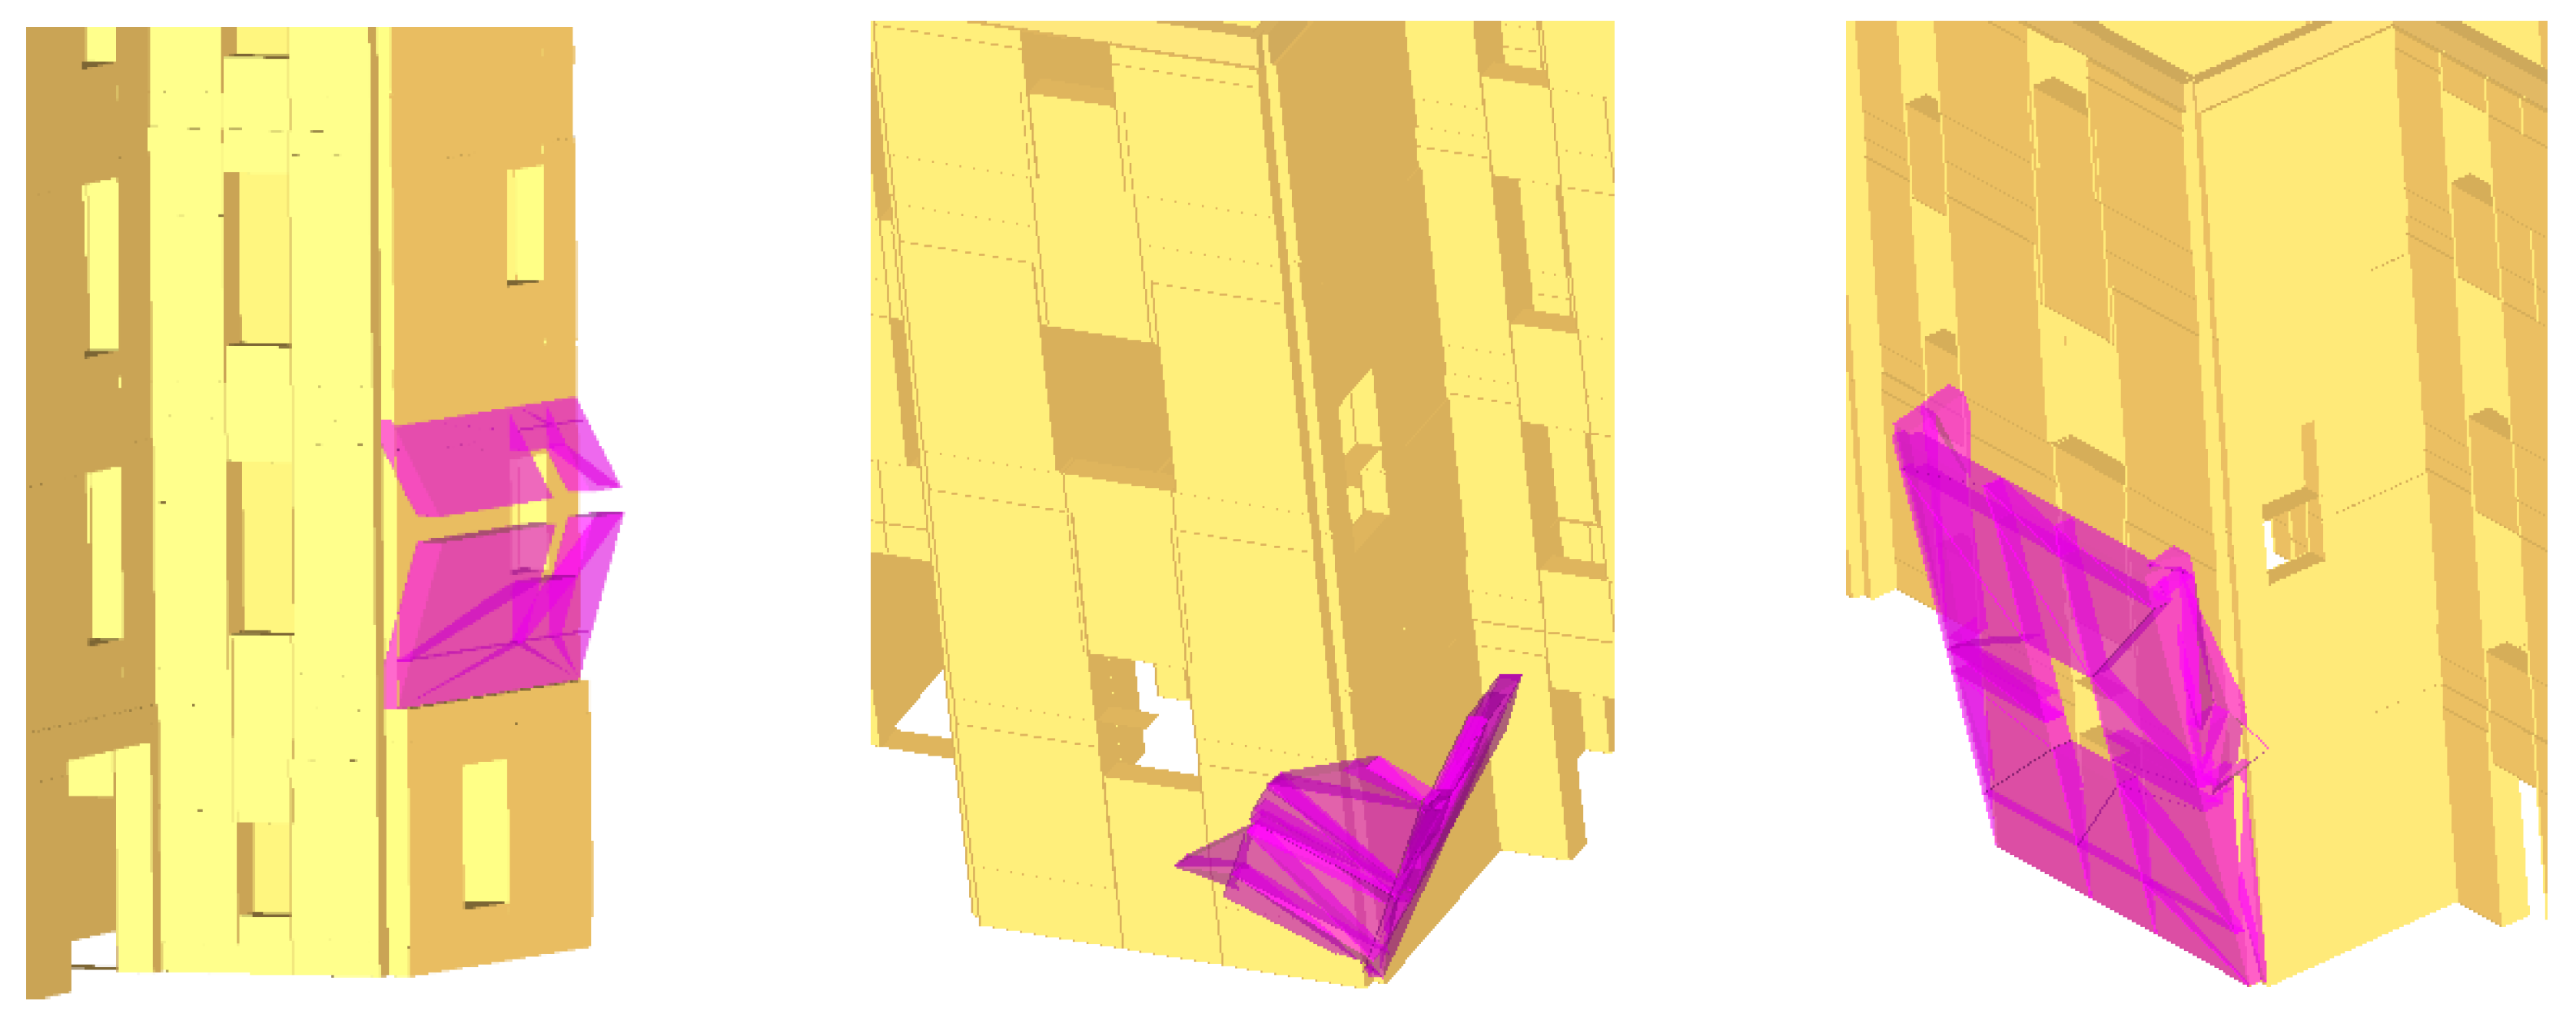
3.1. Assessment Procedure
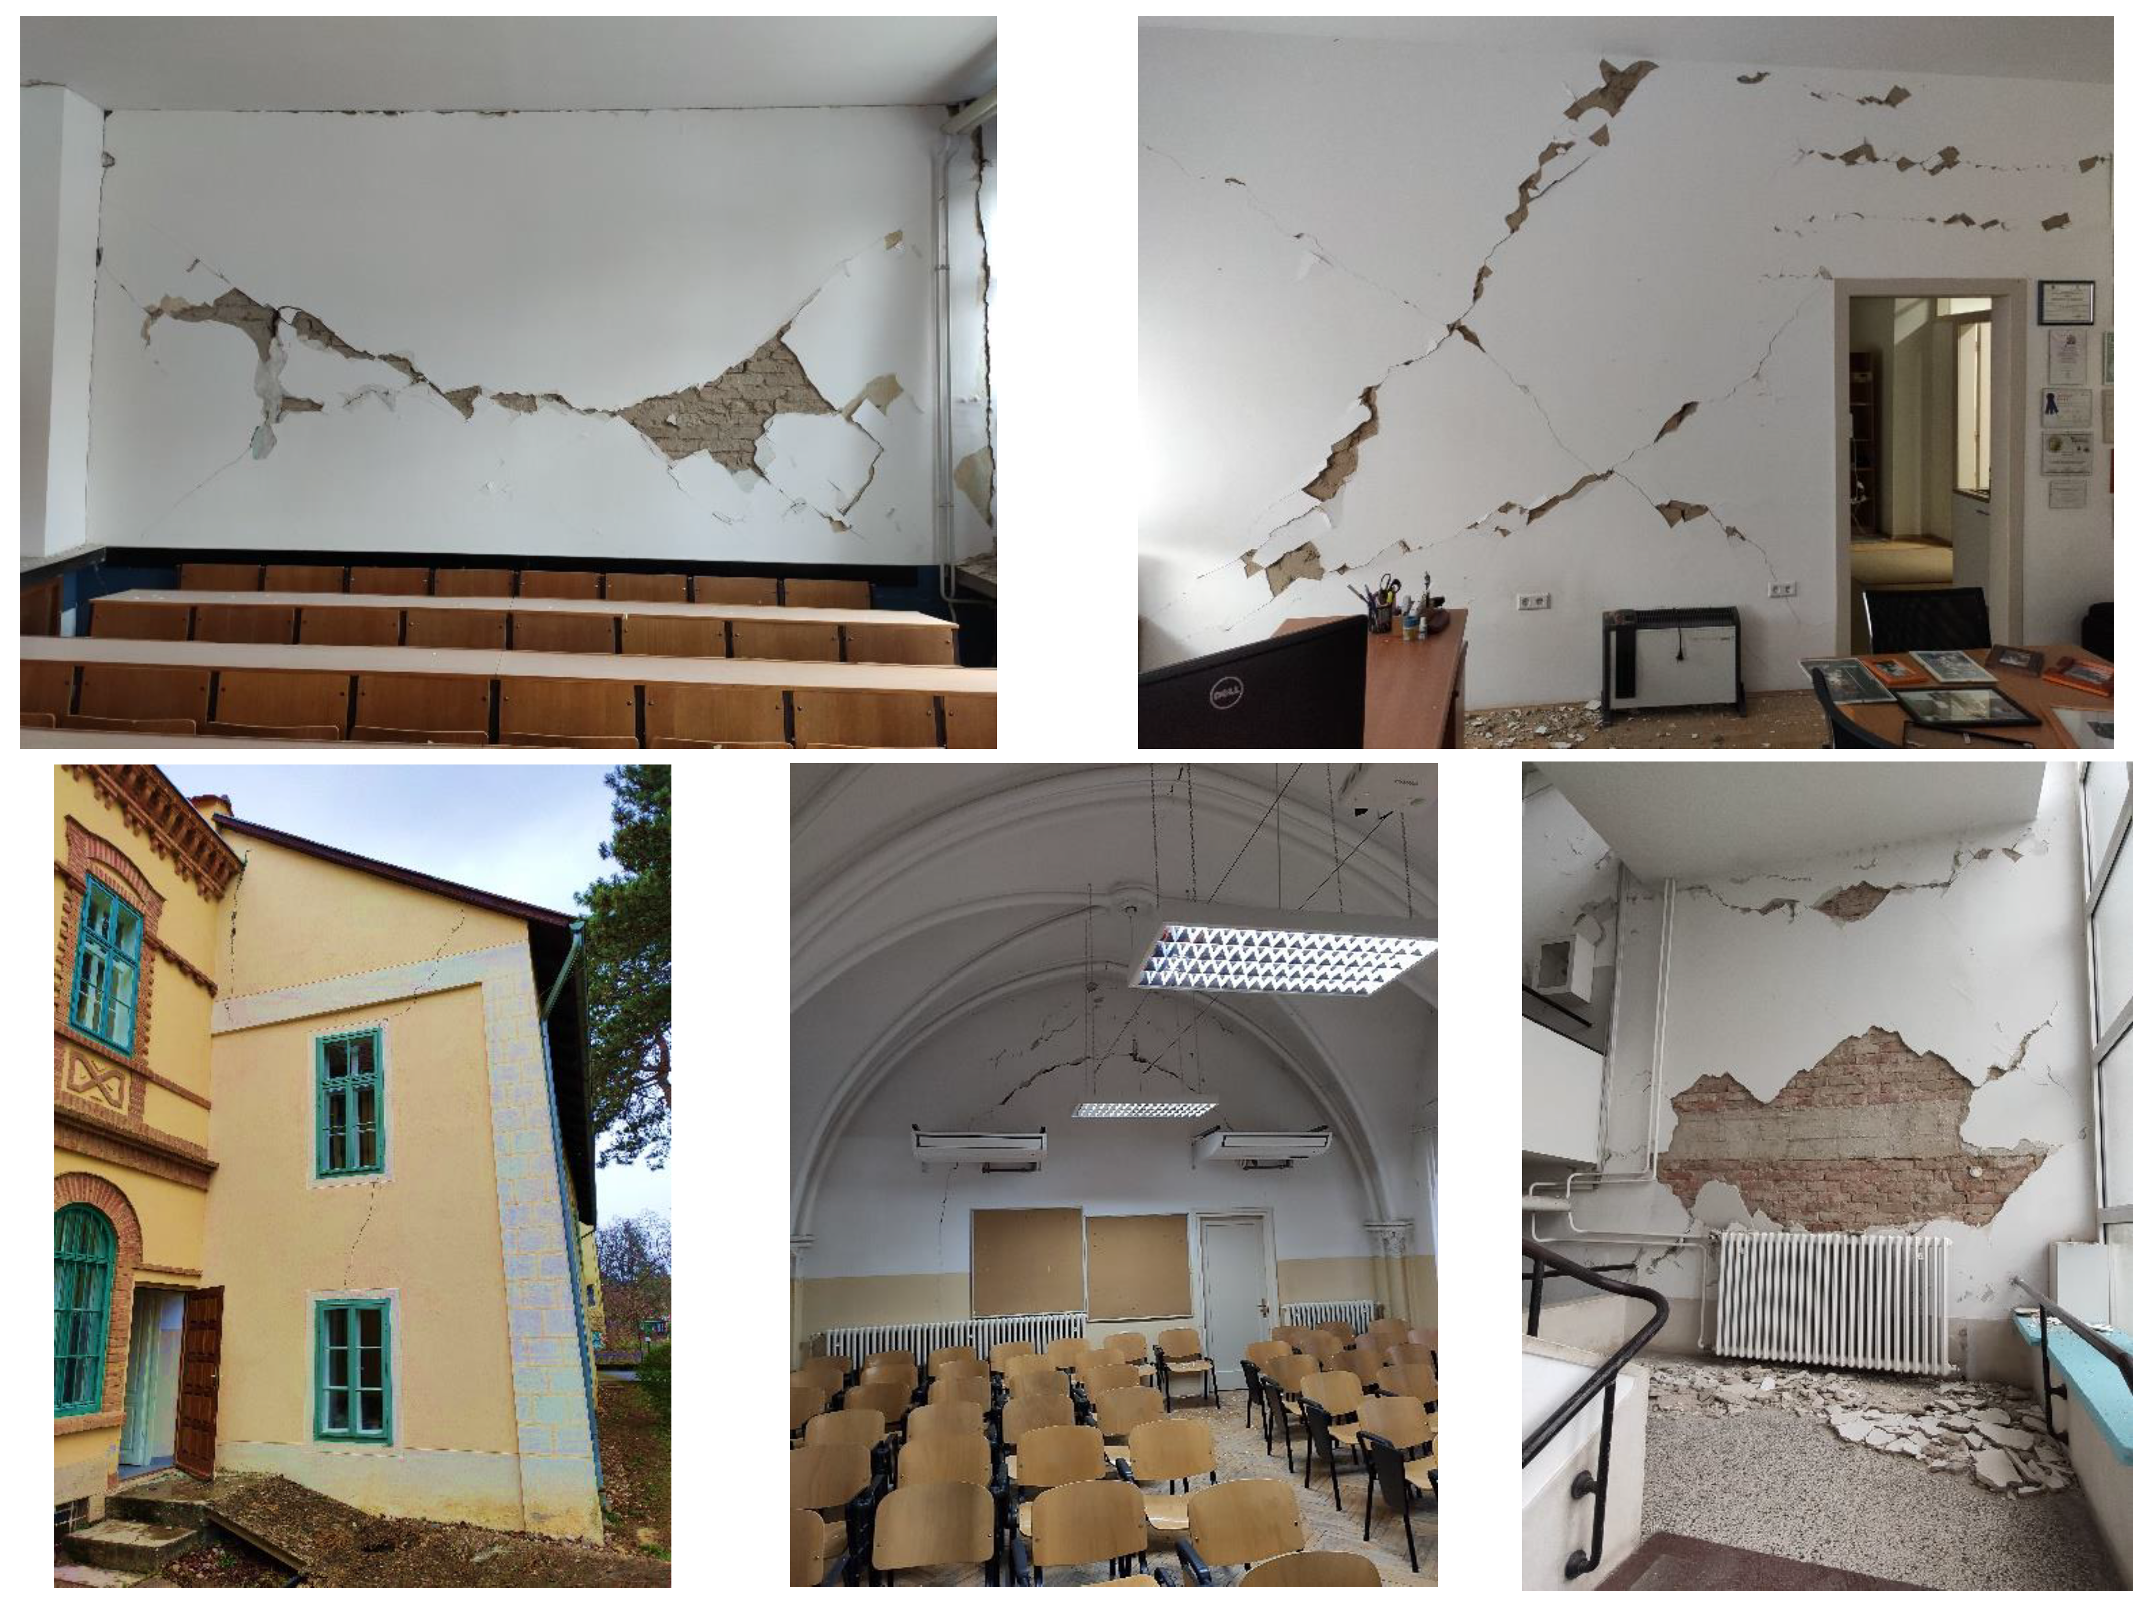
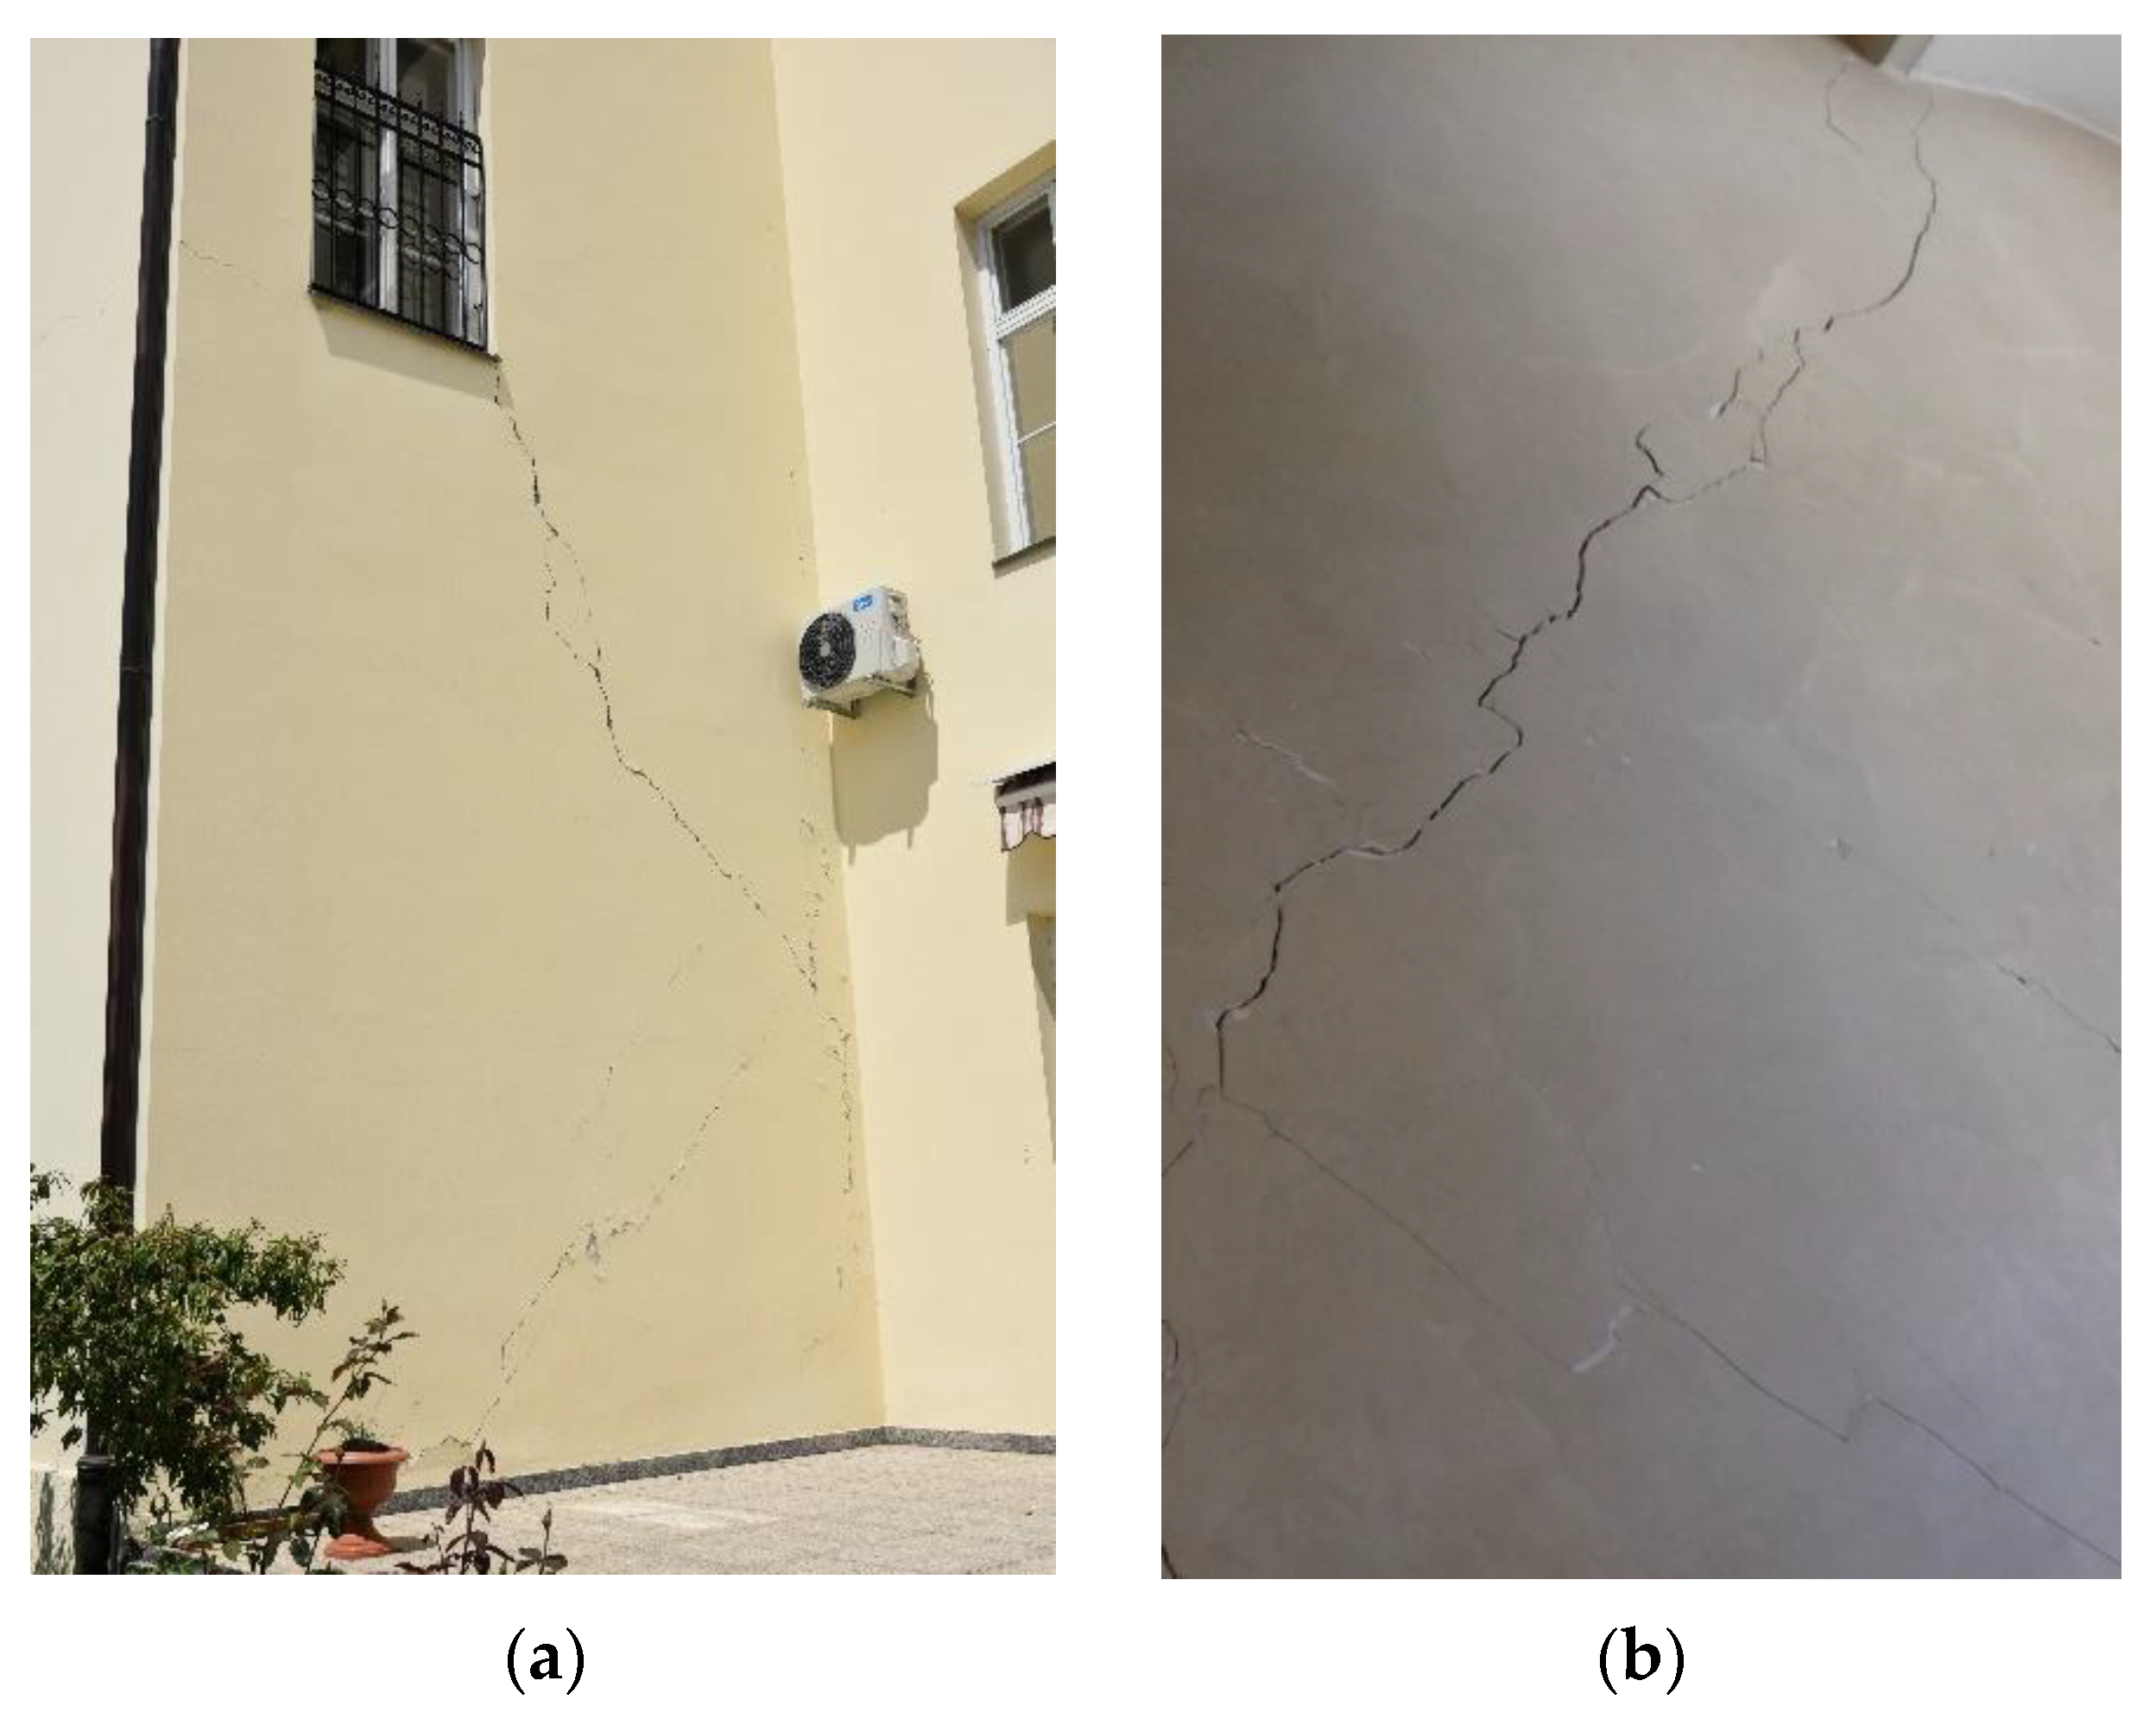
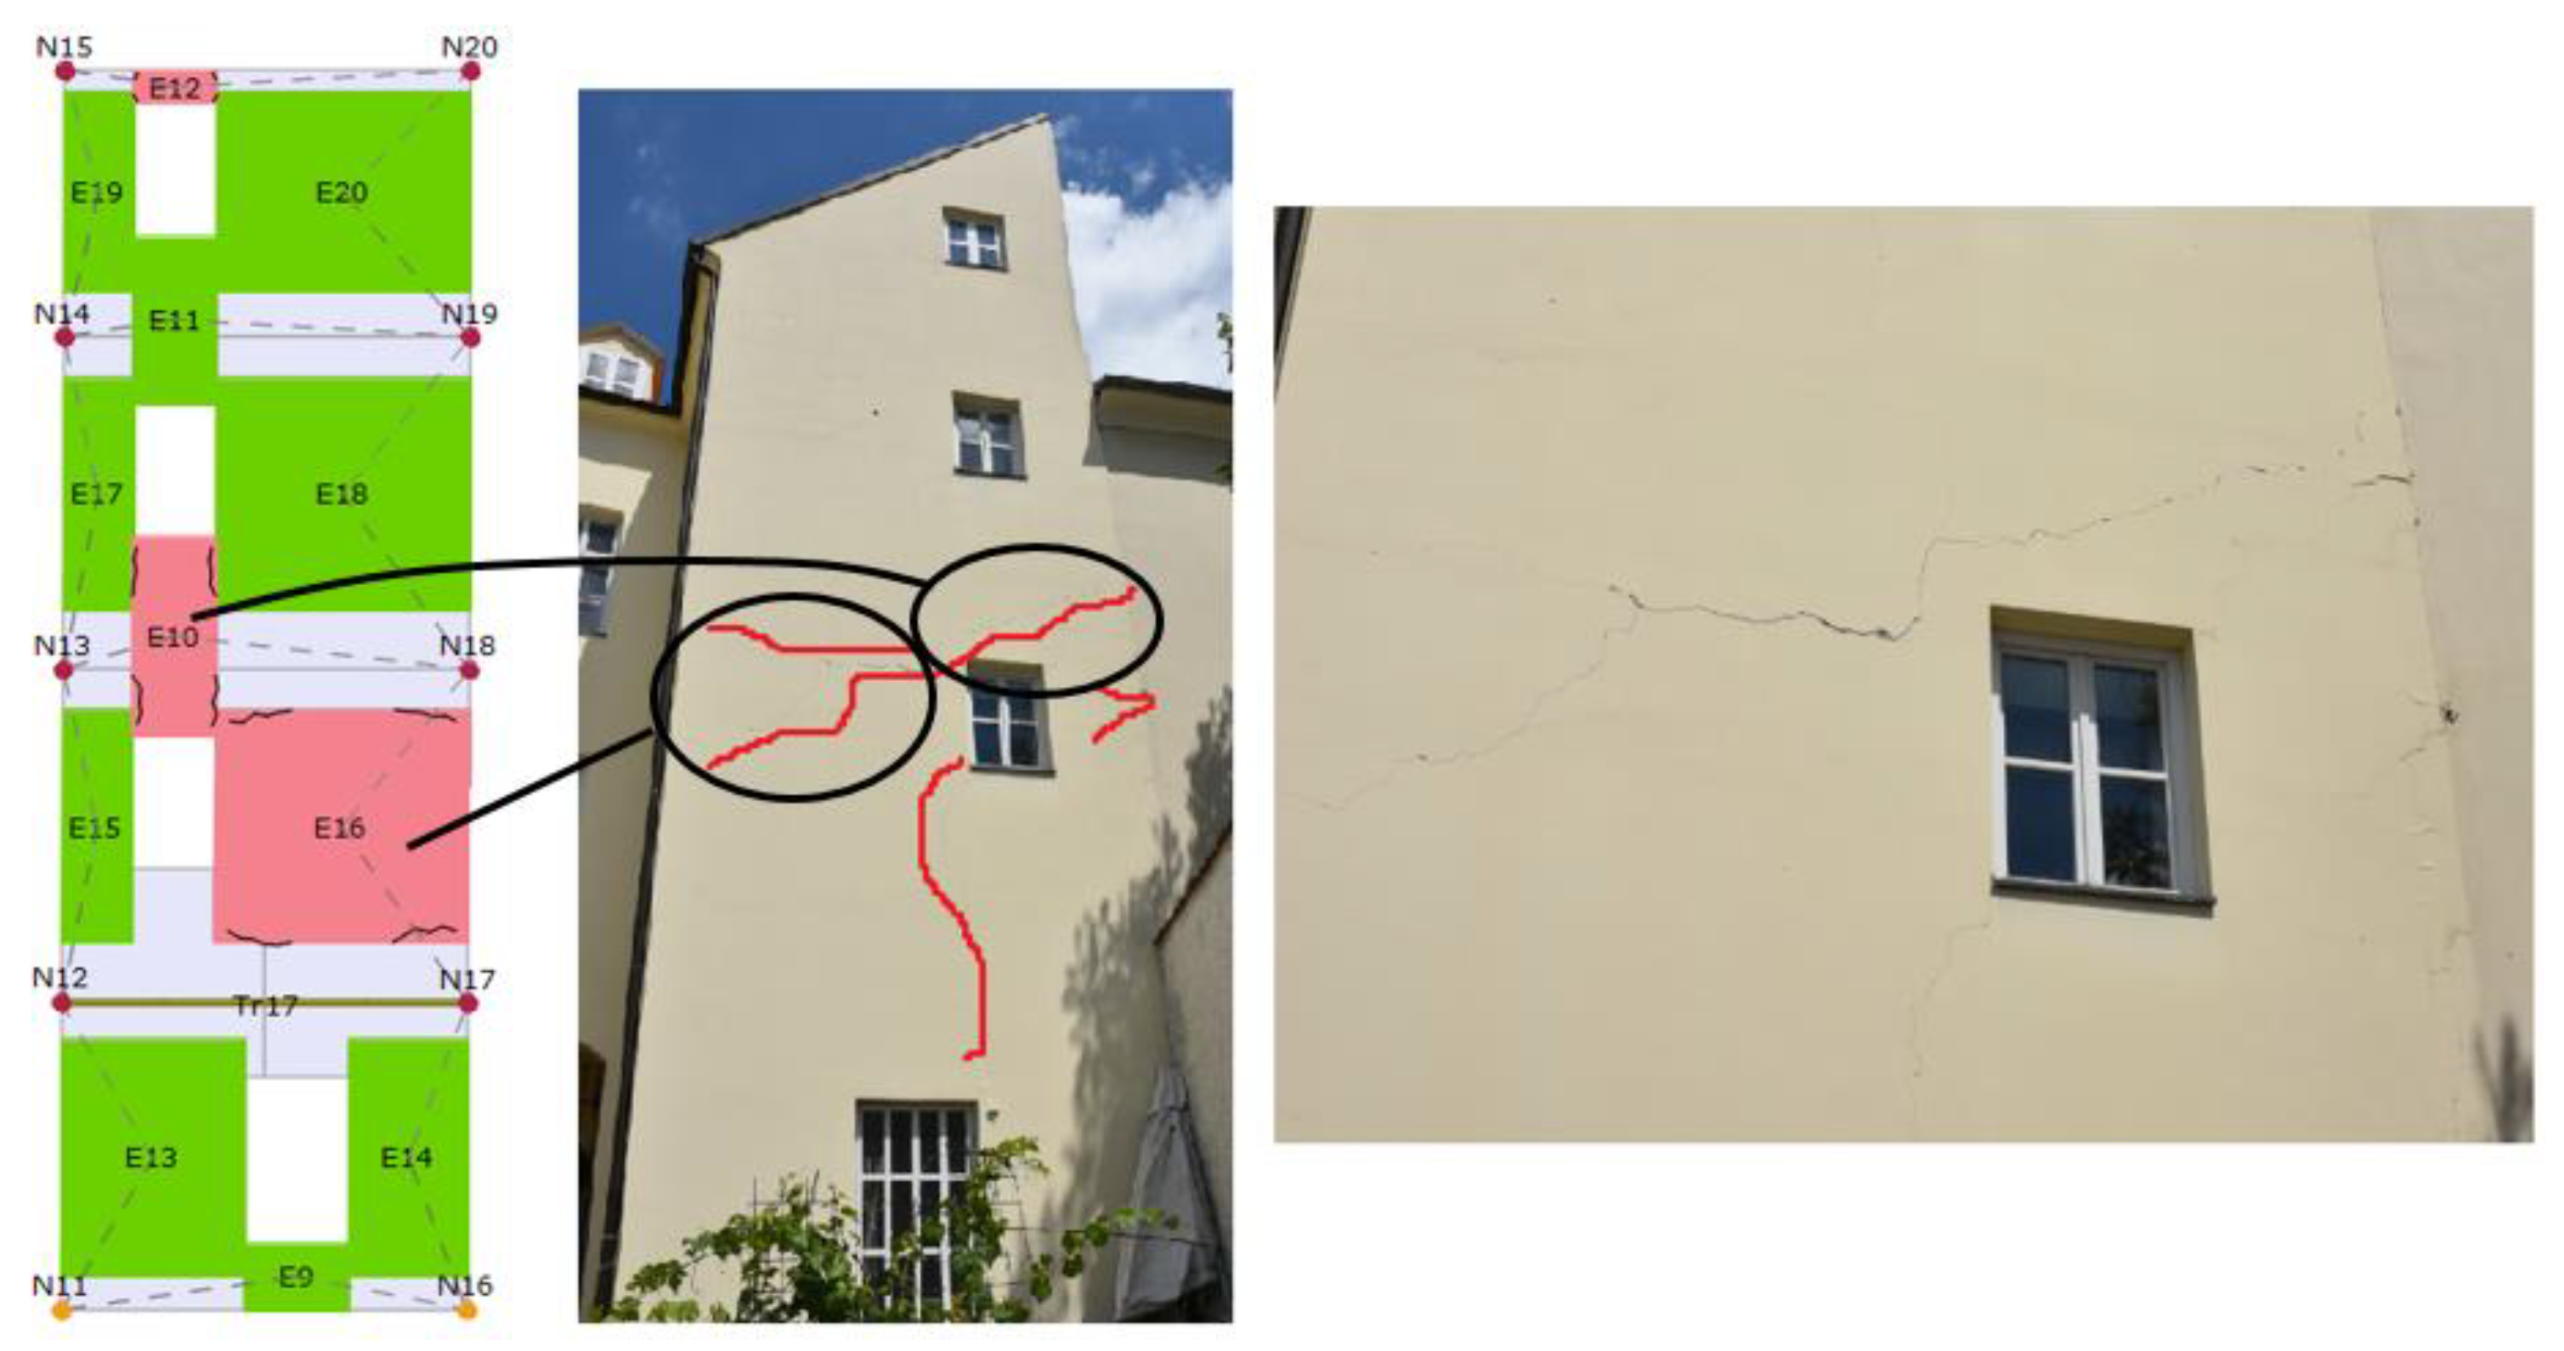
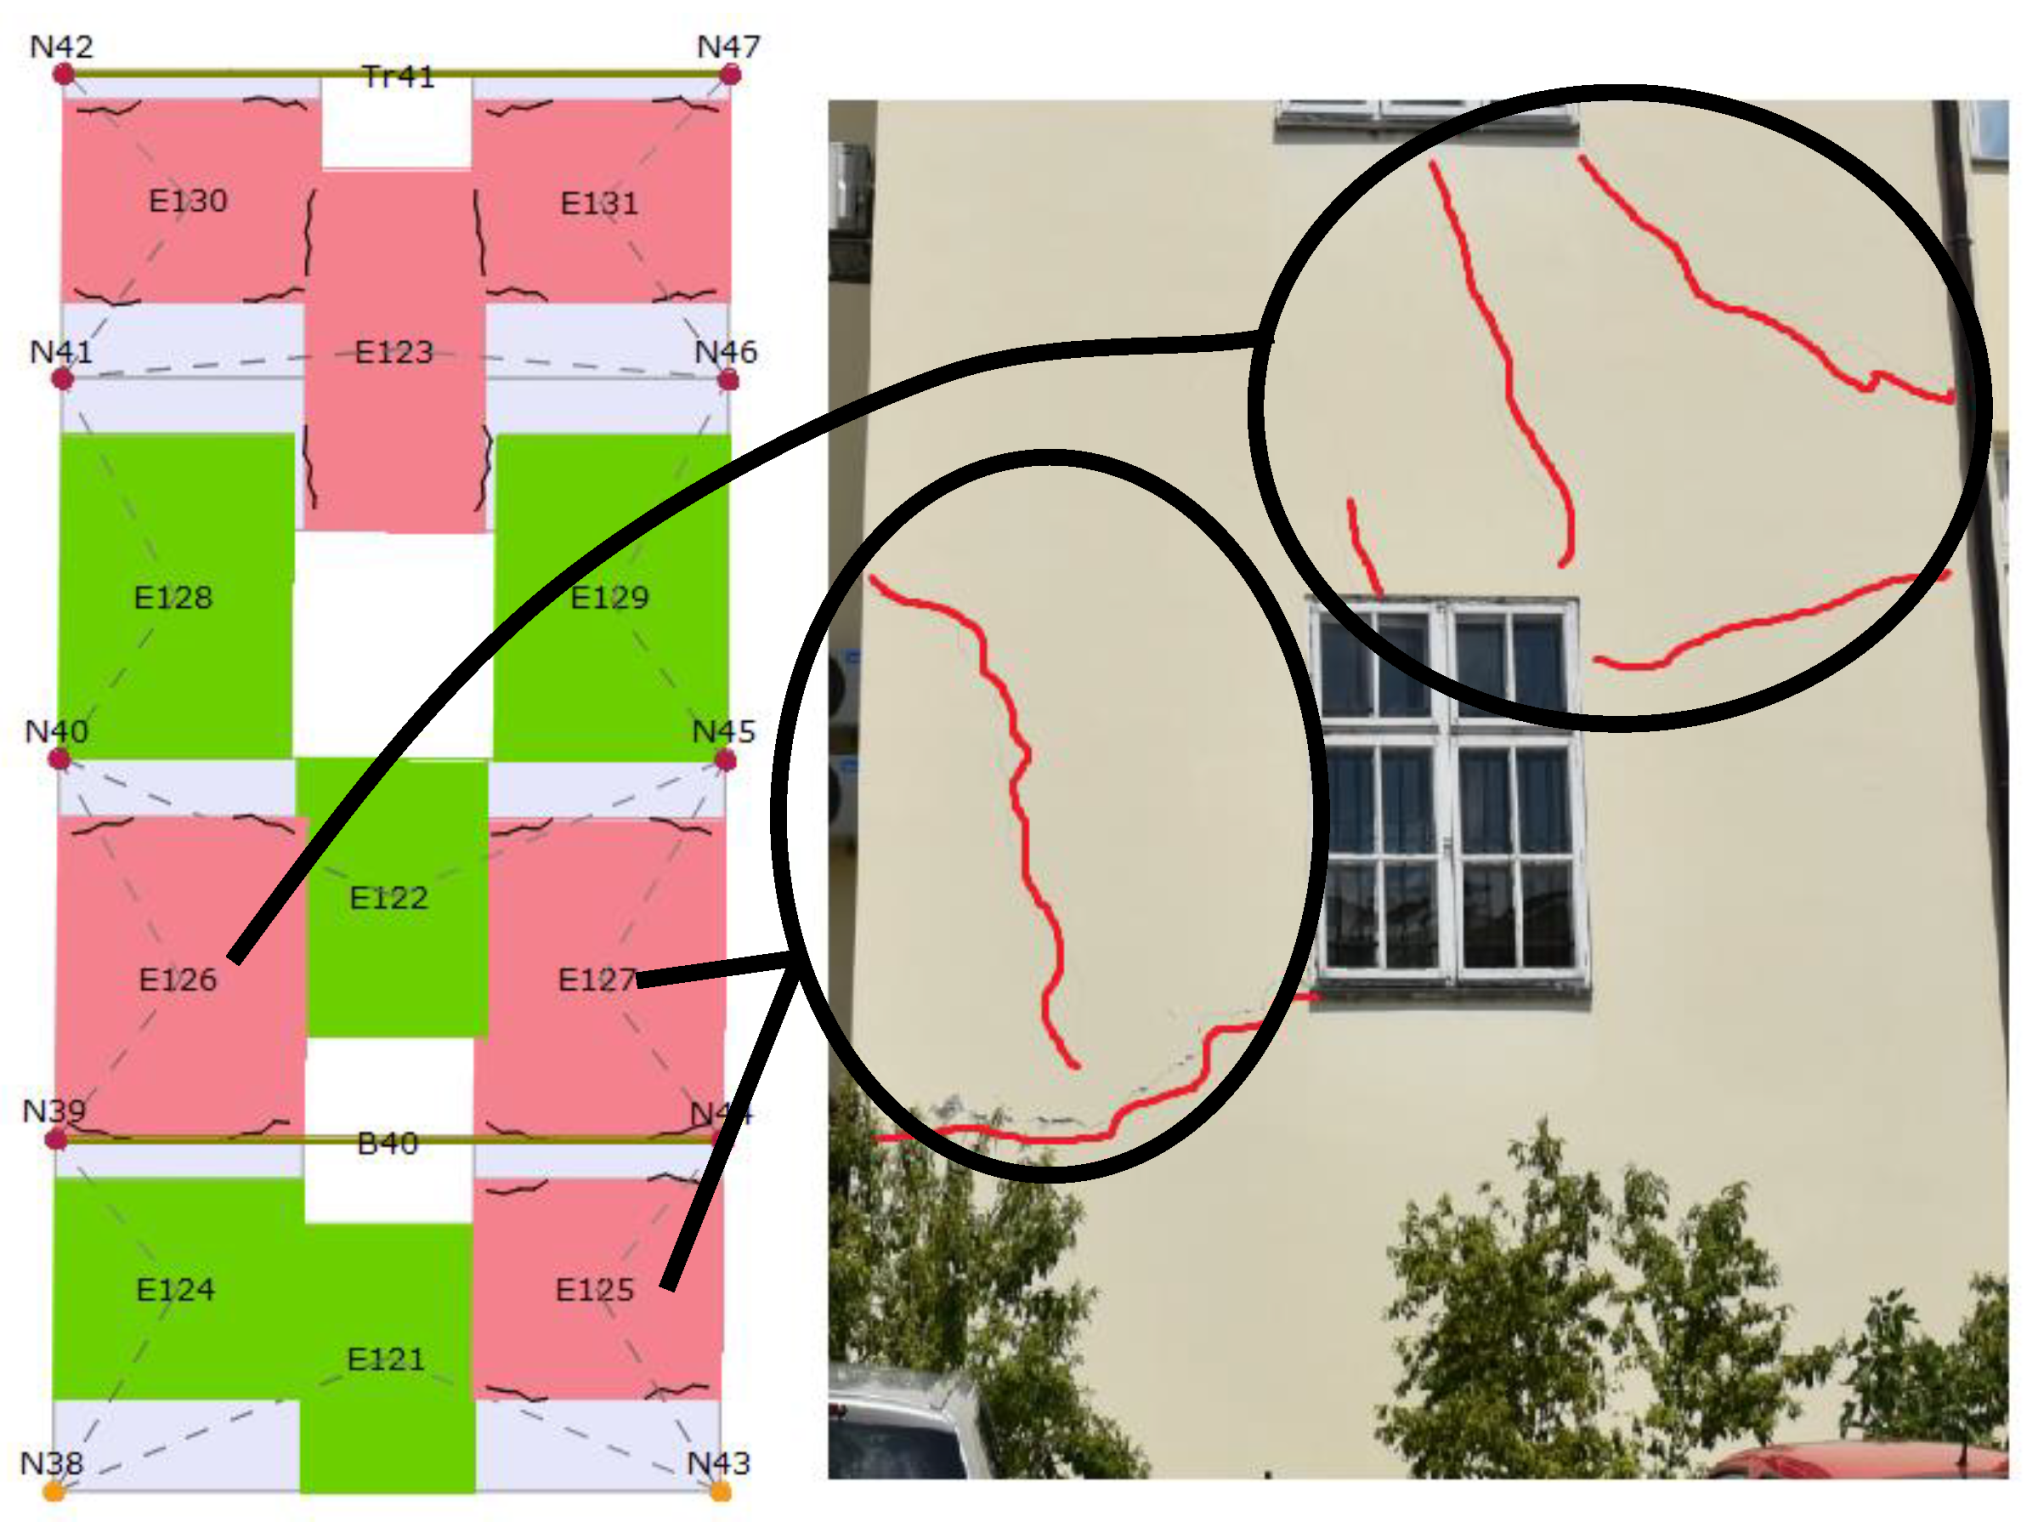
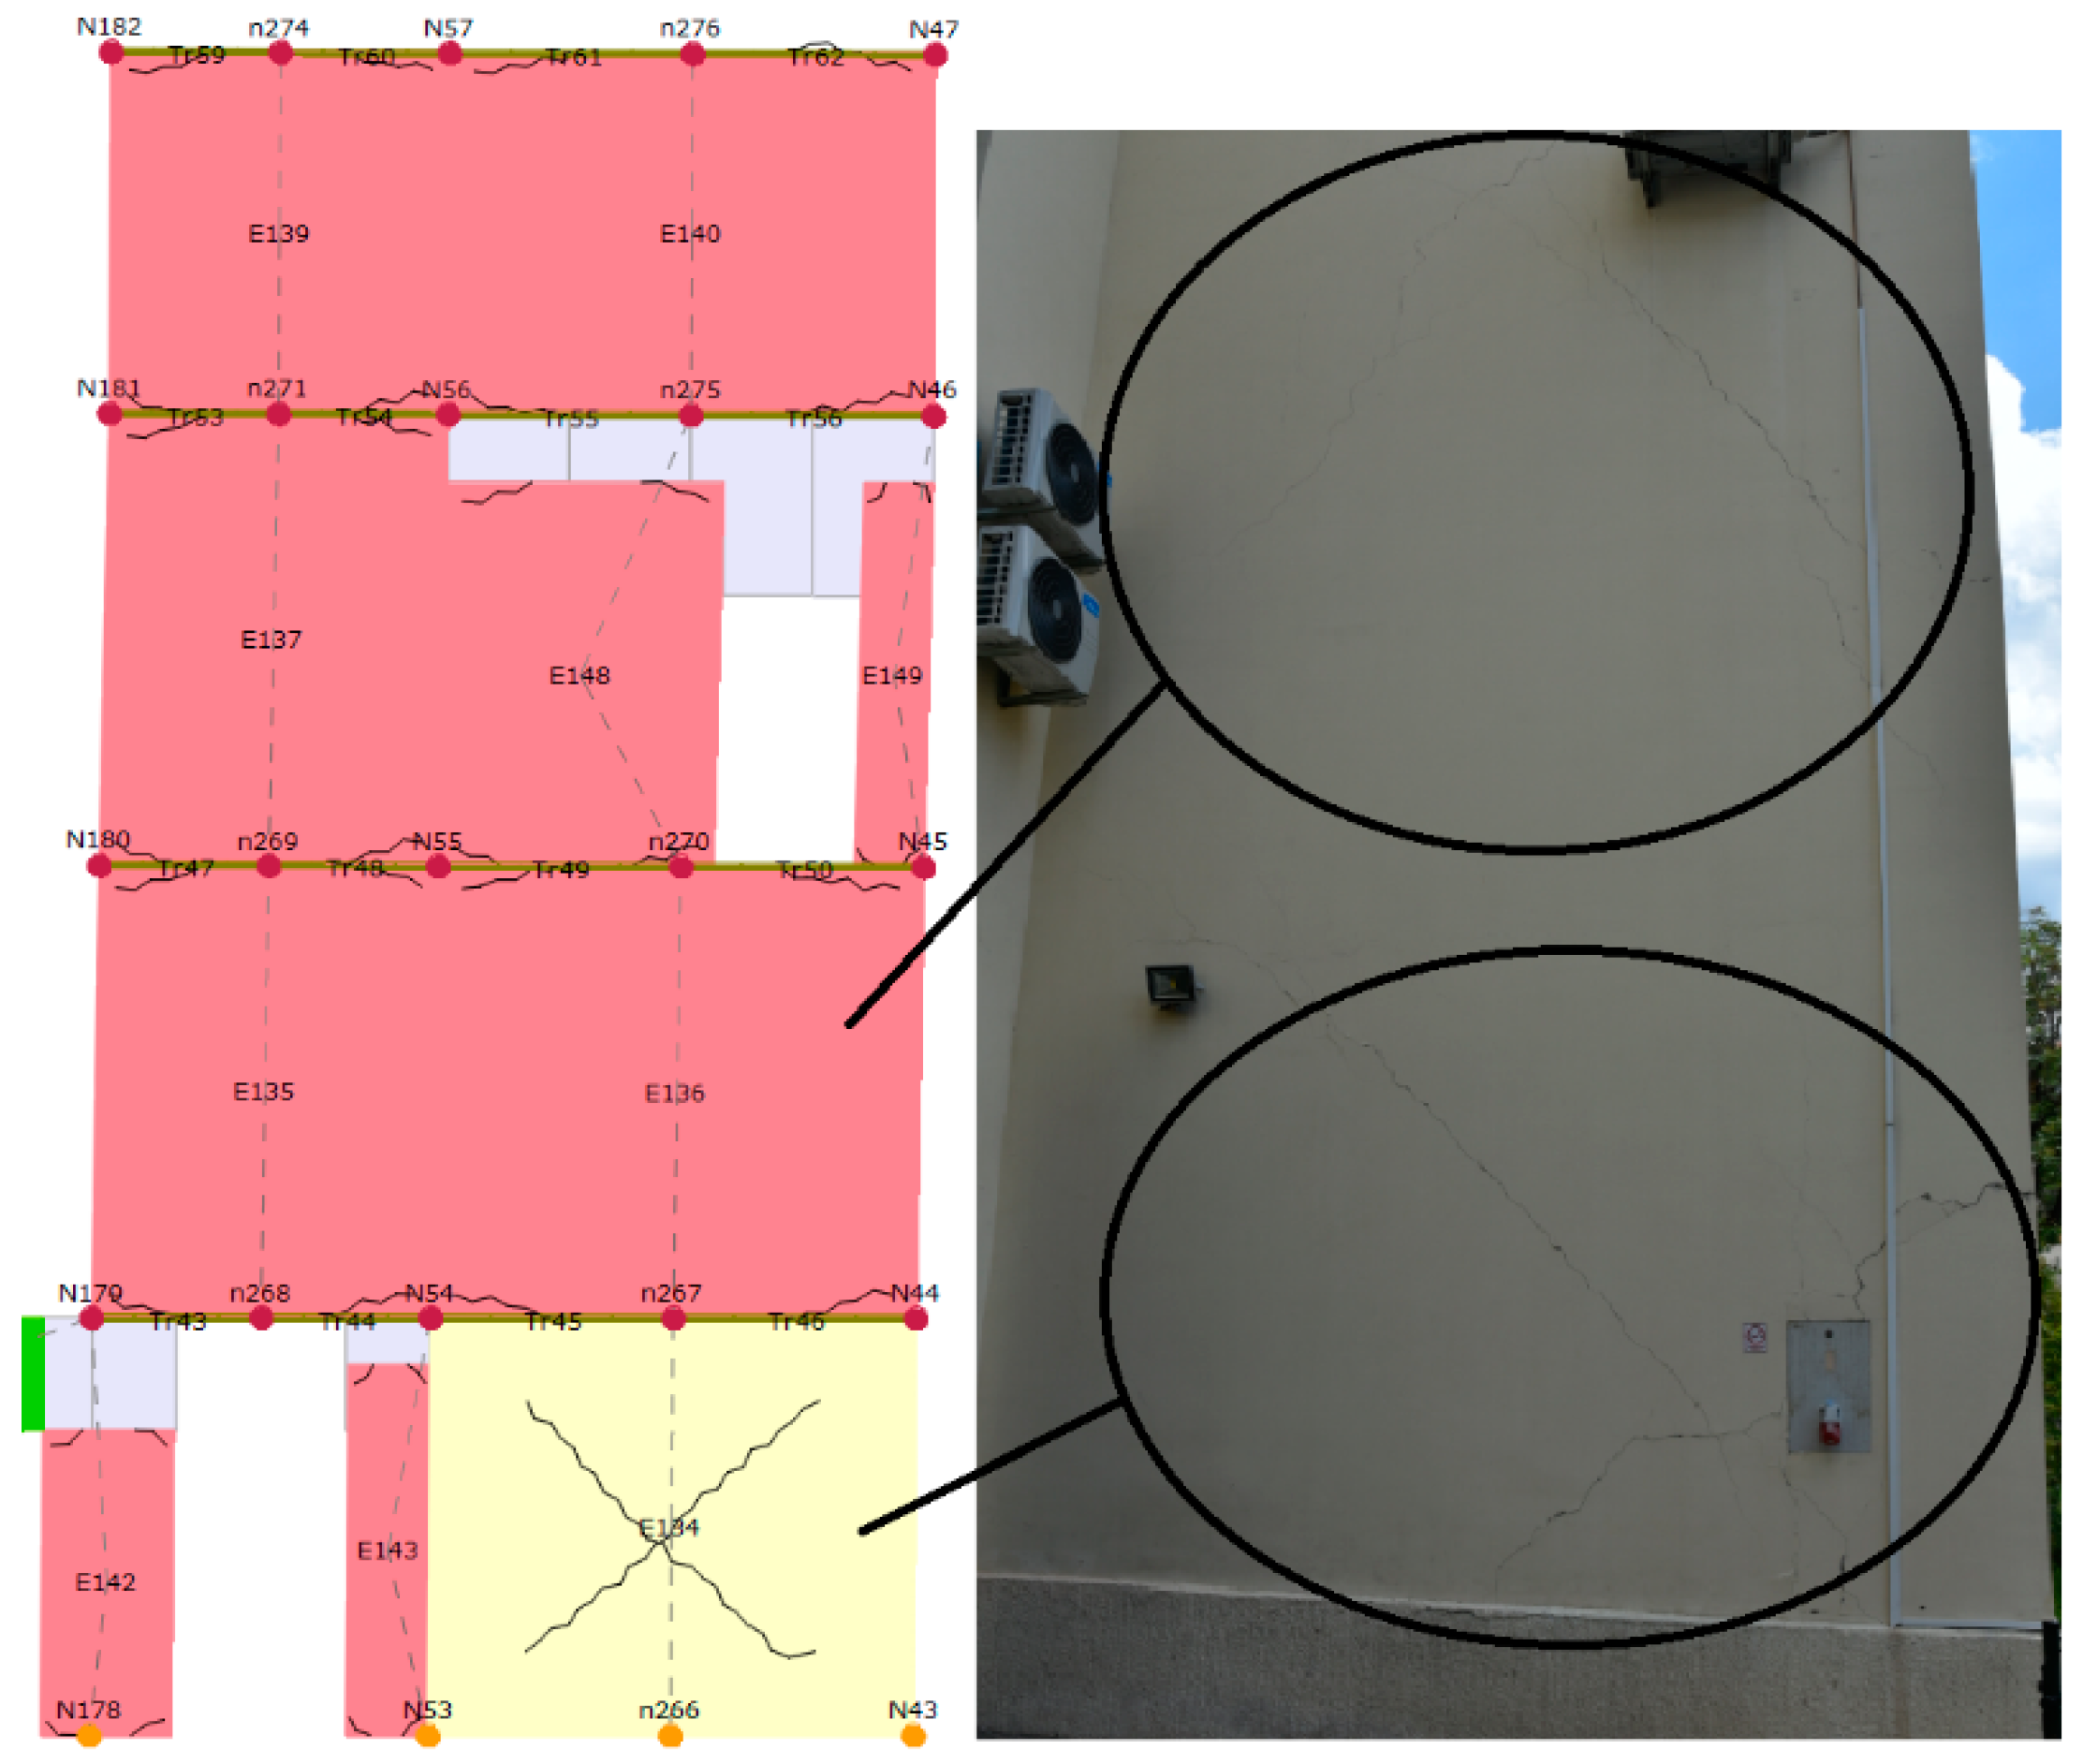
3.2. Rapid Preliminary Assessment Results
- Separation and local decay of plaster;
- Minor local damage is visible on structural elements (walls, columns, arches);
- In the eastern part of the building, diagonal cracks are visible on the load-bearing walls.
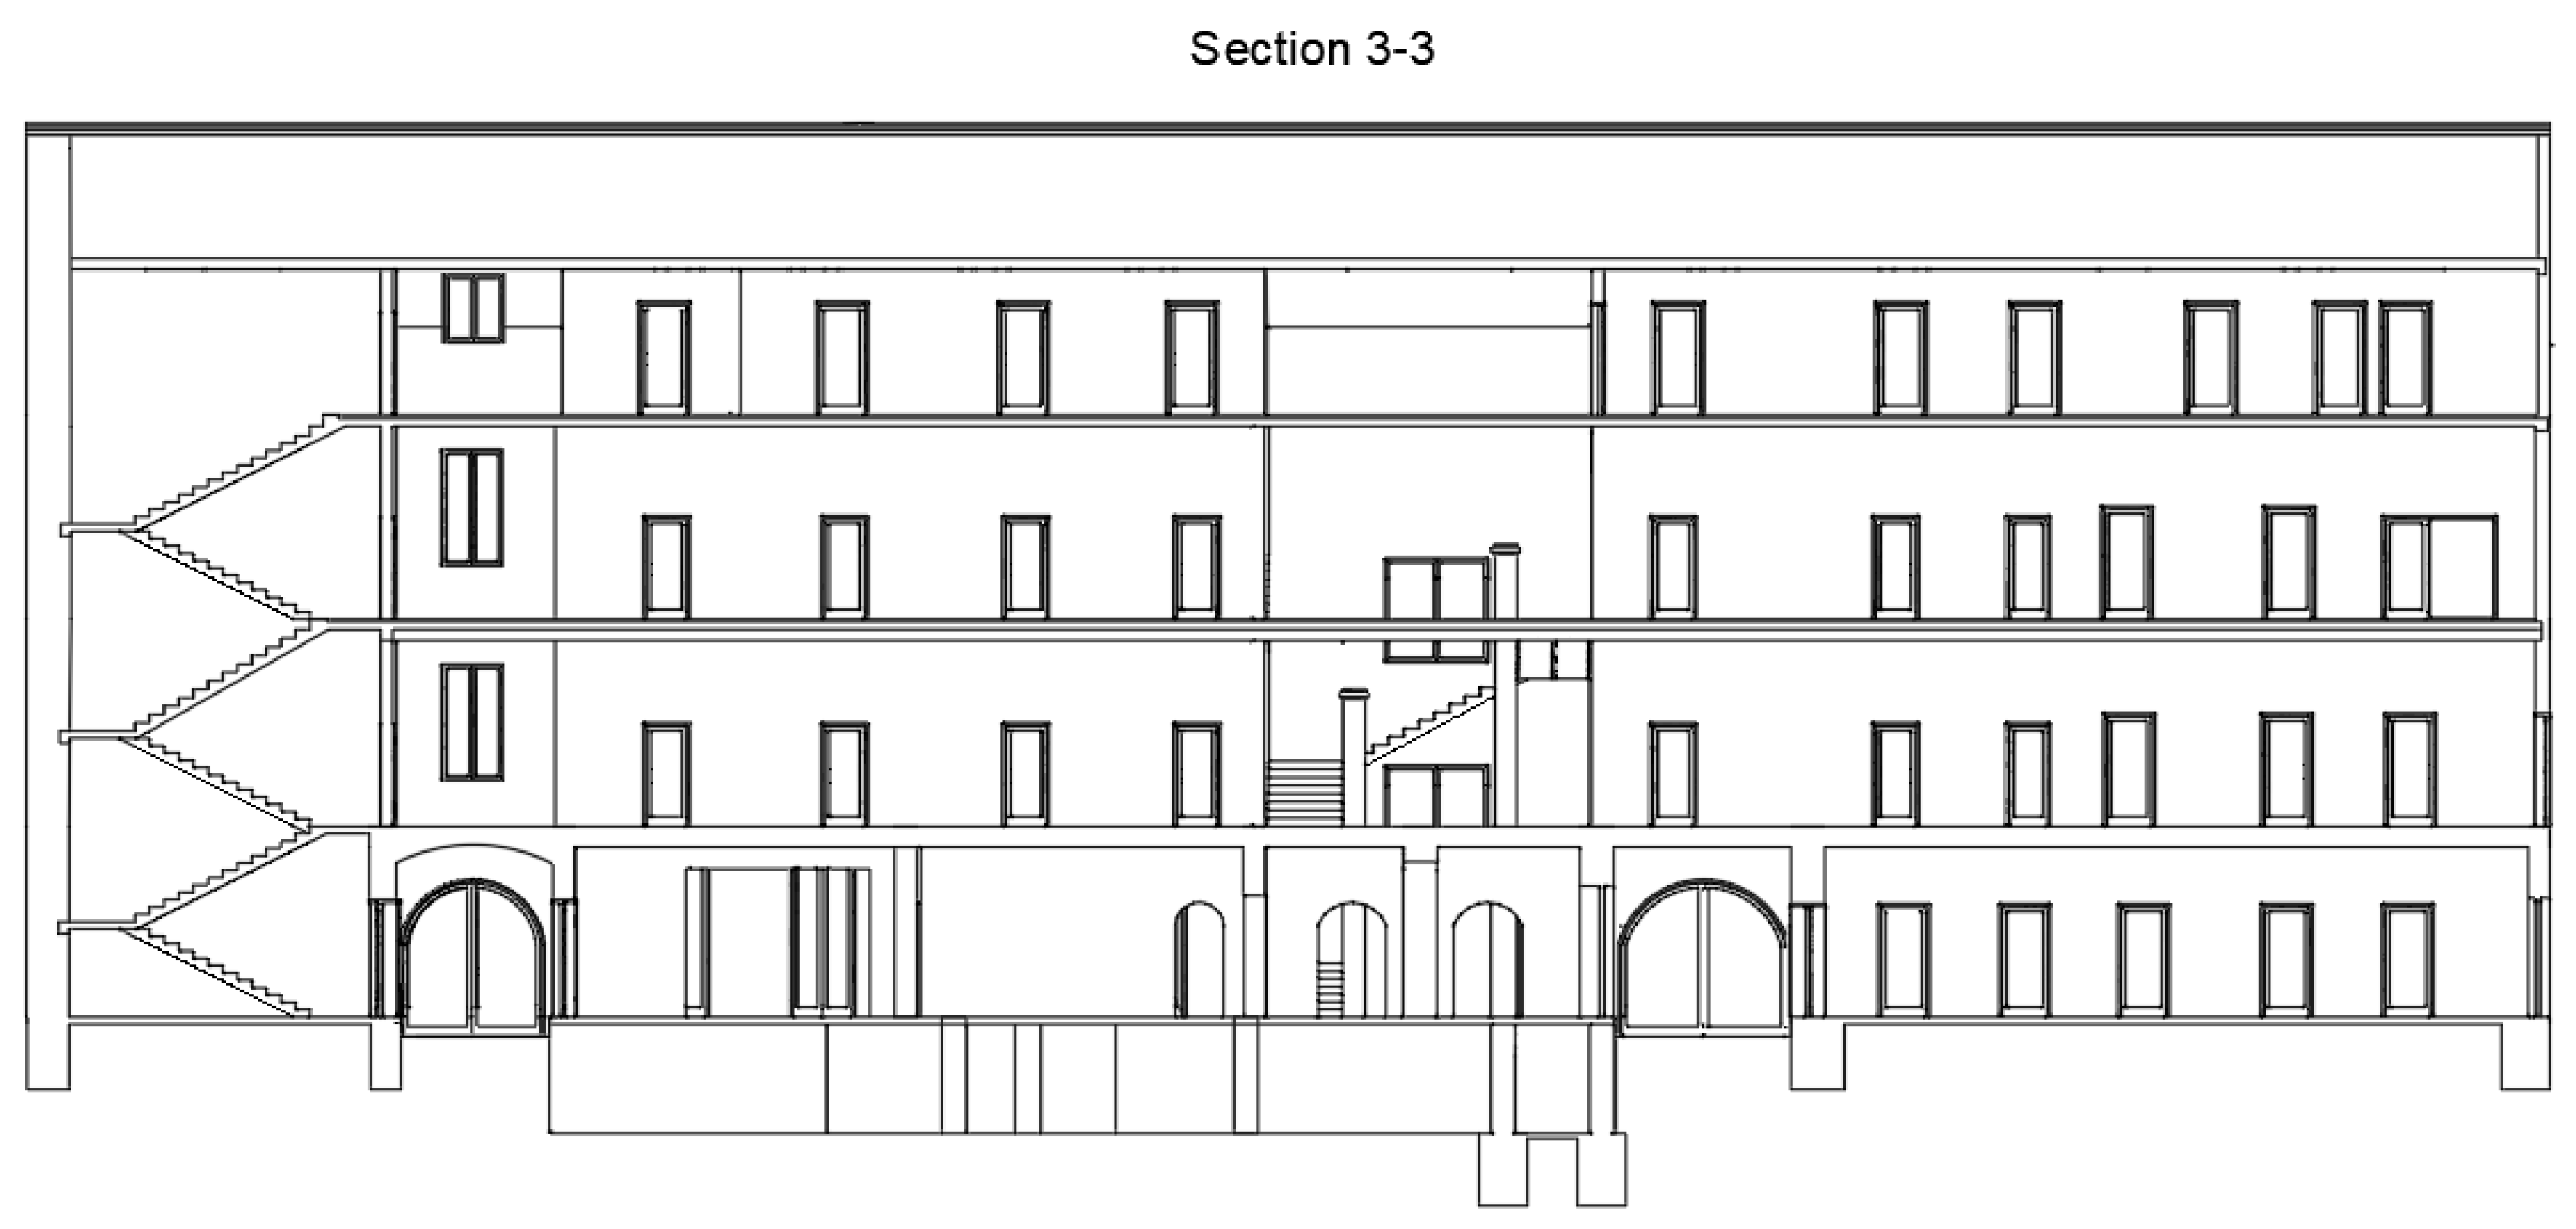
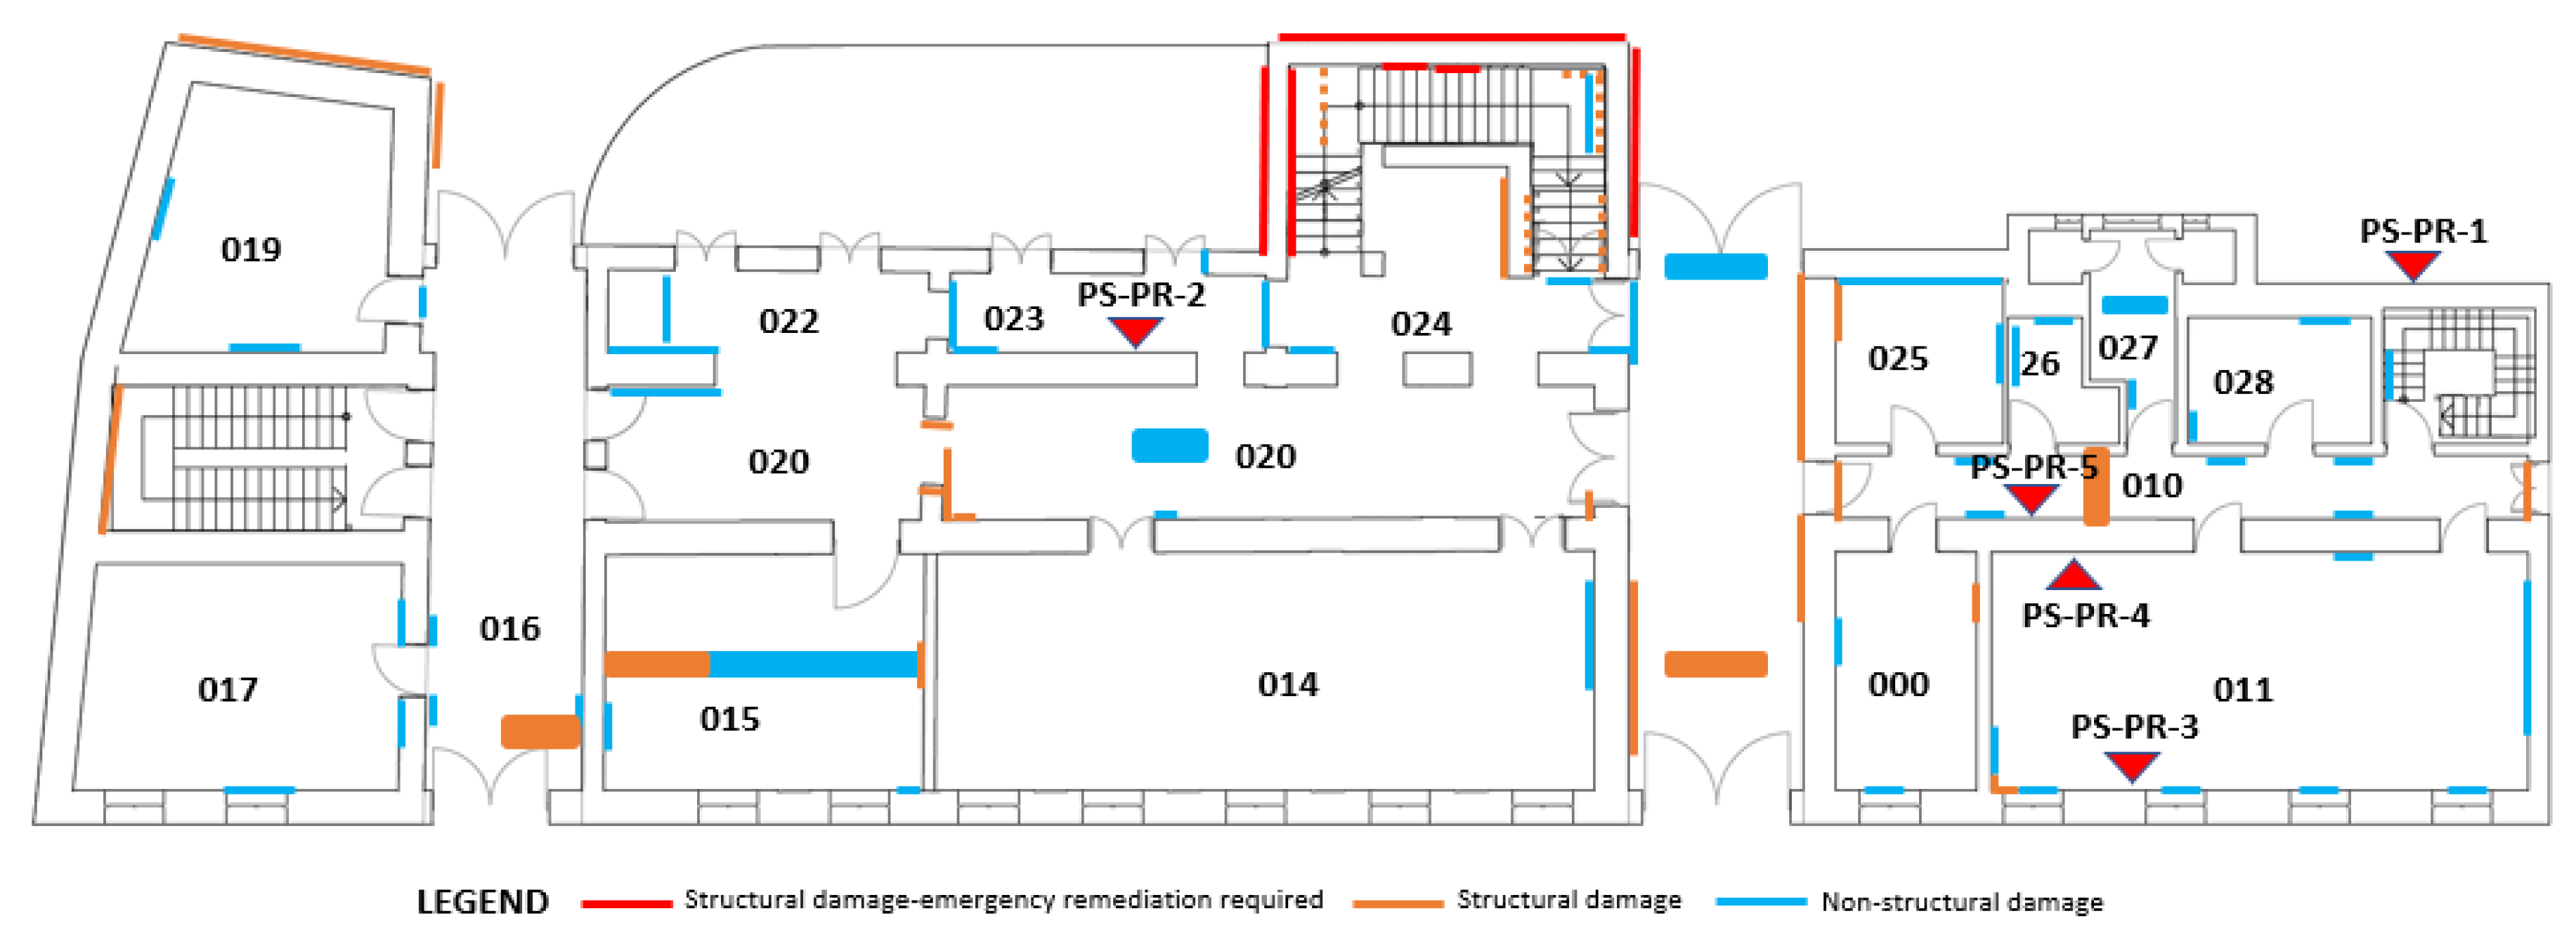
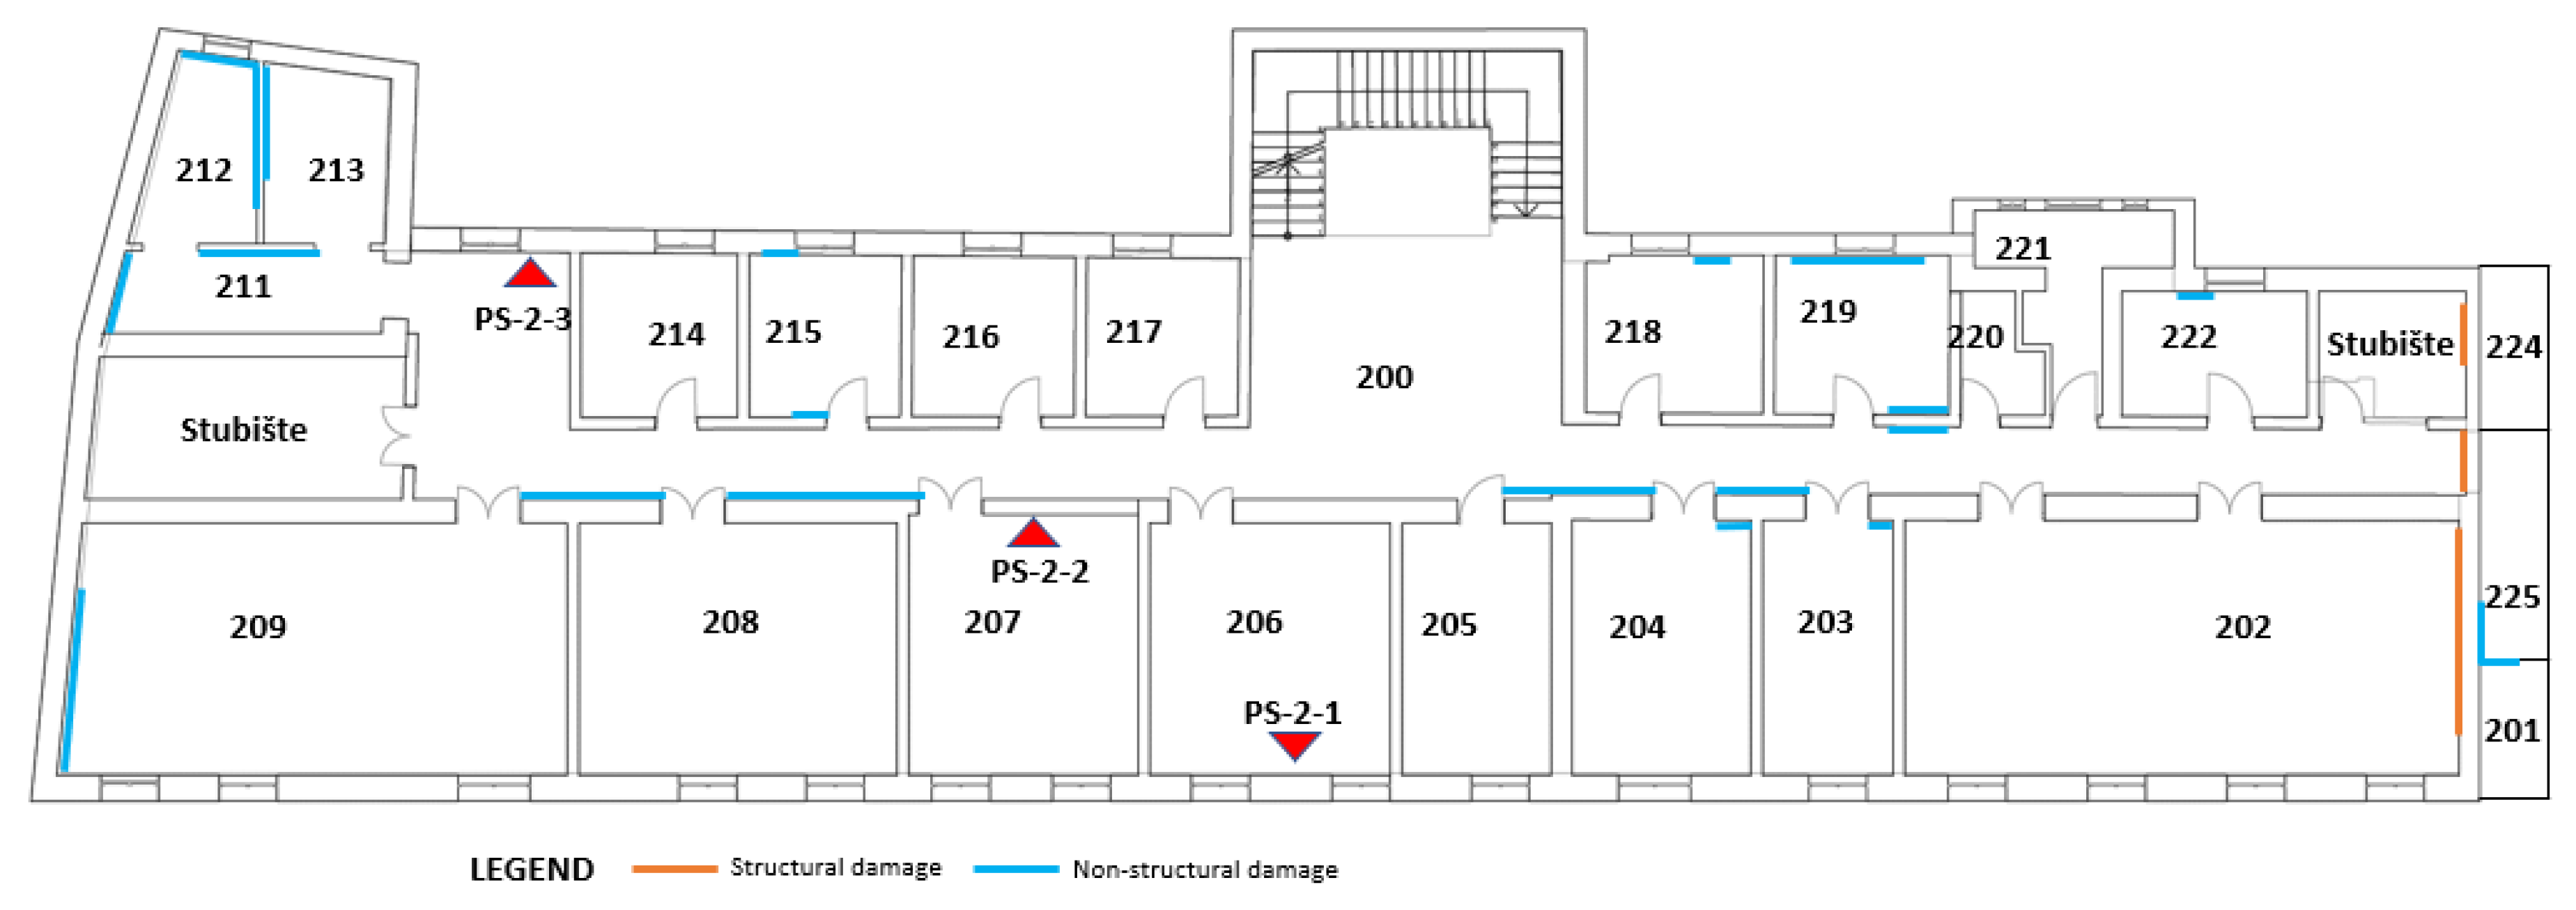
3.3. Detailed Assessment Results
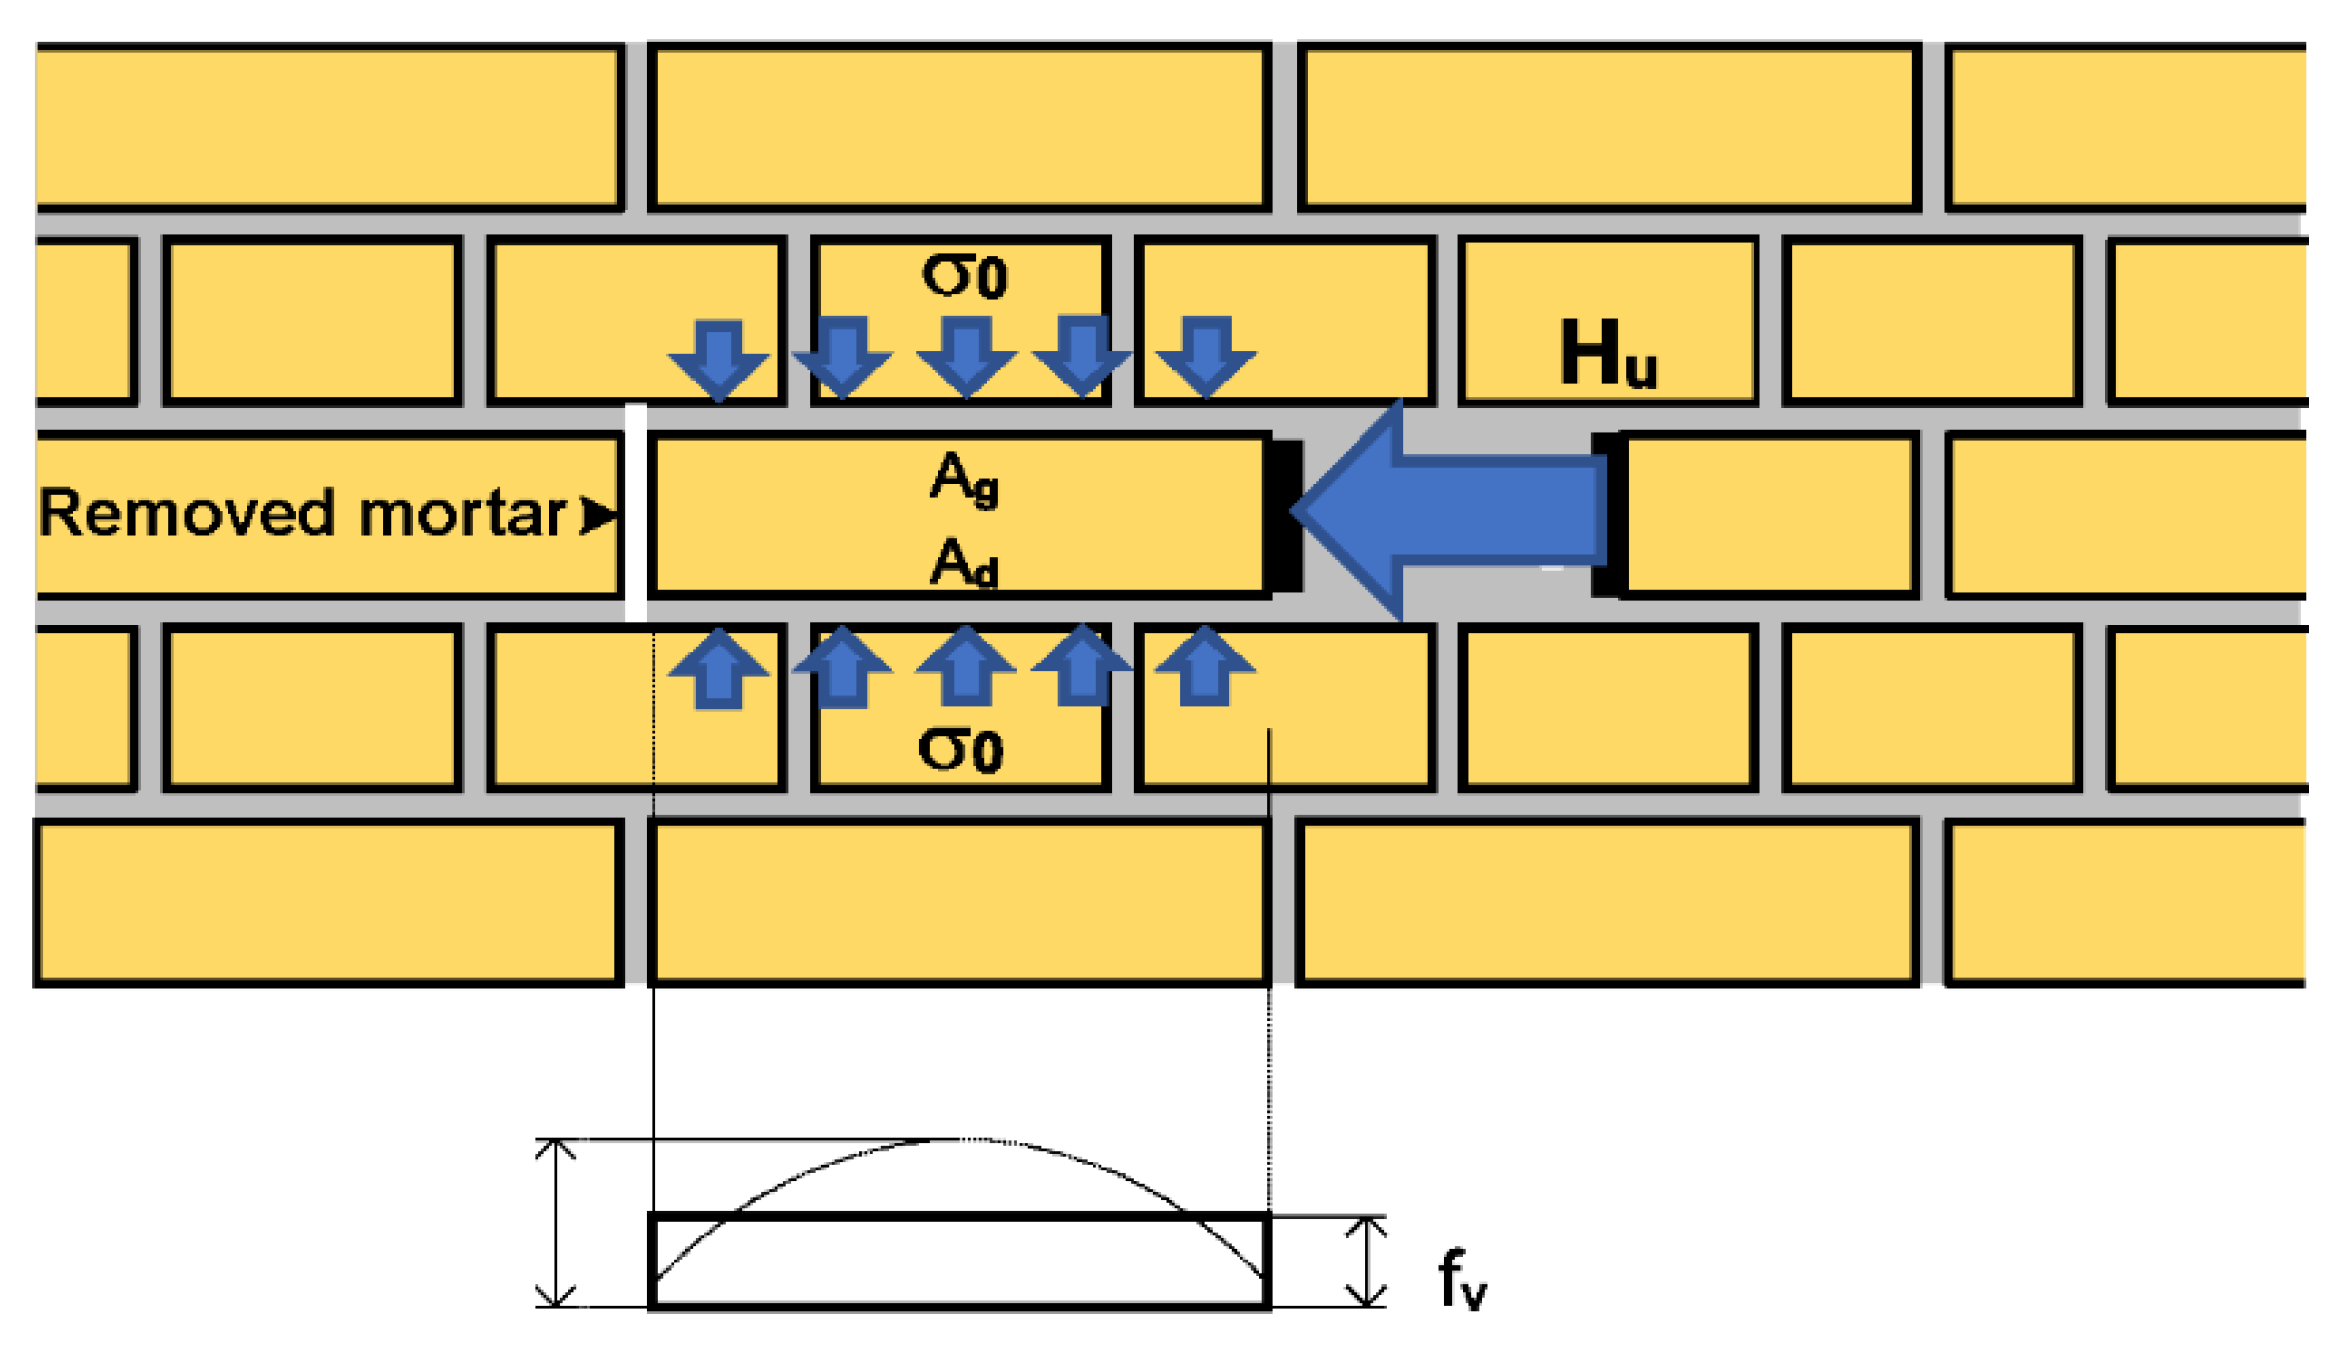
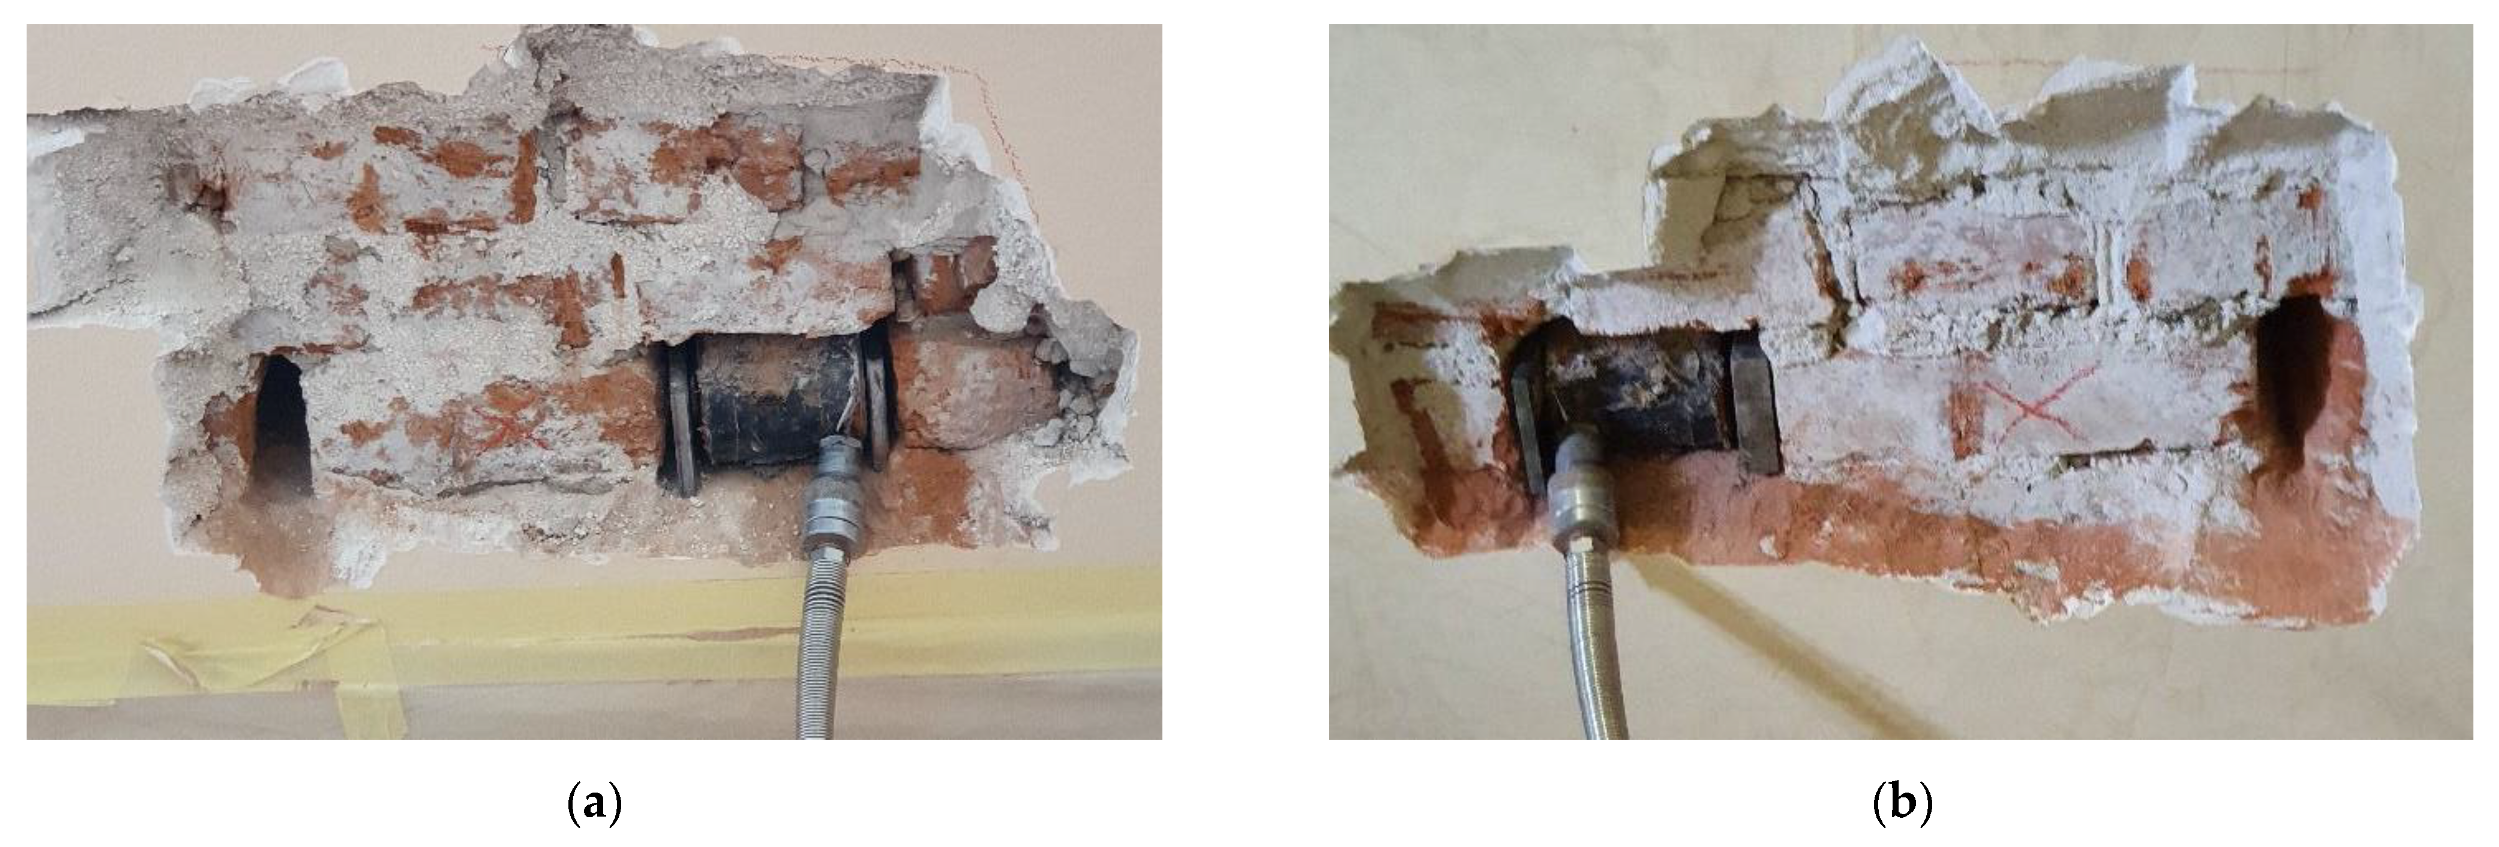
3.4. In Situ Masonry Shear Strength Tests
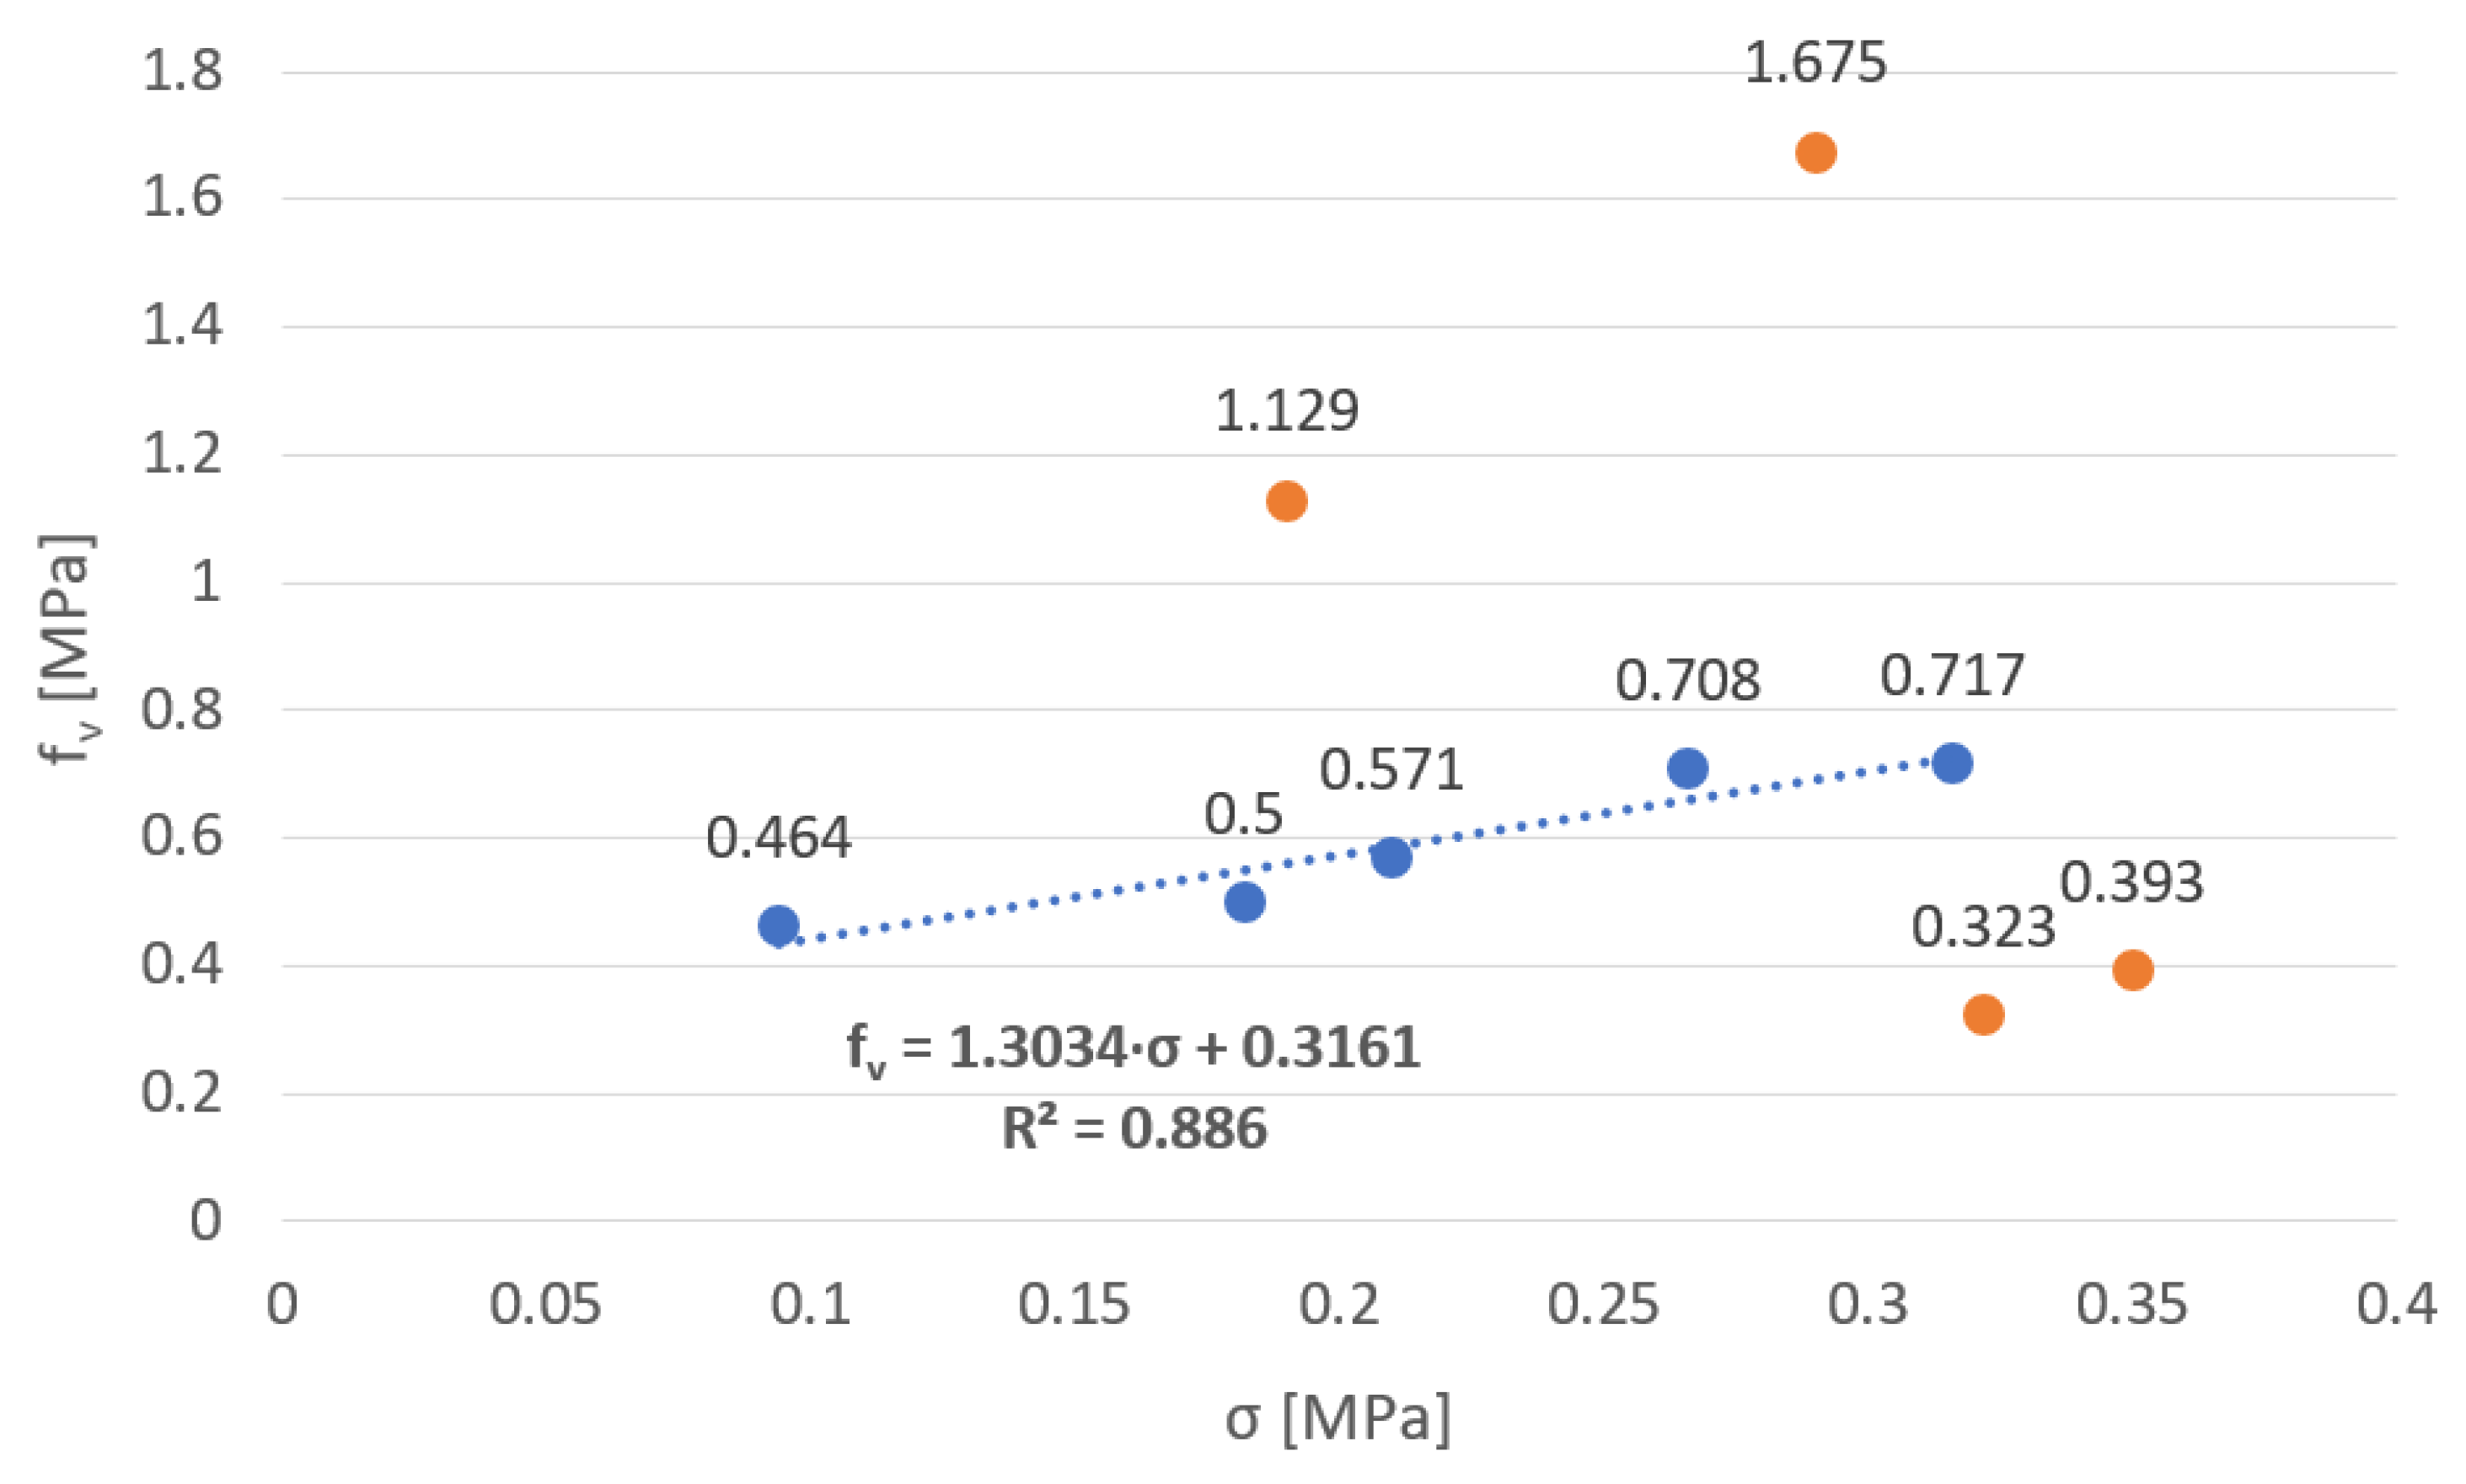
Results of the Shear Strength Tests
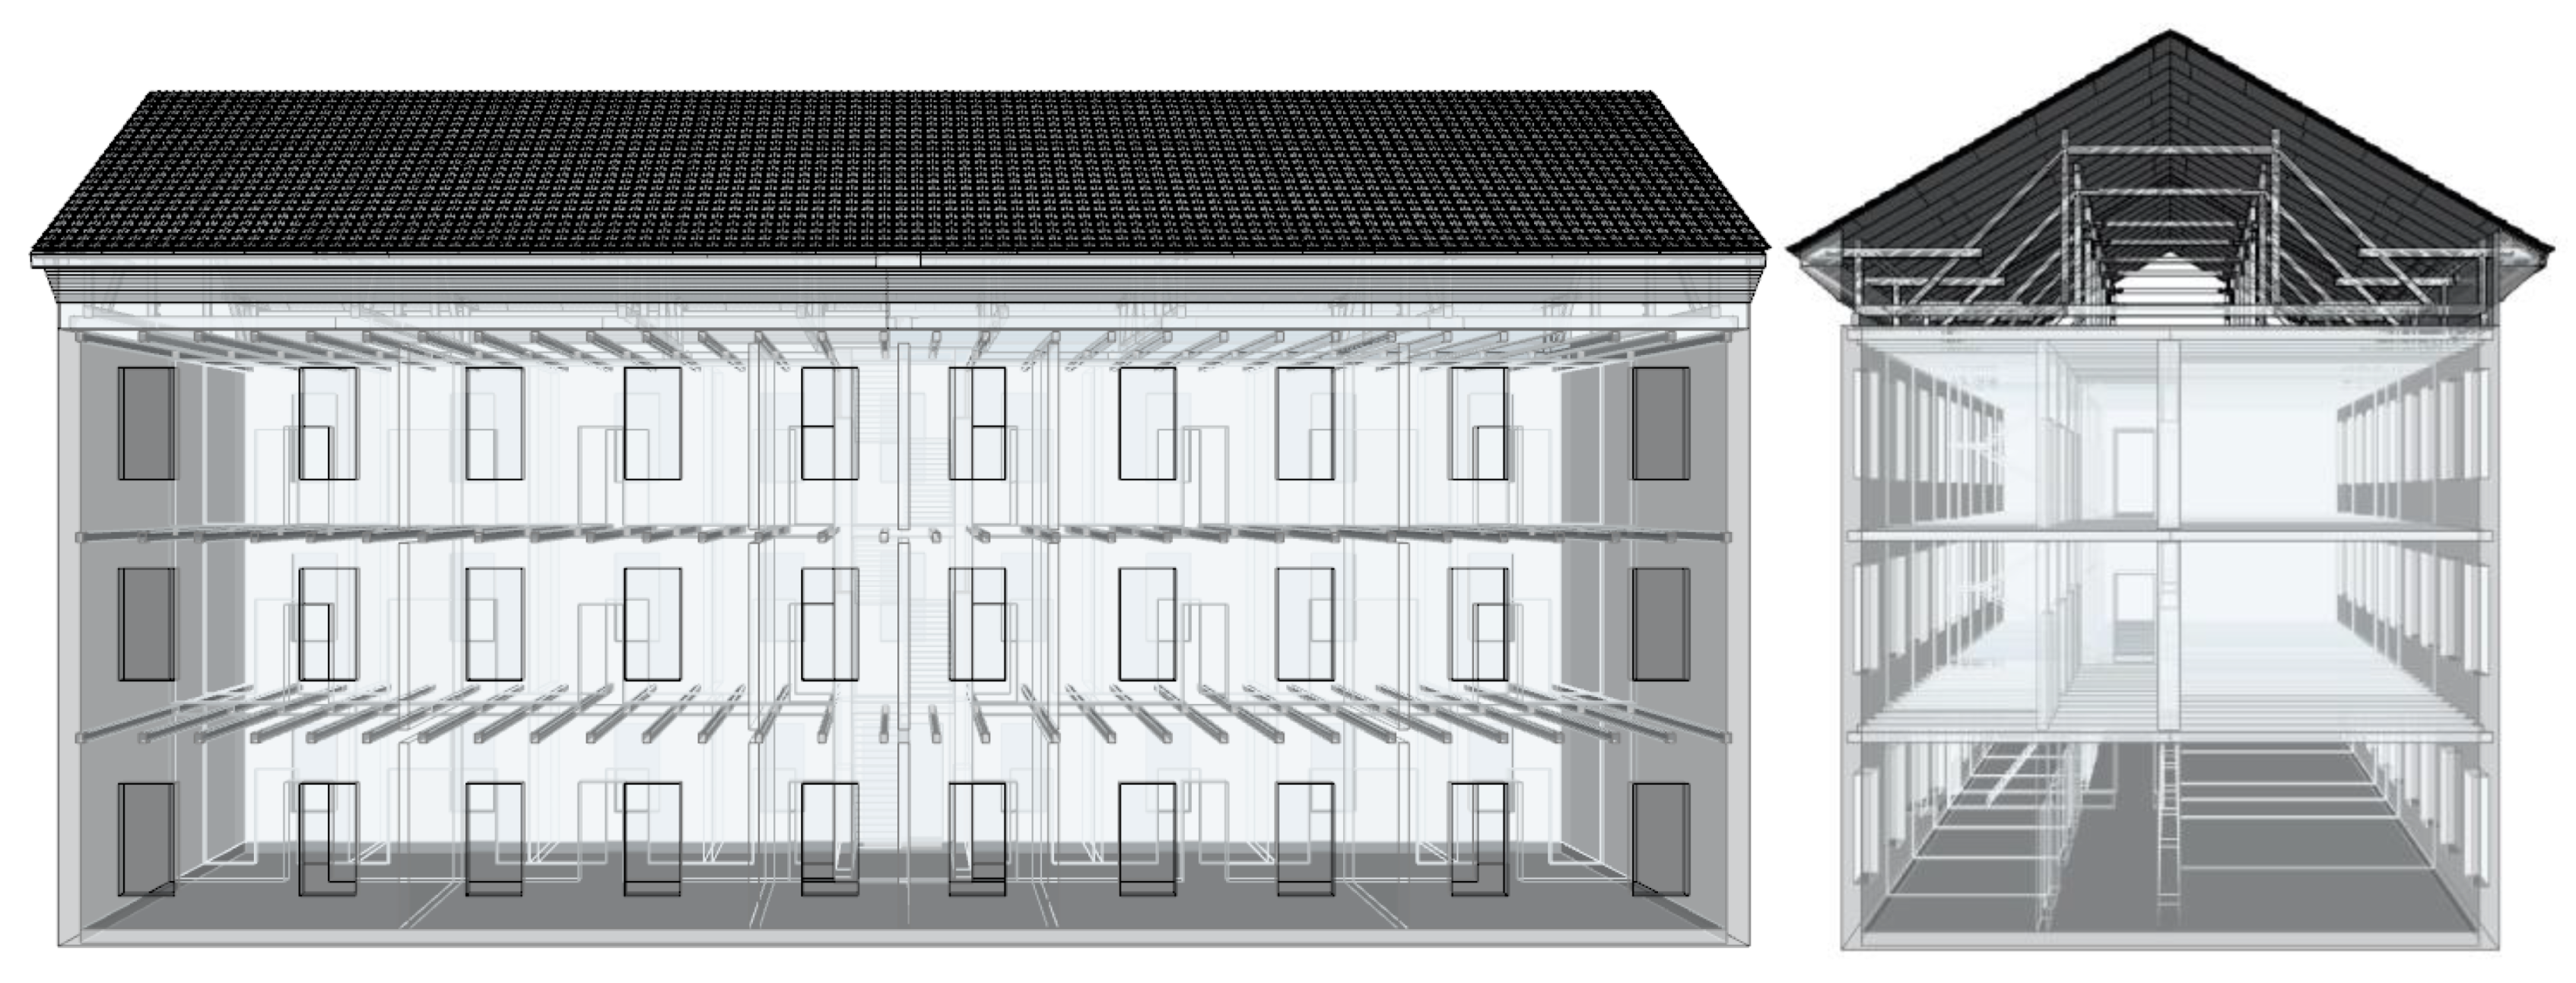
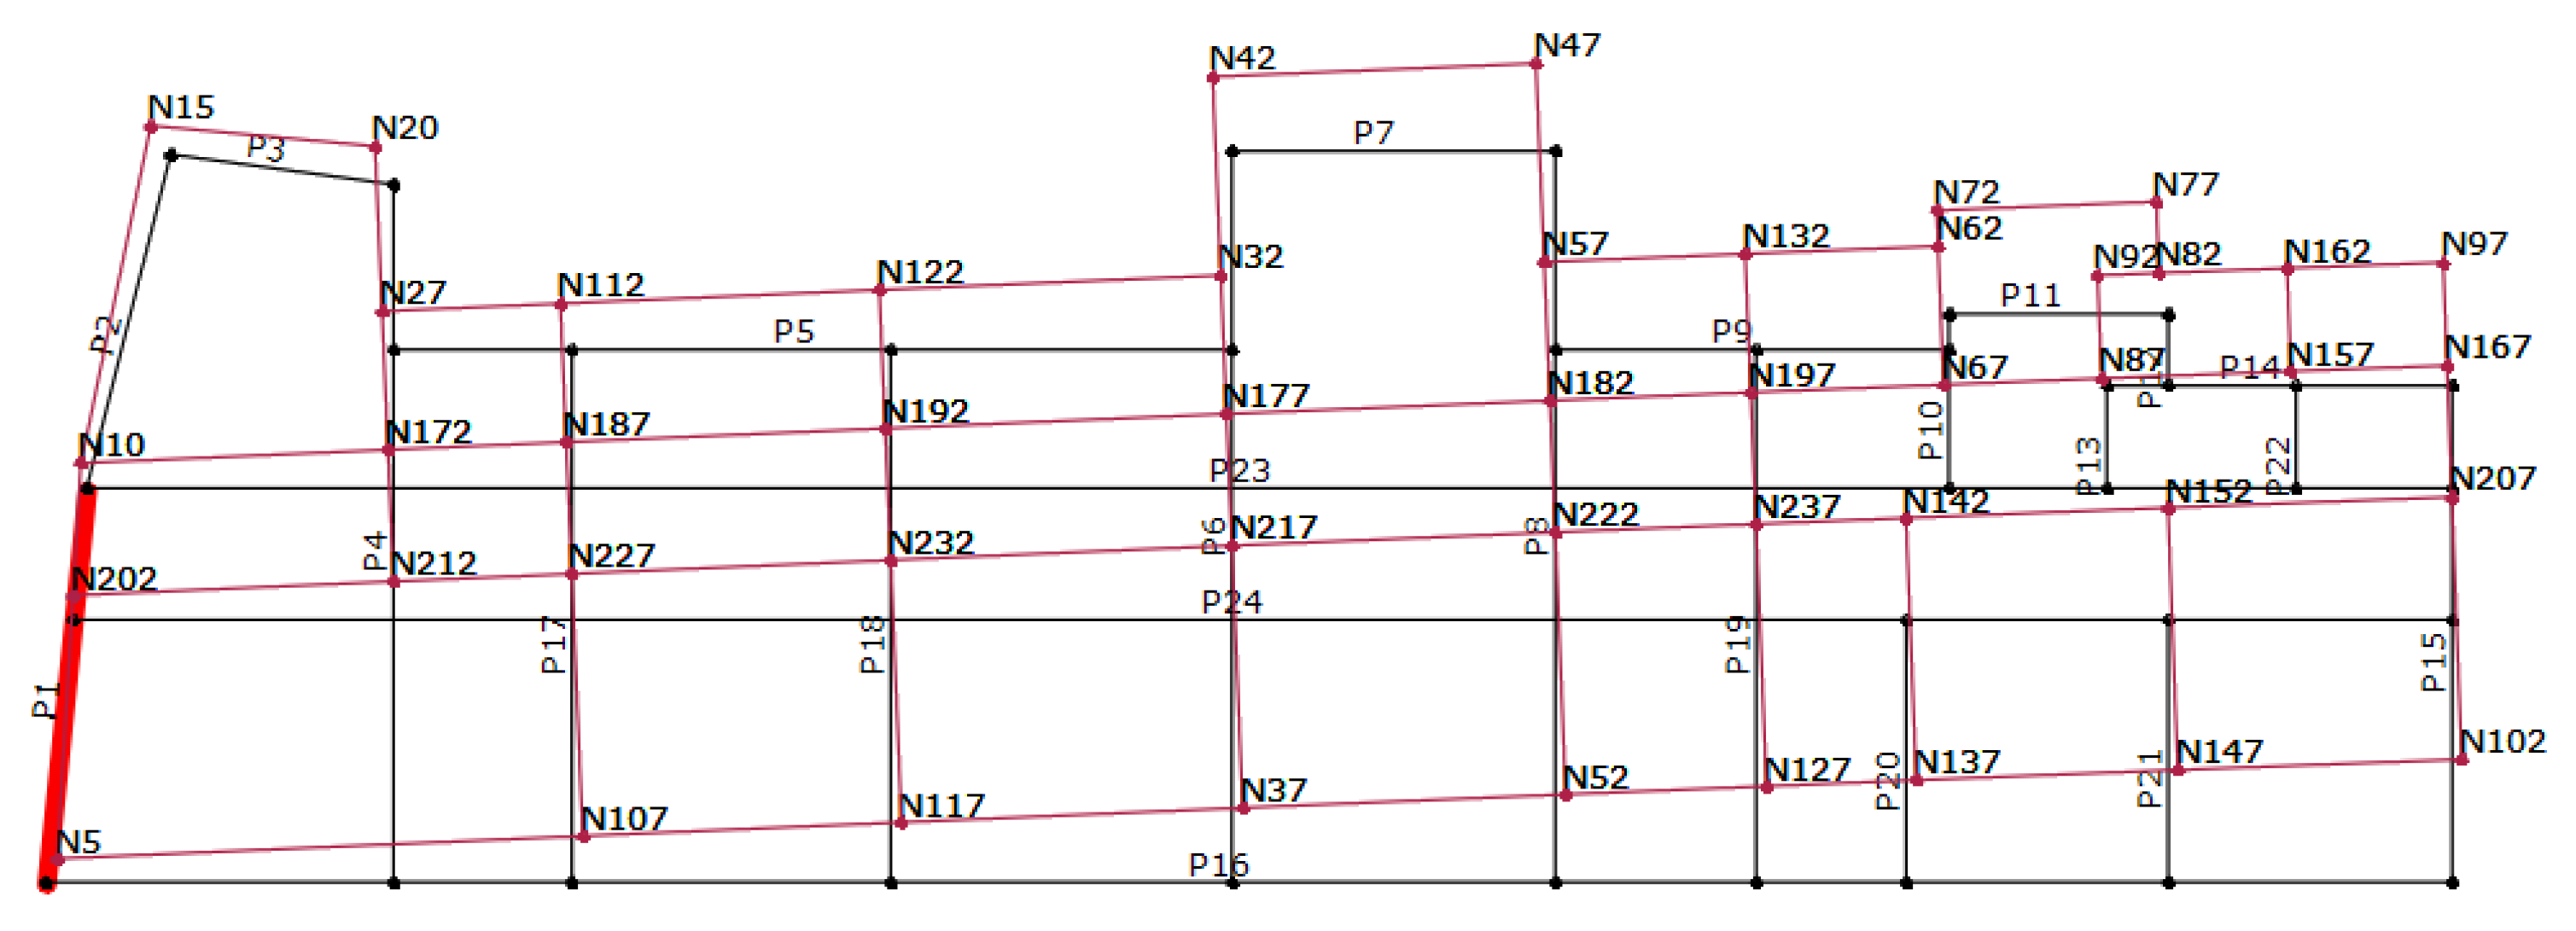
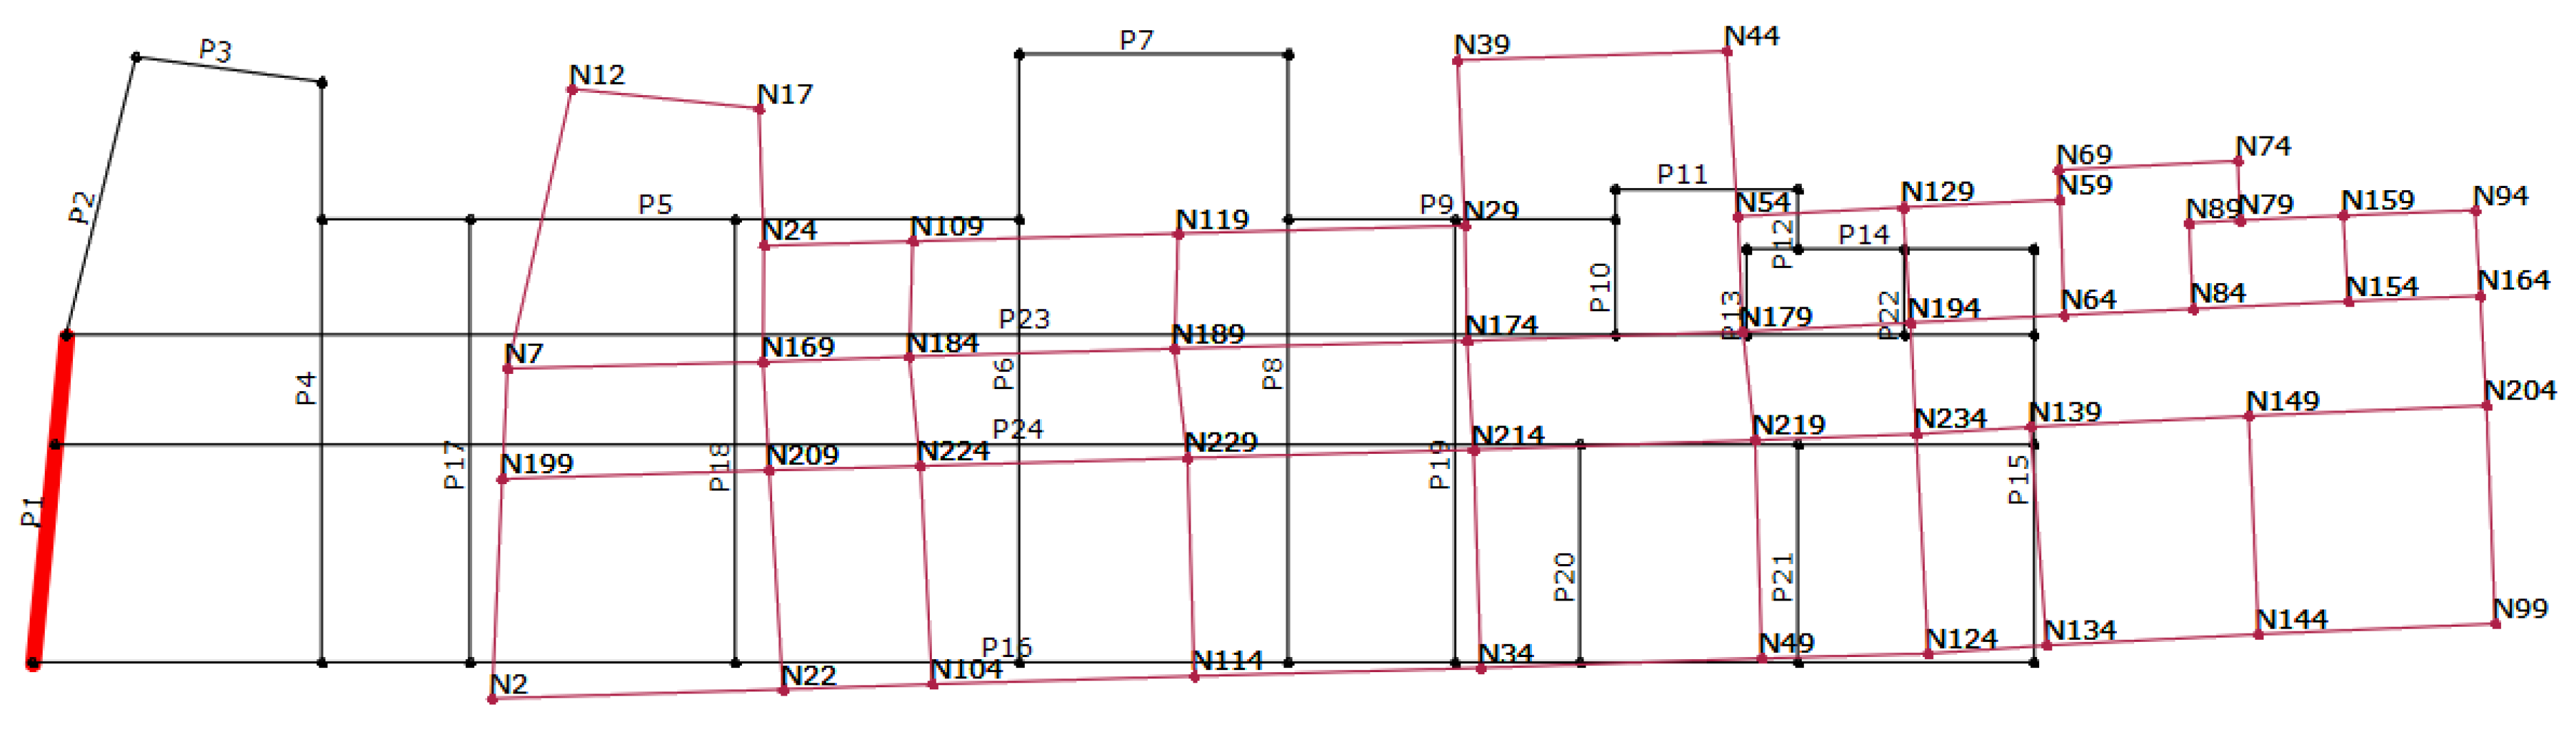
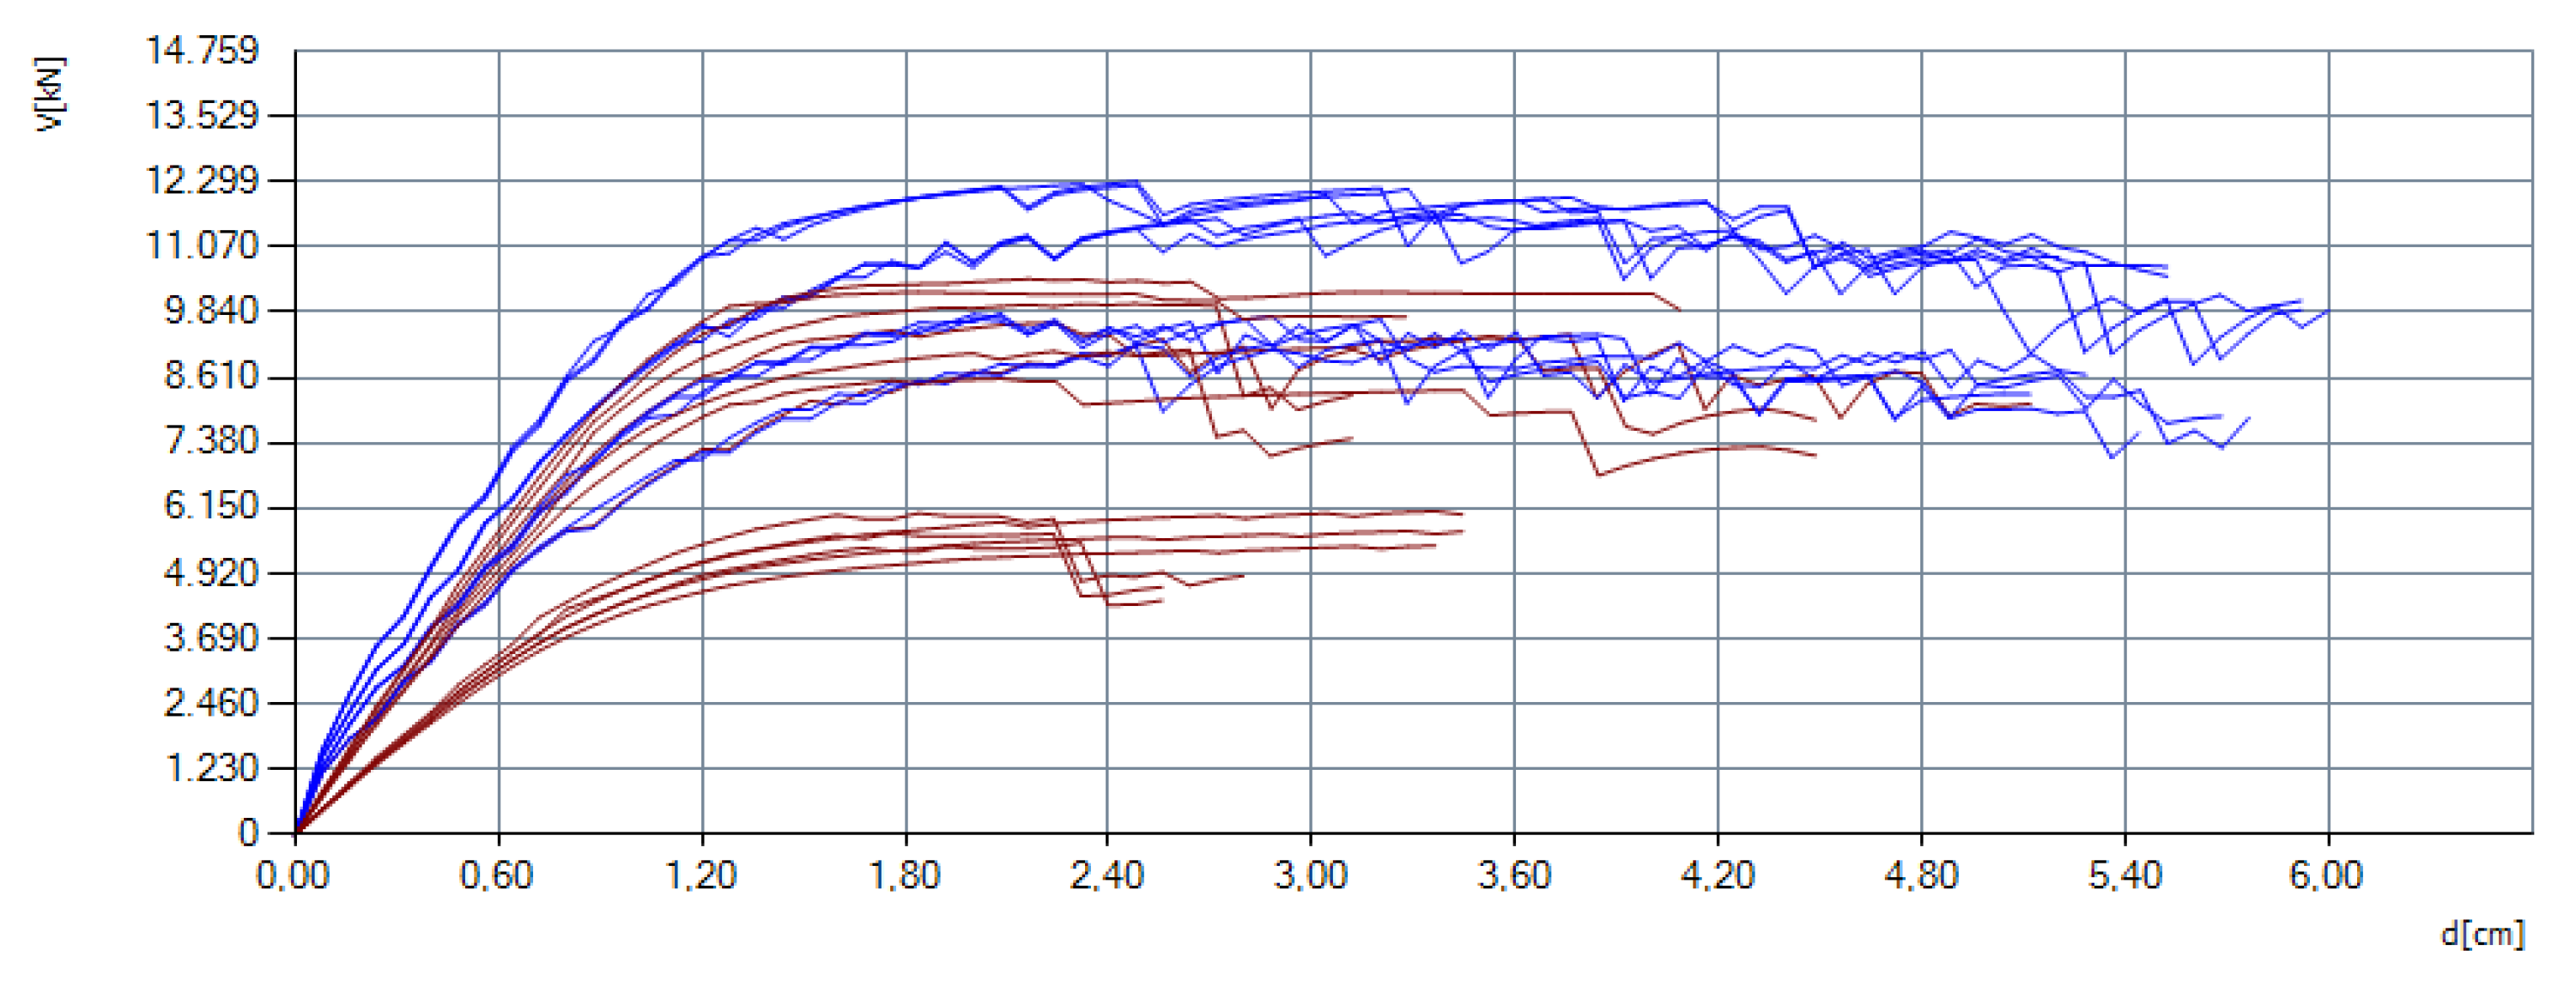
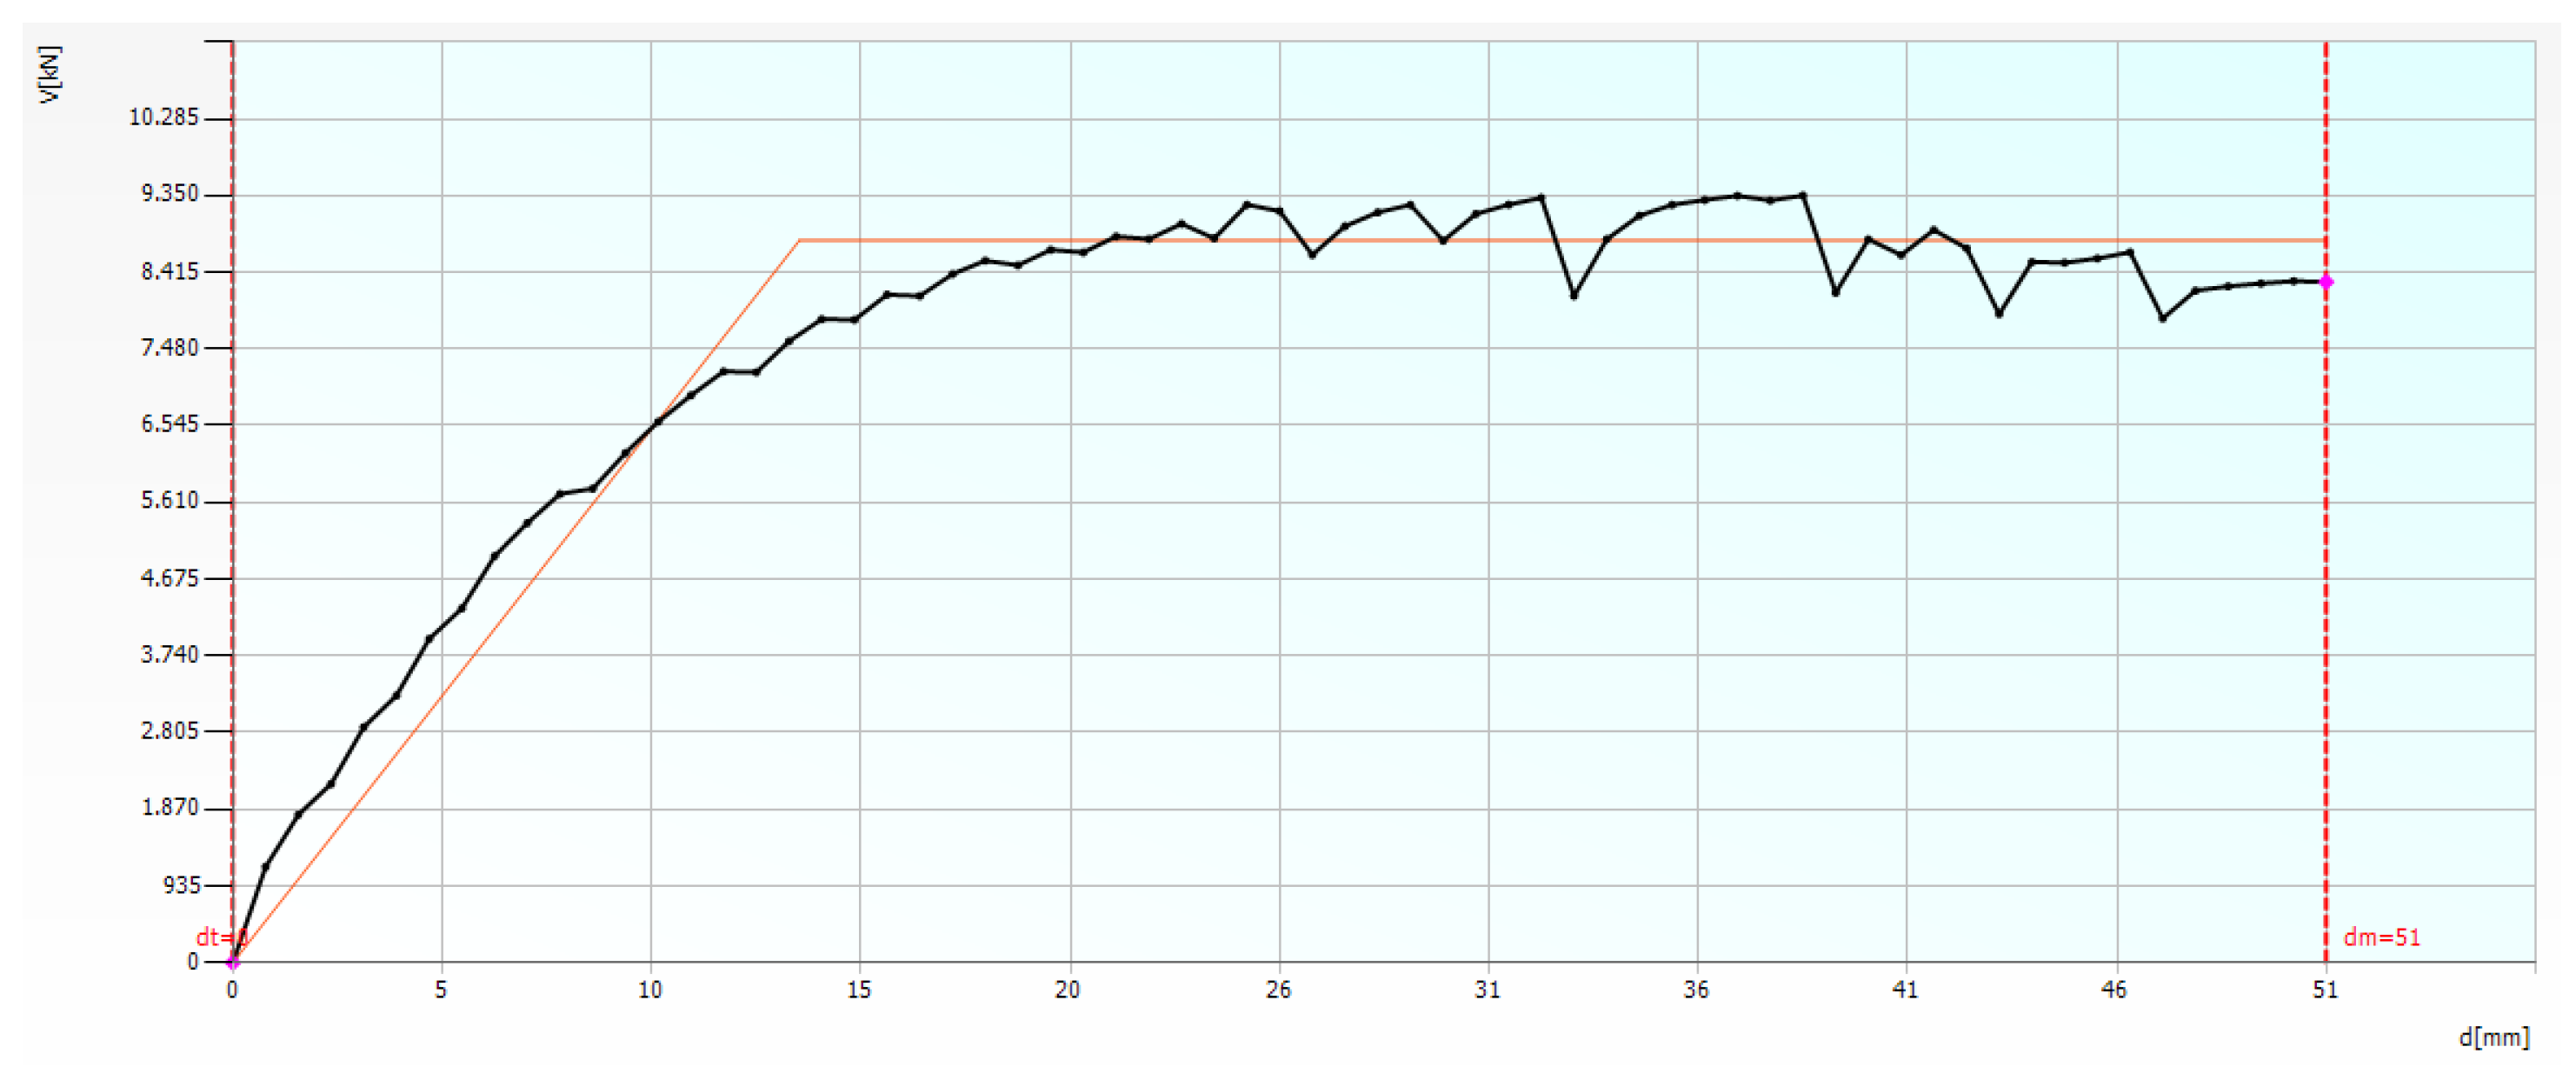
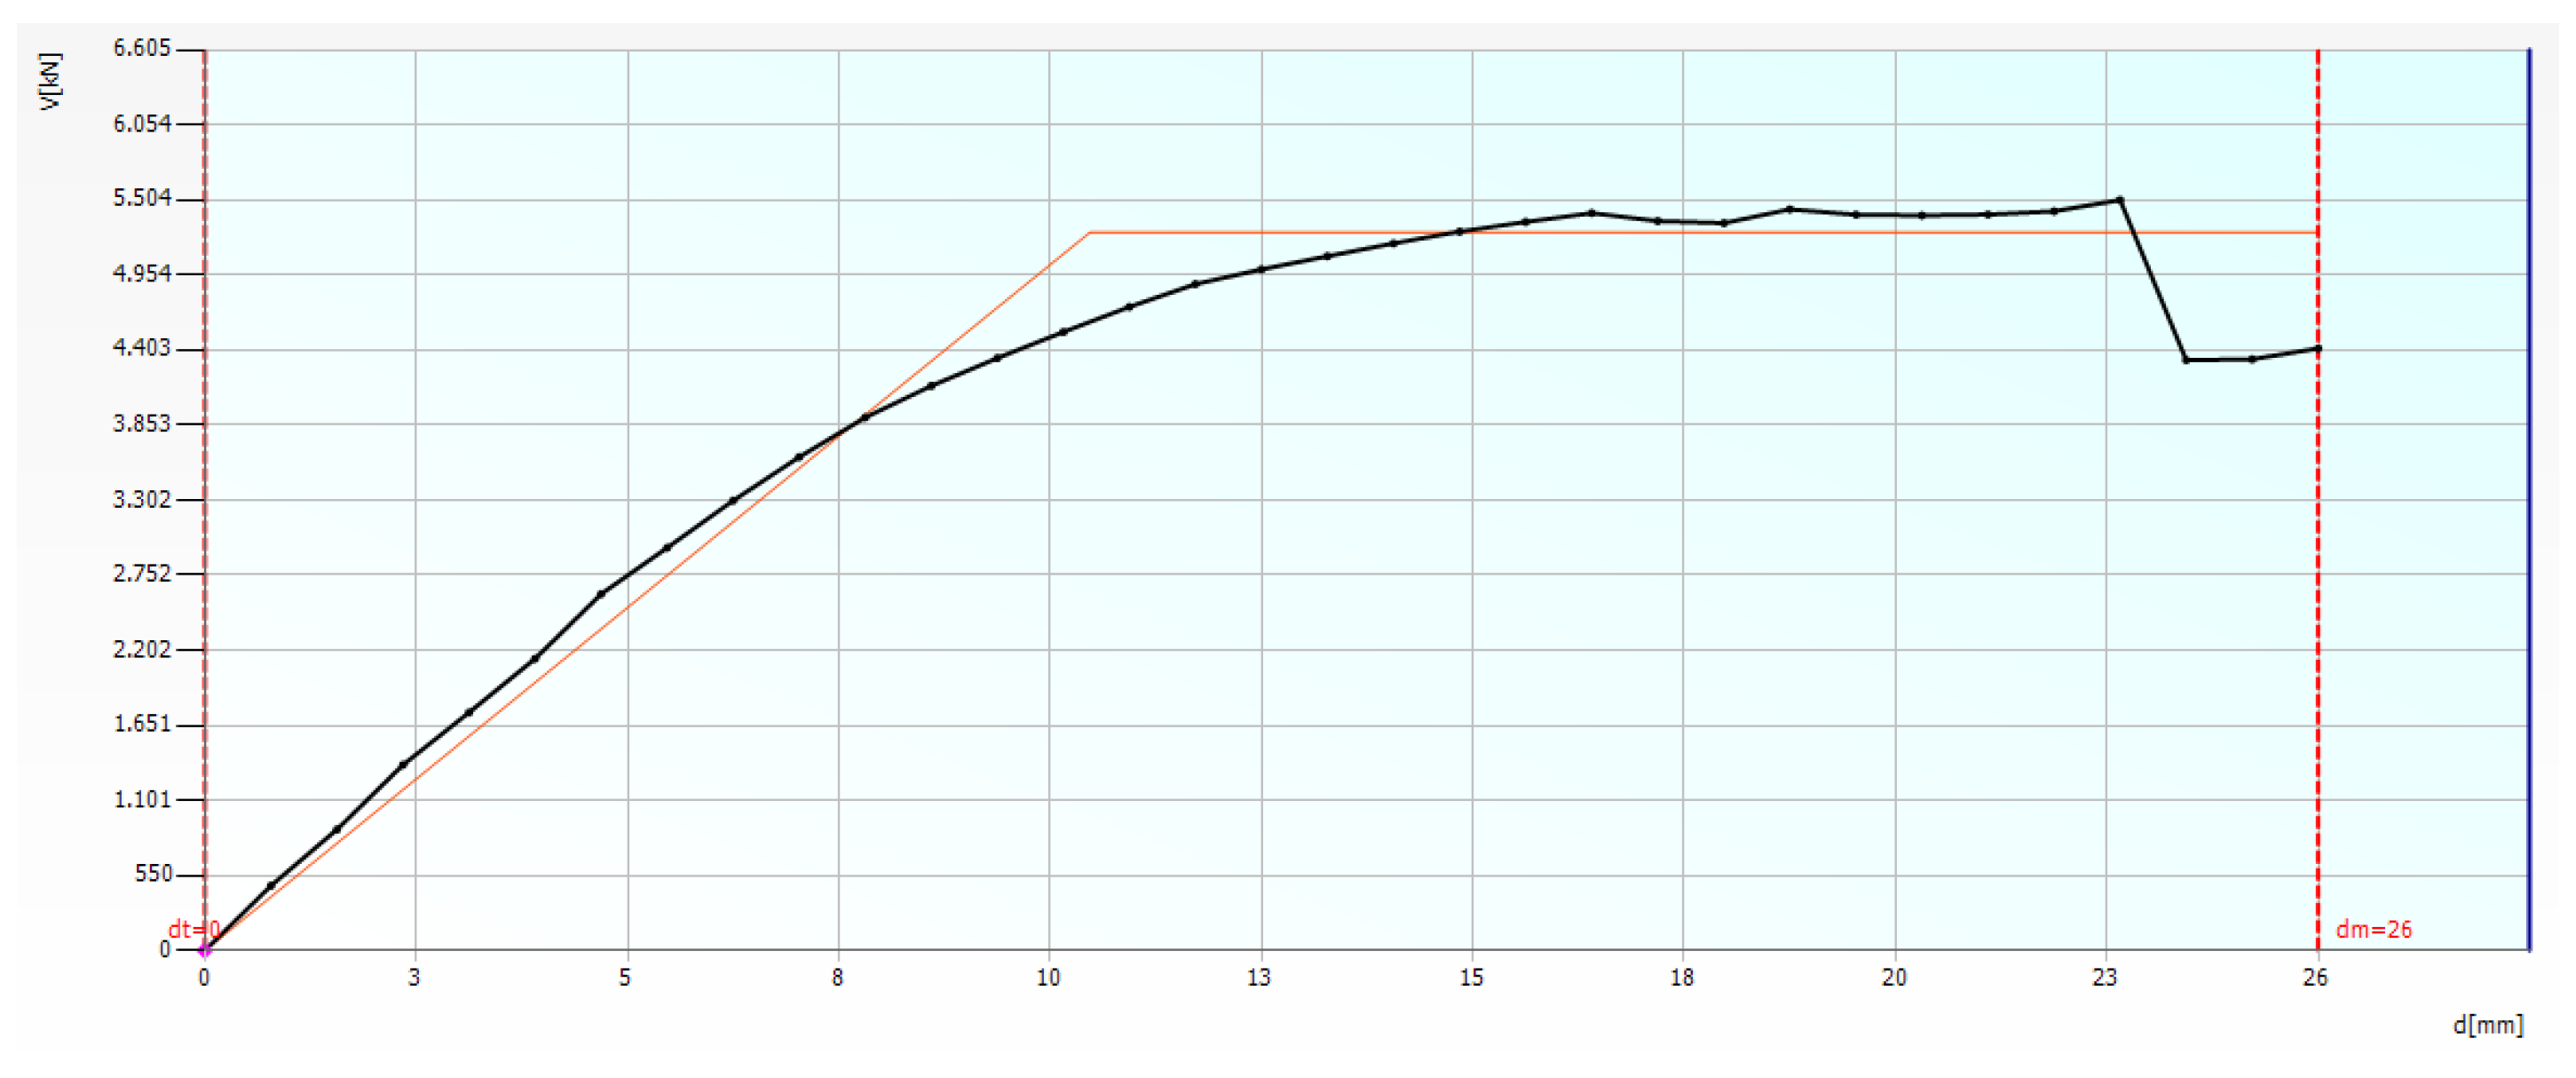
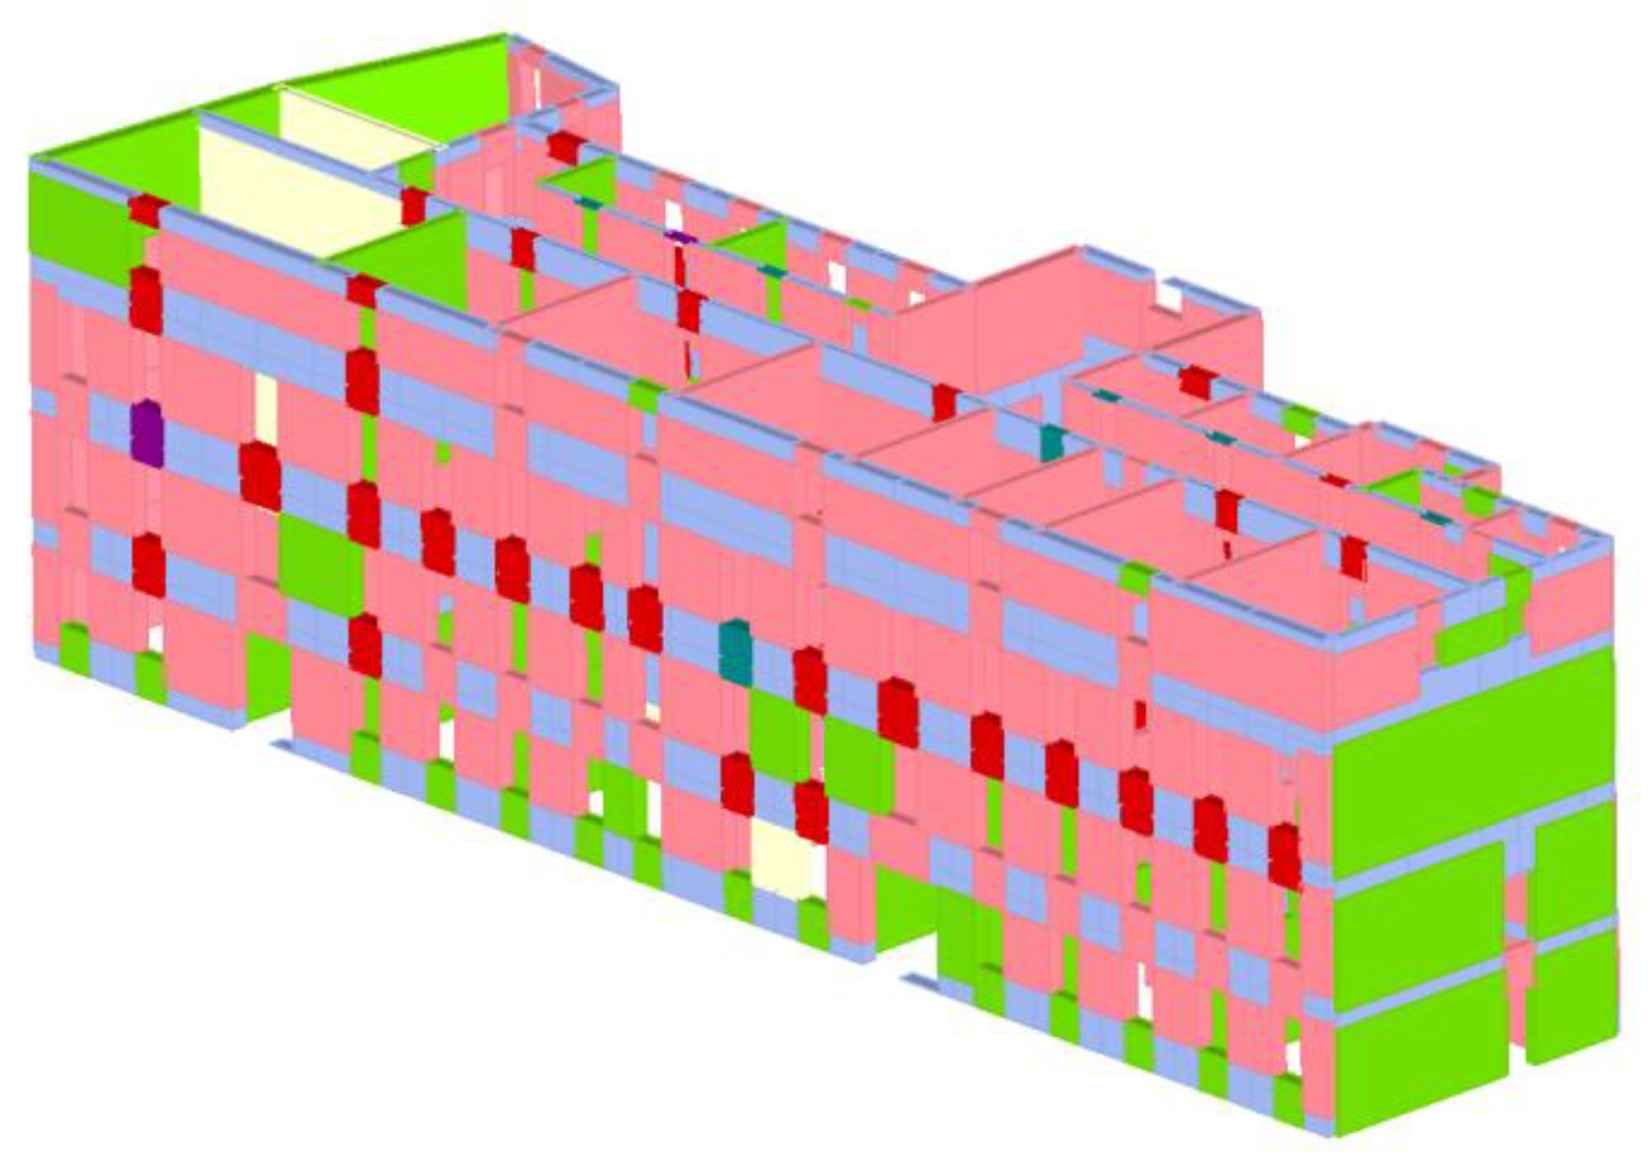
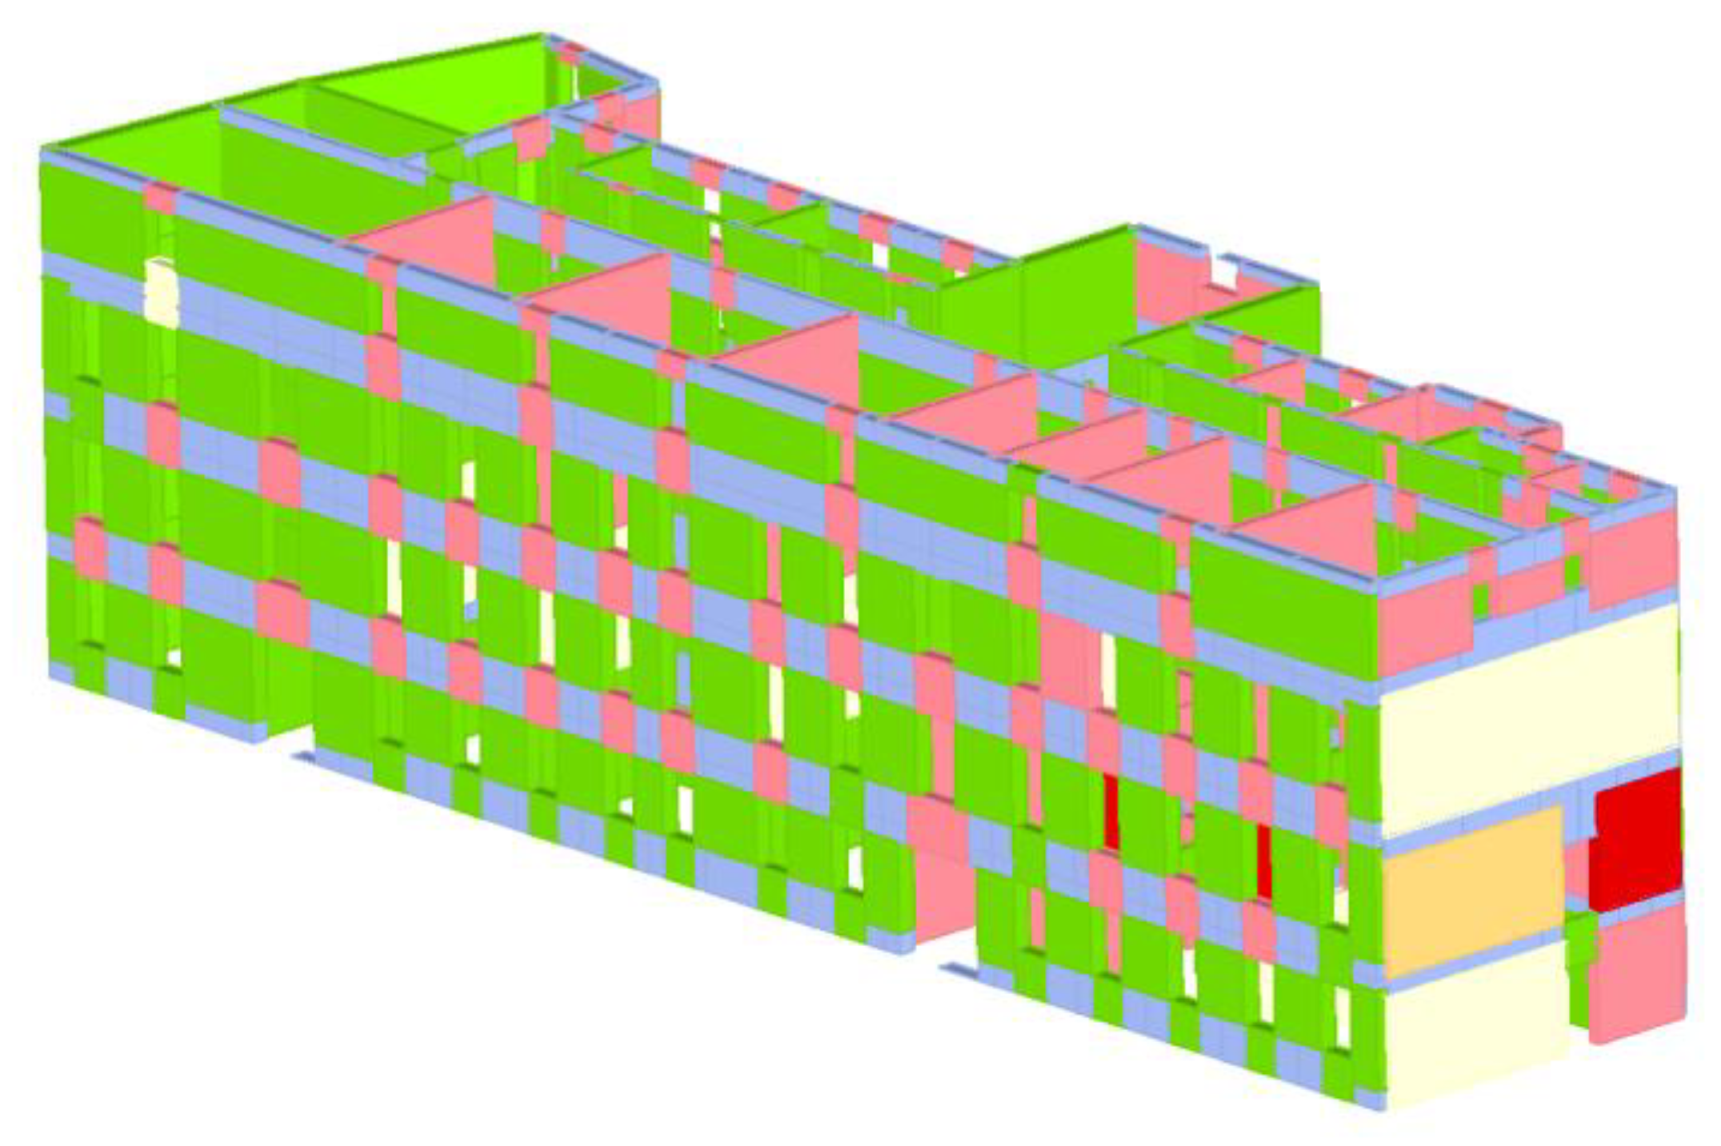
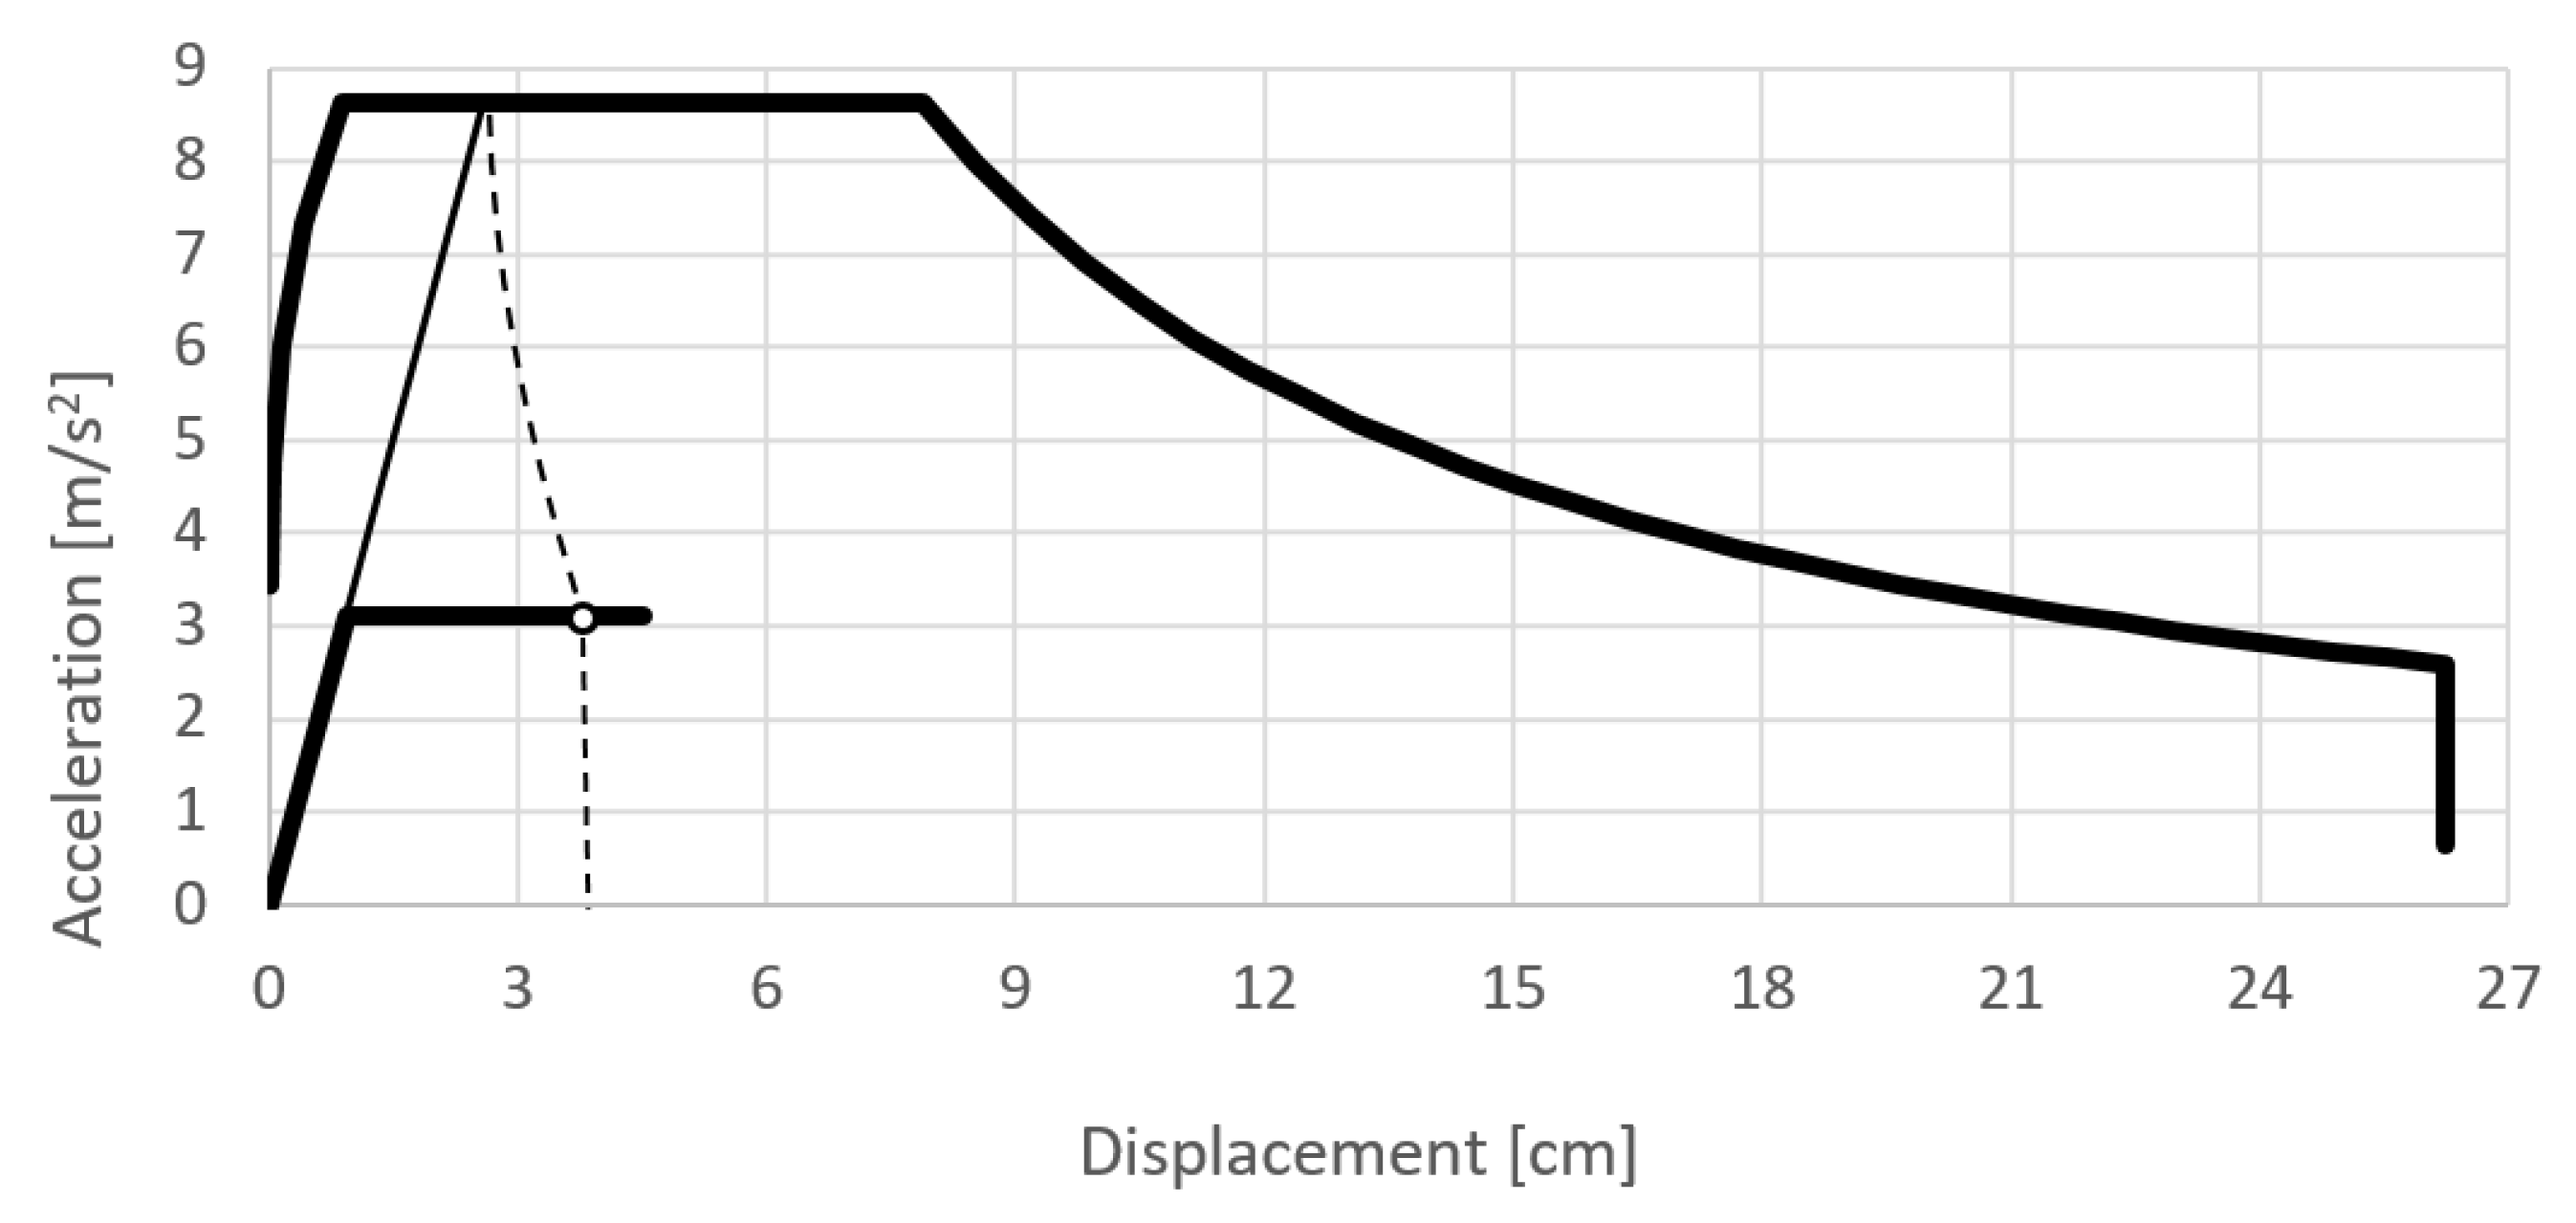
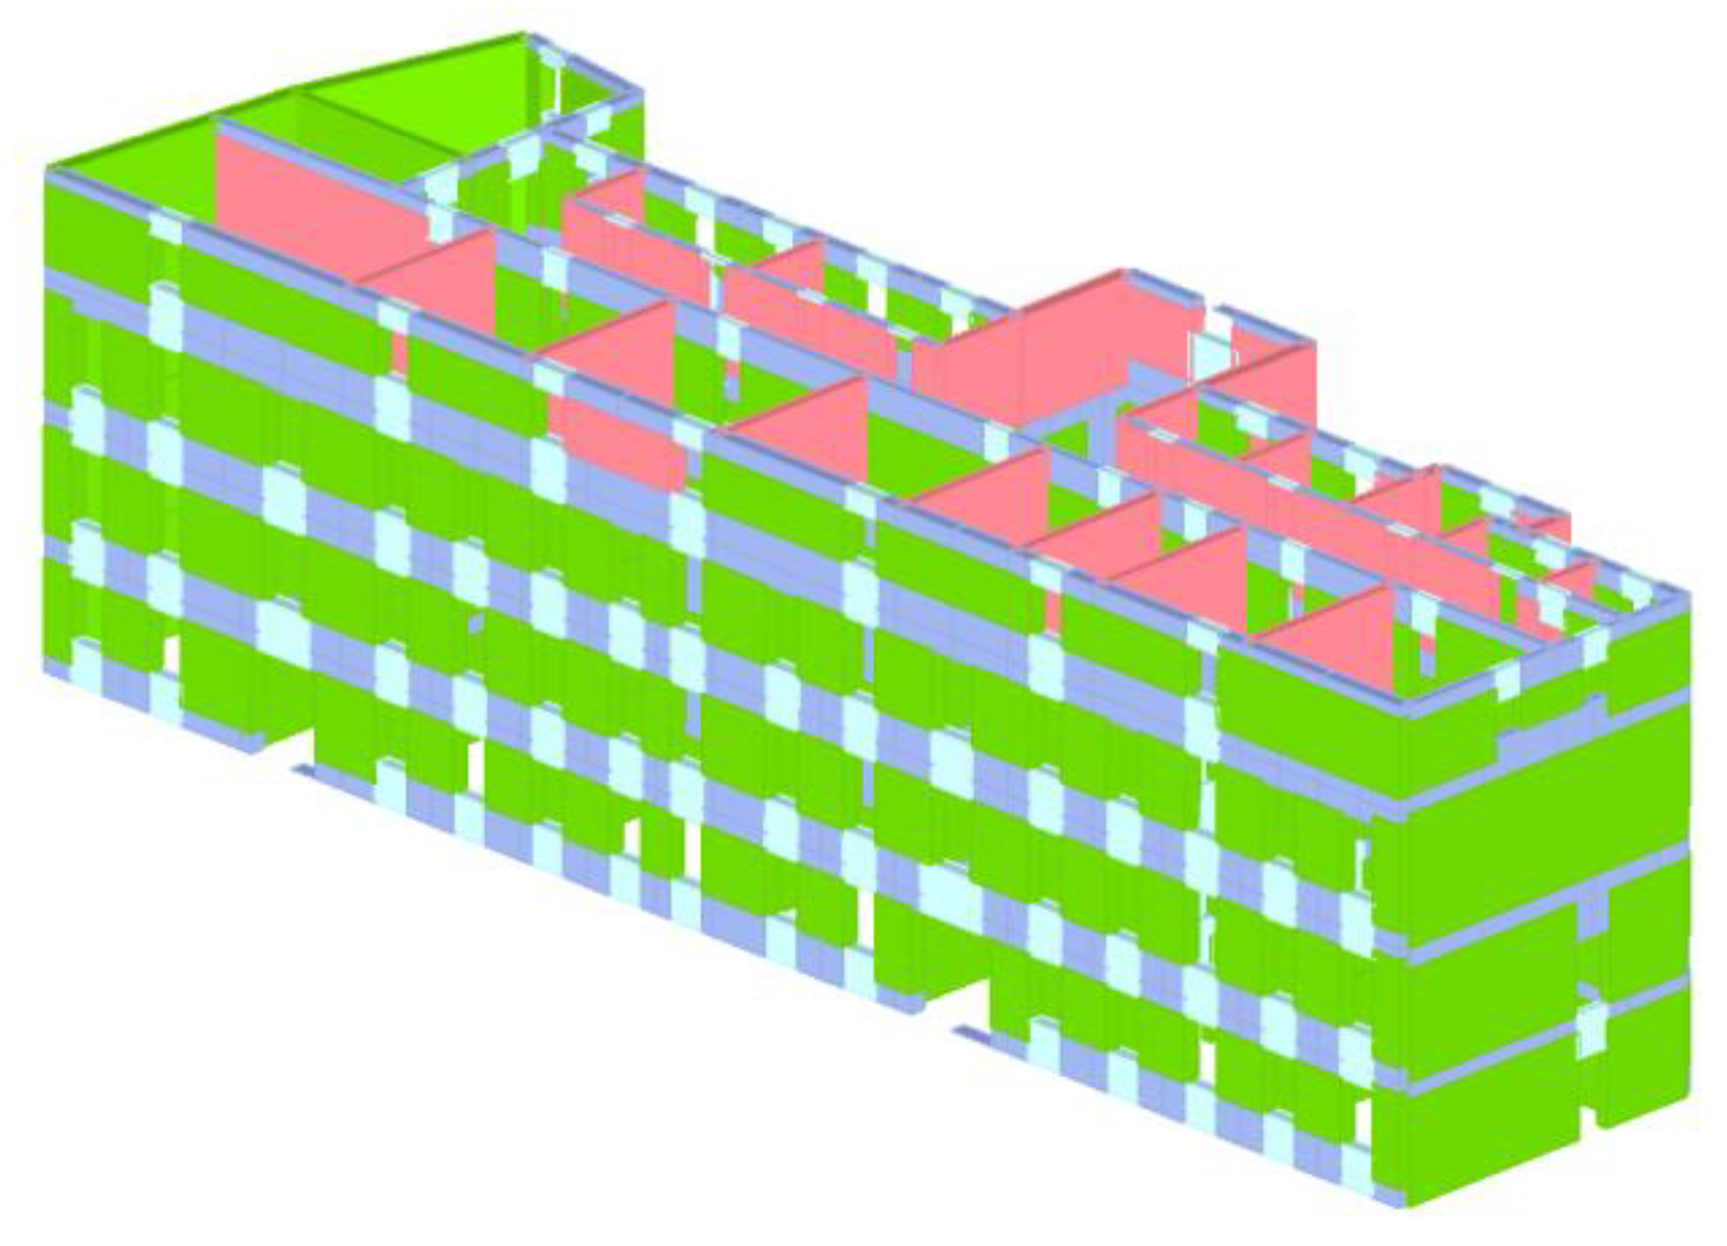
3.5. Numerical Modeling
4. Discussion and Conclusions
Author Contributions
Funding
Institutional Review Board Statement
Informed Consent Statement
Data Availability Statement
Conflicts of Interest
References and Note
- Stepinac, M.; Lourenço, P.B.; Atalić, J.; Kišiček, T.; Uroš, M.; Baniček, M.; Šavor Novak, M. Damage classification of residential buildings in historical downtown after the ML5.5 earthquake in Zagreb, Croatia in 2020. Int. J. Disaster Risk Reduct. 2021, 56, 102140. [Google Scholar] [CrossRef]
- Federal Republic of Yugoslavia (FRY) Official Journal. Ordinance on Technical Standards for the Construction of High-Rise Buildings in Seismic Areas. No. 31/81, 49/82, 29/83, 20/88, 52/90, 1 February 2021. [Google Scholar]
- Federal Republic of Yugoslavia (FRY) Official Journal. Ordinance on Temporary Technical Regulations for Construction in Seismic Areas. No. 39/64, 1 February 2021. [Google Scholar]
- ARES Project 1st Workshop. Available online: www.grad.hr/ares (accessed on 15 February 2021).
- Atalić, J.; Šavor Novak, M.; Uroš, M. Seismic risk for Croatia: Overview of research activities and present assessments with guidelines for the future. Građevinar. 2019, 71, 923–947. [Google Scholar]
- Stepinac, M.; Gašparović, M. A Review of Emerging Technologies for an Assessment of Safety and Seismic Vulnerability and Damage Detection of Existing Masonry Structures. Appl. Sci. 2020, 10, 5060. [Google Scholar] [CrossRef]
- Ortega, J.; Vasconcelos, G.; Rodrigues, H.; Correia, M.; Ferreira, T.M.; Vicente, R. Use of post-earthquake damage data to calibrate, validate and compare two seismic vulnerability assessment methods for vernacular architecture. Int. J. Disaster Risk Reduct. 2019, 39, 101242. [Google Scholar] [CrossRef]
- Rodríguez, A.S.; Rodríguez, B.R.; Rodríguez, M.S.; Sánchez, P.A. 9-Laser Scanning and Its Applications to Damage Detection and Monitoring in Masonry Structures. Woodhead Publishing Series in Civil and Structural Engineering, Long-term Performance and Durability of Masonry Structures; Ghiassi, B., Lourenço, P.B., Eds.; Woodhead Publishing, 2019; pp. 265–285. Available online: https://www.sciencedirect.com/science/article/pii/B9780081021101000091 (accessed on 15 February 2021).
- Yavari, S.; Chang, S.E.; Elwood, K.J. Modeling post-earthquake functionality of regional health care facilities. Earthq. Spectra. 2010, 26, 869–892. [Google Scholar] [CrossRef]
- Marshall, J.D.; Jaiswal, K.; Gould, N.; Turner, F.; Lizundia, B.; Barnes, J.C. Post-earthquake building safety inspection: Lessons from the canterbury, New Zealand, earthquakes. Earthq. Spectra. 2013, 29, 1091–1107. [Google Scholar] [CrossRef]
- Didier, M.; Baumberger, S.; Tobler, R.; Esposito, S.; Ghosh, S.; Stojadinovic, B. Improving post-earthquake building safety evaluation using the 2015 Gorkha, Nepal, Earthquake rapid visual damage assessment data. Earthq. Spectra. 2017, 33, 415–438. [Google Scholar] [CrossRef]
- Zhang, Y.; Burton, H.V.; Sun, H.; Shokrabadi, M. A machine learning framework for assessing post-earthquake structural safety. Struct. Saf. 2018, 72, 1–16. [Google Scholar] [CrossRef]
- Kim, T.; Song, J.; Kwon, O.S. Pre- and post-earthquake regional loss assessment using deep learning. Earthq. Eng. Struct. Dyn. 2020, 49, 657–678. [Google Scholar] [CrossRef]
- Naito, S.; Tomozawa, H.; Mori, Y.; Nagata, T.; Monma, N.; Nakamura, H.; Fujiwara, H.; Shoji, G. Building-damage detection method based on machine learning utilizing aerial photographs of the Kumamoto earthquake. Earthq. Spectra. 2020, 36, 1166–1187. [Google Scholar] [CrossRef]
- Bialas, J.; Oommen, T.; Rebbapragada, U.; Levin, E. Object-based classification of earthquake damage from high-resolution optical imagery using machine learning. J. Appl. Remote Sens. 2016, 10, 036025. [Google Scholar] [CrossRef]
- Republic of Croatia Ministry of Construction and Physical Planning. Proposal of the Long-Term Strategy for Mobilising Investment in the Renovation of the National Building Stock of the Republic of Croatia. 2014. Available online: https://mgipu.gov.hr/UserDocsImages//dokumenti/Engleska//HR-Art4BuildingStrategy_en.pdf (accessed on 15 February 2021).
- Papadimitriou, P.; Kapetanidis, V.; Karakonstantis, A.; Spingos, I.; Kassaras, I.; Sakkas, V.; Kouskouna, V.; Karatzetzou, A.; Pavlou, K.; Kaviris, G.; et al. First Results on the Mw=6.9 Samos Earthquake of 30 October 2020. Bull. Geol. Soc. Greece. 2020, 56, 251–279. [Google Scholar] [CrossRef]
- Günaydin, M.; Atmaca, B.; Demir, S.; Altunişik, A.C.; Hüsem, M.; Adanur, S.; Ateş, Ş.; Angin, Z. Seismic damage assessment of masonry buildings in Elazığ and Malatya following the 2020 Elazığ-Sivrice earthquake, Turkey. Bull. Earthq. Eng. 2021, 19, 2421–2456. [Google Scholar] [CrossRef]
- Casapulla, C.; Argiento, L.U.; Maione, A. Seismic safety assessment of a masonry building according to Italian Guidelines on Cultural Heritage: Simplified mechanical-based approach and pushover analysis. Bull. Earthq. Eng. 2018, 16, 2809–2837. [Google Scholar] [CrossRef]
- Grillanda, N.; Valente, M.; Milani, G.; Chiozzi, A.; Tralli, A. Advanced numerical strategies for seismic assessment of historical masonry aggregates. Eng. Struct. 2020, 212, 110441. [Google Scholar] [CrossRef]
- Valente, M.; Milani, G. Damage assessment and collapse investigation of three historical masonry palaces under seismic actions. Eng. Fail. Anal. 2019, 98, 10–37. [Google Scholar] [CrossRef]
- Ortega, J.; Vasconcelos, G.; Rodrigues, H.; Correia, M. Assessment of the influence of horizontal diaphragms on the seismic performance of vernacular buildings. Bull. Earthq. Eng. 2018, 16, 3871–3904. [Google Scholar] [CrossRef]
- Endo, Y.; Pelà, L.; Roca, P. Review of Different Pushover Analysis Methods Applied to Masonry Buildings and Comparison with Nonlinear Dynamic Analysis. J. Earthq. Eng. 2017, 21, 1234–1255. [Google Scholar] [CrossRef]
- Herak, M.; Allegretti, I.; Herak, D.; Ivančić, I.; Kuk, V.; Marić, K.; Markušić, S.; Sović, I. Seismic Hazard Map of Croatia for a Return Periods of 95, 225 and 475 years. Available online: http://seizkarta.gfz.hr/karta.php (accessed on 15 February 2021).
- Uroš, M.; Šavor Novak, M.; Atalić, J.; Sigmund, Z.; Baniček, M.; Demšić, M.; Hak, S. Post-earthquake damage assessment of buildings–procedure for conducting building inspections. Gradjevinar 2020, 72, 1089–1115. [Google Scholar] [CrossRef]
- Stepinac, M.; Rajčić, V.; Barbalić, J. Inspection and condition assessment of existing timber structures. Gradjevinar 2017, 69, 861–873. [Google Scholar] [CrossRef]
- Dall’Asta, A.; Leoni, G.; Meschini, A.; Petrucci, E.; Zona, A. Integrated approach for seismic vulnerability analysis of historic massive defensive structures. J. Cult. Herit. 2019, 35, 86–98. [Google Scholar] [CrossRef]
- Betti, M.; Bonora, V.; Galano, L.; Pellis, E.; Tucci, G.; Vignoli, A. An Integrated Geometric and Material Survey for the Conservation of Heritage Masonry Structures. Heritage 2021, 4, 35. [Google Scholar] [CrossRef]
- Stepinac, M.; Kisicek, T.; Renić, T.; Hafner, I.; Bedon, C. Methods for the assessment of critical properties in existing masonry structures under seismic loads-the ARES project. Appl. Sci. 2020, 10, 1576. [Google Scholar] [CrossRef]
- The Database of Usability Classification, Croatian Centre of Earthquake Engineering (HCPI—Hrvatski Centar za Potresno Inženjerstvo), Faculty of Civil Engineering, University of Zagreb and The City of Zagreb. June 2020. Available online: https://www.hcpi.hr/ (accessed on 15 February 2021).
- Seismic and Geological Micro-Zoning of a Part of the City of Zagreb, Book 1—Seismic and Geological Micro-Zoning, Croatian Geological Institute, Zagreb. 2019. Available online: https://www.hgi-cgs.hr/studija-seizmicka-i-geoloska-mikronizacija-dijela-grada-zagreba/ (accessed on 15 February 2021).
- Krolo, J.; Damjanović, D.; Duvnjak, I.; Smrkić, M.F.; Bartolac, M.; Košćak, J. Methods for determining mechanical properties of walls. Gradjevinar 2021, 73, 127–140. [Google Scholar] [CrossRef]
- Methods of Test for Masonry—Part 3: Determination of Initial Shear Strength. Available online: https://standards.iteh.ai/catalog/standards/cen/bbead1e6-bd33-4a25-bc75-c023da989f65/en-1052-3-2002 (accessed on 15 February 2021).
- Eurocode 8: Design of Structures for Earthquake Resistance—Part 3: Assessment and Retrofitting of Buildings. Available online: https://www.phd.eng.br/wp-content/uploads/2014/07/en.1998.3.2005.pdf (accessed on 15 February 2021).
- Mouyiannou, A.; Rota, M.; Penna, A.; Magenes, M. Identification of Suitable Limit States from Nonlinear Dynamic Analyses of Masonry Structures. J. Earthq. Eng. 2014, 18, 231–263. [Google Scholar] [CrossRef]
- Lamego, P.; Lourenço, P.B.; Sousa, M.L.; Marques, R. Seismic vulnerability and risk analysis of the old building stock at urban scale: Application to a neighbourhood in Lisbon. Bull. Earthq. Eng. 2017, 15, 2901–2937. [Google Scholar] [CrossRef]
- Formisano, A.; Marzo, A. Simplified and refined methods for seismic vulnerability assessment and retrofitting of an Italian cultural heritage masonry building. Comput. Struct. 2017, 180, 13–26. [Google Scholar] [CrossRef]
- Malcata, M.; Ponte, M.; Tiberti, S.; Bento, R.; Milani, G. Failure analysis of a Portuguese cultural heritage masterpiece: Bonet building in Sintra. Eng. Fail. Anal. 2020, 115, 104636. [Google Scholar] [CrossRef]
- Fajfar, P.; Fischinger, M. N2—a method for non-linear seismic analysis of regular buildings. In Proceedings of the 9th World conference in earthquake engineering, Tokyo-Kyoto, Japan, 2–9 August 1998; pp. 111–116. [Google Scholar]
- Cerovečki, A.; Kraus, I.; Morić, D. N2 building design method. Gradjevinar 2018, 70, 509–518. [Google Scholar] [CrossRef]
- 3muri User Manual 12.2.1. Available online: https://www.3muri.com/en/brochures-and-manuals/ (accessed on 11 January 2021).
- Kišiček, T.; Stepinac, M.; Renić, T.; Hafner, I.; Lulić, L. Strengthening of masonry walls with FRP or TRM. Gradjevinar 2020, 72, 937–953. [Google Scholar] [CrossRef]
- Lagomarsino, S.; Penna, A.; Galasco, A.; Cattari, S. TREMURI program: An equivalent frame model for the nonlinear seismic analysis of masonry buildings. Eng. Struct. 2013, 56, 1787–1799. [Google Scholar] [CrossRef]
- Penna, A.; Lagomarsino, S.; Galasco, A. A nonlinear macroelement model for the seismic analysis of masonry buildings. Earthq. Eng. Struct. Dyn. 2014, 43, 159–179. [Google Scholar] [CrossRef]
- Turnšek, V.; Čačovič, F. Some Experimental Results on the Strength of Brick Masonry Walls. Available online: http://www.hms.civil.uminho.pt/ibmac/1970/149.pdf (accessed on 8 February 2021).
- Tomaževič, M. Shear resistance of masonry walls and Eurocode 6: Shear versus tensile strength of masonry. Mater. Struct. Mater. Constr. 2009, 42, 889–907. [Google Scholar] [CrossRef]
- Borri, A.; Castori, G.; Corradi, M.; Speranzini, E. Shear behavior of unreinforced and reinforced masonry panels subjected to in situ diagonal compression tests. Constr. Build. Mater. 2011, 25, 4403–4414. [Google Scholar] [CrossRef]
- Borri, A.; Corradi, M.; Castori, G.; De Maria, A. A method for the analysis and classification of historic masonry. Bull. Earthq. Eng. 2015, 13, 2647–2665. [Google Scholar] [CrossRef]
- Borri, A.; Corradi, A.; De Maria, A.; Sisti, R. Calibration of a visual method for the analysis of the mechanical properties of historic masonry. Procedia Struct. Integr. 2018, 11, 418–427. [Google Scholar] [CrossRef]
- Borri, A.; Corradi, M.; De Maria, A. The Failure of Masonry Walls by Disaggregation and the Masonry Quality Index. Heritage 2020, 3, 65. [Google Scholar] [CrossRef]
- Ghiassi, B.; Vermelfoort, A.T.; Lourenço, P.B. Masonry Mechanical Properties; Ghiassi, B., Milani, G., Eds.; Woodhead Publishing, 2019. Chapter 7. pp. 239–261. Available online: https://www.sciencedirect.com/science/article/pii/B9780081024393000075 (accessed on 8 February 2021). [CrossRef]
- Eurocode 8: Design of Structures for Earthquake Resistance—Part 1: General Rules, Seismic Actions and Rules for Buildings. Available online: https://www.phd.eng.br/wp-content/uploads/2015/02/en.1998.1.2004.pdf (accessed on 8 February 2021).
- Eurocode 6: Design of Masonry Structures—Part 1-1: General Rules for Reinforced and Unreinforced Masonry Structures. Available online: https://www.phd.eng.br/wp-content/uploads/2015/02/en.1996.1.1.2005.pdf (accessed on 8 February 2021).
- Law on the Reconstruction of Earthquake-Damaged Buildings in the City of Zagreb, Krapina-Zagorje County and Zagreb County (NN 102/2020). Available online: https://www.zakon.hr/z/2656/Zakon-o-obnovi-zgrada-o%C5%A1te%C4%87enih-potresom-na-podru%C4%8Dju-Grada-Zagreba,-Krapinsko-zagorske-%C5%BEupanije,-Zagreba%C4%8Dke-%C5%BEupanije,-Sisa%C4%8Dko-moslava%C4%8Dke-%C5%BEupanije-i-Karlova%C4%8Dke-%C5%BEupanije (accessed on 9 February 2021).
- Eurocode 8: Design of Structures for Earthquake Resistance—Part 3: Assessment and Retrofitting of Buildings—National Annex.
- Sürmeli, M.; Yüksel, E. An adaptive modal pushover analysis procedure (VMPA-A) for buildings subjected to bi-directional ground motions. Bull. Earthq. Eng. 2018, 16, 5257–5277. [Google Scholar] [CrossRef]
- Fagundes, C.; Bento, R.; Cattari, S. On the seismic response of buildings in aggregate: Analysis of a typical masonry building from Azores. Structures 2017, 10, 184–196. [Google Scholar] [CrossRef]
- Senaldi, I.; Magenes, G.; Penna, A. Numerical Investigations on the Seismic Response of Masonry Building Aggregates. Adv. Mater. Res. 2010, 133–134, 715–720. [Google Scholar] [CrossRef]
- Formisano, A.; Massimilla, A. A Novel Procedure for Simplified Nonlinear Numerical Modeling of Structural Units in Masonry Aggregates. Int. J. Archit. Herit. 2018, 12, 1162–1170. [Google Scholar] [CrossRef]
- Stavroulaki, M.E. Dynamic Behavior of Aggregated Buildings With Different Floor Systems and Their Finite Element Modeling. Front. Built Environ. 2019, 5, 138. [Google Scholar] [CrossRef]
- Tomić, I.; Penna, A.; DeJong, M.; Butenweg, C.; Correia, A.; Candeias, P.; Senaldi, I.; Guerrini, G.; Malomo, D.; Beyer, K. Seismic Testing of Adjacent Interacting Masonry Structures (AIMS). In Proceedings of the 17th World Conference on Earthquake Engineering, Sendai, Japan, 27 September–2 October 2021. [Google Scholar]
- Formisano, A.; Landolfo, R.; Mazzolani, F.M.; Florio, G. A Quick Methodology for Seismic Vulnerability Assessment of Historical Masonry Aggregates. 2010. Available online: https://www.researchgate.net/publication/266617700_A_quick_methodology_for_seismic_vulnerability_assessment_of_historical_masonry_aggregates (accessed on 8 February 2021).
- Formisano, A.; Florio, G.; Landolfo, R.; Mazzolani, F.M. Numerical calibration of an easy method for seismic behaviour assessment on large scale of masonry building aggregates. Adv. Eng. Softw. 2015, 80, 116–138. [Google Scholar] [CrossRef]
- Benedetti, D.; Benzoni, G.; Parisi, M.A. Seismic vulnerability and risk evaluation for old urban nuclei. Earthq. Eng. Struct. Dyn. 1988, 16, 183–201. [Google Scholar] [CrossRef]
- Formisano, A. Theoretical and Numerical Seismic Analysis of Masonry Building Aggregates: Case Studies in San Pio Delle Camere (L’Aquila, Italy). J. Earthq. Eng. 2017, 21, 227–245. [Google Scholar] [CrossRef]
- da Porto, F.; Munari, M.; Prota, A.; Modena, C. Analysis and repair of clustered buildings: Case study of a block in the historic city centre of L’Aquila (Central Italy). Constr. Build. Mater. 2013, 38, 1221–1237. [Google Scholar] [CrossRef]
- Lucibello, G.; Brandonisio, G.; Mele, E.; De Luca, A. Seismic damage and performance of Palazzo Centi after L’Aquila earthquake: A paradigmatic case study of effectiveness of mechanical steel ties. Eng. Fail. Anal. 2013, 34, 407–430. [Google Scholar] [CrossRef]
- Chieffo, N.; Formisano, A. Comparative Seismic Assessment Methods for Masonry Building Aggregates: A. Case Study. Front. Built Environ. 2019, 5, 123. [Google Scholar] [CrossRef]
- Boschi, S.; Borghini, A.; Pintucchi, B.; Bento, R.; Milani, G. Seismic vulnerability of historic masonry buildings: A case study in the center of Lucca. Procedia Struct. Integr. 2018, 11, 169–176. [Google Scholar] [CrossRef]
- Fortunato, G.; Funari, M.F.; Lonetti, P. Survey and seismic vulnerability assessment of the Baptistery of San Giovanni in Tumba (Italy). J. Cult. Herit. 2017, 26, 64–78. [Google Scholar] [CrossRef]
- Stepinac, M.; Šušteršič, I.; Gavrić, I.; Rajcic, V. Seismic design of timber buildings: Highlighted challenges and future trends. Appl. Sci. 2020, 10, 1380. [Google Scholar] [CrossRef]
- Funari, M.F.; Mehrotra, A.; Lourenço, P.B. A Tool for the Rapid Seismic Assessment of Historic Masonry Structures Based on Limit Analysis Optimisation and Rocking Dynamics. Appl. Sci. 2021, 11, 942. [Google Scholar] [CrossRef]
- Funari, M.F.; Spadea, S.; Lonetti, P.; Fabbrocino, F.; Luciano, R. Visual programming for structural assessment of out-of-plane mechanisms in historic masonry structures. J. Build. Eng. 2020, 31, 101425. [Google Scholar] [CrossRef]
- Milovanović, B.; Bagarić, M. How to achieve Nearly zero-energy buildings standard. Gradjevinar 2020, 72, 703–720. [Google Scholar] [CrossRef]
- Valluzzi, M.R.; Salvalaggio, M.; Croatto, G.; Dorigatti, G.; Turrini, U. Nested Buildings: An Innovative Strategy for the Integrated Seismic and Energy Retrofit of Existing Masonry Buildings with CLT Panels. Sustainability 2021, 13, 1188. [Google Scholar] [CrossRef]
- Ortega, J.; Vasconcelos, G.; Rodrigues, H.; Correia, M.; Lourenço, P.B. Traditional earthquake resistant techniques for vernacular architecture and local seismic cultures: A literature review. J. Cult. Herit. 2017, 27, 181–196. [Google Scholar] [CrossRef]
- Skejić, D.; Lukačević, I.; Ćurković, I.; Čudina, I. Application of steel in refurbishment of earthquake-prone buildings. Gradjevinar 2020, 72, 955–966. [Google Scholar] [CrossRef]
- Kouris, L.A.S.; Triantafillou, T.C. State-of-the-art on strengthening of masonry structures with textile reinforced mortar (TRM). Constr. Build. Mater. 2018, 188, 1221–1233. [Google Scholar] [CrossRef]


| Floor | Testing Site | h (cm) | Ah (cm2) | Hu, max (kN) | Shear Strength fv (MPa) |
|---|---|---|---|---|---|
| Ground floor | PS-PR-1 | 45 | 784 | 55.5 | 0.708 |
| PS-PR-2 | 60 | 812 | 58.3 | 0.717 | |
| PS-PR-3 | 75 | - | - | - | |
| PS-PR-4 | 60 | - | - | - | |
| PS-PR-5 | 60 | 504 | 16.3 | 0.323 | |
| 1st floor | PS-1-1 | 50 | 448 | 17.6 | 0.393 |
| PS-1-2 | 50 | 728 | 121.9 | 1.675 | |
| PS-1-3 | 70 | 526 | 24.4 | 0.464 | |
| 2nd floor | PS-2-1 | 45 | 783 | 44.7 | 0.571 |
| PS-2-2 | 55 | 812 | 40.6 | 0.500 | |
| PS-2-3 | 55 | 840 | 94.8 | 1.129 |
| Material Characteristic | Value |
|---|---|
| Modulus of elasticity | 3000 N/mm2 |
| Shear modulus | 1200 N/mm2 |
| Specific weight | 18 kN/m3 |
| Mean compressive strength of masonry | 6.63 N/mm2 |
| Shear strength | 0.14 N/mm2 |
| Characteristic compressive strength of masonry | 5.53 N/mm2 |
| Confidence factor | 1.2 |
| Partial safety factor for material | 1 |
| Shear drift | 0.0053 |
| Bending drift | 0.0107 |
| Final creep coefficient | 0.5 |
| Parameter | Value (x-Direction) | Value (y-Direction) |
|---|---|---|
| T* (s) | 0.411 | 0.433 |
| m* (kg) | 2,725,590 | 2,339,506 |
| w (kN) | 45,733 | 45,733 |
| M (kg) | 4,661,901 | 4,661,901 |
| m*/M (%) | 58.47 | 50.18 |
| Γ | 1.31 | 1.41 |
| F*y (kN) | 6719 | 3736 |
| d*y (cm) | 1.06 | 0.76 |
| d*m (cm) | 3.91 | 1.81 |
| Return Period | α (x-Direction) | α (y-Direction) |
|---|---|---|
| 475 | 0.633 | 0.291 |
| 225 | 0.894 | 0.411 |
| 95 | 0.560 | 0.363 |
| Local Mechanism | α |
|---|---|
| LM1 | 4.93 |
| LM2 | 2.10 |
| LM3 | 0.53 |
Publisher’s Note: MDPI stays neutral with regard to jurisdictional claims in published maps and institutional affiliations. |
© 2021 by the authors. Licensee MDPI, Basel, Switzerland. This article is an open access article distributed under the terms and conditions of the Creative Commons Attribution (CC BY) license (https://creativecommons.org/licenses/by/4.0/).
Share and Cite
Lulić, L.; Ožić, K.; Kišiček, T.; Hafner, I.; Stepinac, M. Post-Earthquake Damage Assessment—Case Study of the Educational Building after the Zagreb Earthquake. Sustainability 2021, 13, 6353. https://doi.org/10.3390/su13116353
Lulić L, Ožić K, Kišiček T, Hafner I, Stepinac M. Post-Earthquake Damage Assessment—Case Study of the Educational Building after the Zagreb Earthquake. Sustainability. 2021; 13(11):6353. https://doi.org/10.3390/su13116353
Chicago/Turabian StyleLulić, Luka, Karlo Ožić, Tomislav Kišiček, Ivan Hafner, and Mislav Stepinac. 2021. "Post-Earthquake Damage Assessment—Case Study of the Educational Building after the Zagreb Earthquake" Sustainability 13, no. 11: 6353. https://doi.org/10.3390/su13116353
APA StyleLulić, L., Ožić, K., Kišiček, T., Hafner, I., & Stepinac, M. (2021). Post-Earthquake Damage Assessment—Case Study of the Educational Building after the Zagreb Earthquake. Sustainability, 13(11), 6353. https://doi.org/10.3390/su13116353