Article

Scenario-Based Hydrological Modeling for Designing Climate-Resilient Coastal Water Resource Management Measures: Lessons from Brahmani River, Odisha, Eastern India

1
Natural Resources and Ecosystem Services, Institute for Global Environmental Strategies, Hayama, Kanagawa 240-0115, Japan
2
CSIR-National Environmental Engineering Research Institute (NEERI), Nehru Marg, Nagpur 440020, India
3
Graduate School of Agricultural and Life Sciences, University of Tokyo, Yayoi 1-1-1, Bunkyo-Ku, Tokyo 113-8657, Japan
4
Department of Geography, Delhi School of Economics, University of Delhi, New Delhi 110007, India
5
Faculty of Environmental Earth Science, Hokkaido University, Sapporo 060-0810, Japan
6
Faculty of Sustainability Studies, Hosei University, Tokyo 102-8160, Japan
7
School of Engineering, Pokhara University, Pokhara-30, Lekhnath 33700, Nepal
*
Author to whom correspondence should be addressed.
Sustainability 2021, 13(11), 6339; https://doi.org/10.3390/su13116339
Submission received: 12 April 2021 / Revised: 27 May 2021 / Accepted: 31 May 2021 / Published: 3 June 2021

Abstract

:
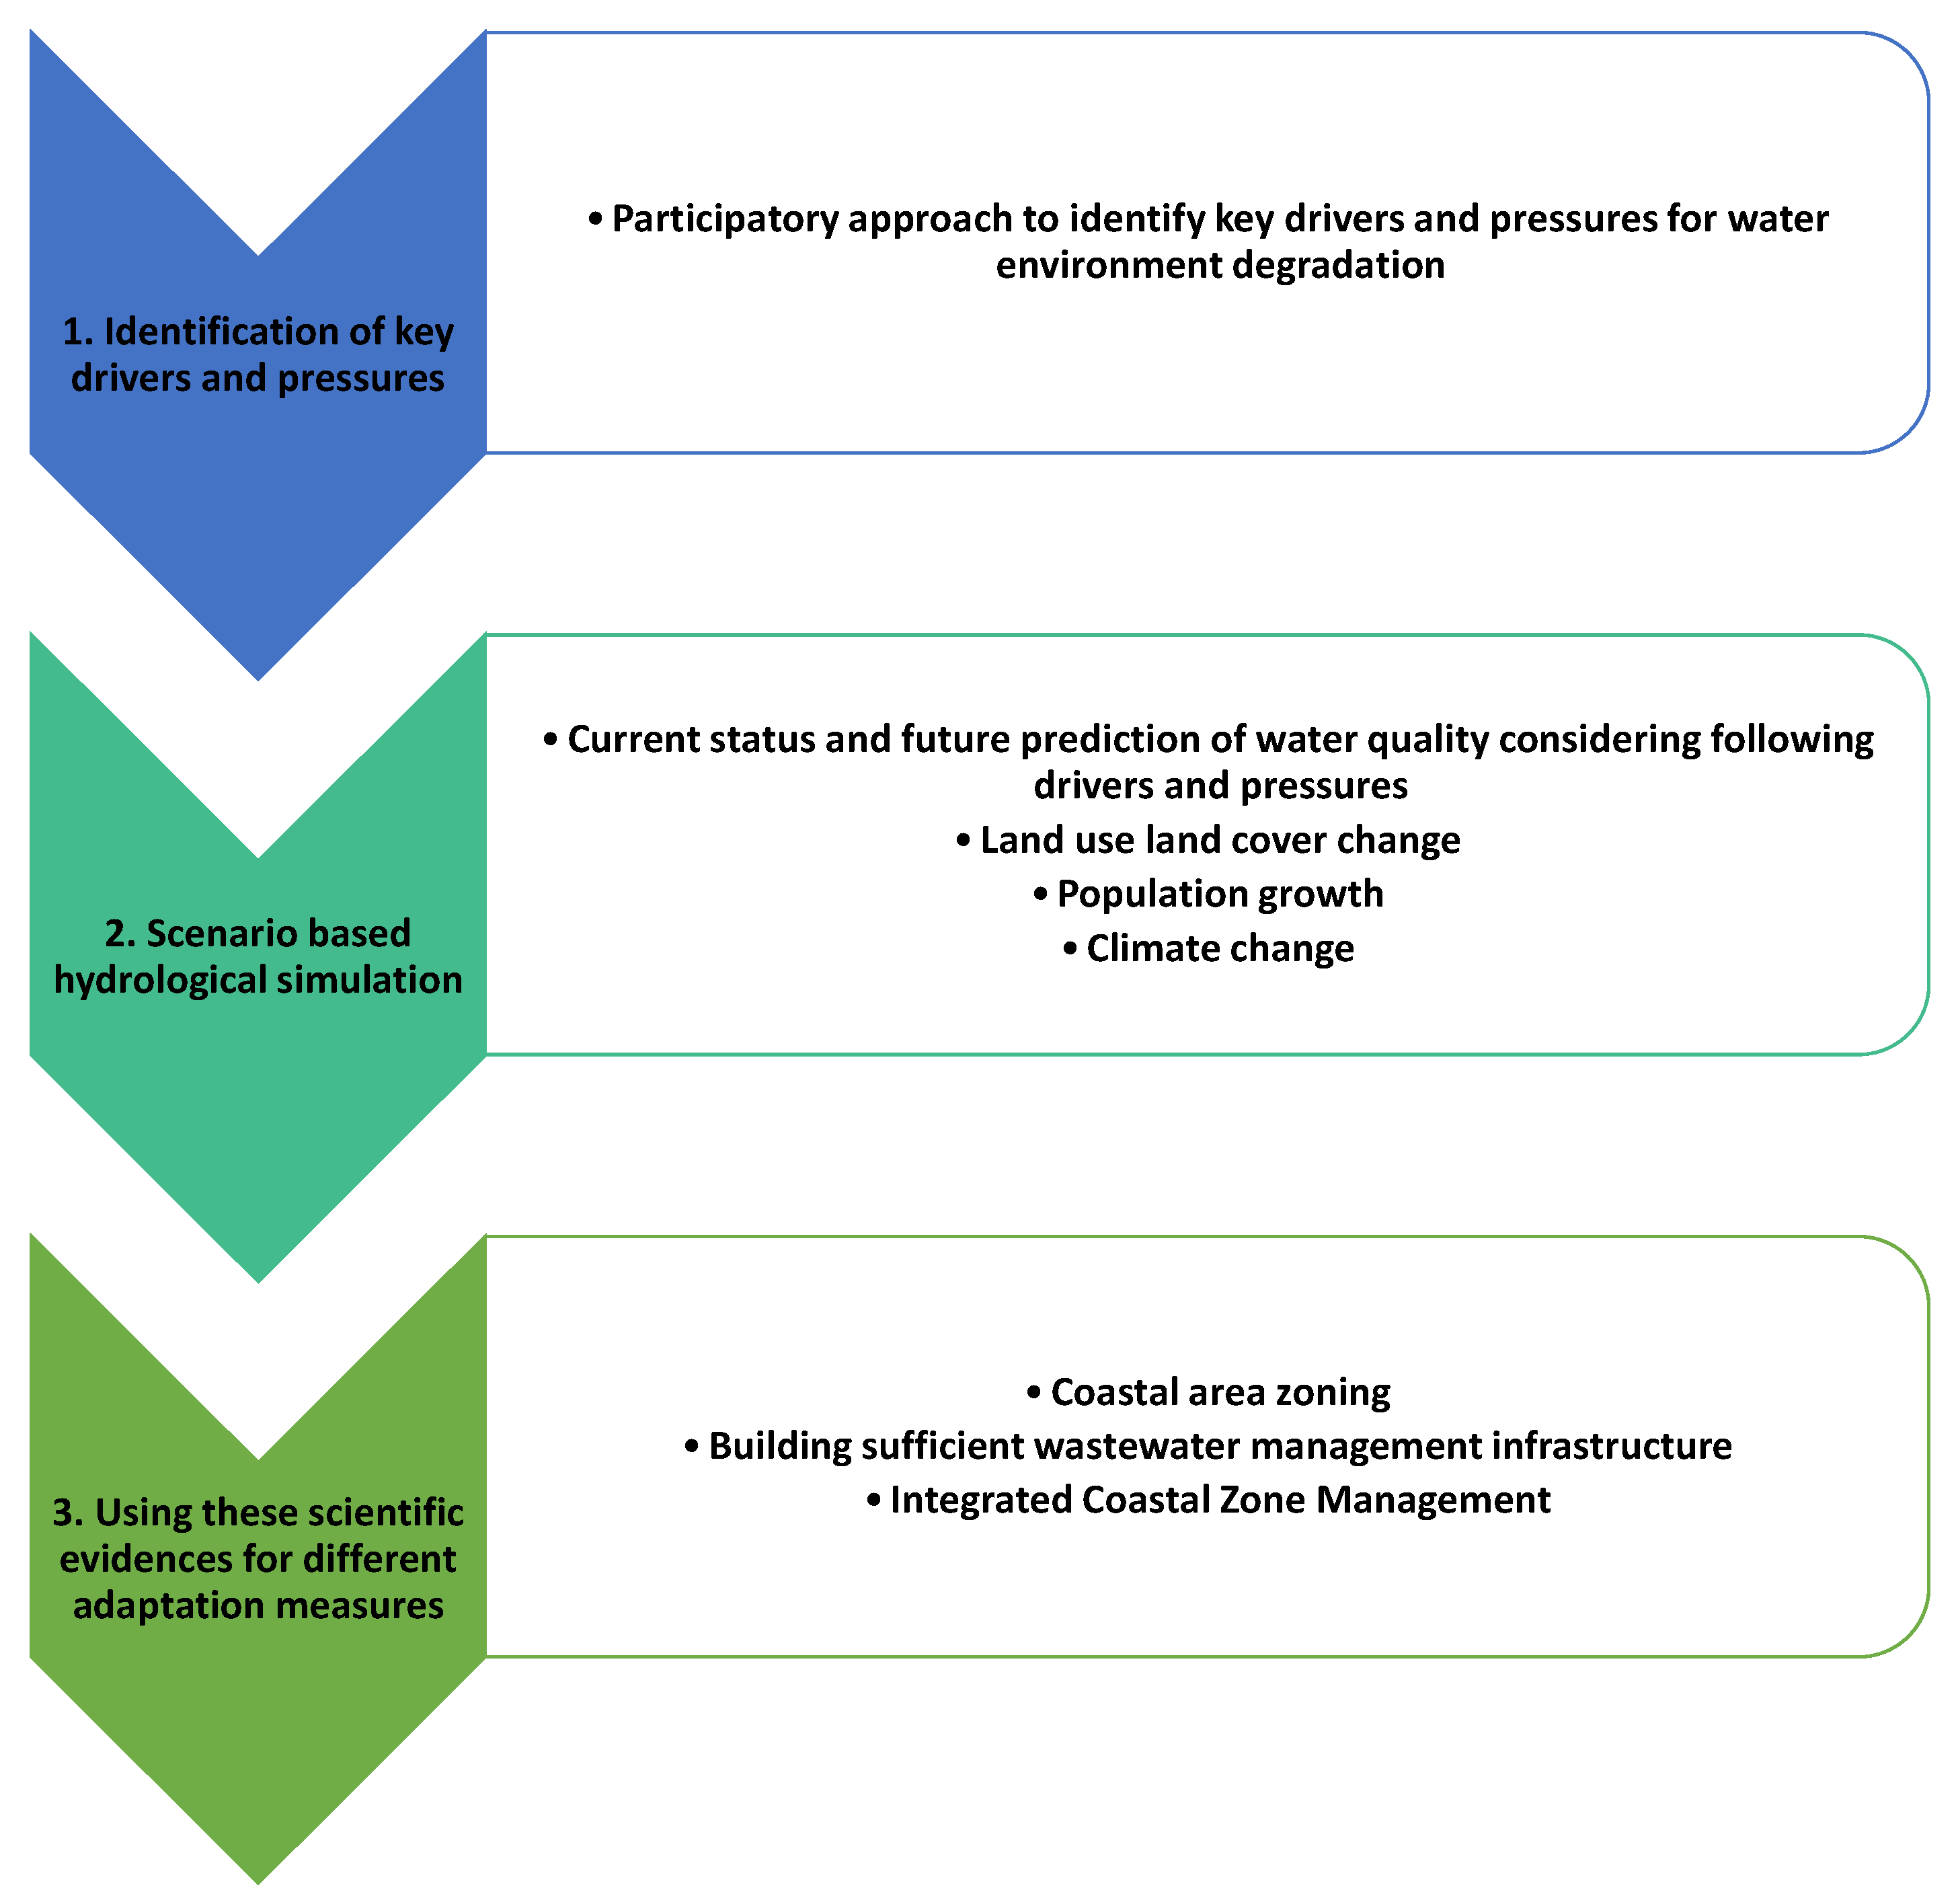
Widespread urban expansion around the world, combined with rapid demographic and climatic changes, has resulted in serious pollution issues in many coastal water bodies. To help formulate coastal management strategies to mitigate the impacts of these extreme changes (e.g., local land-use or climate change adaptation policies), research methodologies that incorporate participatory approaches alongside with computer simulation modeling tools have potential to be particularly effective. One such research methodology, called the “Participatory Coastal Land-Use Management” (PCLM) approach, consists of three major steps: (a) participatory approach to find key drivers responsible for the water quality deterioration, (b) scenario analysis using different computer simulation modeling tools for impact assessment, and (c) using these scientific evidences for developing adaptation and mitigation measures. In this study, we have applied PCLM approach in the Kendrapara district of India (focusing on the Brahmani River basin), a rapidly urbanizing area on the country’s east coast to evaluate current status and predict its future conditions. The participatory approach involved key informant interviews to determine key drivers of water quality degradation, which served as an input for scenario analysis and hydrological simulation in the next step. Future river water quality (BOD and Total coliform (Tot. coli) as important parameters) was simulated using the Water Evaluation and Planning (WEAP) tool, considering a different plausible future scenario (to 2050) incorporating diverse drivers and pressures (i.e., population growth, land-use change, and climate change). Water samples (collected in 2018) indicated that the Brahmani River in this district was already moderately-to-extremely polluted in comparison to the desirable water quality (Class B), and modeling results indicated that the river water quality is likely to further deteriorate by 2050 under all of the considered scenarios. Demographic changes emerged as the major driver affecting the future water quality deterioration (68% and 69% for BOD and Tot. coli respectively), whereas climate change had the lowest impact on river water quality (12% and 13% for BOD and Tot. coli respectively), although the impact was not negligible. Scientific evidence to understand the impacts of future changes can help in developing diverse plausible coastal zone management approaches for ensuring sustainable management of water resources in the region. The PCLM approach, by having active stakeholder involvement, can help in co-generation of the coastal management options followed by open access free software, and models can play a relevant cost-effective approach to enhance science-policy interface for conservation of natural resources.

1. Introduction

Interactions between the land, ocean, and atmosphere in the coastal zone makes it highly dynamic in terms of structure and functioning [1]. Due to the high productivity of coastal areas, they are also among the most exploited and threatened geomorphic units and ecosystems on the earth [2]. The ease of access and abundant resources of coastal zones attracts diverse anthropogenic interferences, and because of the complexity of coastal zone management, has resulted in the misuse and abuse of these sensitive ecosystems [3]. More than 60% of the global population lives in coastal areas and low-lying deltaic zones. Hence, it is imperative to monitor the effects of diverse drivers affecting water quality in coastal areas [4]. Water security is key to ensuring and developing the overall resilience of coastal communities, where water security refers to the capacity of a population to safeguard sustainable access to adequate quantities of acceptable quality water for sustaining livelihoods, human well-being, and socio-economic development, as well as for ensuring protection against water-borne pollution and water-related disasters, and for preserving ecosystems in a climate of peace and political stability [5,6].
There is significant evidence that major drivers of change in coastal waterbody zones include rapid population growth, urban expansion/industrialization along the coastline, and climate variability (e.g., changing frequency and intensity of extreme weather events) [7,8]. Cumulative impacts of natural and anthropogenic activities can drive changes in the land-use/land cover in coastal zones, which in turn affects the services provided by the local ecosystems (e.g., their capacity for water provisioning and regulating surface water and groundwater) [9,10]. These key factors can cause a negative effect on the coastal ecology and economy of coastal communities, leading to eutrophication, contamination of seafood, land subsidence and/or salinization of underground aquifers, building up of solid wastes including non-biodegradables such as plastics, and chemical contamination from industrial and agricultural products such as pesticides and fertilizers [11,12,13,14,15,16]. The situation is further exacerbated by the lack of water governance and inadequate infrastructure in many developing countries [17,18]. Recognizing these concerns, the United Nations Sustainable Development Goals (SDGs) highlight the necessity of clean water for achieving different goals related to the environment (e.g., Goal 14, Life below water; Goal 15, Life on Land) and human well-being (e.g., Goal 6, Clean water and sanitation, Goal 12, Responsible consumption and production, Goal 13, Climate Action, Goal 2, Zero hunger) [19].
Sustainable management of the coastal zone requires accurate information on the various aspects that affect it, e.g., information on the local coastal habitats, coastal processes, natural hazards and their impacts, water quality, and living resources [1]. Effective management practices also depend on indigenous/local knowledge and suitable responses from concerned government agencies. For water resources, understanding how water and solutes move within and across the land-sea interface, and groundwater-freshwater interactions, are necessary for managing resources in a way that promotes ecological, societal and human well-being [20,21]. However, most coastal water resource management studies have focused on groundwater salinization and contaminant transport in the coastal aquifers, while assessing the status quo of river water quality from inland areas is still not well explored, especially for developing and underdeveloped countries [22]. This is one reason why hydrogeological/hydrogeochemical studies of coastal aquifers (e.g., to decipher their hydrological processes) have received greater scientific and societal interest in recent years.
Coastal aquifers, especially shallow ones, often experience intensive saltwater intrusion because of natural and anthropogenic processes [23]. A summary of key drivers affecting coastal aquifers, their effects, and counter measures to manage these precious resources is shown in Figure 1. One of the major requirements of planning coastal protection works is addressing the processes of erosion, deposition, sediment transport, flooding, and sea-level changes that is continuously altering the shorelines [24]. Along these lines, Jha et al. [25] demonstrated the application of a coastal water quality index (CWQI) and Geographical Information System (GIS)-based overlay mapping technique as one of the effective integrated approaches that is widely used to demarcate healthy and polluted areas. Keesstra et al. [26] mentioned holistic and integrated land-use management practices that can be used to achieve and localize SDGs related to water, food, health, and climate change. More importantly, water governance has an important role to play in all inclusive, holistic/integrated land-use management. Water governance is a particularly important issue when it comes to coastal aquifer systems because of their vulnerability to saltwater intrusion. A summary of the list of key drivers affecting coastal aquifers, their effects, and counter measures to manage these precious resources is shown in Figure 1.
India, with its long coastline, is endowed with some of the world’s most extensive and diverse mangrove ecosystems. Management of these ecosystems faces several challenges including lack of awareness of their benefits, poor governance, and inadequate management policies [27]. Hence, it is necessary to integrate local socio-economic understanding with the knowledge database of the coastal zone to appropriately understand the impact of anthropogenic activities and climate vulnerabilities [27,28,29]. The government of India has implemented Integrated Coastal Zone Management (ICZM) all across its coastal states for resource conservation, sustainable development, and pollution control. However, several constraints, ranging from insufficient scientific information, lack of guidelines, lack of sufficient baseline information and weak social basis, ambiguity of project activities, poor local governance, rapid economic reforms, lack of scientific forecasting, undue favors to coastal zone development followed by ineffective implementation, and enforcement are foreseen threats to these sensitive ecosystems [30].
The east coast of Odisha in India is facing particularly diverse drivers of change in the coastal zone viz., shrimp culture, aquaculture, typhoons/cyclones, sea-level rise, climate change, changes in river water quality and quantity, and land-use land cover changes, resulting in damage to its important mangrove ecosystems [31]. Kadaverugu et al. [27] highlighted changes in the local hydrological regime (i.e., reduction of clean water from upstream areas) as the most important factor, which will determine the salinity exposed to the mangroves. Additionally, this area is very important considering the Bhitarkanika National Park and many adjoining high value ecosystems host several mangrove species, saltwater crocodiles, and diverse floral and faunal components of high conservation value. Therefore, it is very important to monitor the river water quality of Odisha at regular intervals to develop science-based coastal management options in a timely manner. However, on the other hand, this area is very poorly investigated and hence calls for comprehensive scientific attention on an urgent basis.
Considering this information need, in this study we used the Participatory Coastal Land-Use Management (PCLM) approach to design future scenarios and simulate future water quality in Odisha, with the goal of aiding water resource management planning of the Brahmani River in the coastal aquifers of Odisha. The PCLM approach integrates scientific evidence for upscaling policy interventions, especially from Integrated Coastal Zone Management (ICZM) programs, and helps in developing appropriate preparedness plans and mitigation measures against the changes the region is facing. Such successful use of PCLM approach for water resource management and making land use more resilient to rapid global change in the case of the Philippines is well documented in Brian et al. [32].

2. Study Area

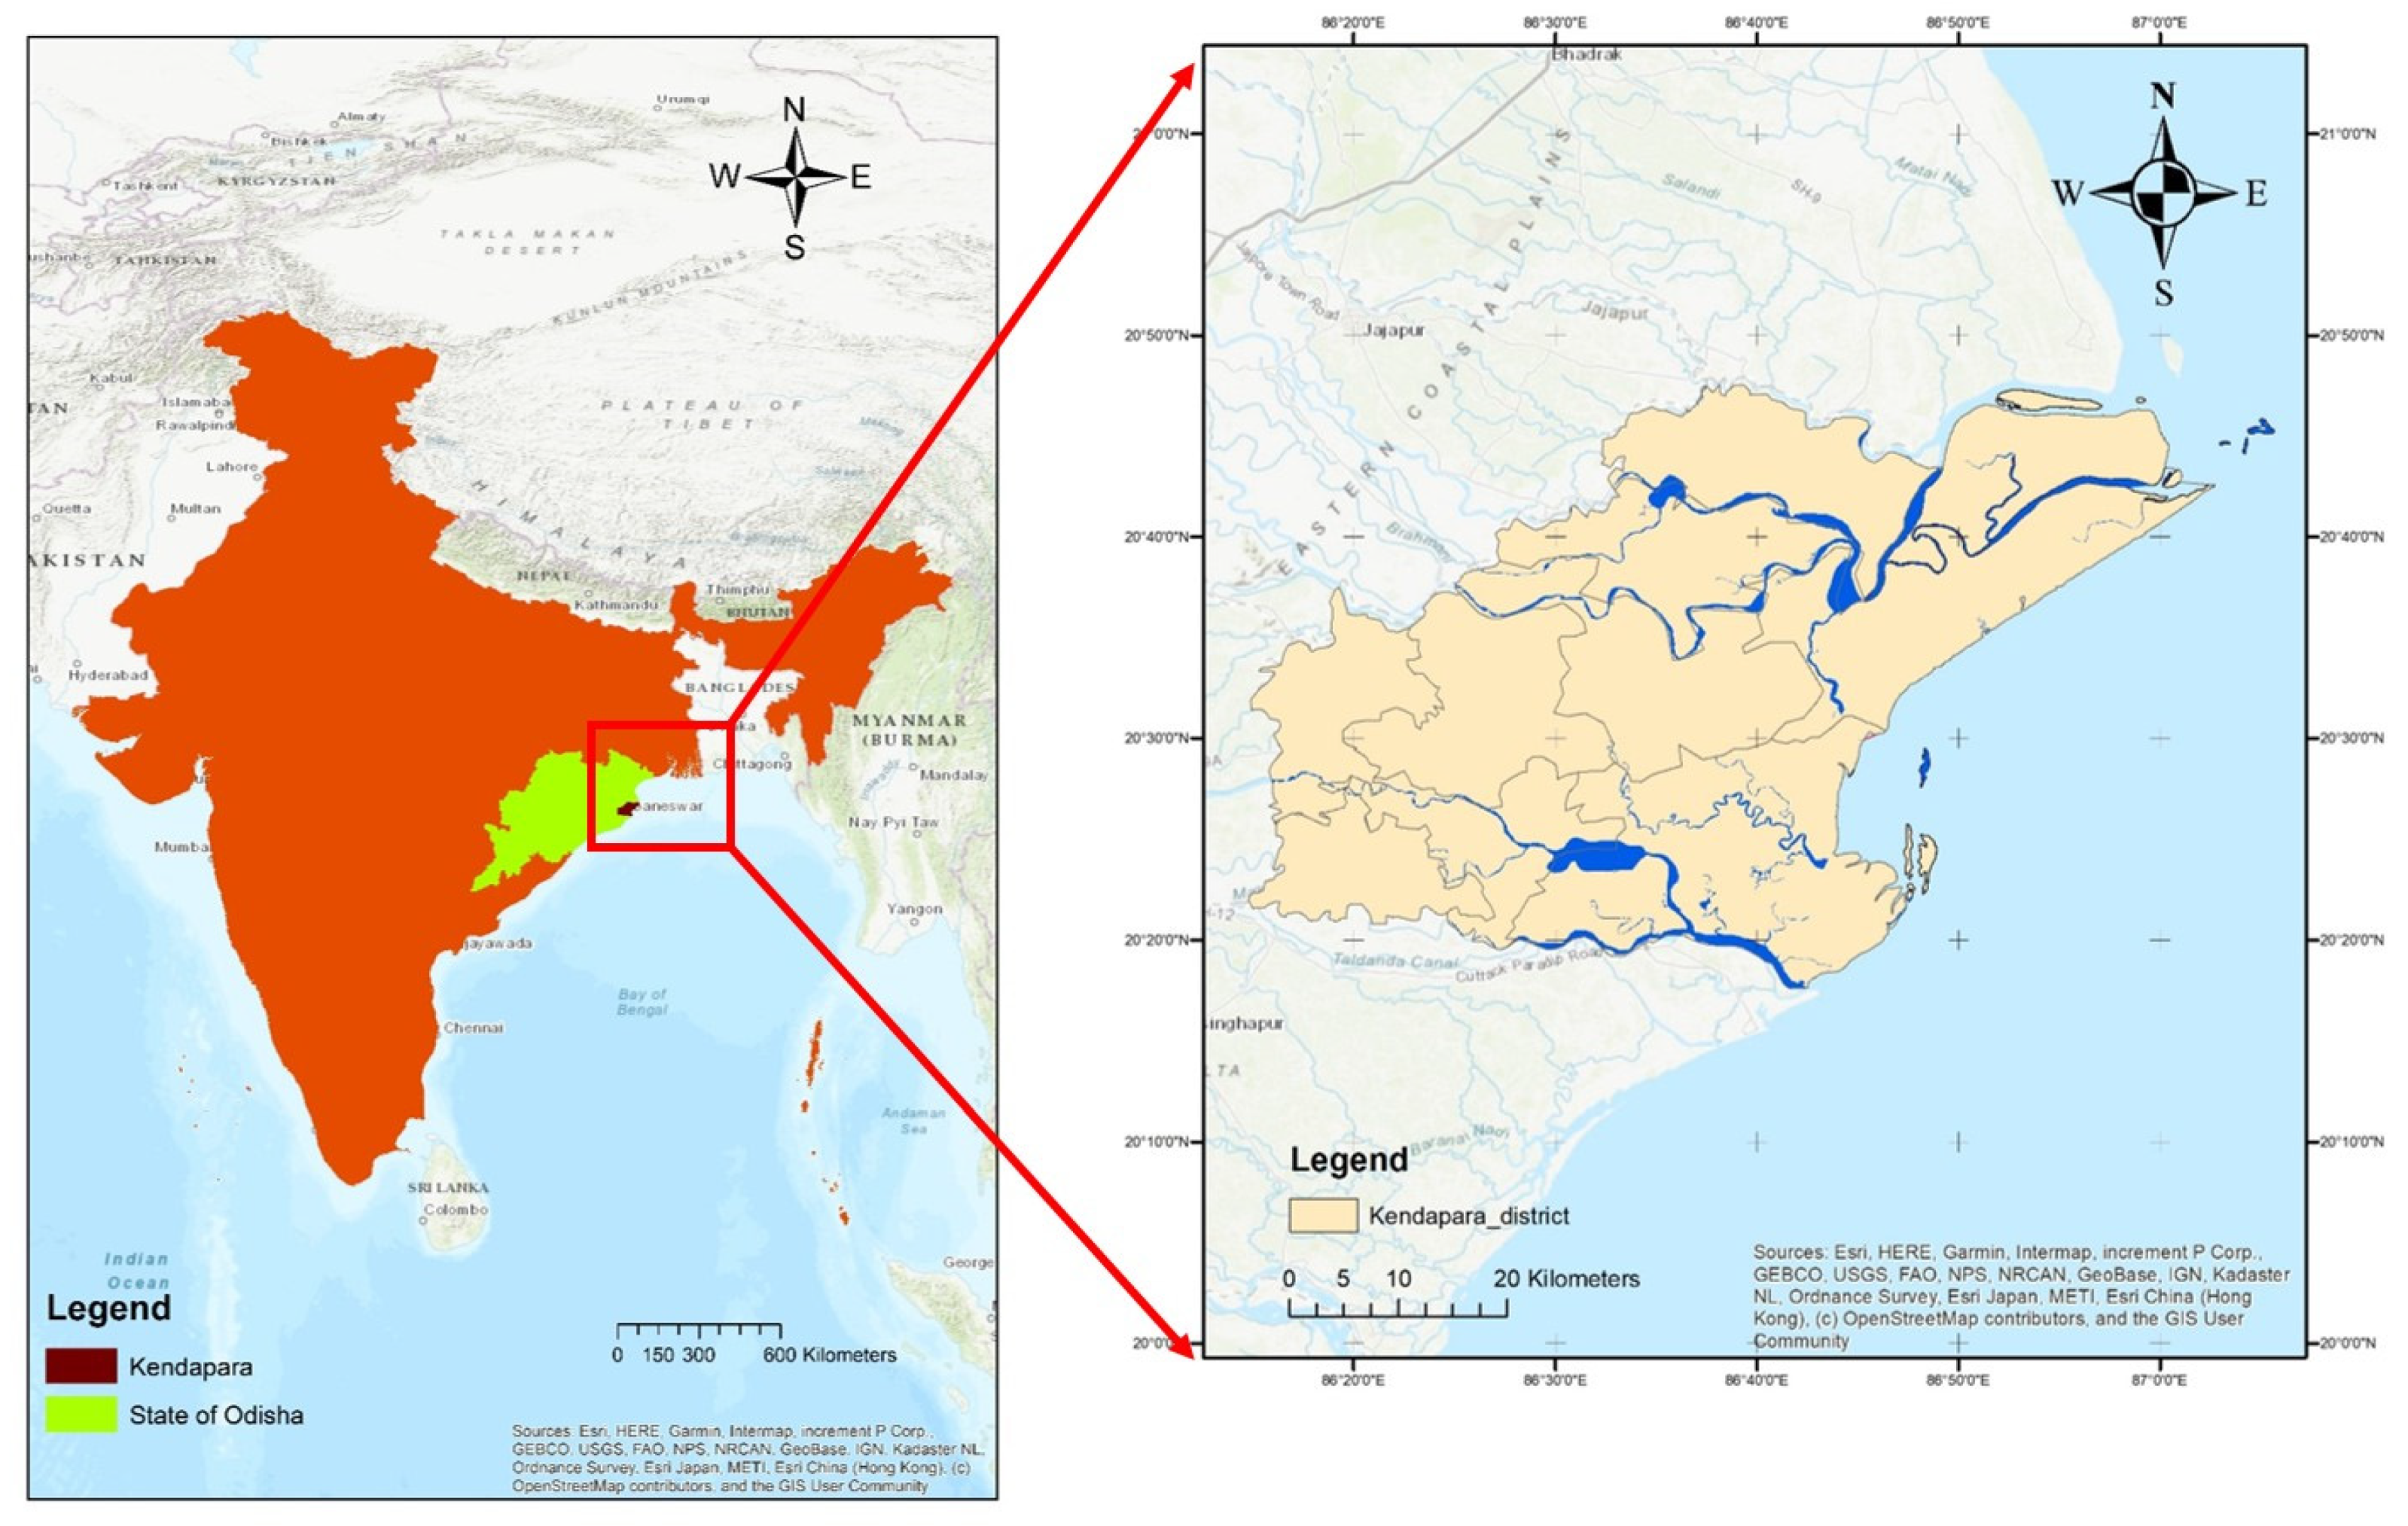
Kendrapara is one of the densely populated districts of India’s Odisha state, and is situated on the central coastal plain zone of the state, on the eastern coast of India (Figure 2). The district has an area of 2644 km2, and topographically, the region is flat, with an average elevation of 13 m above the mean sea level. The annual average rainfall of the region is 1556 mm which is realized in around 53 days, and nearly 80% of rainfall occurs in the monsoon season between June to September [33]. The region experiences a tropically hot and humid climate with the hot summers and cold winters. Summer is from March to May with the maximum temperature of 42.04 °C, while winter is from October to February with the minimum temperature of 12.8 °C.
The rivers Mahanadi, Brahmani, and Baitarani, along with their distributaries, define the drainage systems of the district, majorly comprising anastomosing drainage patterns [34]. Other rivers in the district include Karandia, Gobari, Brahmani, Kani, Baitarani, Birupa, Kharasrota, Paika, Chitroptala, and Hansua [35]. The delta region formed by the rivers Brahmani and Baitarani has underlain alluvial deposits, which resulted in fertile agricultural land. The soils in the district are predominantly of tertiary and recent alluvium deposited by the rivers. The thickness of alluvium of the Mahanadi delta is more than 600 m [36]. The coastlines of the district are dominated by Aeolian and sandy soils especially in the Rajnagar and Rajkanika blocks of the district. In general, 50% of the soil type is of entisols followed by inceptisols, water bodies, and mudflats, and the geographical area has a slope within 0–3% [37].
The Kendrapara district has a population of about 1.4 million as per the 2011 census [38], with a density of 545 people per square km. Nearly 94% of the population resides in rural areas of the district, and agriculture is the mainstay of the locals with 70% dependence on agriculture. Nearly 63% of the geographical area is under-cultivated with a cropping intensity of 194% [37]. Despite having enough water resources, this region is facing waterlogging and increasing salinity of cropland as the major concerns related to agriculture, mainly due to a lack of necessary irrigation structures, and proper management solutions in place [37]. Additionally, the region experiences frequent flooding from the dense network of rivers due to the geographical disadvantage owing to flat terrain and high rainfall intensity [35,37]. The district also has rich groundwater resources that fall under the safe category according to the Central Ground Water Board classification, having an overall stage of the groundwater development of 52.97% [38]. The pre-monsoon groundwater-level depth varies in the range of 1.65 to 5.43 m below ground level, while the post-monsoon level varies from 0.11 to 4.90 m below ground level [38]. The Brahmani River is very important for the Kendrapara district considering its invaluable contribution for water demand for different industries especially mining industries in the upstream region as well as managing rich species diversity among mangrove forests near the downstream area. Therefore, understanding the current status as well as future projection of river water quality is very crucial for sustainable socio-economic development.

3. Materials and Methods

The methodology adopted for this work is shown in Figure 3.

3.1. Key Informant Interview

First, to identify key drivers and pressures which affect water quality in this study area, key informant’s interviews (KII) were conducted with 18 resource persons who hold strong knowledge of the study area, including representatives from the national and state water ministry (n = 3), the agriculture ministry (n = 3), NGOs (n = 4), community members (n = 2), scholars and researchers (n = 6) (Figure 4). They were asked to summarize the different drivers and their intensity, which are affecting the land use of coastal zones. Here, we have employed the STEEP (sociological, technological, economical, environmental, and political factors) approach for driver classification through impact-uncertainty matrix [39]. At first, they discussed the main drivers and then, all of the informants prioritized different factors according to their level of impact and uncertainty on water resources on a Likert scale. For impact, level ‘5’ corresponded to the highest impact and ‘1’ represented the lowest impact, respectively. For uncertainty, level ‘1’ corresponds to very certain whereas level ‘5’ corresponds to highly uncertain. Previously, this method has been successfully used for scenario planning in coastal areas (e.g., Dasgupta et al. [39]).
The analysis of the interviews and respective scoring indicated that among different drivers, sociological factors (i.e., population growth, awareness about water management, etc.) were the most significant, while political factors (like absence of law pertaining to freshwater exploitation, land allocation for aquaculture, etc.) were the least significant. The order for different drivers found was sociological > environmental > technological > economical > political. Digging further into the different key components of these factors, it was found that population growth, land-use land cover change, and climate change are the key factors responsible for water stress in this region.
Hence, we set up a numerical model to quantify the current status as well as future prediction of water resources using different scenario analyses.

3.2. Hydrological Model

3.2.1. Model Set-Up

In this study, the WEAP model was used to simulate streamflow and river water quality variables. The reason to select WEAP model for this simulation is because it is freely available to the developing nations and hence, its replicability by the local stakeholders will be easier. In addition, WEAP model functionality enables to generate various scenario building, necessary to answer “what-if” questions for the policy and decision makers. The schematic diagram for the problem domain was developed using different shapefiles such as administrative boundary of the study area and drainage network (developed with ArcGIS), and inbuilt links and nodes from WEAP. Here, the whole study area is divided into smaller catchments based on the topographical, hydrological, and confluence points, and climatic characteristics of the river basin. Different hydrological modules, namely rainfall-runoff (simplified coefficient method), irrigation demands only (simplified coefficient method), and rainfall-runoff (soil moisture method) are available in the WEAP platform to simulate various components of the hydrological cycle including the catchment’s potential evapotranspiration, infiltration, and streamflow. However, based on the data availability, the rainfall-runoff method (simplified coefficient method), is used for the catchment simulation in this study [40].
The Streeter–Phelps model within WEAP was used to estimate pollution concentrations in water bodies. Simulation of oxygen balance in a river within this model is governed by two processes, i.e., consumption by decaying organic matter and reaeration induced by an oxygen deficit. The removal of BOD from water is a function of water temperature, settling velocity, and water depth as shown by Equations (1) and (2):
B O D f i n a l = B O D i n i t e x p k r B O D L U
k r B O D = k d 20 1.047   ( t 20 ) + v s H
where BODinit = BOD concentration at the top of the reach (mg/L), BODfinal = BOD concentration at the end of the reach (mg/L), t = water temperature (in degrees Celsius), H = water depth (m), L = reach length (m), U = water velocity in the reach, ʋs = settling velocity (m/s), kr, kd and ka = total removal, decomposition and aeration rate constants (1/time), kd20 = decomposition rate at reference temperature (20° Celsius).

3.2.2. Data Requirement for Model Set-Up

Future prediction (for the year 2050) of Brahmani River water quality was made using a scenario analysis to assess different possible water management plans. Key datasets used for the modeling were domestic wastewater discharge, past river water quality at different monitoring stations, population, rainfall, temperatures, river cross-section, river length, river discharge, land-use/land cover etc. List of data used to run the model and their sources is shown in Table 1.
For water quality parameters, we have used biochemical oxygen demand (BOD) and Total coliforms collected at three points on the Brahmani River. Data for both water quality parameters were analyzed by the Odisha water resources board following the standard method of water quality analysis from APHA [48]. The reason to choose these two parameters is that this was the only available dataset at a regular basis for the simulation period. The principal reasons for selecting sampling locations were the accessibility of water samples, saving cost, and observing the effect of urbanization at approximately equidistant throughout the river length passing through the watershed. For hydrological modeling, three catchment areas in the Brahmani River watershed, which experienced inter-basin transfers, were considered. Pollutant transport from a catchment accompanied by rainfall-runoff is enabled by ticking the water quality modeling option. During non-rainy days, pollutants accumulate on the catchment surfaces and reach water bodies through surface runoff.
Regarding future precipitation data, two different Global Climate Models (GCMs) (MRI-CGCM3 and MIROC5) and Representative Concentration Pathway (RCP) (4.5 and 8.5) output were used after downscaling and bias correction. We have evaluated the average value of the change in monthly average precipitation for both RCP 4.5 and 8.5 to evaluate the climate change on water quality. The whole study area is divided into nine demand sites for estimating the effect of population growth and its associated domestic wastewater discharge on river water quality status. Primarily, these demand sites denote the population of different administrative units (blocks in this case) lying on either side of the Brahmani River within our study area. Future population in these demand sites were estimated by ratio method using UNDESA projected growth rate [42]. In the absence of exact information on the total domestic wastewater production, the daily volume of domestic wastewater generation per person considered for this study was 130 L [49]. Land- use land cover map was generated using LANDSAT 8 OLI satellite image and future map was generated using land change modeler; detailed information of this work was submitted for a peer-reviewed article and is under review at present [50]. Simulated water quality result is compared with Class B, i.e., class for outdoor bathing, a standard set for surface water quality desired by the state of Orissa. The local government set a goal to achieve Class B for the ambient water quality. Besides, it is relatively easier to achieve compared to Class A, i.e., water for drinking purposes. For Class B, the standard value for BOD and Total coliform are <3 mg/L and <500 CFU/100 mL respectively. The whole simulation process is divided into three phases: (a) model set-up and data input, (b) calibration and validation, and (c) future simulation using scenario analysis. The schematic diagram for the model set-up is shown in Figure 5.

4. Results

4.1. Future Prediction of Key Factors Considered for Hydrological Simulation

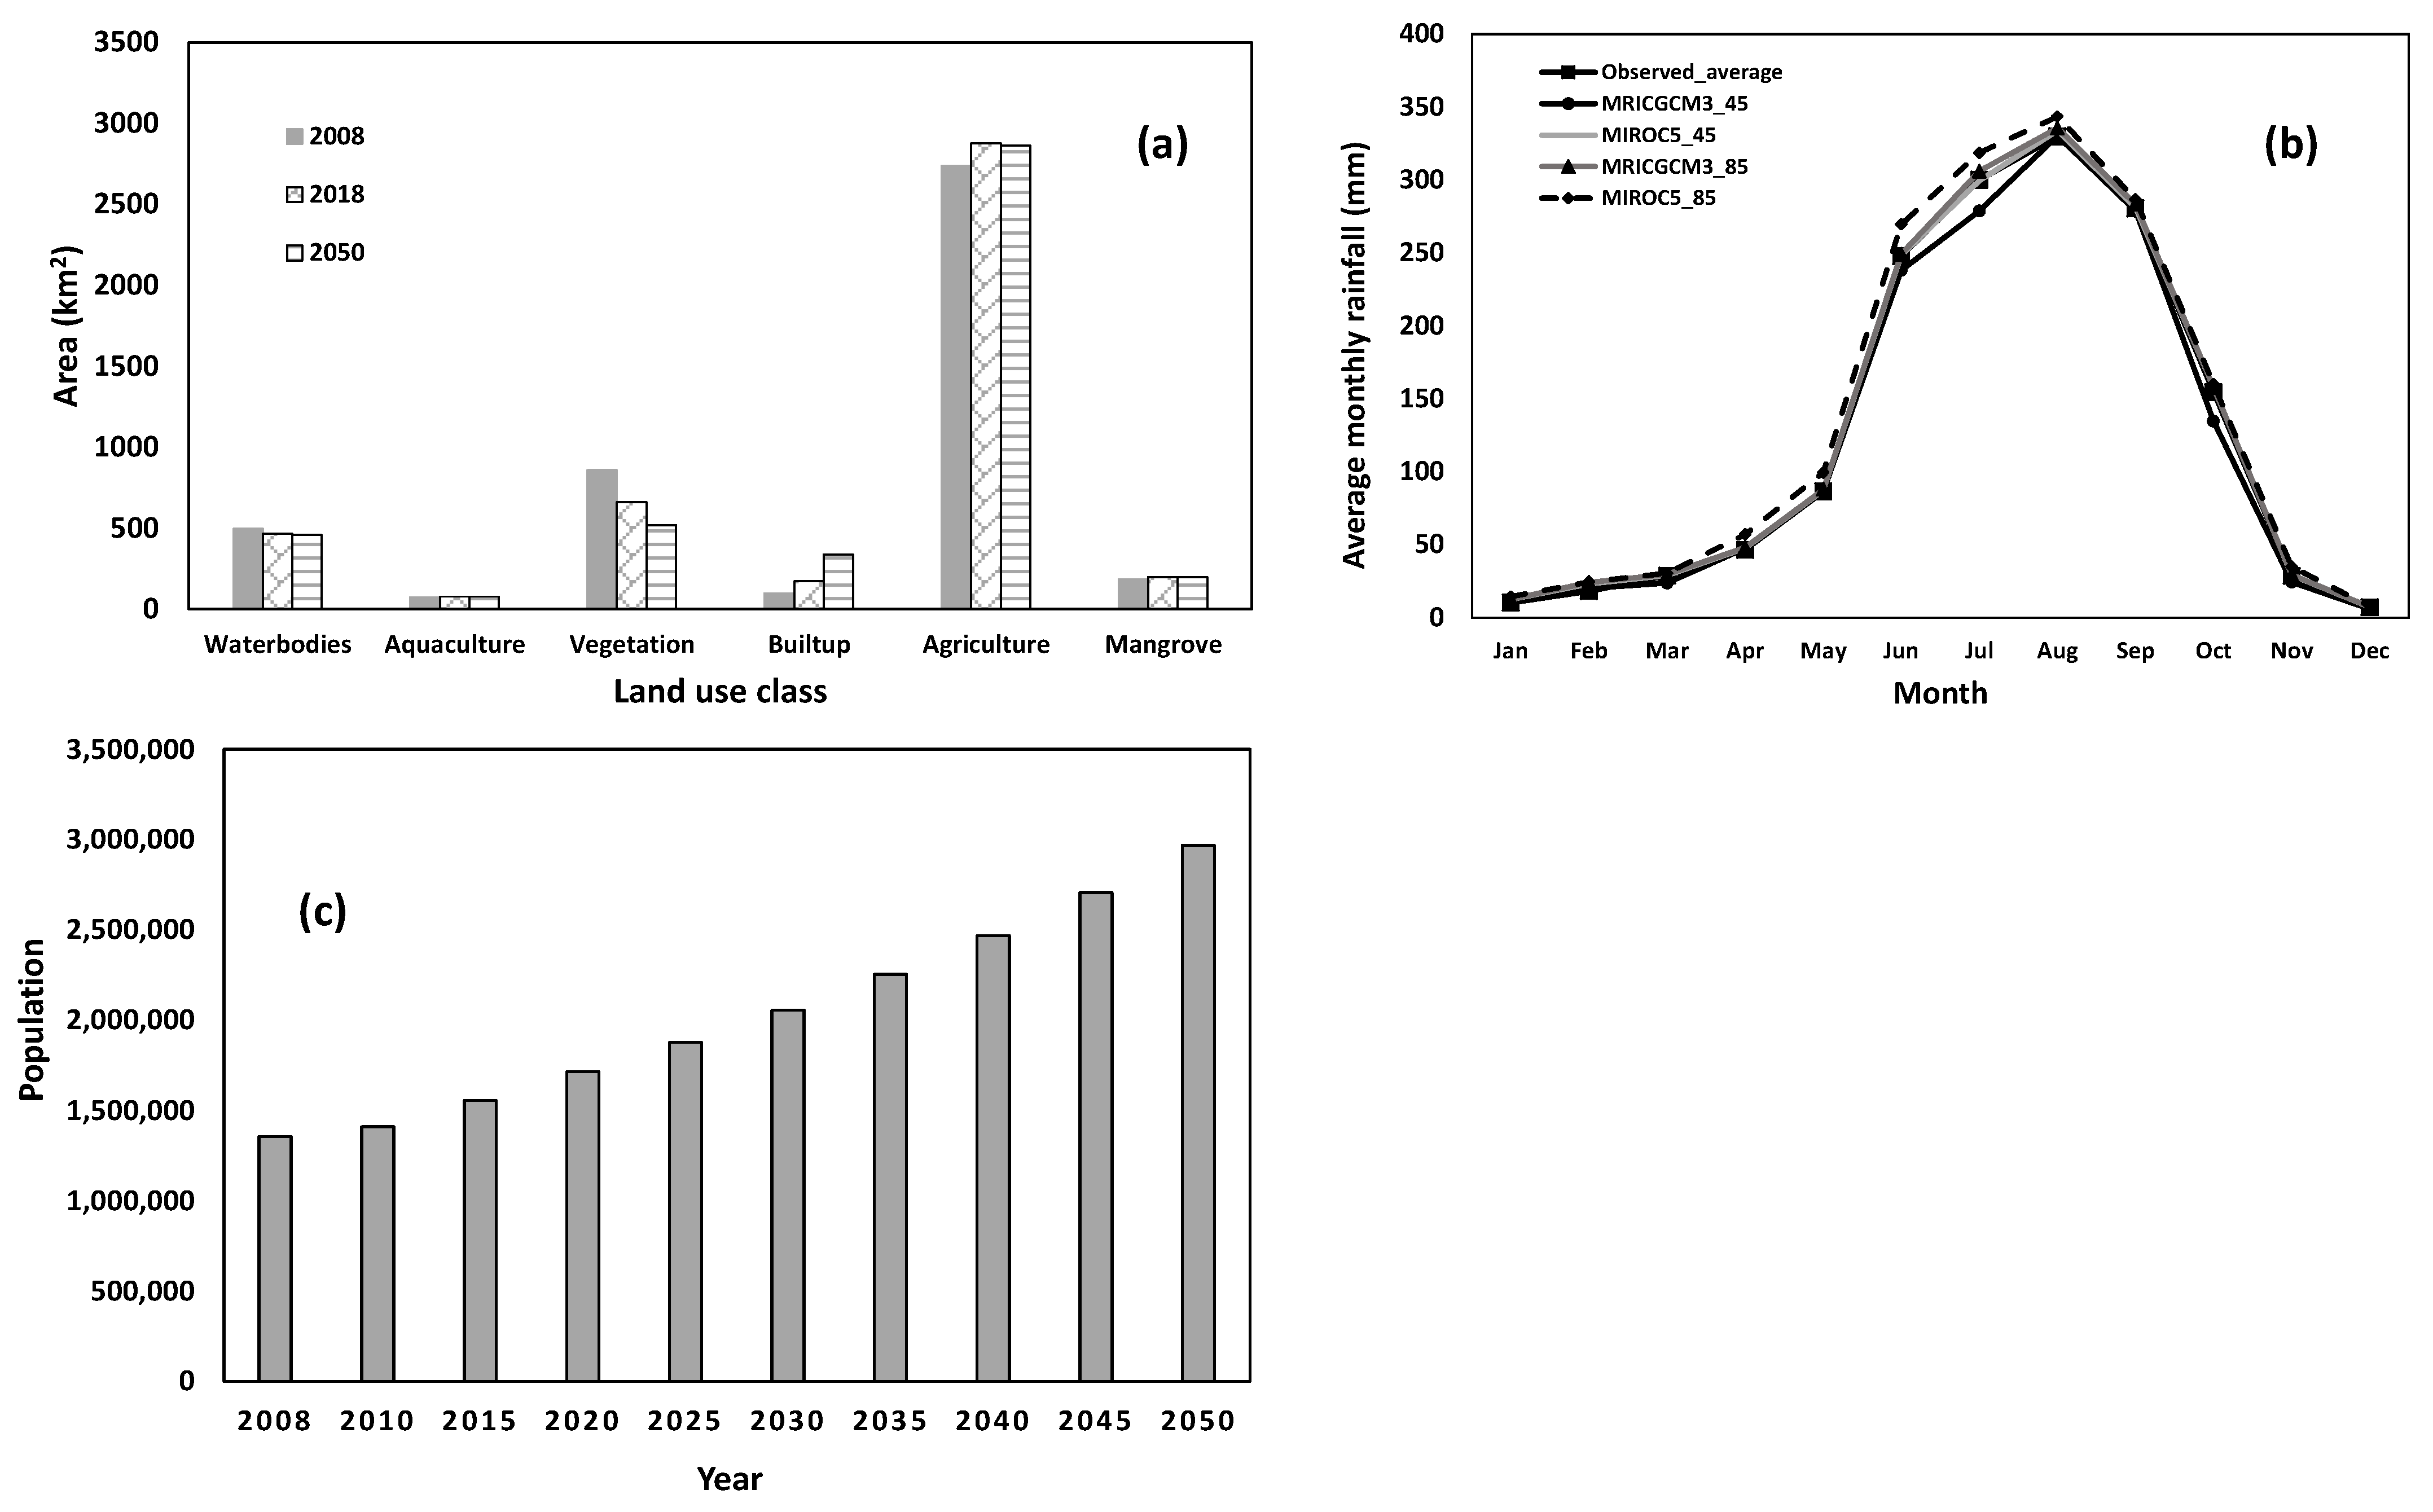
Three key factors, i.e., land-use land cover change, climate change, and population growth were considered for the hydrological simulation. The future values of all the parameters were calculated for the target year 2050 and the result is shown in Figure 6. Figure 6a, showing the result for land-use land cover change, indicates that a significant amount of changes will occur for vegetation and built-up categories. The built-up area will be increased (by 96%) at the expense of a decrease in the area of vegetation (by 22%) mainly. Figure 6b shows the result for comparison between observed and downscaled data for monthly average rainfall using two different GCMs and two RCPs. The annual precipitation projected for future scenarios using the GCM downscaling method is almost the same with the current observed data. However, slight differences in the precipitation values are observed at a monthly scale. In the present study, we have considered these marginal changes in the precipitation values and studied whether they impart any significant variations in the river water quality. Figure 6c shows the result for population projection in the study area using the UNDESA growth rate. Looking at the result, it is found that the population for the year 2050 will be increased by 80% when compared to that of the year 2018.

4.2. Model Performance Evaluation and Future Simulation

The WEAP model performance credibility was tested through calibration and validation of the data. It is essential to check the performance credibility of models, especially complex environmental models before projecting the future scenarios. The whole WEAP module is primarily divided into two parts, i.e., water quality component and hydrological component. In the present study, the model valuation was carried out using the BOD and streamflow information for water quality and hydrological components, respectively. Trial and error method were employed for the model calibration, and the best-fit results were obtained. The variables—effective precipitation and the runoff/infiltration were adjusted in the model simulations to match with the measured monthly stream flow data for the year 2018 (Table 2). The adjusted best-fit values of these variables were 94% and 55/45, respectively. Similarly, the best-fit values for the water quality components—BOD and Total coliform were 2.5 mg/L and 220 MPN/100 mL, respectively.
Results show a significant relation between the simulated and observed values of BOD and streamflow for the years 2018 and 2019, respectively. The reason for selecting 2018 and 2019 for validating BOD and streamflow, respectively, was regular availability of observed data without any gap. The validation of the model in terms of both BOD and streamflow is presented in bar diagrams of Figure 7a,b, respectively. BOD was simulated with a strong correlation with a correlation coefficient (R2) = 0.86 having an average error of around 11% (Figure 7a). Streamflow for the Brahmani River at midstream was also simulated with a significant degree of correlation (R2) = 0.81 with an average error of 13% for most of the months during 2019 (Figure 7b). Once validation is done with a satisfactory result, future water quality simulation was done.
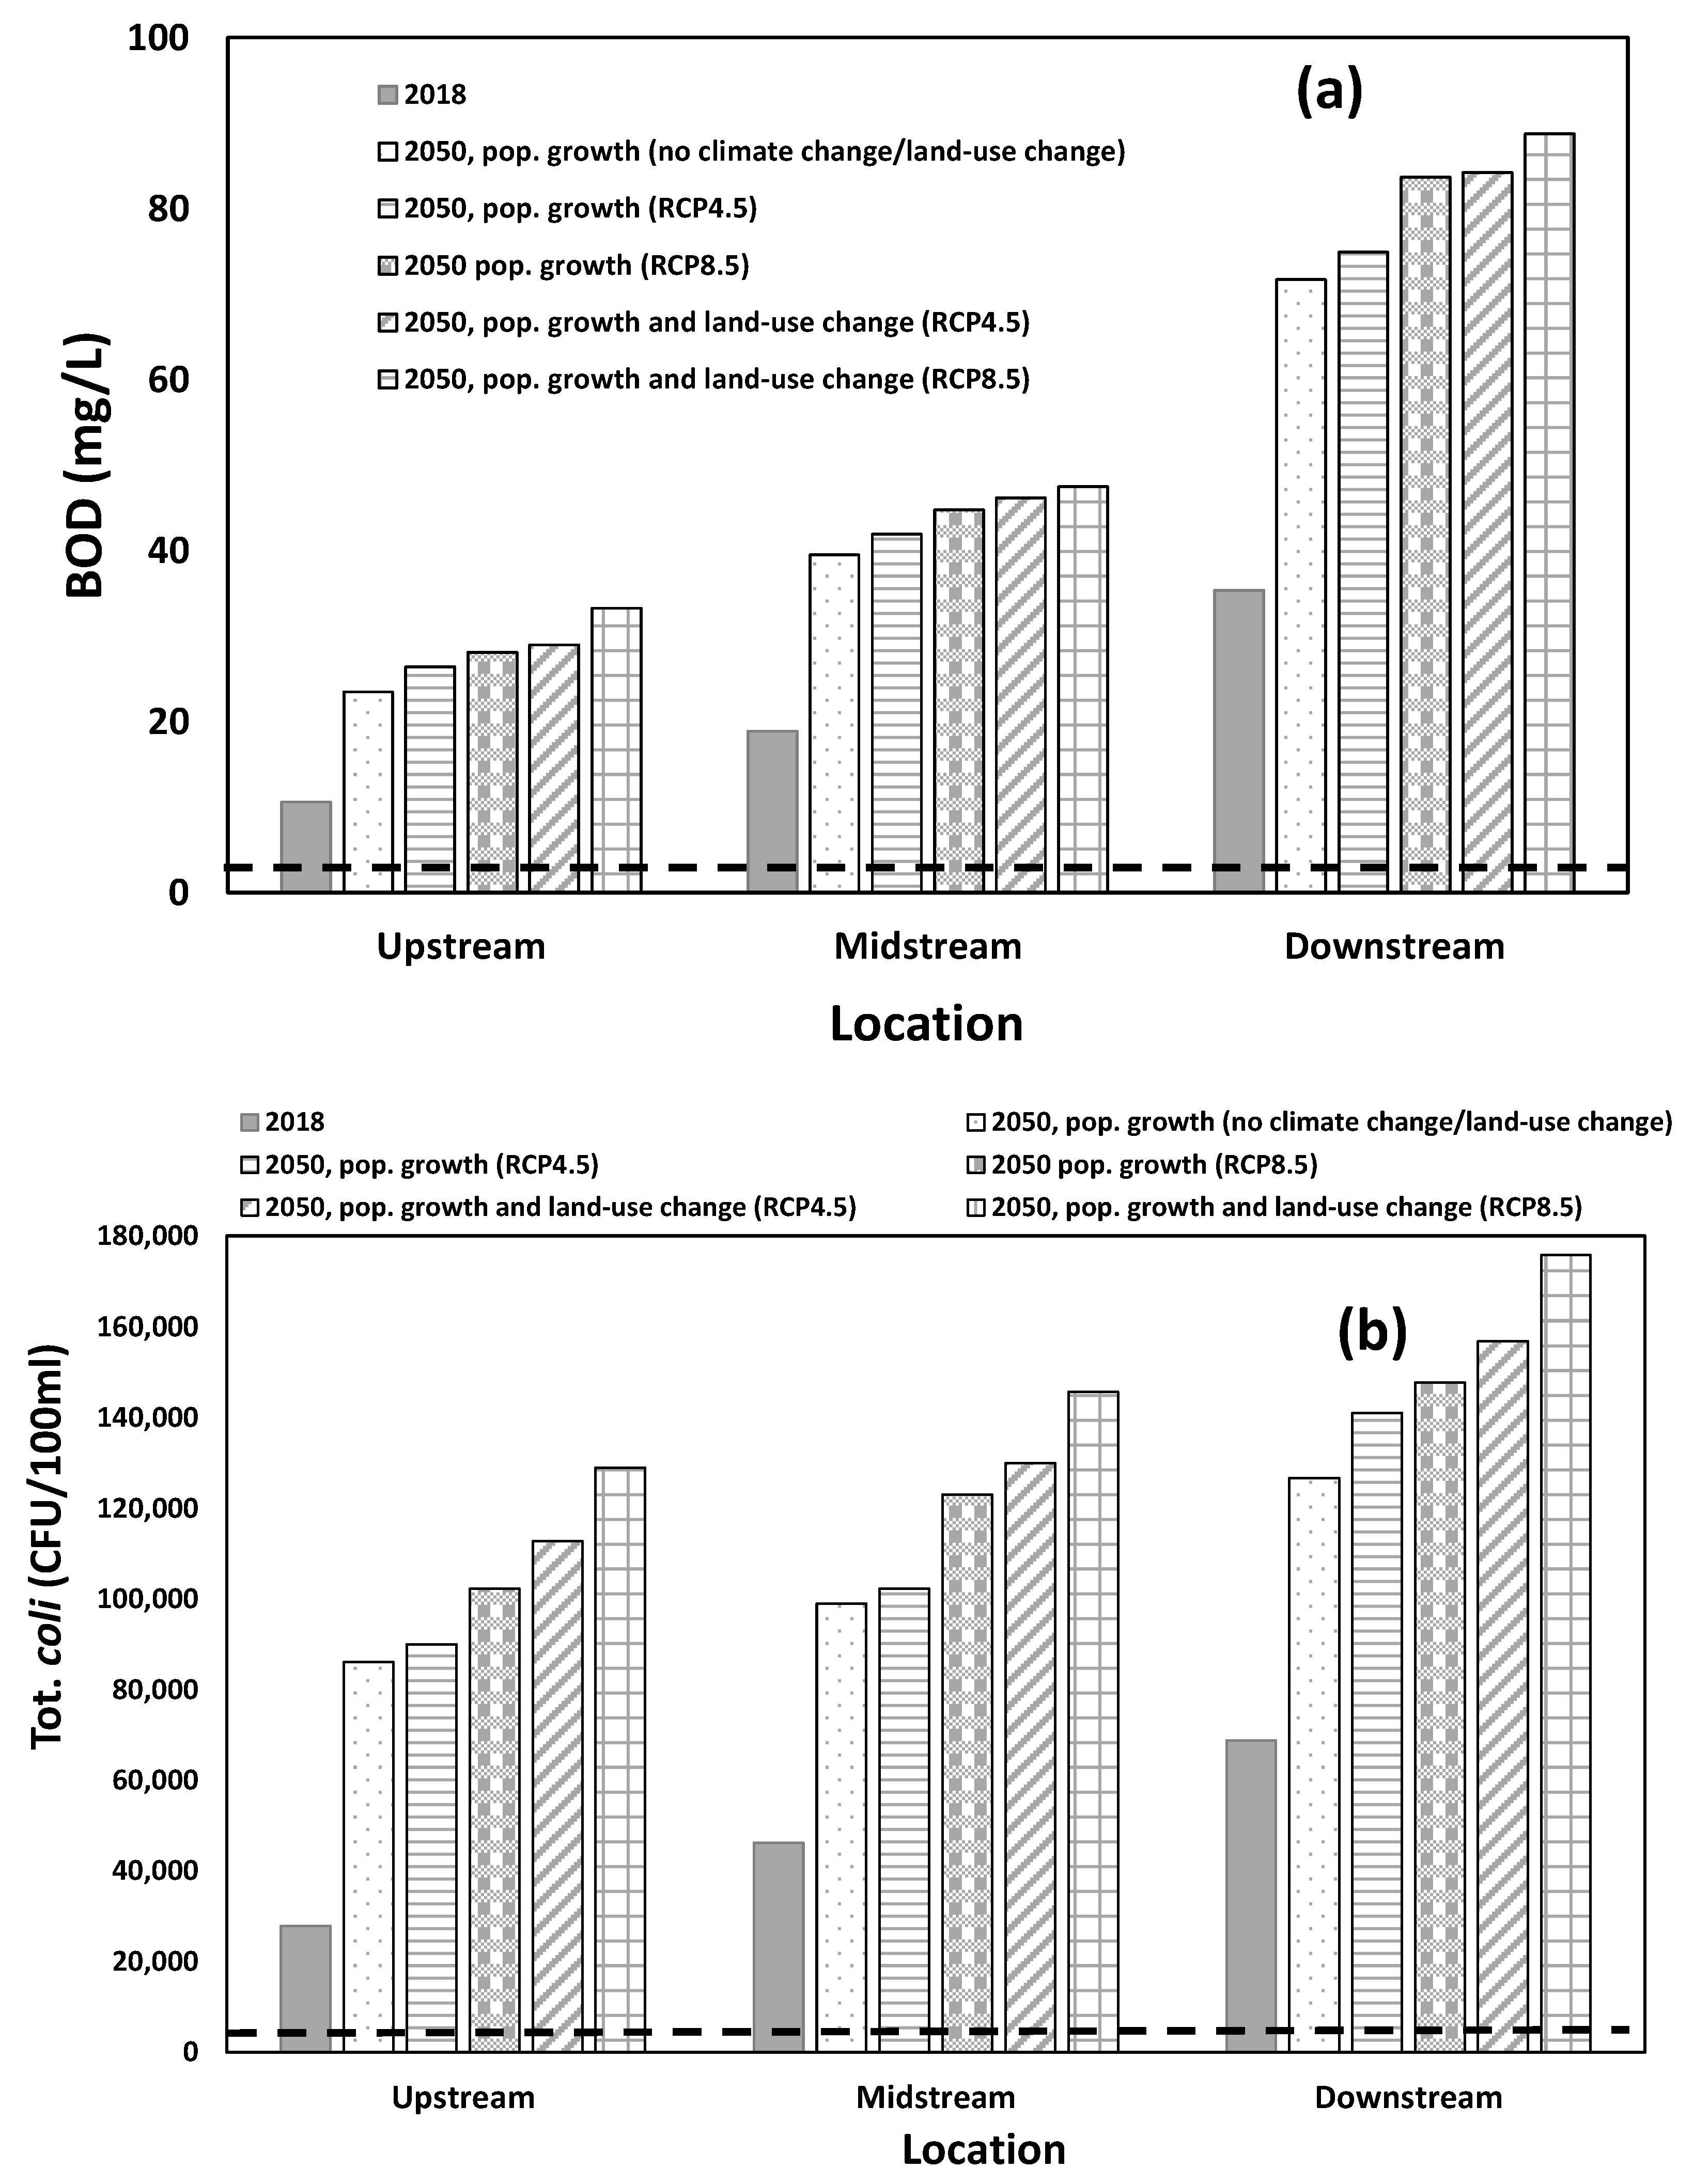
The impact assessment on the river water quality and flow was carried out by considering three main drivers of change viz. population growth, climate change, and land- use land cover change. A combination of these drivers was considered to obtain the following ‘what-if’ situations viz. (a) with only population growth; (b) population growth and with a moderate climate change; (c) population growth with an extreme climate change; (d) combination of population change, moderate climate change and land-use land cover change, and lastly (e) combination of population change, extreme climate change and land-use land cover change. In all these scenarios, the impact on the river was assessed without considering the adaptation measures. The obtained results through hydrological modeling were compared with that of national guidelines (Figure 8) outlined by the Central Pollution Control Board (CPCB) for Class B category of river quality (i.e., swimmable category for which BOD <3 mg/L and Tot. coli <500 CFU/100 mL).
The model simulated concentration of BOD for the year 2018 varies from 10.6 to 35.4 mg/L considering all the scenarios. When compared with the desired concentration of BOD from Class B category of river quality classification, it can be said that all the simulation values throughout the year falls under the moderately-to-extremely polluted category. On the other hand, the value of Tot col. ranged from 27,863 to 68,771 CFU/100 mL. Looking into the results from future scenarios, it can be inferred that water quality status is significantly affected by all the drivers—climate change, land-use/land cover change, and population changes, and water quality will deteriorate further in 2050 when compared with the current situation. Furthermore, predominantly, the fifth scenario (e) has the highest negative impact on the water quality, which is the effect of population growth, land-use land cover changes, and climate change with RCP 8.5. Here, the average percentage increase in the BOD and Tot. coli by 2050 is 161.3% and 215.4%, respectively, when compared with the situation in 2018. We have further analyzed the impact of individual drivers and pressures on river water quality deterioration, and the results are presented in Table 3. Results show that the river water quality in terms of both BOD and Tot. coli is determined by the individual drives in the decreasing order of population growth > land- use land cover change > climate change. This result can be explained as the amount of wastewater being generated will grow proportionately with the population increase without any countermeasures. On the other hand, the drivers—land-use land cover change and climate change-induced extreme weather conditions, will trigger the changes in River discharge due to various complex environmental interactions in the river catchment. This change in River discharge and other local factors will induce a cascading change in water quality parameters due to the modifications in oxidation-reduction process and overall contaminate transport. The results depict the significance of these key drivers of change which are likely to affect water resources of a region, and the development of local level climate resilient plan must consider these drivers for effective policy planning. Further, as the river quality simulations indicate a high degree of water contamination, this is likely to pose potential health risks like gastroenteritis if consumed accidentally (microbial contamination), and death of aquatic organisms such as fish (because of high BOD).

5. Possible Management Options Based on the Scientific Evidence

Finally, based on the hydrological simulation output, we propose the following feasible management solutions for the water resource management in the study area.
(a)
Coastal area zoning—The Government of India has a very comprehensive Integrated Coastal Zone Management (ICZM) program, which acts as a spatial decision-support tool using both ground-based data and satellite data. However, its field implementation is not satisfactory due to various factors such as rapidly changing environmental systems in these coastal environments owing to both natural and anthropogenic factors [51]. If scientific forecasting of different environmental components such as water quality and biodiversity based on the “what if” situation are incorporated in these programs, the zoning for different activities can be made more effective and sustainable [52]. For example, in the case of Brahmani River, people indiscriminately using the downstream floodplain area for aquaculture, and bring brackish or saltwater towards inland [53]. This disturbs the sea water-fresh water equilibrium, a main cause for saltwater intrusion, deterioration of mangrove species, and permanently damaging agricultural fields. Hence government should demarcate the area with clear job allocation and there should be a strict penalty if someone fails to comply.
(b)
Building sufficient wastewater management infrastructure—Good river water quality is very important for maintaining the ideal environment for a healthy coastal ecosystem as shown by Kumar [10]. So, monitoring and regulating all wastewater flowing into the river is vital. At present, there is not enough infrastructure to cater to the wastewater being generated from both the domestic as well as industrial sector. Hence, we must have precise information about wastewater being generated both for the current situation and in the coming future. This will help to design the infrastructure of sufficient capacity.
(c)
Public awareness—Local people must be made aware of the benefits of a healthy coastal ecosystem in providing economic benefits, protection from climate change, and overall human well-being as reported by several scientific reports and publications [54,55]. They should understand that a participatory approach is a key to achieve the sustainable management of the coastal environment. Since water is the limiting factor for socio-economic dimension for people living in Kendrapara district, it is very important for the people to understand about different water management options available and how they can play a critical role in this.

6. Conclusions

Despite diverse international and national initiatives and programs, coastal zone management in India still faces many obstacles at institutional, societal and financial levels. This study shows that by including different factors such as population growth, climate change and land-use land cover changes, average value of the BOD and Tot. coli in the river water body will be increased 161.3% and 215.4%, respectively, by year 2050 when compared with the situation in 2018. Due to the dynamic nature of coastal areas and the major impacts of demographic and climatic changes (historically and in the future), it is essential that climate uncertainty be included in water resource management policy planning. Active involvement of local stakeholders in scientific research on water resources and environmental change is essential to help them understand their future requirements and risks, and design effective mitigation measures. This process of climate resilient planning will help in developing ecosystems and social resilience in the region against increasing climate vulnerability and uncertainty. The situation of Indian coastal zone management requires an all-inclusive, integrated multidisciplinary and transdisciplinary approach (both bottom-up and top-down) for addressing water resource management issues. Especially, vulnerable coastal zones such as inland and coastal water bodies being an important part of the complex coastal ecosystem require a more sound water resource management, and if not efficiently planned, can be the limiting factor for the ecological, social and economic growth of the region that may largely affect human well-being.
Our study provides clear insights about the future water quality under diverse “what if” conditions, and provides broader perspectives and meaningful considerations for appropriately designing diverse policy relevant to sustainable management solutions keeping climate uncertainty in its core. Hydrological simulation for water quality of Brahmani River in the sensitive coastal district Kendrapara in Odisha provided a clear overview of the existing as well as plausible alternative future scenarios. Our study illustrates that the Participatory Coastal Land-Use Management (PCLM) approach is an effective approach ready for implementation for ensuring sustainable management of coastal water resources. The PCLM approach, as an all-inclusive integrated framework for water resource management, helped in retrofitting models by regular interactions and feedbacks from diverse stakeholders having stakes in water resource use and management in the district to ensure stakeholder needs are well addressed and included, and they also understand and own simulated results. The key enabling condition for effectiveness of PCLM approach is an all-inclusive participation of stakeholders that supports the planning, implementation, and monitoring of the approach in a more holistic manner.

Author Contributions

Conceptualization: P.K.; methodology: P.K.; formal analysis: P.K.; investigation: P.K., R.D. and R.K.; writing—original draft preparation: P.K.; writing—review and editing: P.K., R.D., S.D., R.K., B.A.J., S.H., R.A., N.S., O.S., S.C. and B.K.M. All authors have read and agreed to the published version of the manuscript.

Funding

Data collection and field survey for this research work is supported by the project from Asia Pacific Network for Global Change Research (APN) under Collaborative Regional Research Programme (CRRP) with grant number CRRP2018-03MY-Hashimoto, https://doi.org/10.13039/100005536. Fund for publication fee for this work is supported by IPCC Strategy Research Fund 2020 in-house grant from Institute for Global Environmental Strategies (IGES).

Institutional Review Board Statement

Not applicable.

Informed Consent Statement

Not applicable.

Data Availability Statement

Not applicable.

Conflicts of Interest

The authors declare no conflict of interest.

References

  1. Nayak, S. Coastal zone management in India- present status and future needs. Geo Spat. Inf. Sci. 2017, 20, 174–183. [Google Scholar] [CrossRef]
  2. Michael, H.A.; Post, V.E.A.; Wilson, A.M.; Werner, A.D. Science, society, and the coastal groundwater squeeze. Water Resour. Res. 2017, 53, 2610–2617. [Google Scholar] [CrossRef]
  3. Krishnamurthy, R.R.; Dasgupta, R.; Chatterjee, R.; Shaw, R. Managing the Indian coast in the face of disasters and climate change: A review and analysis of India’s coastal zone management policies. J. Coast. Conserv. 2014, 18, 657–672. [Google Scholar] [CrossRef]
  4. Steyl, G.; Dennis, I. Review of coastal-area aquifers in Africa. Hydrogeol. J. 2010, 18, 217–225. [Google Scholar] [CrossRef]
  5. DasGupta, R.; Shaw, R. An indicator based approach to assess coastal communities’ resilience against climate related disasters in Indian Sundarbans. J. Coast. Conserv. 2015, 19, 85–101. [Google Scholar] [CrossRef]
  6. UN Water. Water Security and the Global Water Agenda; UNU-INWEH: Hamilton, Canada, 2013; p. 38. ISBN 9789280860382. [Google Scholar]
  7. Mohanty, P.K.; Panda, U.S.; Pal, S.R.; Mishra, P.K. Monitoring and management of environmental changes along the Orissa coast. J. Coast. Res. 2008, 24, 13.e27. [Google Scholar] [CrossRef]
  8. Kumar, P.; Dasgupta, R.; Johnson, B.; Saraswat, C.; Basu, M.; Kefi, M.; Mishra, B.K. Effect of Land use changes on water quality in an ephemeral coastal plain: Khambhat City, Gujarat, India. Water 2019, 11, 724. [Google Scholar] [CrossRef] [Green Version]
  9. Identifying the Relationships Between Water Quality and Land Cover Changes in the Tseng-Wen Reservoir Watershed of Taiwan. Int. J. Environ. Res. Public Health 2013, 10, 478–489. [CrossRef] [PubMed] [Green Version]
  10. Kumar, P. Numerical quantification of current status quo and future prediction of water quality in eight Asian Mega cities: Challenges and opportunities for sustainable water management. Environ. Monit. Assess. 2019, 191, 319. [Google Scholar] [CrossRef]
  11. Lakshmi, A.; Rajagopalan, R. Socio-economic implications of coastal zone degradation and their mitigation: A case study from coastal villages in India. Ocean Coast. Manag. 2000, 43, 749–762. [Google Scholar] [CrossRef]
  12. World Resource Institute (WRI). Bigger Problem, Better Solutions, World Resource Institute Annual Report 2018–2019; WRI: Washington DC, USA, 2019; p. 52. [Google Scholar]
  13. Kumar, P.; Tsujimura, M.; Nakano, T.; Minoru, T. The effect of tidal fluctuation on ground water quality in coastal aquifer of Saijo plain, Ehime prefecture, Japan. Desalination 2012, 286, 166–175. [Google Scholar] [CrossRef]
  14. Dabrowski, J.M.; De Klerk, L.P. An Assessment of the Impact of Different Land Use Activities on Water Quality in the Upper Olifants River Catchment. Water SA 2013, 39, 231–241. [Google Scholar] [CrossRef] [Green Version]
  15. Saraswat, C.; Mishra, B.K.; Kumar, P. Integrated urban water management scenario modeling for sustainable water governance in Kathmandu Valley, Nepal. Sustain. Sci. 2017, 12, 1037–1053. [Google Scholar] [CrossRef]
  16. Assessment and management of coastal multi-hazard vulnerability along the Cuddalore-Villupuram, east coast of India using geospatial techniques. Ocean Coast. Manag. 2011, 54, 302–311. [CrossRef]
  17. Zeilhofer, P.; Lima, E.B.N.R.; Lima, G.A.R. Spatial patterns of water quality in the Cuiaba river basin, Central Brazil. Environ. Monit. Assess. 2006, 123, 41–62. [Google Scholar] [CrossRef] [PubMed]
  18. Ding, J.; Jiang, J.; Fu, L.; Liu, Q.; Peng, Q.; Kang, M. Impacts of Land Use on Surface Water Quality in a Subtropical River Basin: A Case Study of the Dongjiang River Basin, Southeastern China. J. Water 2015, 7, 4427–4445. [Google Scholar] [CrossRef] [Green Version]
  19. United Nation Sustainable Development Goals. The 2030 Agenda for Sustainable Development; A/RES/70/1; United Nation Sustainable Development Goals: New York, NY, USA, 2015; p. 41. [Google Scholar]
  20. Dong, L.; Liu, J.; Du, X.; Dai, C.; Liu, R. Simulation-based risk analysis of water pollution accidents combining multi-stressors and multi-receptors in a coastal watershed. Ecol. Indic. 2018, 92, 161–170. [Google Scholar] [CrossRef]
  21. Greggio, N.; Giambastiani, B.M.S.; Mollema, P.; Laghi, M.; Capo, D.; Gabbianelli, G.; Antonellini, M.; Dinelli, E. Assessment of the main geochemical processes affecting surface water and groundwater in a low-lying coastal area: Implication for water management. Water 2020, 12, 1720. [Google Scholar] [CrossRef]
  22. Yang, H.J.; Jeong, H.J.; Bong, K.M.; Jin, D.R.; Kang, T.W.; Ryu, H.S.; Han, J.H.; Yang, W.J.; Jung, H.; Hwang, S.H.; et al. Organic matter and heavy metal in river sediments of southwestern coastal Korea: Spatial distributions, pollution, and ecological risk assessment. Mar. Pollut. Bull. 2020, 159, 111466. [Google Scholar] [CrossRef]
  23. Oude Essink, G.H.P. Improving fresh groundwater supply problems and solutions. Ocean Coast Manag. 2001, 44, 429–449. [Google Scholar] [CrossRef]
  24. Murali, R.M.; Dhiman, R.; Choudhary, R.; Seelam, J.K.; Ilangovan, D.; Vethamony, P. Decadal shoreline assessment using remote sensing along the central Odisha coast, India. Environ. Earth Sci. 2015, 74, 7201–7213. [Google Scholar] [CrossRef]
  25. Jha, D.K.; Devi, M.P.; Vidyalakshmi, R.; Brindha, B.; Vinithkumar, N.V.; Kirubagaran, R. Water quality assessment using water quality index and geographical information system methods in the coastal waters of Andaman sea, India. Mar. Pollut. Bull. 2015, 100, 555–561. [Google Scholar] [CrossRef]
  26. Keesstra, S.; Mol, G.; de Leeuw, J.; Okx, J.; de Cleen, M.; Visser, S. Soil-related sustainable development goals: Four concepts to make land degradation neutrality and restoration work. Land 2018, 7, 133. [Google Scholar] [CrossRef] [Green Version]
  27. Kadaverugu, R.; Dhyani, S.; Dasgupta, R.; Kumar, P.; Hashimoto, S.; Pujari, P. Mutiple values of Bhitarkanika mangrove for human well-being: Synthesis of contemporary scientific knowledge for mainstreaming ecosystem services in policy planning. J. Coast. Conserv. 2021, 25, 32. [Google Scholar] [CrossRef]
  28. Kathiresan, K. Mangrove forests of India. Curr. Sci. 2018, 114, 5–976. [Google Scholar] [CrossRef]
  29. Gupta, M.; Fletcher, S. The application of a proposed generic institutional framework for integrated coastal management to India. Ocean Coast. Manag. 2001, 44, 757–786. [Google Scholar] [CrossRef]
  30. Panigrahi, J.K.; Mohanty, P.K. Effectiveness of the Indian coastal regulation zones provisions for coastal zone management and its evaluation using SWOT analysis. Ocean Coast. Manag. 2012, 65, 34–50. [Google Scholar] [CrossRef]
  31. Barik, J.; Mukhopadhyay, A.; Ghosh, T.; Mukhopadhyay, S.K.; Chowdhury, S.M.; Hazra, S. Mangrove species distribution and water salinity: An indicator species approach to Sundarban. J. Coast. Conserv. 2018, 22, 361–368. [Google Scholar] [CrossRef]
  32. Johnson, B.A.; Macandog, D.B.; Kumar, P.; Dasgupta, R.; Kawai, M. Participatory Coastal Land-Use Management (PCLM) Guidebook: Participatory Approaches and Geospatial Modeling for Increased Resilience to Climate Change at the Local Level; IGES publication: Kanagawa, Japan, 2021; p. 88. [Google Scholar]
  33. ENVIS Centre of Odisha’s State of Environment. Orienvis.nic.in. Available online: http://webcache.googleusercontent.com/search?q=cache:24-b22YoyscJ:orienvis.nic.in/index1.aspx%3Flid%3D1%26mid%3D2%26langid%3D1%26linkid%3D1+&cd=2&hl=en&ct=clnk&gl=jp (accessed on 12 August 2019).
  34. CGWB. Ground Water Information Booklet of Kendrapara District, Odisha. 2013. Available online: http://cgwb.gov.in/District_Profile/Orissa/kendrapara.pdf (accessed on 6 February 2021).
  35. Rahman, M.d.R.; Thakur, P.K. Detecting, mapping and analysing of flood water propagation using synthetic aperture radar (SAR) satellite data and GIS: A case study from the Kendrapara District of Orissa State of India. Egypt. J. Remote Sens. Space Sci. 2018, 21, S37–S41. [Google Scholar] [CrossRef]
  36. Naik, P.K.; Pati, G.; Srivastava, D.S.; Tiwari, S.K.; Hota, R.N. Hydrogeology of Kendrapara District with Special Reference to Salinity Hazard. Univ. Spec. Publ. Geol. 2005, 4, 137–143. [Google Scholar]
  37. DLIC. District Irrigation Plan of Kendrapara. 2016. Available online: http://www.dowrodisha.gov.in/DIP/2015-20/KENDRAPARA.pdf (accessed on 6 February 2021).
  38. Census. Census of India. Website: Office of the Registrar General & Census Commissioner, India. 2011. Available online: http://censusindia.gov.in/ (accessed on 5 February 2019).
  39. DasGupta, R.; Hashimoto, S.; Okuro, T.; Basu, M. Scenario-based land change modelling in the Indian Sundarban delta: An exploratory analysis of plausible alternative regional futures. Sustain. Sci. 2019, 14, 221–240. [Google Scholar] [CrossRef]
  40. Seiber, J.; Purkey, D. WEAP—Water Evaluation and Planning System User Guide for WEAP 2015; Somerville, Stockholm Environment Institute: Stockholm, Sweden, 2015. [Google Scholar]
  41. Ministry of Home Affairs, Government of India, Census Digital Library. Available online: https://censusindia.gov.in/DigitalLibrary/MapsCategory.aspx (accessed on 5 March 2020).
  42. United Nations, Department of Economic and Social Affairs, Population Division (UN DESA). World Urbanization Prospects: The 2014 Revision, 2015, (ST/ESA/SER.A/366); United Nations Publication: New York, NY, USA, 2015; p. 517. [Google Scholar]
  43. Odisha Water Resource Board, Digital Library. Available online: http://www.dowrodisha.gov.in/ (accessed on 13 February 2020).
  44. Indian Meteorological Department. Ministry of Earth Sciences, Government of India, Digital Library. Available online: https://mausam.imd.gov.in/ (accessed on 5 January 2020).
  45. Intergovernmental Panel on Climate Change (IPCC) Data Distribution Center. Available online: https://www.ipcc-data.org/ (accessed on 20 April 2020).
  46. Landsat Missions. USGS. Available online: https://www.usgs.gov/core-science-systems/nli/landsat/landsat-8?qt-science_support_page_related_con=0#qt-science_support_page_related_con (accessed on 25 June 2020).
  47. Eastman, J.R. TerrSet Geospatial Monitoring and Modeling System Manual; Clark University: Worcester, MA, USA, 2016. [Google Scholar]
  48. American Public Health Association (APHA). Standard Methods for the Examination of Water and Wastewater, 22nd ed.; Rice, E.W., Baird, R.B., Eaton, A.D., Clesceri, L.S., Eds.; American Public Health Association (APHA), American Water Works Association (AWWA) and Water Environment Federation (WEF): Washington, DC, USA, 2012; p. 1496. [Google Scholar]
  49. The United Nations World Water Development Report 2017. Wastewater: The Untapped Resource; UNESCO: Paris, France, 2017. [Google Scholar]
  50. Kadaverugu, R.; Dhyani, S.; Dasgupta, R.; Kumar, P.; Hashimoto, S. Dynamics of land use land cover changes and its impact on coastal environment. Under Review.
  51. Portman, M.E.; Esteves, L.S.; Le, X.Q.; Khan, A.Z. Improving integration for integrated coastal zone management: An eight country study. Sci. Total Environ. 2012, 439, 194–201.d. [Google Scholar] [CrossRef] [PubMed] [Green Version]
  52. Badham, J.; Elsawah, S.; Guillaume, J.H.A.; Hamilton, S.H.; Hunt, R.J.; Jakeman, A.J.; Peirce, S.A.; Snow, V.O.; Sebens, M.B.; Fu, B.; et al. Effective modeling for integrated water resource management: A guide to contextual practices by phases and steps and future opportunities. Environ. Model. Softw. 2019, 116, 40–56. [Google Scholar] [CrossRef] [Green Version]
  53. Das, M.K.; Samanta, S.; Sajina, A.M.; Sudheesan, D.; Naskar, M.; Bandopadhyay, M.K.; Paul, S.K.; Bhowmick, S.; Srivastava, P.K. Fish diversity, community structure and ecological integrity of river Brahmani. J. Inland Fish Soc. India 2016, 48, 1–13. [Google Scholar]
  54. Kumar, P.; Avtar, R.; Dasgupta, R.; Johnson, B.A.; Mukherjee, A.; Ahsan, M.N.; Nguyen, D.C.H.; Nguyen, H.Q.; Shaw RMishra, B.K. Socio-hydrology: A key approach for adaptation to water scarcity and achieving human well-being in large riverine islands. Prog. Disaster Sci. 2020, 8, 100134. [Google Scholar] [CrossRef]
  55. Easman, E.S.; Abernethy, K.E.; Godley, B.J. Assessing public awareness of marine environmental threats and conservation efforts. Mar. Policy 2018, 87, 234–240. [Google Scholar] [CrossRef]
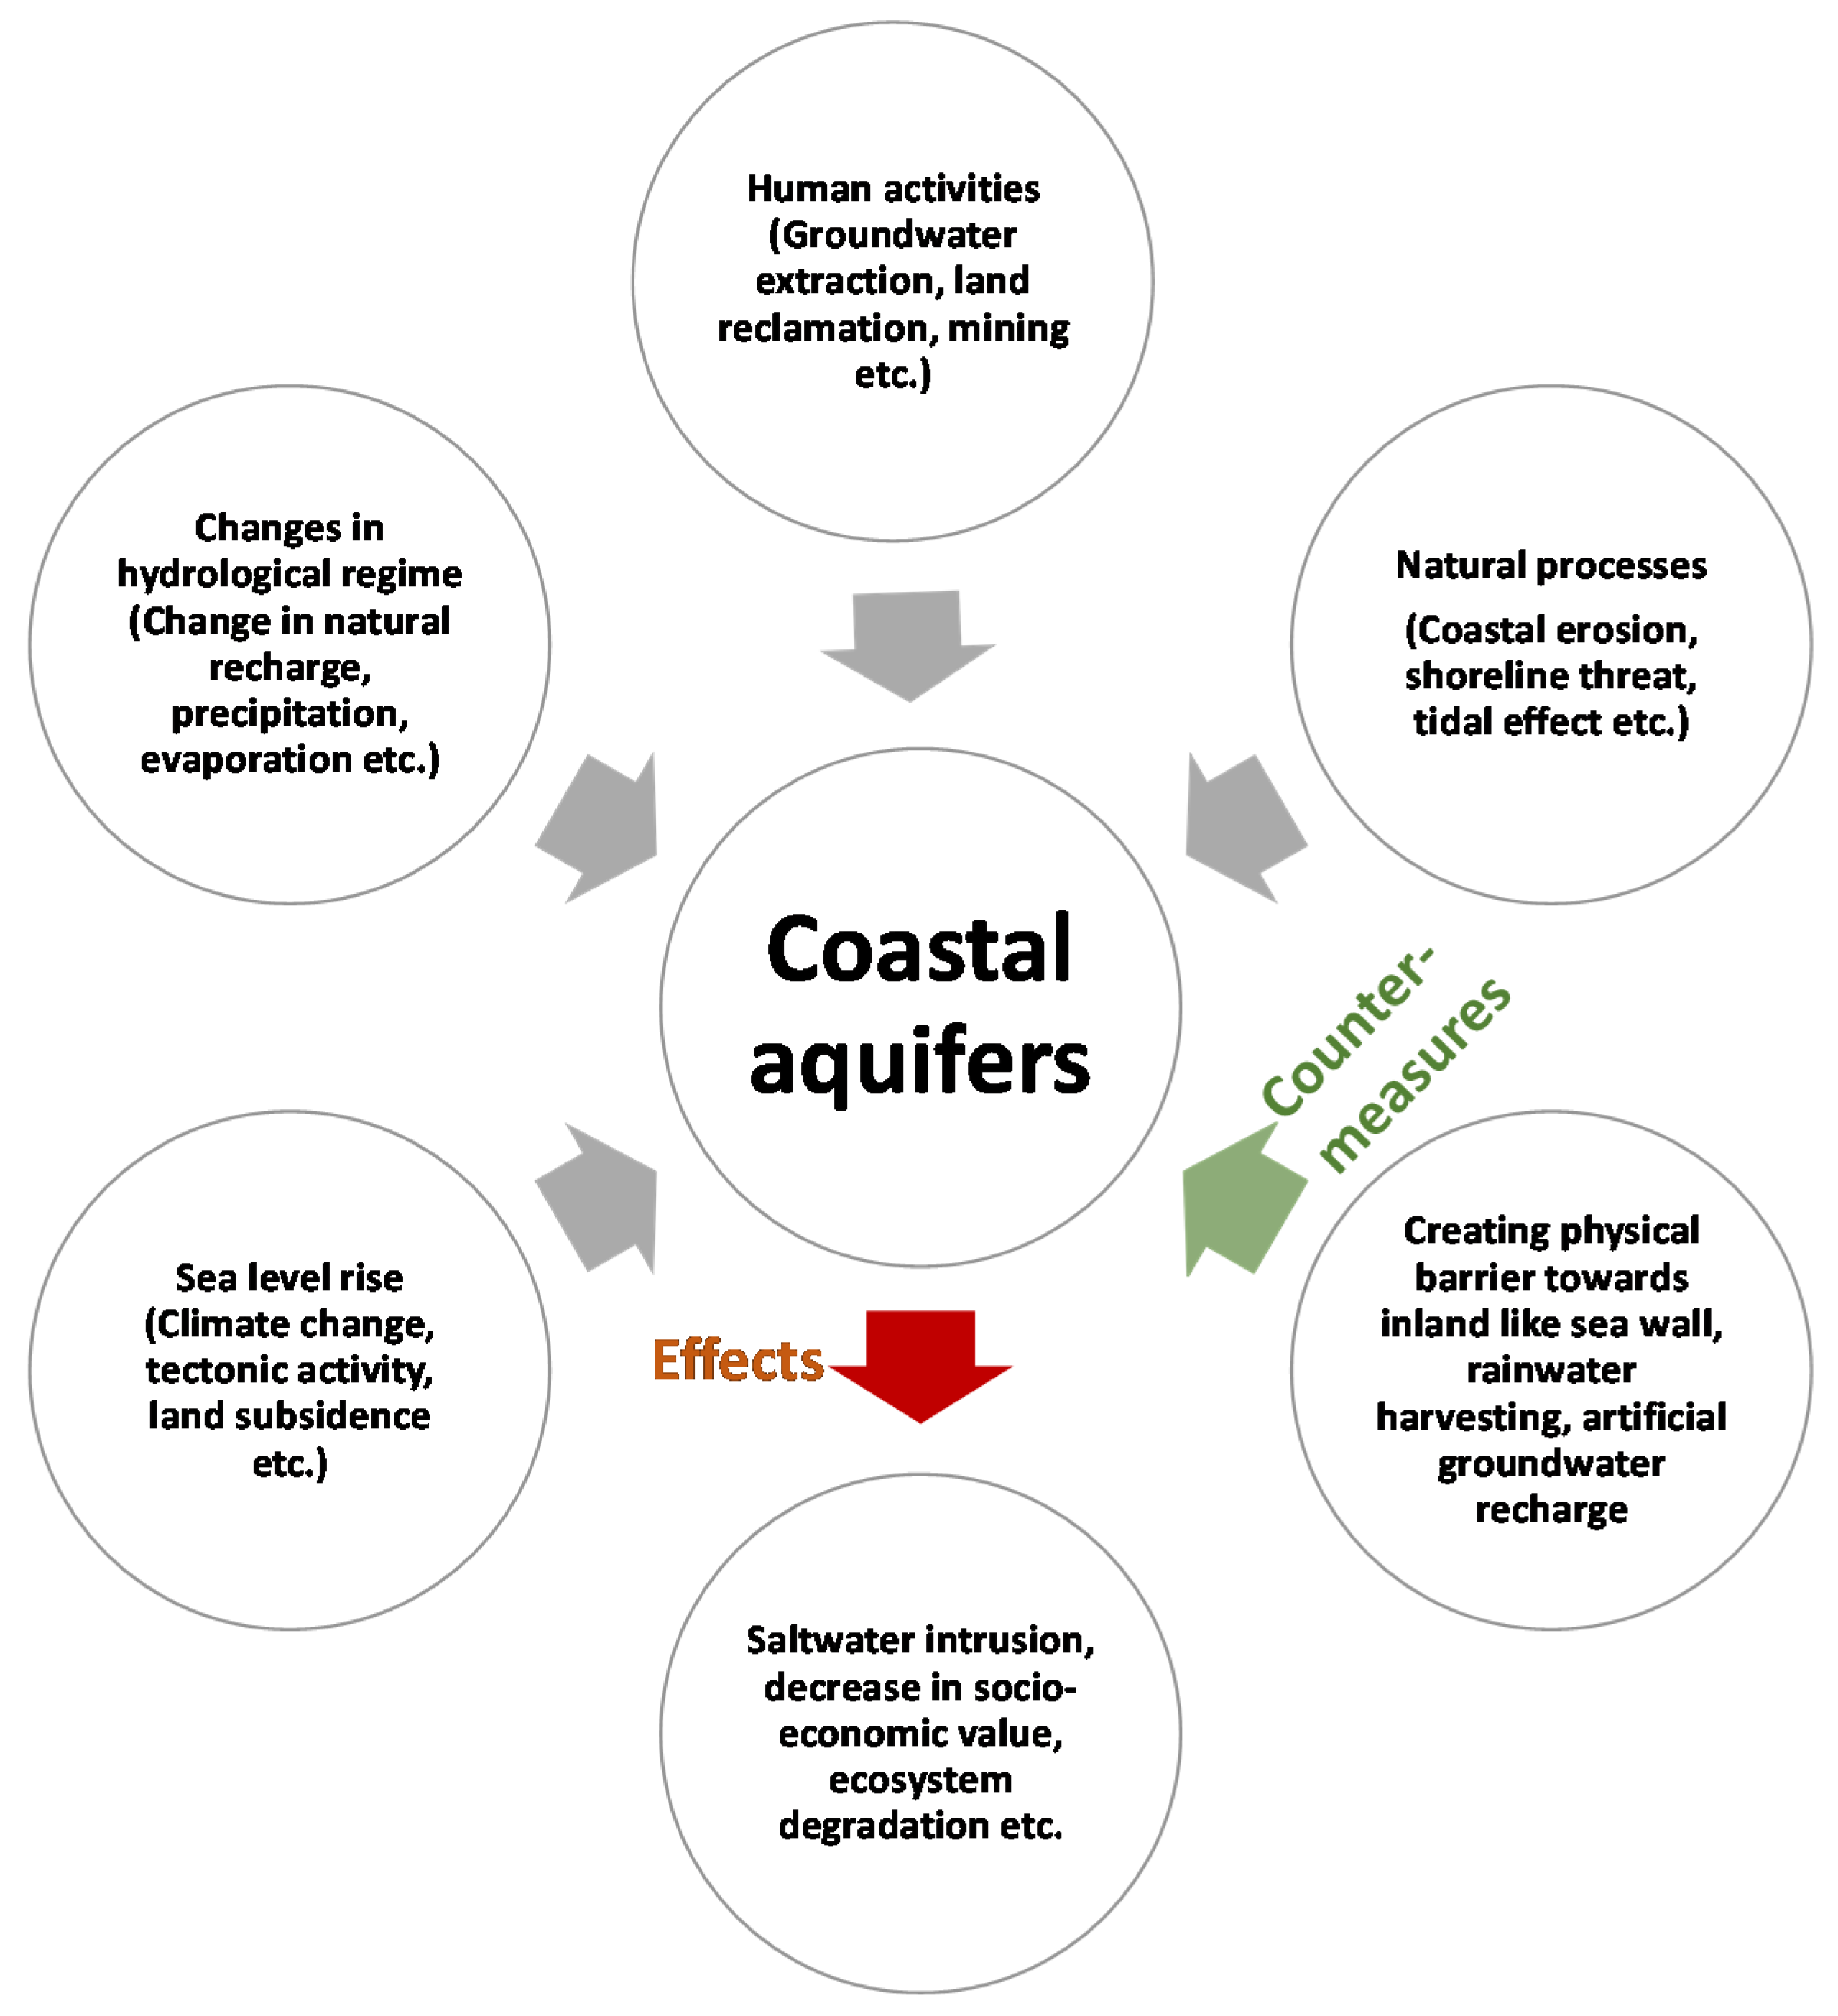
Figure 1. Drivers affecting coastal aquifer and their management options.
Sustainability 13 06339 g001
Figure 2. Study area map.
Sustainability 13 06339 g002
Figure 3. Flowchart for the study methodology.
Sustainability 13 06339 g003
Figure 4. Key informant interview.
Sustainability 13 06339 g004
Figure 5. Schematic diagram for model set-up.
Sustainability 13 06339 g005
Figure 6. Future predicted value for different factors: (a) Land-use land cover; (b) Monthly average precipitation; (c) Population of the study area, considered in the hydrological simulation.
Sustainability 13 06339 g006
Figure 7. Validation of the model output by comparing simulated and observed (a) average biochemical oxygen demand (BOD) values for different locations for the year 2018 and (b) average monthly river discharge for year 2019 at Brahmani River midstream.
Sustainability 13 06339 g007
Figure 8. Results show simulated water quality parameters: (a) BOD; (b) Tot. coli for future scenario without adaptation measures.
Sustainability 13 06339 g008
Table 1. List of data used in this study with their source.
S. No.ParametersTime IntervalScaleSource
1Population2008YearlyCensus of India [41]
2011–2050YearlyUNDESA [42]
2Water quality (BOD, Tot. Coli)2008–2019QuarterlyOdisha Water Resource Board [43]
3River cross section, streamflow2008–2019QuarterlyOdisha Water Resource Board [43]
4Rainfall, Temperature1984–2018 (Past data)—Average gave a value for current condition for year 2018MonthlyIndian Meteorological Department [44]
2021–2070 (Future data)—Average gave a value for future condition for year 2050IPCC [45]
5Land-use land cover map2008 and 2018YearlyLANDSAT [46]
2050Land change modeler [47]
Table 2. Summary of parameters and steps used for calibration.
ParametersInitial ValueStepsFinal Calibrated Value
Effective precipitation 100%±0.5%94%
Runoff/infiltration ratio50/50±5/555/45
Headwater quality (BOD—2 mg/L)2 mg/L±0.5/0.52.5
Tot. coliform (MPN/100 mL)100 MPN/100 mL±10/10220
Table 3. Summary for order of contribution of different drivers on water quality deterioration in Santa Rosa sub-watershed.
ParameterAverage % Increase (2018 to 2050)% Contribution from Population Growth% Contribution from LULC Change% Contribution from Climate Change
BOD161682012
Tot. coli215691813
Publisher’s Note: MDPI stays neutral with regard to jurisdictional claims in published maps and institutional affiliations.