
Sustainable Development Evaluation of Innovation and Entrepreneurship Education of Clean Energy Major in Colleges and Universities Based on SPA-VFS and GRNN Optimized by Chaos Bat Algorithm


Abstract
1. Introduction
- (1)
- The evaluation index system of the sustainability of innovation and entrepreneurship education for clean energy major in colleges and universities is constructed from four aspects: environment, investment, process and result, which solves the problem of what aspects of the sustainability of the innovation and entrepreneurship education for clean energy major in colleges and universities are mainly reflected.
- (2)
- The evaluation index weights are obtained based on the combined entropy weight rank order method, and the SPA-VFS evaluation model is designed to obtain the evaluation results from the perspective of classical evaluation methods.
- (3)
- The basic bat algorithm is improved by using Tent chaotic mapping to form a novel chaotic bat algorithm, and the intelligent evaluation model is constructed by using CBA to optimize GRNN. It provides decision support for promoting the sustainable development of innovation and entrepreneurship education for clean energy major in colleges and universities.
2. Sustainability Evaluation Criteria System for Innovation and Entrepreneurship Education of Clean Energy Major in Colleges and Universities
2.1. Sustainable Evaluation Index System
2.2. Selection of Evaluation Indexes
3. Construction of Classical Evaluation Model
3.1. Weight Calculation Model Based on Combined Entropy Weight Rank Order Method
3.1.1. RO Method
- Data normalization processing.
- 2.
- The average value of each evaluation index sample was calculated by , and sorted by size, with the serial number . The maximum number corresponds to number , and the minimum number corresponds to number 1. Order number is rank, and the greater the value, the greater the impact of the index on the evaluation object.
- 3.
- Calculate the weight of each index , namely:
3.1.2. Entropy Weight Method
3.1.3. Combination Weight Calculation
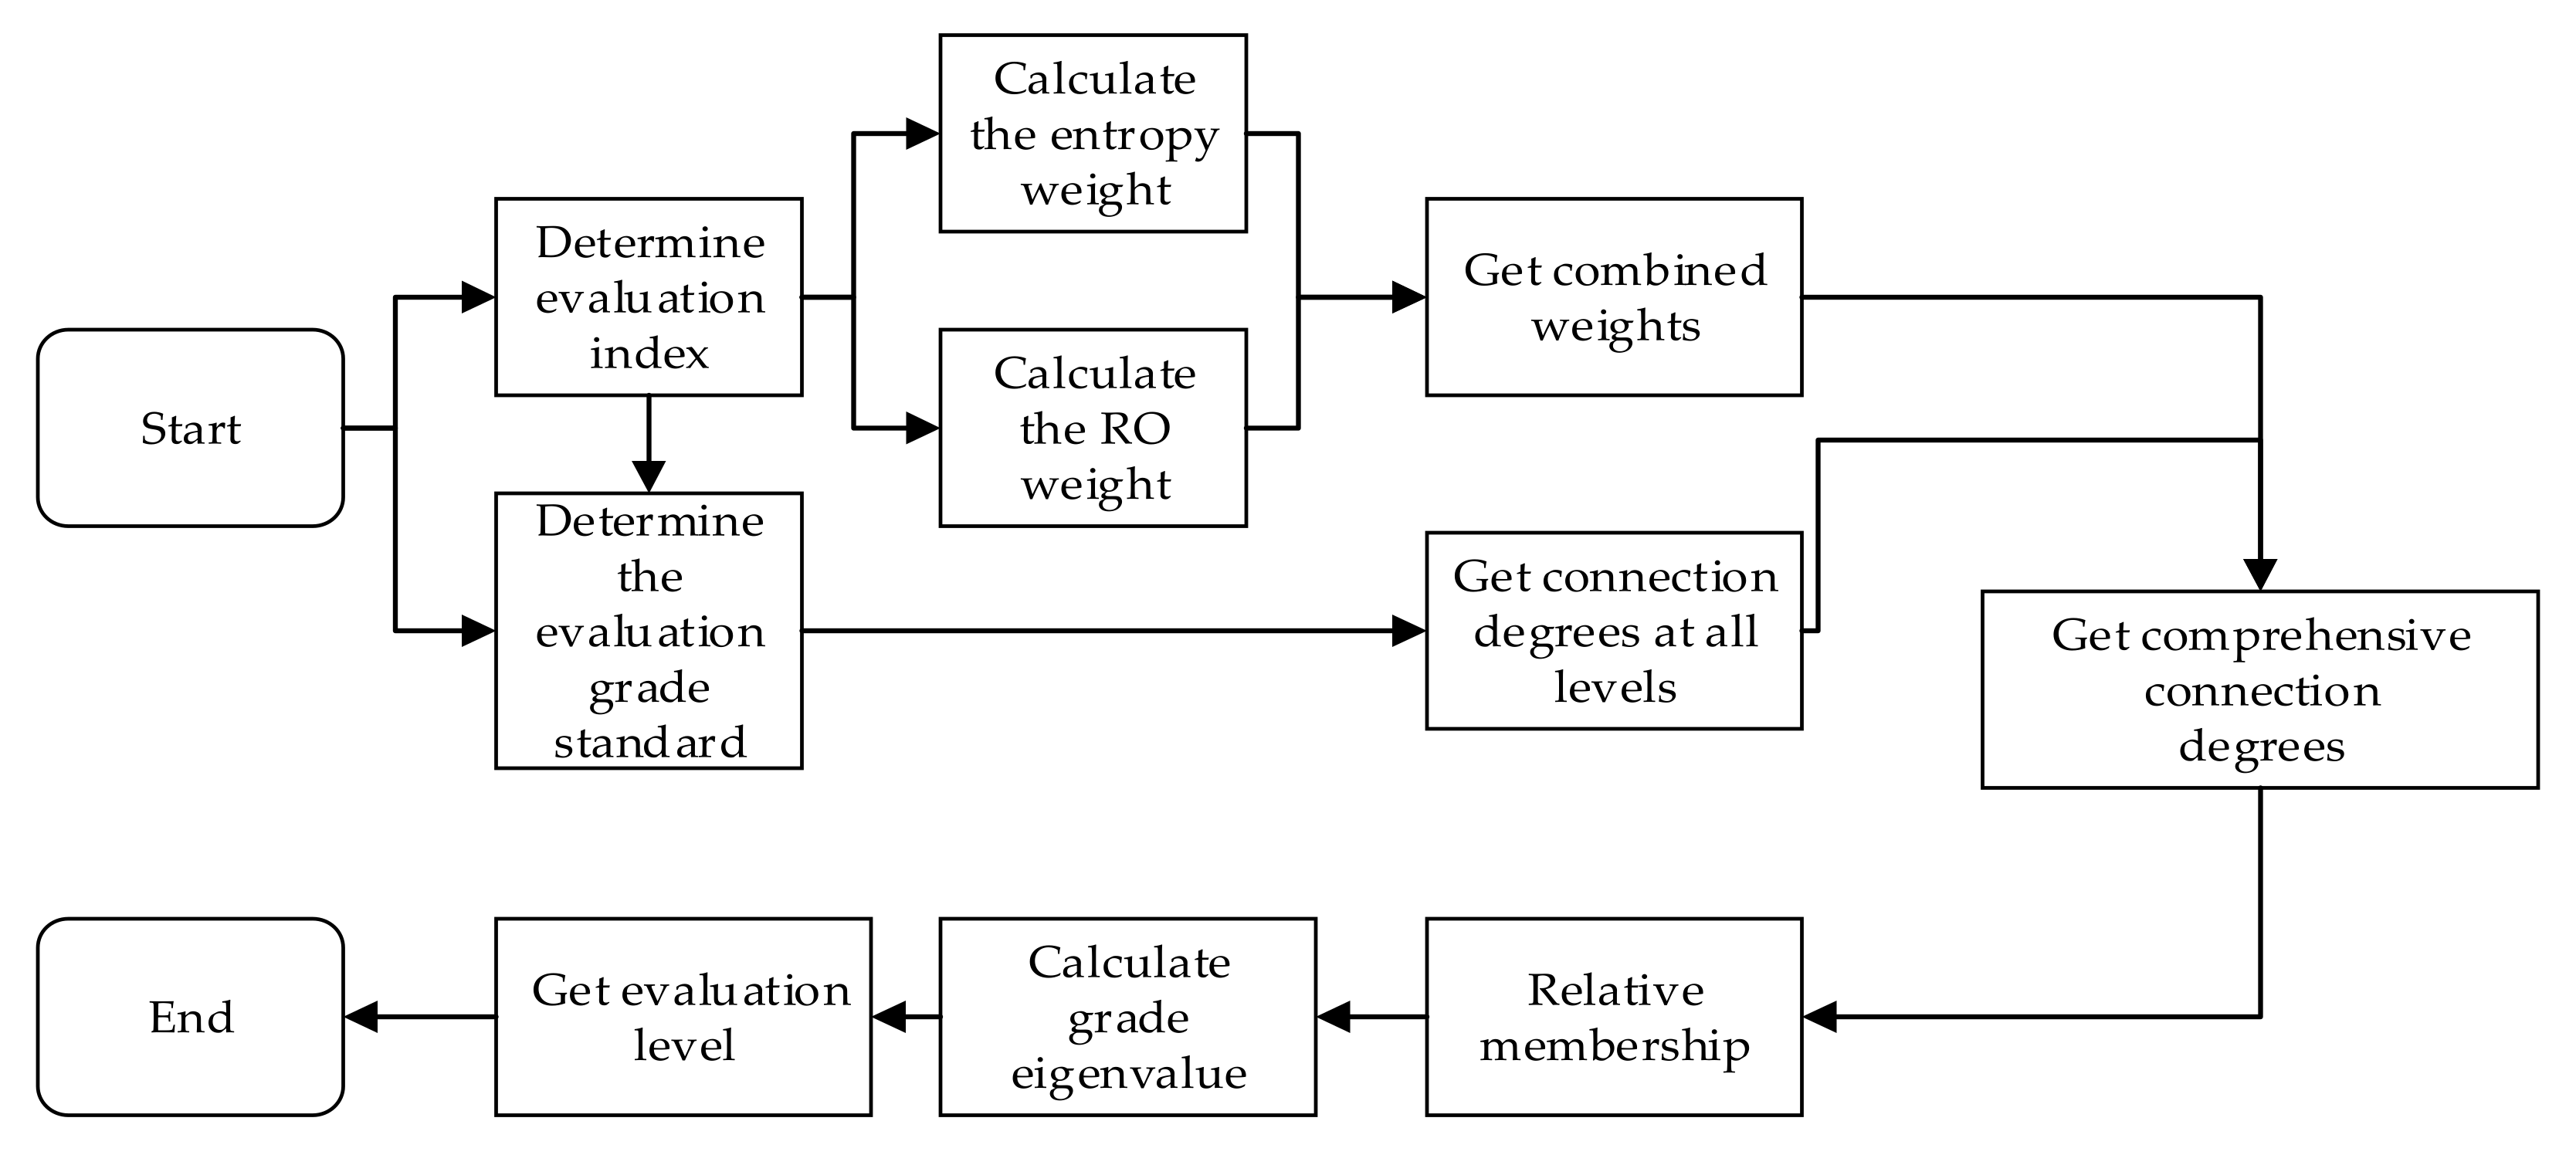
3.2. SPA-VFS
- Determine the evaluation index (, m is the number of evaluation indexes) and evaluation grade standard of the evaluation object [hig−1, hig] (i = 1,2,..., m; g = 1,2,..., C; C is the number of grade).
- Based on the basic principles of the set pair analysis method [37], are taken as two sets and constructed as a set pair. Then analyze from three levels of similarity, difference, and opposite, and obtain the degree of connection between the sample under indicator and grade :where are similarity degree, difference degree, opposite degree, and ; is the coefficient of difference degree (), which can be reasonably determined according to the research object; is the coefficient of contrary degree ().
- 3.
- The comprehensive connection between sample and evaluation grade can be obtained by weighting and index weight :where, is the weight of the index. , values closer to −1, reflecting the smaller consistency between sample and evaluation grade ; The closer the value is to 1, the greater the consistency between the two is.
- 4.
- The relative membership between sample and evaluation grade is calculated. From the meaning of , can be regarded as the relative difference in VFS model. VFS model shows that the relative membership degree of sample and evaluation grade is:
4. Construction of Intelligent Evaluation Model
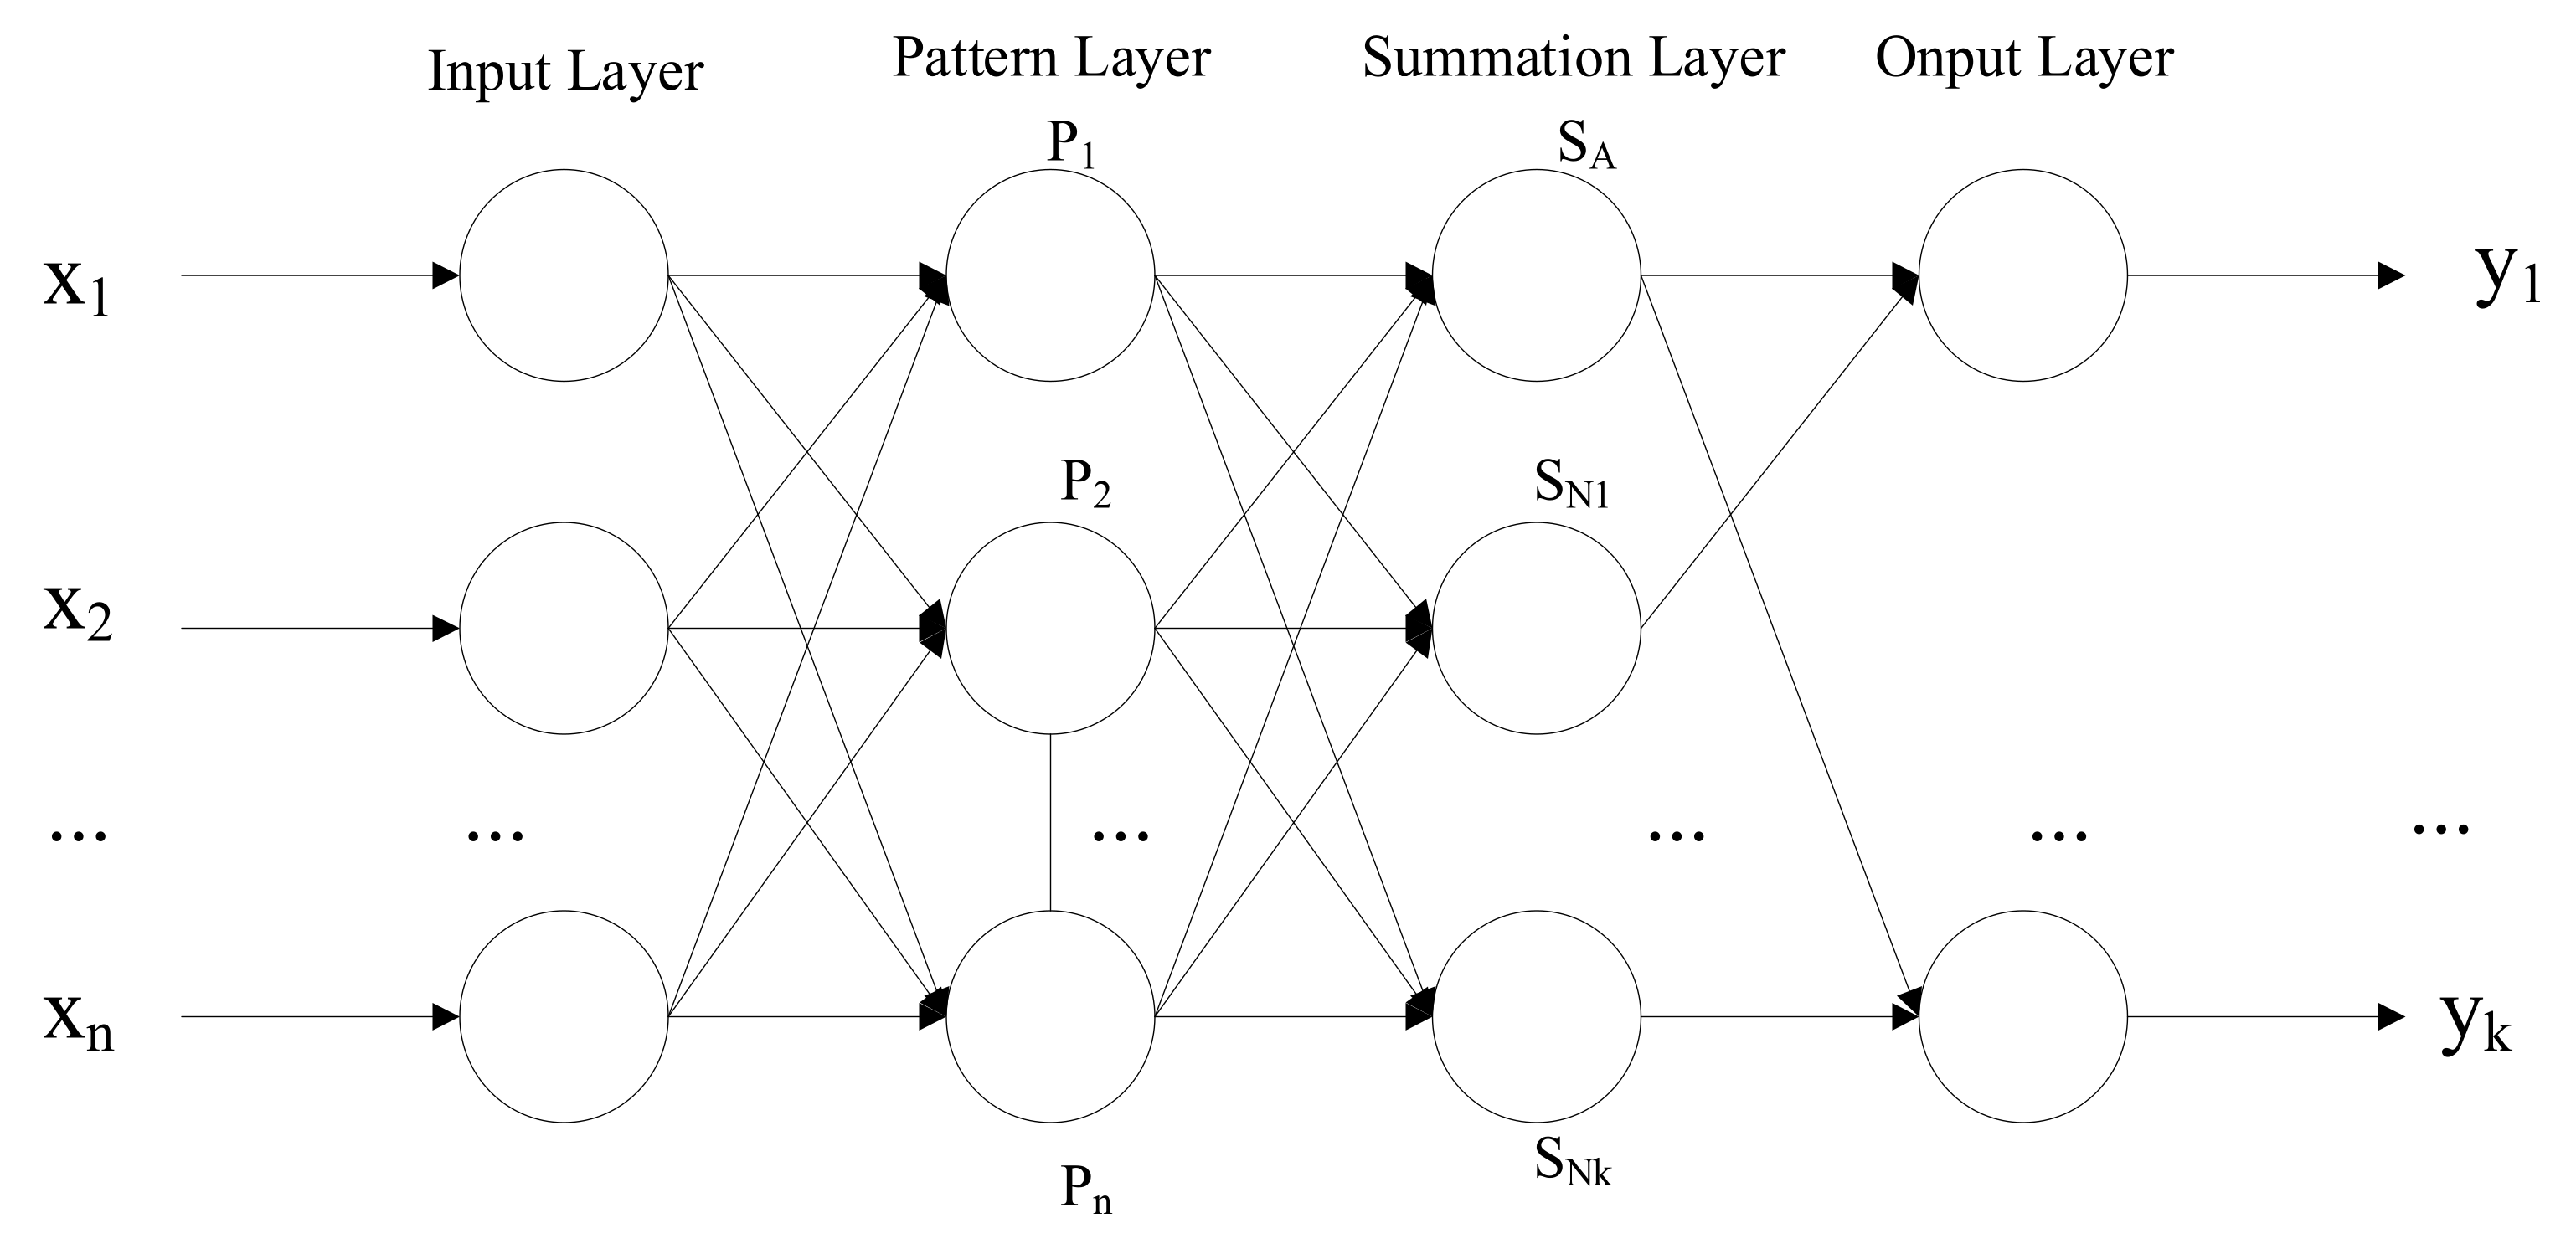
4.1. GRNN
- The input layer: the original variables enter the network which correspond to the neurons one by one and are submitted to the next layer.
- The pattern layer: nonlinear transformation is applied to the values received from the input layer. The transfer function of the i neuron in the pattern layer is:
- 3.
- The summation layer: calculate the sum and weighted sum of the pattern outputs.
- 4.
- The output layer: the forecasting results can be derived. Output of each neuron is:where is the output of the j neuron.
4.2. Chaos Bat Algorithm
4.2.1. Basic Bat Algorithm
4.2.2. Chaos Strategy in Bat Algorithm
- Tent mapping [42].
- 2.
- Initialization of bat position using Tent chaotic map.
- (1)
- Generate random numbers between 0 and 1 to form the initial sequence , where is the number of control variables.
- (2)
- According to the formula (27), the chaotic sequence is generated, and the matrix Z:where is the bat population size.
- (3)
- Update pulse emission rate by using Tent chaotic map
- (4)
- Dynamic adaptive update speed
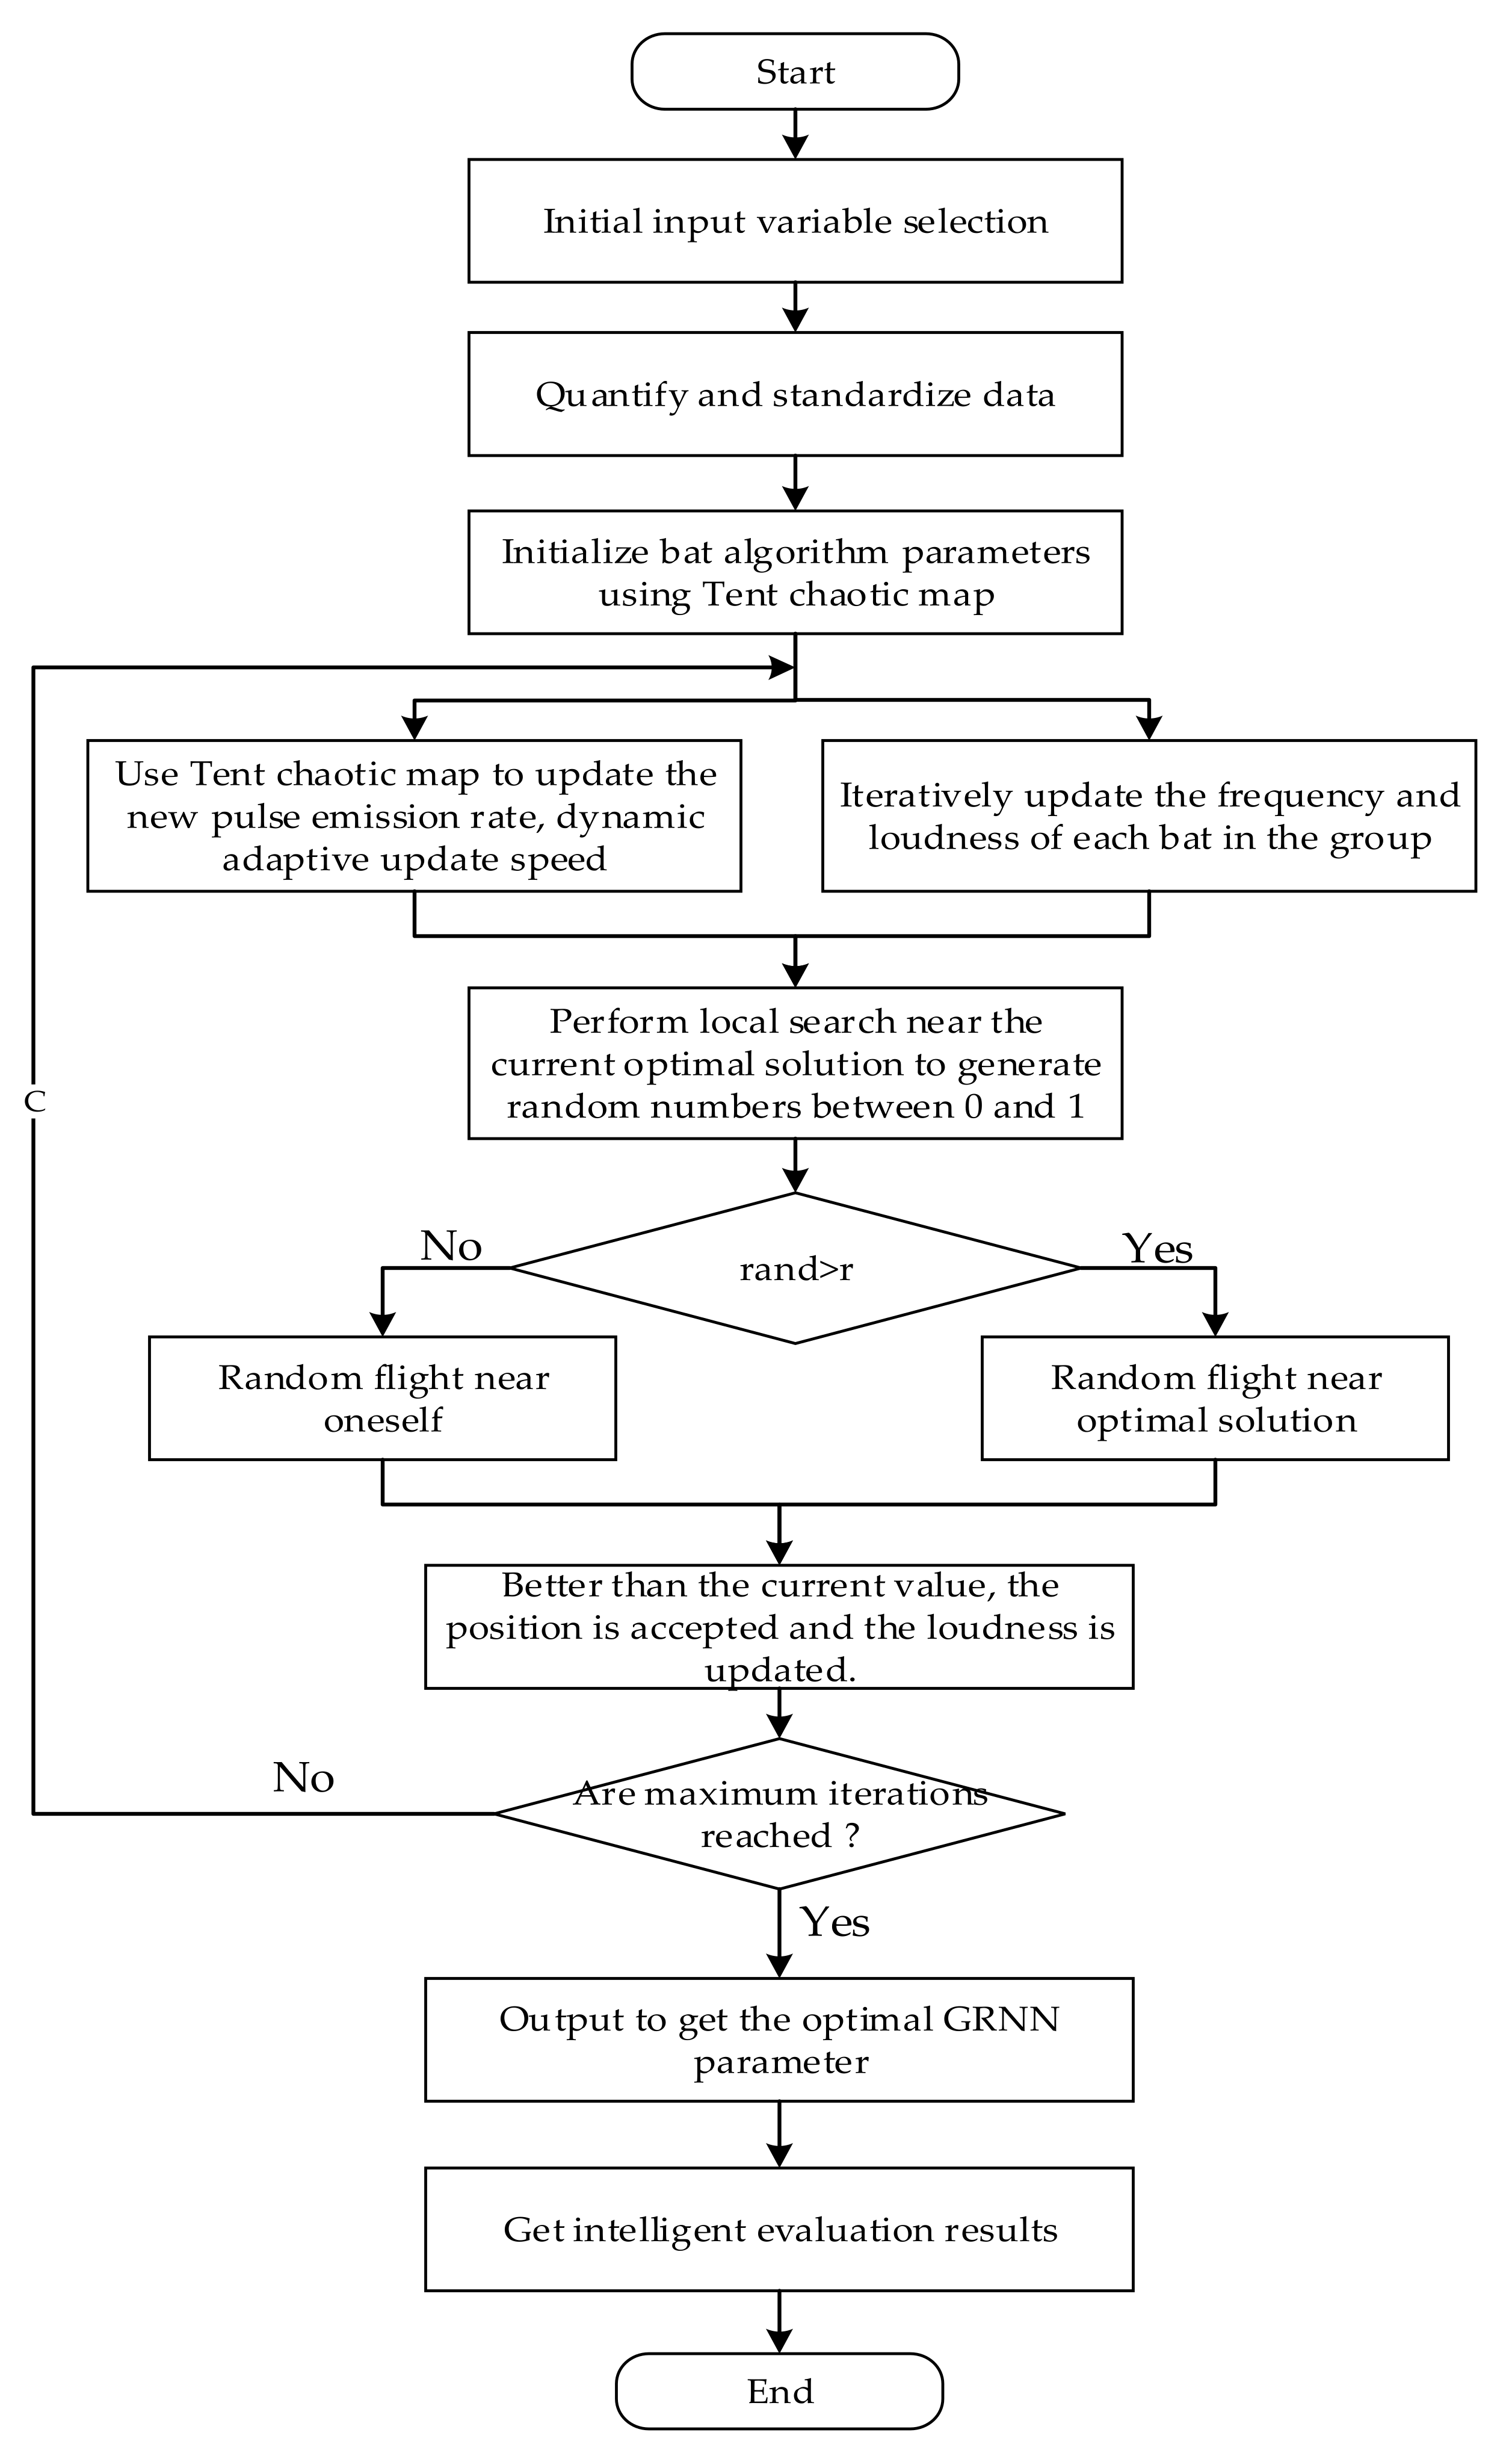
4.3. Intelligent Evaluation Process Based on CBA-GRNN
- Initial input variable selection and data preprocessing. Based on the established evaluation index system, the initial input variable set is formed, and the original data of each input factor is quantified and standardized.
- Initialize the parameters in the CBA algorithm. The population size is set to 40, the maximum number of iterations is 1000, the frequency range is [0,2], the initial loud-ness is 1.0, and the volume attenuation coefficient is 0.95.
- The smoothing factor of the GRNN model is optimized by the CBA algorithm. The smoothing factor of the GRNN model will have an important impact on its final evaluation effect, which is related to the accuracy of the sustainable evaluation of innovation and entrepreneurship education in colleges and universities. Therefore, this model uses the CBA algorithm to search for the smoothing factor of the GRNN model. When the number of iterations reaches the maximum, it shows that the best parameters have been obtained. If not close to the maximum number of iterations, the algorithm needs to be rerun to obtain the corresponding optimal solution set. Then the smoothing factor optimized by the CBA algorithm is used to retrain and test GRNN in the test sample set, and this parameter is adjusted again to obtain the optimal intelligent evaluation model of innovation and entrepreneurship education sustainability in colleges and universities.
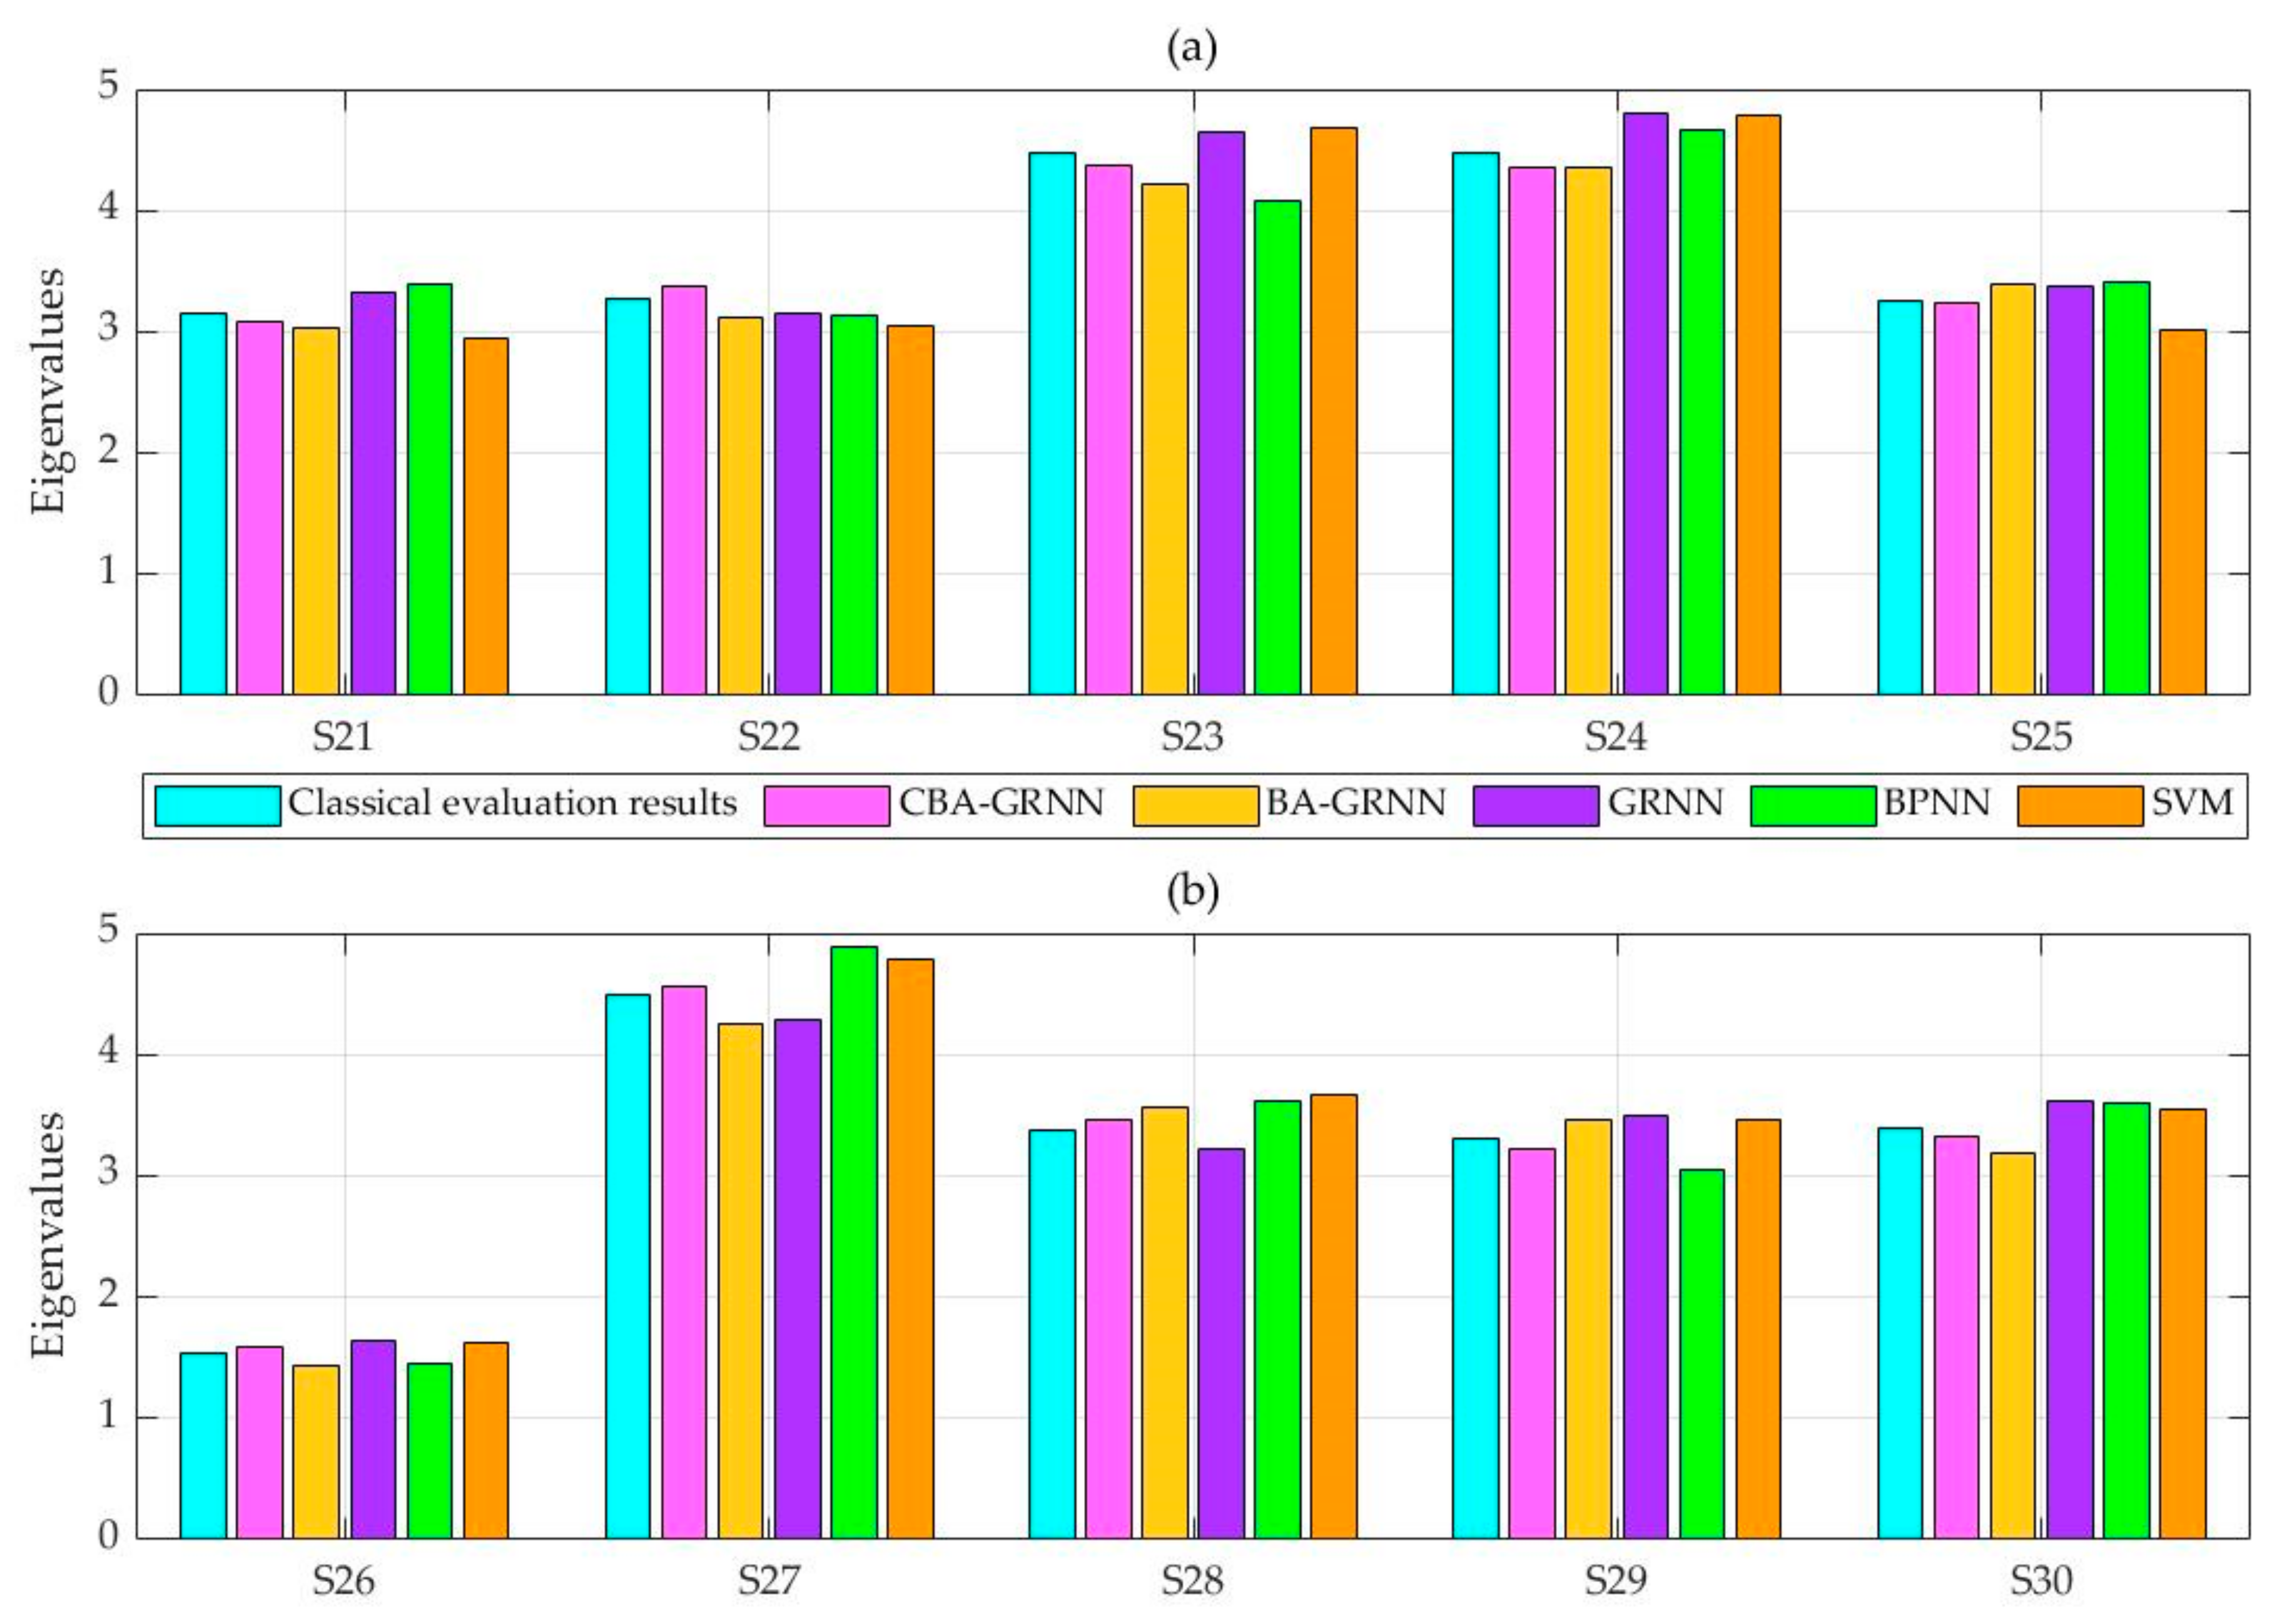
- Output intelligent evaluation results and analyze the results. Based on the above-mentioned optimal intelligent evaluation model for the sustainability of innovation and entrepreneurship education in colleges and universities, the simulation carried out, and the obtained intelligent evaluation results are compared with the calculation results of the classical evaluation model.
5. Case Analysis
5.1. Evaluation Index Classification and Data Acquisition
5.2. Sustainability Evaluation of Innovation and Entrepreneurship Education of Clean Energy Major in Colleges and Universities Based on Classical Evaluation Model
5.2.1. Basic Bat Algorithm
5.2.2. Evaluation Results Analysis Based on SPA-VFS
5.3. Sustainability Evaluation of Innovation and Entrepreneurship Education of Clean Energy Major in Colleges and Universities Based on Intelligent Evaluation Model
6. Conclusions and Discussion
- (1)
- The evaluation index system constructed from four aspects of environment, investment, process and result helps us understand what aspects of the sustainability of innovation and entrepreneurship education for clean energy majors in colleges and universities, and provides a basis for calculation for subsequent evaluation.
- (2)
- According to the analysis of the actual situation, the sustainability evaluation model of innovation and entrepreneurship education for clean energy majors in colleges and universities based on the combination entropy weight rank method and SPA-VFS constructed in this paper objectively and truly reflects the sustainable development level of innovation and entrepreneurship education for clean energy majors in 30 sample colleges and universities. It also has certain reference significance for the evaluation of the sustainable development level of innovation and entrepreneurship education for clean energy majors in other colleges and universities.
- (3)
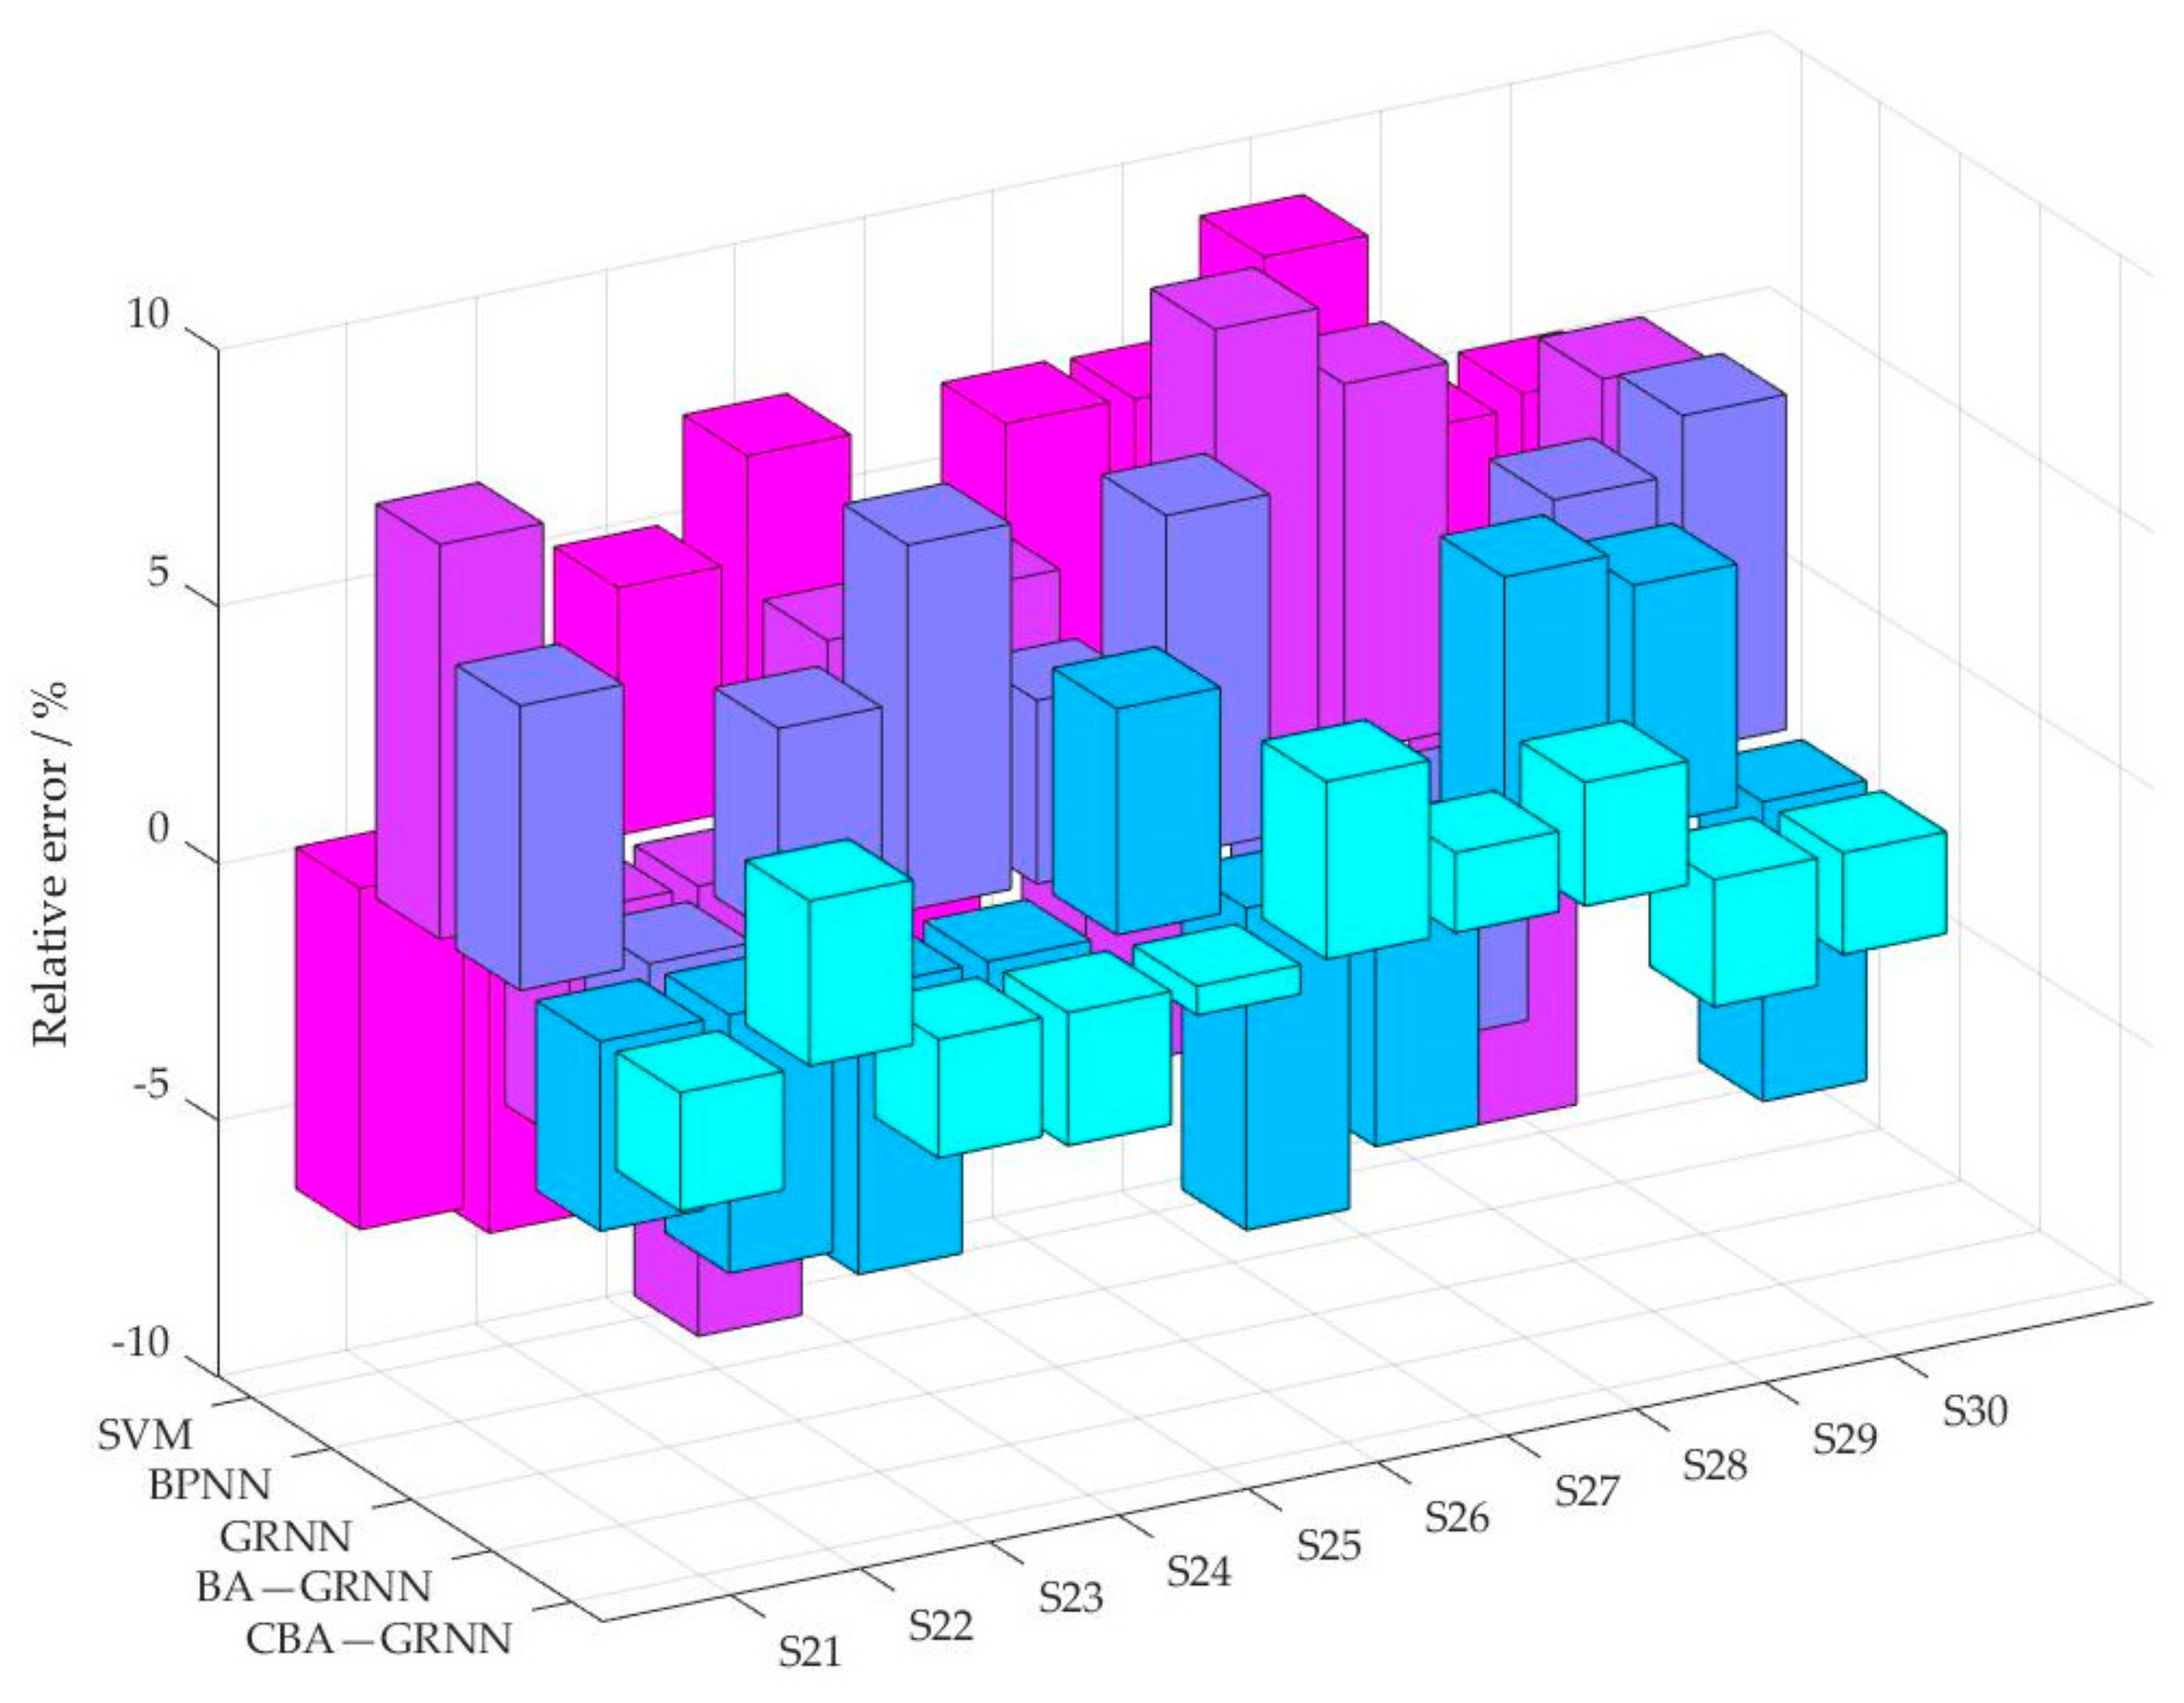
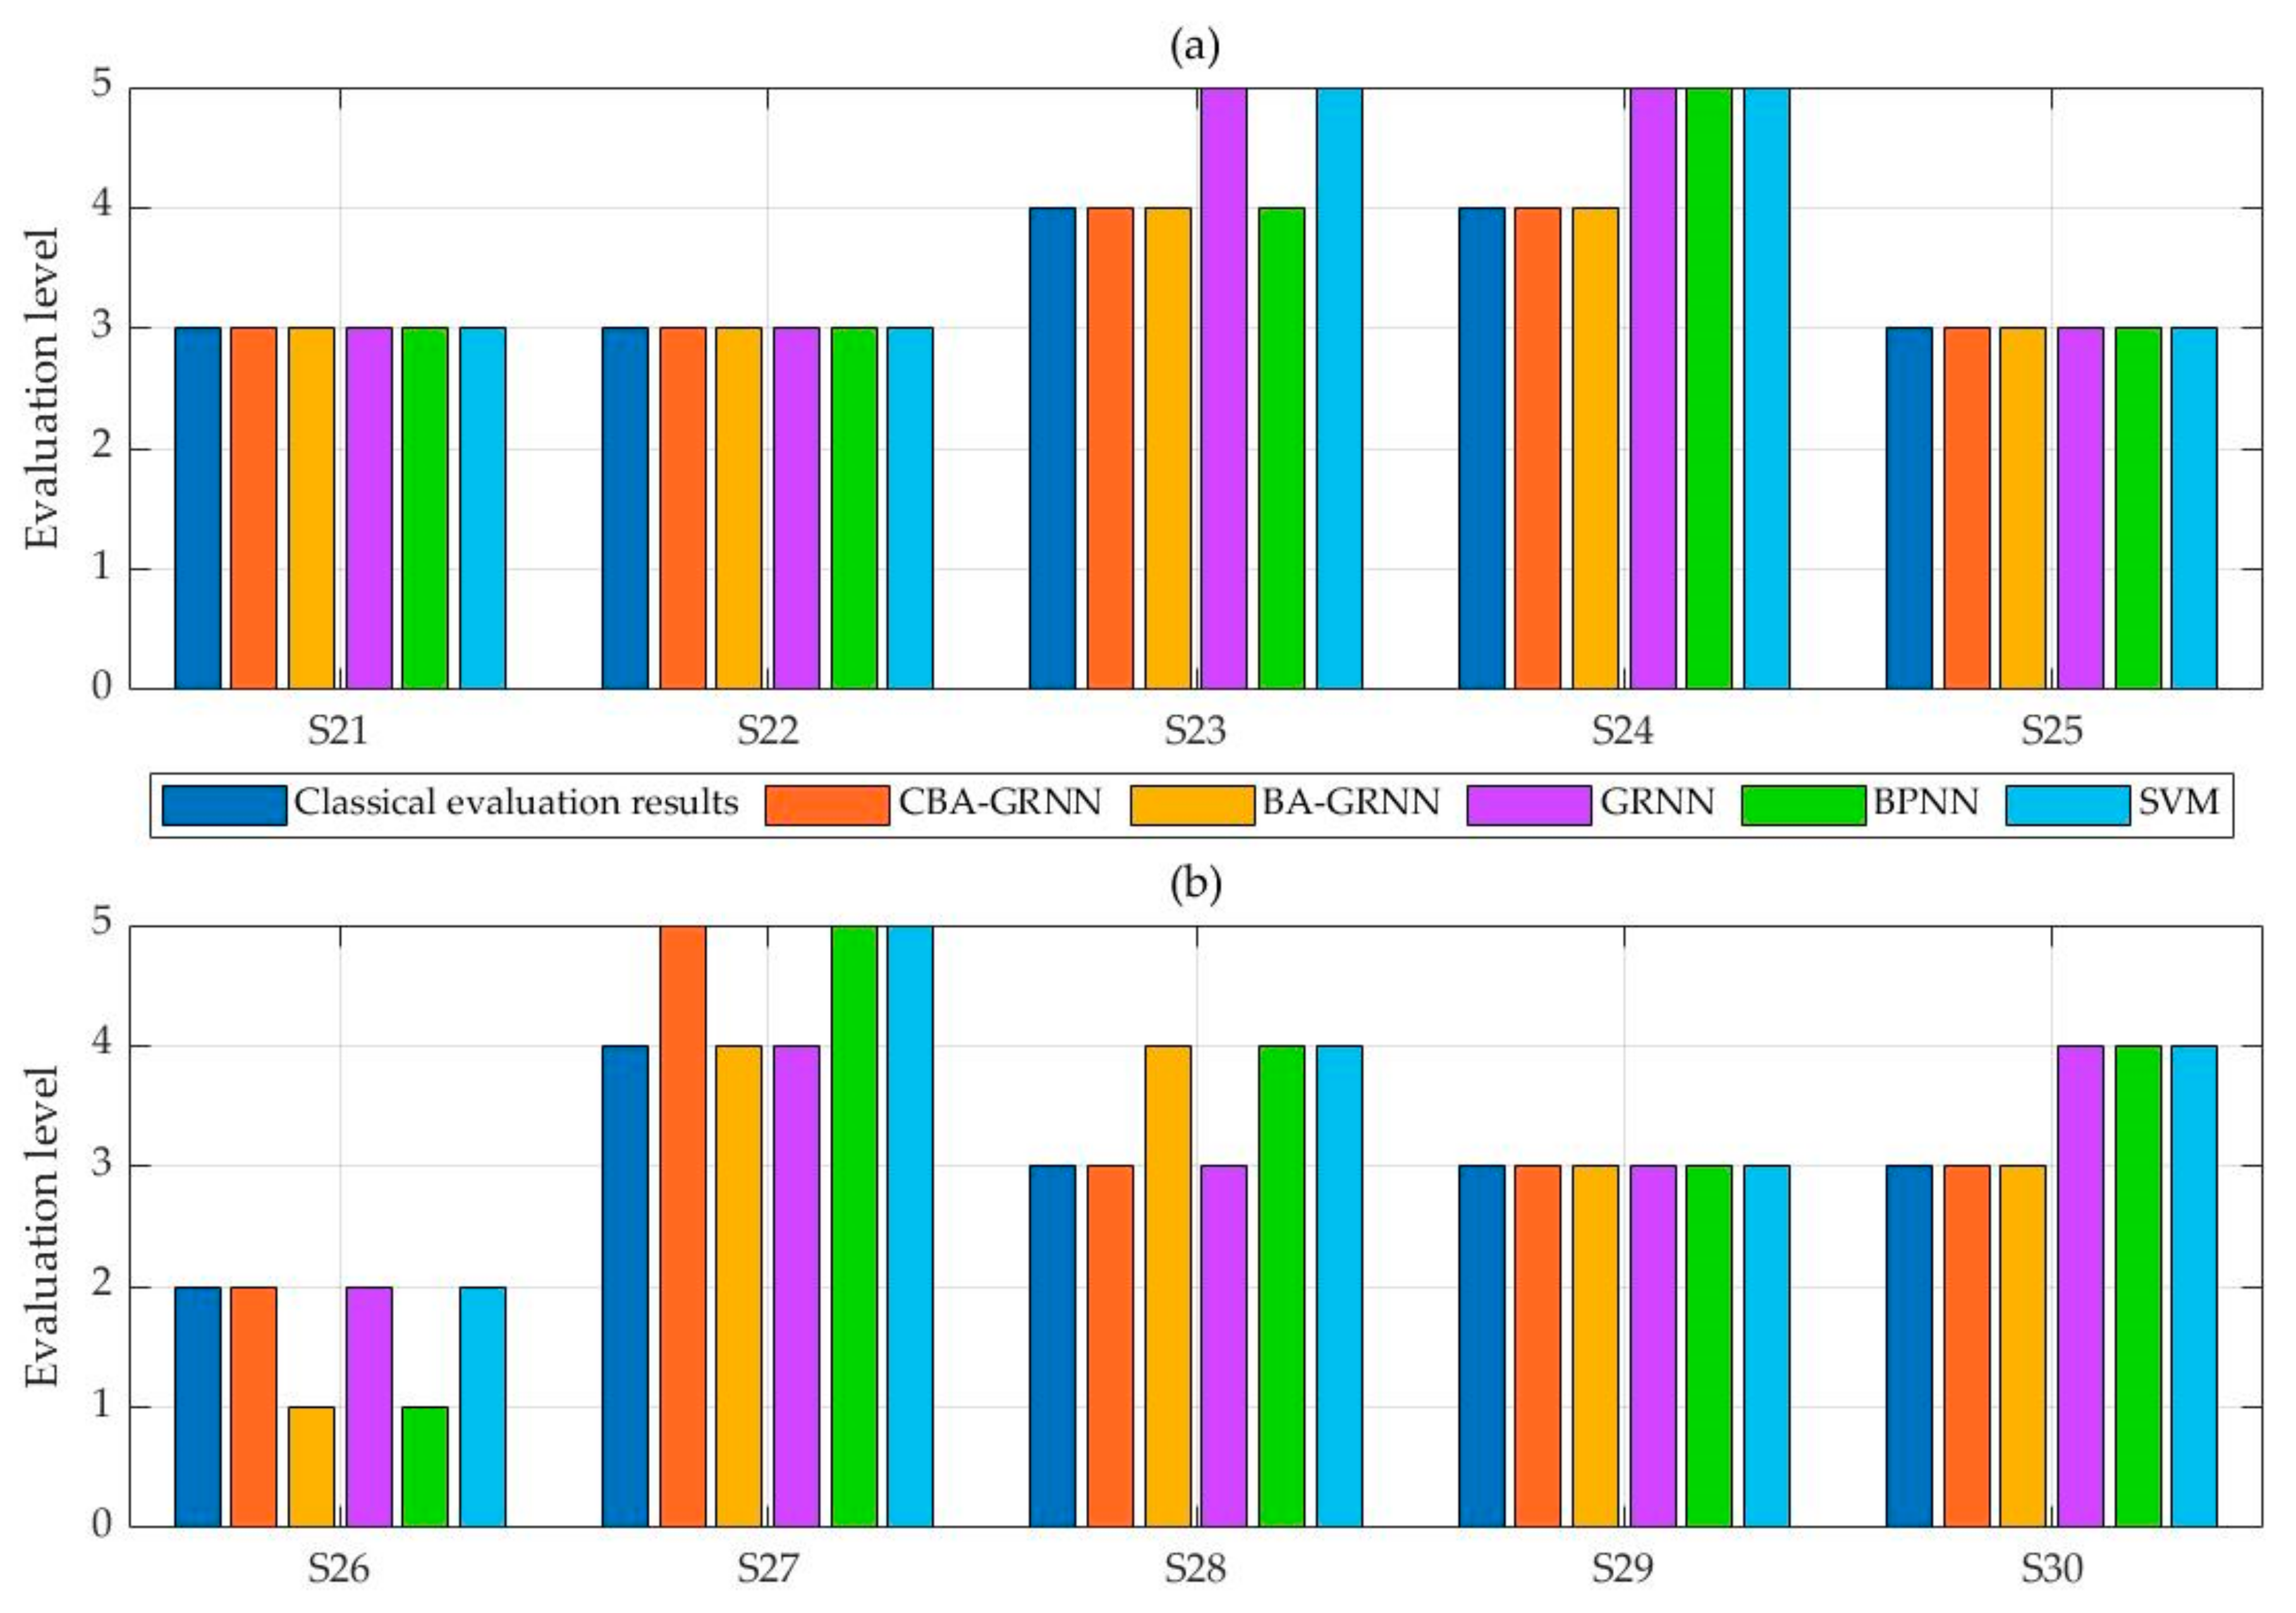
- The error of the evaluation results of the CBA-GRNN model is small, and the overall accuracy of the classification is the highest. Compared with the BA-GRNN model, the optimization performance of the GRNN model is better after the BA algorithm is improved by Tent chaotic mapping. Compared with the GRNN model, the parameters of GRNN can be optimized by the BA algorithm to improve its generalization ability and classification accuracy. Compared with the BPNN model and SVM model, the GRNN model has fewer adjustment parameters, is not easy to fall into a local minimum, and is good at dealing with large-scale training samples, thus greatly improving the accuracy of evaluation.
Author Contributions
Funding
Institutional Review Board Statement
Informed Consent Statement
Data Availability Statement
Conflicts of Interest
Appendix A

| Indexes | S1 | S2 | S3 | S4 | S5 | S6 | S7 | S8 | S9 | S10 |
|---|---|---|---|---|---|---|---|---|---|---|
| C11 | 0.9859 | 0.9155 | 0.8310 | 0.7465 | 0.4225 | 0.6338 | 0.3803 | 0.0423 | 0.0986 | 0.6197 |
| C12 | 0.5873 | 0.9524 | 0.2222 | 0.8254 | 0.7937 | 1.0000 | 0.6667 | 0.0476 | 0.8571 | 0.7143 |
| C21 | 0.2712 | 0.9492 | 0.7119 | 0.6610 | 0.7966 | 0.8475 | 0.8136 | 0.0339 | 1.0000 | 0.5254 |
| C22 | 0.6429 | 0.9286 | 0.0000 | 0.3810 | 0.5952 | 0.0238 | 0.8095 | 0.0714 | 0.5238 | 0.9524 |
| C23 | 0.8600 | 0.8800 | 0.7800 | 0.7000 | 0.6600 | 0.7600 | 0.2200 | 0.1000 | 0.8400 | 0.0000 |
| C33 | 0.0000 | 0.9583 | 0.7917 | 0.8611 | 0.5556 | 0.6667 | 0.9028 | 0.0417 | 0.7083 | 0.6250 |
| I11 | 0.7250 | 0.8500 | 0.5750 | 0.0000 | 0.7000 | 0.7000 | 0.0000 | 0.0750 | 0.7750 | 0.4250 |
| I12 | 0.0833 | 0.9833 | 0.9000 | 0.6667 | 0.0000 | 0.5833 | 0.5167 | 0.0167 | 0.6000 | 0.6667 |
| I13 | 0.5902 | 0.9836 | 0.4918 | 0.3770 | 0.8689 | 0.4262 | 0.5082 | 0.0164 | 0.4590 | 0.3115 |
| I14 | 0.7143 | 0.9429 | 0.0000 | 0.1286 | 0.4286 | 0.0286 | 0.1143 | 0.0714 | 0.1286 | 0.5143 |
| I21 | 0.5476 | 0.9762 | 0.1667 | 0.2143 | 0.2143 | 0.0714 | 0.8333 | 0.0714 | 0.5952 | 0.2619 |
| I22 | 0.9474 | 0.9649 | 0.8421 | 0.2982 | 0.5965 | 0.7018 | 0.9123 | 0.0877 | 0.8947 | 0.8421 |
| I31 | 0.4615 | 0.9744 | 0.4615 | 0.0000 | 0.6667 | 0.8462 | 0.4103 | 0.1026 | 0.6667 | 0.4103 |
| I32 | 0.0000 | 0.9750 | 0.9250 | 0.5750 | 0.6250 | 0.5250 | 0.6000 | 0.1250 | 0.7500 | 0.7750 |
| I33 | 0.4000 | 0.5600 | 0.6000 | 0.2400 | 0.6800 | 0.4800 | 0.2000 | 0.1600 | 0.5200 | 0.0400 |
| P11 | 0.5250 | 1.0000 | 0.4750 | 0.1500 | 0.1500 | 0.4250 | 0.6750 | 0.0750 | 0.5250 | 1.0000 |
| P12 | 0.2500 | 0.9500 | 0.2750 | 0.0750 | 0.5000 | 0.0000 | 0.3500 | 0.1000 | 0.5000 | 0.5250 |
| P13 | 0.5349 | 0.9535 | 0.4419 | 0.6047 | 0.0698 | 0.6512 | 0.0233 | 0.1163 | 0.2326 | 0.5581 |
| P14 | 0.7222 | 1.0000 | 0.7500 | 0.9167 | 0.8333 | 0.9444 | 0.4167 | 0.0278 | 0.6667 | 0.5278 |
| P21 | 0.4318 | 0.9091 | 0.7045 | 0.6364 | 0.8182 | 0.6591 | 0.0682 | 0.0682 | 0.6591 | 0.6364 |
| P22 | 1.0000 | 0.8718 | 0.9744 | 0.8462 | 0.8205 | 0.9231 | 0.5897 | 0.0513 | 0.6410 | 0.0000 |
| P23 | 0.6829 | 0.9024 | 0.4390 | 0.4878 | 0.5122 | 0.3659 | 0.8293 | 0.0488 | 0.5610 | 1.0000 |
| P31 | 0.0000 | 0.9286 | 0.9762 | 0.1190 | 0.5952 | 0.6905 | 0.6905 | 0.0952 | 0.9762 | 0.4762 |
| P32 | 0.0972 | 0.9306 | 0.6250 | 0.6528 | 0.7639 | 0.9444 | 0.8611 | 0.0694 | 0.0000 | 0.6667 |
| R11 | 0.9070 | 0.8837 | 0.6047 | 0.2093 | 0.0000 | 0.4419 | 0.4186 | 0.0233 | 0.6744 | 0.6279 |
| R12 | 0.7069 | 0.8966 | 0.7414 | 0.7931 | 0.5517 | 0.5690 | 0.8966 | 0.0517 | 0.5690 | 0.7069 |
| R21 | 0.8500 | 0.8750 | 0.0000 | 0.6000 | 0.7250 | 0.1000 | 0.7250 | 0.0250 | 0.8000 | 0.5250 |
| R22 | 0.8636 | 0.9318 | 0.2727 | 0.6591 | 0.7727 | 0.8182 | 0.5682 | 0.1136 | 0.9091 | 0.9091 |
| Indexes | S11 | S12 | S13 | S14 | S15 | S16 | S17 | S18 | S19 | S20 |
|---|---|---|---|---|---|---|---|---|---|---|
| C11 | 0.7746 | 0.0282 | 0.9718 | 0.8592 | 0.6056 | 1.0000 | 0.8451 | 0.9437 | 0.8310 | 0.0000 |
| C12 | 0.6984 | 0.0317 | 0.9683 | 0.8254 | 0.7143 | 0.9841 | 0.5873 | 0.8095 | 0.5873 | 0.6667 |
| C21 | 0.5593 | 0.0000 | 0.9322 | 0.3220 | 0.7288 | 0.9322 | 0.7797 | 0.4915 | 0.7627 | 0.7119 |
| C22 | 0.7857 | 0.0714 | 0.8571 | 0.7619 | 0.9524 | 0.9048 | 0.5238 | 0.7857 | 0.9524 | 0.6905 |
| C23 | 0.7600 | 0.0800 | 0.9000 | 0.5400 | 1.0000 | 0.9200 | 0.7400 | 0.9600 | 0.6000 | 0.6400 |
| C33 | 0.6667 | 0.0417 | 0.9583 | 0.7361 | 0.9722 | 0.9306 | 0.6806 | 1.0000 | 0.8333 | 0.6528 |
| I11 | 0.6250 | 0.1000 | 0.9500 | 0.5500 | 0.5250 | 0.9000 | 0.8500 | 1.0000 | 0.6000 | 0.7750 |
| I12 | 1.0000 | 0.0667 | 0.9667 | 0.8667 | 0.4167 | 0.9500 | 0.6167 | 0.0000 | 0.4167 | 0.7167 |
| I13 | 0.0000 | 0.0164 | 0.9836 | 0.5738 | 0.0984 | 0.9836 | 0.9836 | 0.1148 | 0.2951 | 0.1803 |
| I14 | 1.0000 | 0.0143 | 0.9143 | 0.8429 | 0.0000 | 0.9857 | 0.4714 | 0.8571 | 0.4429 | 0.4714 |
| I21 | 0.1190 | 0.0238 | 0.9524 | 0.6190 | 0.2857 | 0.8810 | 0.9048 | 0.0000 | 1.0000 | 0.0714 |
| I22 | 0.0000 | 0.0877 | 0.9825 | 0.8070 | 0.6140 | 0.9474 | 0.7544 | 1.0000 | 0.8596 | 0.6667 |
| I31 | 0.5897 | 0.0256 | 0.9231 | 0.7179 | 0.6154 | 1.0000 | 0.6923 | 0.5897 | 0.8462 | 0.5641 |
| I32 | 1.0000 | 0.0750 | 0.9000 | 0.5750 | 0.8250 | 0.9750 | 0.6750 | 0.6750 | 0.9000 | 0.6750 |
| I33 | 0.2800 | 0.0400 | 0.6800 | 0.0000 | 0.0400 | 1.0000 | 0.2400 | 0.7200 | 0.4400 | 0.5600 |
| P11 | 0.6750 | 0.0500 | 0.9750 | 0.5500 | 0.3750 | 0.9750 | 0.6250 | 0.0000 | 0.3000 | 0.0750 |
| P12 | 0.3750 | 0.0250 | 0.9750 | 0.5250 | 0.2250 | 0.8750 | 1.0000 | 0.1500 | 0.0000 | 0.0750 |
| P13 | 0.4419 | 0.1163 | 0.9070 | 0.3721 | 0.4651 | 0.9767 | 0.0930 | 0.2558 | 0.5349 | 0.0233 |
| P14 | 0.6111 | 0.0556 | 0.9444 | 0.8889 | 0.5278 | 0.9444 | 0.4167 | 0.6944 | 0.8611 | 0.8611 |
| P21 | 0.6364 | 0.0455 | 0.8864 | 0.5682 | 0.6591 | 0.9545 | 0.6818 | 0.7955 | 0.5000 | 1.0000 |
| P22 | 0.6923 | 0.0513 | 0.9487 | 0.7692 | 0.6154 | 0.8462 | 0.5641 | 0.9744 | 0.4872 | 0.5385 |
| P23 | 0.8049 | 0.0976 | 0.9756 | 0.3659 | 0.6341 | 0.8780 | 0.0000 | 0.7805 | 0.5366 | 0.7317 |
| P31 | 0.7619 | 0.0952 | 0.9524 | 0.6667 | 0.4762 | 0.9048 | 0.1190 | 0.7143 | 0.7381 | 1.0000 |
| P32 | 0.5278 | 0.0556 | 0.9861 | 0.4444 | 0.5833 | 1.0000 | 0.9722 | 0.7083 | 0.9861 | 0.8750 |
| R11 | 0.2791 | 0.0930 | 0.8837 | 0.4651 | 1.0000 | 0.9070 | 0.1395 | 0.4651 | 0.8837 | 0.9070 |
| R12 | 0.8103 | 0.0000 | 0.9310 | 0.6724 | 0.8103 | 0.9310 | 0.6034 | 0.8103 | 0.5517 | 0.6034 |
| R21 | 0.8250 | 0.0500 | 0.9750 | 0.4750 | 0.5250 | 0.9250 | 0.4750 | 0.9250 | 0.9250 | 0.6750 |
| R22 | 0.4318 | 0.0909 | 0.9091 | 0.9773 | 1.0000 | 0.9545 | 0.7727 | 0.6364 | 0.2500 | 0.1591 |
| Indexes | S21 | S22 | S23 | S24 | S25 | S26 | S27 | S28 | S29 | S30 |
|---|---|---|---|---|---|---|---|---|---|---|
| C11 | 0.7324 | 0.6197 | 0.9296 | 0.9155 | 0.6479 | 0.0423 | 0.9859 | 0.7183 | 0.6056 | 0.8732 |
| C12 | 0.0000 | 0.5397 | 0.9683 | 0.9365 | 0.9365 | 0.0159 | 0.9683 | 0.9365 | 0.7937 | 0.6825 |
| C21 | 0.6610 | 0.5424 | 0.9492 | 0.9322 | 0.7119 | 0.0169 | 0.9153 | 1.0000 | 0.7458 | 0.9831 |
| C22 | 0.6429 | 1.0000 | 0.9524 | 0.9286 | 0.0714 | 0.1190 | 0.9762 | 0.6429 | 0.5714 | 0.6667 |
| C23 | 0.7400 | 0.7200 | 0.9200 | 0.8800 | 0.2800 | 0.1000 | 0.9800 | 0.1600 | 0.6200 | 0.7400 |
| C33 | 0.6250 | 0.4583 | 0.9167 | 0.9583 | 0.6528 | 0.0556 | 0.9306 | 1.0000 | 0.6944 | 0.6389 |
| I11 | 0.5500 | 0.8750 | 0.8750 | 0.8500 | 0.6750 | 0.0500 | 0.8750 | 0.6000 | 1.0000 | 0.7750 |
| I12 | 0.4167 | 0.5500 | 0.9833 | 0.9000 | 0.5500 | 0.0500 | 0.9000 | 0.6000 | 0.2167 | 0.4333 |
| I13 | 0.5574 | 0.2787 | 0.9836 | 0.9836 | 0.3443 | 0.0164 | 0.9836 | 0.4918 | 0.0492 | 1.0000 |
| I14 | 0.5857 | 0.6143 | 0.9857 | 0.9714 | 0.3857 | 0.0143 | 0.9429 | 0.3143 | 0.3429 | 0.1714 |
| I21 | 0.5238 | 0.6905 | 0.9762 | 0.9524 | 0.6905 | 0.0476 | 0.8810 | 0.5952 | 0.4048 | 0.1905 |
| I22 | 0.7544 | 0.9123 | 0.9649 | 0.8947 | 0.7368 | 0.0175 | 0.9298 | 1.0000 | 0.9123 | 0.5965 |
| I31 | 0.7949 | 0.6154 | 0.9487 | 0.9487 | 0.6923 | 0.1026 | 0.9744 | 0.6667 | 0.7179 | 0.5897 |
| I32 | 0.6500 | 0.5250 | 0.8500 | 0.8750 | 1.0000 | 0.0500 | 0.9250 | 0.7250 | 0.7500 | 0.7750 |
| I33 | 0.0800 | 0.0000 | 0.5200 | 0.6800 | 0.4800 | 0.1600 | 0.6400 | 0.1600 | 0.7200 | 0.3200 |
| P11 | 0.4250 | 0.2250 | 0.9250 | 1.0000 | 0.0250 | 0.0750 | 0.9250 | 0.5750 | 0.3750 | 0.6250 |
| P12 | 0.4250 | 0.4500 | 0.8750 | 0.9500 | 0.4500 | 0.0750 | 0.9500 | 0.2750 | 0.2000 | 0.3500 |
| P13 | 0.0000 | 0.3488 | 0.9767 | 0.9070 | 0.1163 | 0.0930 | 0.9535 | 1.0000 | 0.2326 | 0.0233 |
| P14 | 0.0000 | 0.8611 | 0.9167 | 1.0000 | 0.5833 | 0.1111 | 0.9722 | 0.4444 | 0.7778 | 0.4722 |
| P21 | 0.6136 | 0.5000 | 0.9545 | 0.8636 | 0.7955 | 0.0682 | 0.9091 | 0.0000 | 0.6136 | 0.5455 |
| P22 | 0.8718 | 0.7179 | 0.9231 | 0.9231 | 0.8462 | 0.0513 | 0.9487 | 0.1026 | 0.7692 | 0.5897 |
| P23 | 0.4146 | 0.4390 | 0.9024 | 0.9268 | 0.4146 | 0.0732 | 0.9024 | 0.9024 | 0.3659 | 0.8293 |
| P31 | 0.5238 | 0.3810 | 0.9524 | 0.9048 | 0.3095 | 0.0714 | 0.9286 | 0.0000 | 0.5238 | 0.6905 |
| P32 | 0.3056 | 0.5556 | 0.9722 | 0.9861 | 0.9583 | 0.0278 | 0.9444 | 0.9028 | 0.9028 | 0.5278 |
| R11 | 0.4419 | 0.9302 | 0.8605 | 0.9535 | 0.5349 | 0.0233 | 0.9302 | 0.0698 | 0.0698 | 0.5581 |
| R12 | 0.8276 | 0.7586 | 0.9138 | 0.9483 | 0.8448 | 0.0517 | 0.9310 | 1.0000 | 0.7241 | 0.7759 |
| R21 | 0.5750 | 0.9500 | 0.8750 | 0.9250 | 0.4750 | 0.1250 | 0.8500 | 0.8750 | 0.8500 | 1.0000 |
| R22 | 0.6364 | 0.2273 | 0.9773 | 0.9091 | 0.4545 | 0.0909 | 0.8636 | 0.0909 | 0.0000 | 0.0227 |
| Indexes | S1 | S2 | ||||||||
|---|---|---|---|---|---|---|---|---|---|---|
| Level 1 | Level 2 | Level 3 | Level 4 | Level 5 | Level 1 | Level 2 | Level 3 | Level 4 | Level 5 | |
| C11 | −1.00 | −1.00 | −1.00 | −0.60 | 1.00 | −1.00 | −1.00 | −1.00 | 0.40 | 1.00 |
| C12 | −1.00 | 0.40 | 1.00 | −0.40 | −1.00 | −1.00 | −1.00 | −1.00 | −0.20 | 1.00 |
| C21 | 1.00 | 0.83 | −1.00 | −1.00 | −1.00 | −1.00 | −1.00 | −1.00 | 0.00 | 1.00 |
| C22 | −1.00 | −1.00 | 0.60 | 1.00 | −0.60 | −1.00 | −1.00 | −1.00 | 0.20 | 1.00 |
| C23 | −1.00 | −1.00 | −1.00 | 1.00 | 1.00 | −1.00 | −1.00 | −1.00 | 0.80 | 1.00 |
| C33 | 1.00 | −0.17 | −1.00 | −1.00 | −1.00 | −1.00 | −1.00 | −1.00 | 0.20 | 1.00 |
| I11 | −1.00 | −1.00 | 0.20 | 1.00 | −0.20 | −1.00 | −1.00 | −0.80 | 1.00 | 0.80 |
| I12 | 1.00 | 0.00 | −1.00 | −1.00 | −1.00 | −1.00 | −1.00 | −1.00 | −0.40 | 1.00 |
| I13 | −1.00 | −1.00 | −1.00 | 0.93 | 1.00 | −1.00 | −1.00 | −1.00 | −0.67 | 1.00 |
| I14 | −1.00 | −1.00 | 0.40 | 1.00 | −0.40 | −1.00 | −1.00 | −1.00 | 0.80 | 1.00 |
| I21 | −1.00 | −1.00 | 0.80 | 1.00 | −0.80 | −1.00 | −1.00 | −1.00 | −0.80 | 1.00 |
| I22 | −1.00 | −1.00 | −1.00 | 0.60 | 1.00 | −1.00 | −1.00 | −1.00 | 0.40 | 1.00 |
| I31 | −1.00 | 0.40 | 1.00 | −0.40 | −1.00 | −1.00 | −1.00 | −1.00 | 0.40 | 1.00 |
| I32 | 1.00 | 0.73 | −1.00 | −1.00 | −1.00 | −1.00 | −1.00 | −1.00 | 0.80 | 1.00 |
| I33 | −1.00 | −1.00 | 0.80 | 1.00 | −0.80 | −1.00 | −1.00 | 0.00 | 1.00 | 0.00 |
| P11 | −1.00 | 0.20 | 1.00 | −0.20 | −1.00 | −1.00 | −1.00 | −1.00 | 0.40 | 1.00 |
| P12 | −0.20 | 1.00 | 0.20 | −1.00 | −1.00 | −1.00 | −1.00 | −1.00 | 0.20 | 1.00 |
| P13 | −1.00 | 0.00 | 1.00 | 0.00 | −1.00 | −1.00 | −1.00 | −1.00 | 0.40 | 1.00 |
| P14 | −1.00 | −1.00 | 0.80 | 1.00 | −0.80 | −1.00 | −1.00 | −1.00 | 0.80 | 1.00 |
| P21 | −1.00 | 0.80 | 1.00 | −0.80 | −1.00 | −1.00 | −1.00 | −1.00 | 0.60 | 1.00 |
| P22 | −1.00 | −1.00 | −1.00 | 0.80 | 1.00 | −1.00 | −1.00 | −0.20 | 1.00 | 0.20 |
| P23 | −1.00 | −1.00 | 0.40 | 1.00 | −0.40 | −1.00 | −1.00 | −1.00 | 0.60 | 1.00 |
| P31 | −1.00 | 0.40 | 1.00 | −0.40 | −1.00 | −1.00 | −1.00 | −1.00 | 0.00 | 1.00 |
| P32 | −0.50 | 1.00 | 0.50 | −1.00 | −1.00 | −1.00 | −1.00 | −1.00 | −0.50 | 1.00 |
| R11 | −1.00 | −1.00 | 1.00 | 1.00 | −1.00 | −1.00 | −0.87 | 1.00 | 0.87 | −1.00 |
| R12 | −1.00 | −0.80 | 1.00 | 0.80 | −1.00 | −1.00 | −1.00 | −1.00 | 1.00 | 1.00 |
| R21 | −1.00 | −1.00 | −0.20 | 1.00 | 0.20 | −1.00 | −1.00 | −0.40 | 1.00 | 0.40 |
| R22 | −1.00 | −1.00 | 0.47 | 1.00 | −0.47 | −1.00 | −1.00 | 0.07 | 1.00 | −0.07 |
| Sample | Level 1 CCD | Level 2 CCD | Level 3 CCD | Level 4 CCD | Level 5 CCD |
|---|---|---|---|---|---|
| S1 | −0.6184 | −0.3644 | 0.0055 | 0.1410 | −0.3871 |
| S2 | −1.0000 | −0.9960 | −0.8215 | 0.3919 | 0.8215 |
| S3 | −0.6140 | −0.3803 | −0.0550 | 0.2529 | −0.3311 |
| S4 | −0.5838 | −0.2966 | 0.1269 | 0.2694 | −0.5431 |
| S5 | −0.6383 | −0.4056 | 0.1275 | 0.2458 | −0.4892 |
| S6 | −0.7134 | −0.2970 | 0.0634 | 0.0799 | −0.3500 |
| S7 | −0.6006 | −0.2630 | −0.1388 | 0.1516 | −0.2606 |
| S8 | 0.8440 | 0.5493 | −0.8440 | −0.9631 | −1.0000 |
| S9 | −0.7845 | −0.4973 | 0.1576 | 0.3361 | −0.3731 |
| S10 | −0.8153 | −0.1705 | 0.3566 | 0.0507 | −0.5413 |
| S11 | −0.7469 | −0.4751 | 0.2065 | 0.3269 | −0.4597 |
| S12 | 0.8609 | 0.5336 | −0.8609 | −0.9656 | −1.0000 |
| S13 | −1.0000 | −0.9960 | −0.8578 | 0.3190 | 0.8578 |
| S14 | −0.8837 | −0.4733 | 0.2409 | 0.4482 | −0.3572 |
| S15 | −0.8848 | −0.3552 | 0.3527 | 0.1906 | −0.4679 |
| S16 | −1.0000 | −1.0000 | −0.8366 | 0.3217 | 0.8366 |
| S17 | −0.8542 | −0.3606 | 0.3469 | 0.1438 | −0.4927 |
| S18 | −0.7247 | −0.6189 | −0.3898 | 0.2740 | 0.1145 |
| S19 | −0.9170 | −0.3742 | 0.1464 | 0.1776 | −0.2294 |
| S20 | −0.6821 | −0.3726 | 0.2227 | 0.1300 | −0.5406 |
| S21 | −0.7489 | −0.3088 | 0.4624 | 0.2312 | −0.7135 |
| S22 | −0.8015 | −0.2440 | 0.2661 | 0.1822 | −0.4645 |
| S23 | −1.0000 | −0.9921 | −0.8084 | 0.3650 | 0.8084 |
| S24 | −1.0000 | −1.0000 | −0.8280 | 0.4536 | 0.8280 |
| S25 | −0.7651 | −0.2877 | 0.2358 | 0.0806 | −0.4707 |
| S26 | 0.8718 | 0.5390 | −0.8718 | −0.9664 | −1.0000 |
| S27 | −1.0000 | −1.0000 | −0.8337 | 0.3863 | 0.8337 |
| S28 | −0.6135 | −0.4459 | −0.2323 | −0.0089 | −0.1543 |
| S29 | −0.6941 | −0.4290 | 0.1322 | 0.2459 | −0.4381 |
| S30 | −0.8519 | −0.3564 | 0.2289 | 0.1747 | −0.3771 |
| Sample | Level 1 RMD | Level 2 RMD | Level 3 RMD | Level 4 RMD | Level 5 RMD |
|---|---|---|---|---|---|
| S1 | 0.1908 | 0.3178 | 0.5027 | 0.5705 | 0.3064 |
| S2 | 0.0000 | 0.0020 | 0.0893 | 0.6960 | 0.9107 |
| S3 | 0.1930 | 0.3099 | 0.4725 | 0.6265 | 0.3345 |
| S4 | 0.2081 | 0.3517 | 0.5635 | 0.6347 | 0.2284 |
| S5 | 0.1809 | 0.2972 | 0.5638 | 0.6229 | 0.2554 |
| S6 | 0.1433 | 0.3515 | 0.5317 | 0.5400 | 0.3250 |
| S7 | 0.1997 | 0.3685 | 0.4306 | 0.5758 | 0.3697 |
| S8 | 0.9220 | 0.7746 | 0.0780 | 0.0184 | 0.0000 |
| S9 | 0.1078 | 0.2513 | 0.5788 | 0.6681 | 0.3134 |
| S10 | 0.0923 | 0.4148 | 0.6783 | 0.5254 | 0.2294 |
| S11 | 0.1266 | 0.2624 | 0.6033 | 0.6635 | 0.2702 |
| S12 | 0.9304 | 0.7668 | 0.0696 | 0.0172 | 0.0000 |
| S13 | 0.0000 | 0.0020 | 0.0711 | 0.6595 | 0.9289 |
| S14 | 0.0582 | 0.2634 | 0.6204 | 0.7241 | 0.3214 |
| S15 | 0.0576 | 0.3224 | 0.6764 | 0.5953 | 0.2660 |
| S16 | 0.0000 | 0.0000 | 0.0817 | 0.6609 | 0.9183 |
| S17 | 0.0729 | 0.3197 | 0.6735 | 0.5719 | 0.2536 |
| S18 | 0.1377 | 0.1906 | 0.3051 | 0.6370 | 0.5572 |
| S19 | 0.0415 | 0.3129 | 0.5732 | 0.5888 | 0.3853 |
| S20 | 0.1590 | 0.3137 | 0.6113 | 0.5650 | 0.2297 |
| S21 | 0.1255 | 0.3456 | 0.7312 | 0.6156 | 0.1433 |
| S22 | 0.0992 | 0.3780 | 0.6330 | 0.5911 | 0.2677 |
| S23 | 0.0000 | 0.0040 | 0.0958 | 0.6825 | 0.9042 |
| S24 | 0.0000 | 0.0000 | 0.0860 | 0.7268 | 0.9140 |
| S25 | 0.1174 | 0.3561 | 0.6179 | 0.5403 | 0.2646 |
| S26 | 0.9359 | 0.7695 | 0.0641 | 0.0168 | 0.0000 |
| S27 | 0.0000 | 0.0000 | 0.0832 | 0.6932 | 0.9168 |
| S28 | 0.1933 | 0.2770 | 0.3839 | 0.4956 | 0.4229 |
| S29 | 0.1529 | 0.2855 | 0.5661 | 0.6230 | 0.2810 |
| S30 | 0.0741 | 0.3218 | 0.6145 | 0.5873 | 0.3115 |
References
- Nowotny, J.; Dodson, J.; Fiechter, S.; Gür, T.M.; Kennedy, B.; Macyk, W.; Bak, T.; Sigmund, W.; Yamawaki, M.; Rahman, K.A. Towards global sustainability: Education on environmentally clean energy technologies. Renew. Sustain. Energy Rev. 2018, 81, 2541–2551. [Google Scholar] [CrossRef]
- Jennings, P. New directions in renewable energy education. Renew. Energy 2009, 34, 435–439. [Google Scholar] [CrossRef]
- Portuguez Castro, M.; Ross Scheede, C.; Gómez Zermeño, M.G. The Impact of Higher Education on Entrepreneurship and the Innovation Ecosystem: A Case Study in Mexico. Sustainability 2019, 11, 5597. [Google Scholar] [CrossRef]
- Kuntadi, I.; Trisno, B.; Ratnata, I.W.; Sukadi, S.; Sriyono, S. Potential and prospect analysis of labor market in education in the fields of renewable energy engineering, industrial automation and robotics, and automotive engineering. Iop Conf. Ser. Mater. Sci. Eng. 2020, 830, 032058. [Google Scholar] [CrossRef]
- Leal Filho, W.; Salvia, A.L.; Do Paco, A.; Anholon, R.; Quelhas, O.L.; Rampasso, I.S.; Ng, A.; Balogun, A.L.; Kondev, B.; Brandli, L.L. A comparative study of approaches towards energy efficiency and renewable energy use at higher education institutions. J. Clean. Prod. 2019, 237, 117728. [Google Scholar] [CrossRef]
- Zou, X.; Zhu, C.; Ling, M.; Chang, X.; Du, J. Analysis of Investment Decision of Coastal Clean Energy Project Based on Market Connection. J. Coast. Res. 2020, 115, 383–386. [Google Scholar] [CrossRef]
- Maghyereh, A.; Abdoh, H. The impact of extreme structural oil-price shocks on clean energy and oil stocks. Energy 2021, 225, 120209. [Google Scholar] [CrossRef]
- Siddiqi, M.H.; Liu, X.M.; Qureshi, T.; Tabish, A.N.; Nawaz, S.; Iqbal, T. Performance analysis of bio-fuel blends for clean energy production: Thermogravimetric analysis. J. Clean. Prod. 2020, 273, 122936. [Google Scholar] [CrossRef]
- Alherbawi, M.; AlNouss, A.; McKay, G.; Al-Ansari, T. Optimum sustainable utilisation of the whole fruit of Jatropha curcas: An energy, water and food nexus approach. Renew. Sustain. Energy Rev. 2021, 137, 110605. [Google Scholar] [CrossRef]
- Jonsdottir, S.R. Two sides of the same coin: Innovation education and entrepreneurship education in Iceland. Bull. Inst. Technol. Vocat. Educ. 2008, 5, 69–75. [Google Scholar]
- Cruz, N.M.; Escudero, A.I.; Barahona, J.H.; Leitao, F.S. The effect of entrepreneurship education programmers on satisfaction with innovation behaviour and performance. J. Eur. Ind. Train. 2013, 33, 198–214. [Google Scholar] [CrossRef]
- Beiler, M.R.O. Integrating Innovation and Entrepreneurship Principles into the Civil Engineering Curriculum. J. Prof. Issues Eng. Educ. Pract. 2015, 141, 4–14. [Google Scholar]
- Mars, M.M. The Meaning and Relevancy of Innovation and Entrepreneurship: An Exploration of Agriculture Teacher Preparation and Perspectives. J. Agric. Educ. 2016, 57, 55–69. [Google Scholar] [CrossRef]
- Maritz, A.; De Waal, A.; Buse, S.; Herstatt, C.; Lassen, A.; Maclachlan, R. Innovation education programs: Toward a conceptual framework. Eur. J. Innov. Manag. 2014, 17, 166–182. [Google Scholar] [CrossRef]
- Xu, L.; Zhang, Q.; Shi, X. Stakeholders strategies in poverty alleviation and clean energy access: A case study of China’s PV poverty alleviation program. Energy Policy 2019, 135, 111011. [Google Scholar] [CrossRef]
- Alao, M.A.; Ayodele, T.R.; Ogunjuyigbe, A.S.; Popoola, O.M. Multi-criteria decision based waste to energy technology selection using entropy-weighted TOPSIS technique: The case study of Lagos, Nigeria. Energy 2020, 201, 117675. [Google Scholar] [CrossRef]
- Jin, J.; Zhu, L.; Li, Z.; Tong, X.; Yang, C. Application of Variable Structure of BPNN in Risk Evaluation of Overseas Railway Construction in Target Countries. Tiedao Xuebao/J. China Railw. Soc. 2018, 40, 7–12. [Google Scholar]
- Liu, J.B.; Malik, M.A.; Ayub, N.; Siddiqui, H.M. Distance Measures for Multiple-Attributes Decision-Making Based on Connection Numbers of Set Pair Analysis with Dual Hesitant Fuzzy Sets. IEEE Access 2020, 8, 9172–9184. [Google Scholar] [CrossRef]
- Zhan, J.; Jiang, H.; Yao, Y. Covering-based variable precision fuzzy rough sets with PROMETHEE-EDAS methods. Inf. Sci. 2020, 538, 314–336. [Google Scholar] [CrossRef]
- Pitti, A.; Quoy, M.; Lavandier, C.; Boucenna, S. Gated spiking neural network using Iterative Free-Energy Optimization and rank-order coding for structure learning in memory sequences (INFERNO GATE). Neural Netw. 2020, 121, 242–258. [Google Scholar] [CrossRef]
- Zhu, Y.; Tian, D.; Yan, F. Effectiveness of Entropy Weight Method in Decision-Making. Math. Probl. Eng. 2020, 2020, 3564835. [Google Scholar] [CrossRef]
- Shen, X.; Zheng, Y.; Zhang, R. A Hybrid Forecasting Model for the Velocity of Hybrid Robotic Fish Based on Back-Propagation Neural Network with Genetic Algorithm Optimization. IEEE Access 2020, 8, 111731–111741. [Google Scholar] [CrossRef]
- Shankar, K.; Lakshmanaprabu, S.K.; Gupta, D.; Maseleno, A.; De Albuquerque, V.H.C. Optimal feature-based multi-kernel SVM approach for thyroid disease classification. J. Supercomput. 2020, 76, 1128–1143. [Google Scholar] [CrossRef]
- Fan, S.; Gong, Y.; Yang, J.; Liu, Y.; Wu, T.; Ma, X.; Luo, L. Fault identification in T-connection transmission lines based on general regression neural network and traveling wave power angle. J. Phys. Conf. Ser. 2020, 1570, 012054. [Google Scholar] [CrossRef]
- Liu, E.; Liu, J.; Yu, K.; Wang, Y.; He, P. A hybrid model for predicting spatial distribution of soil organic matter in a bamboo forest based on general regression neural network and interative algorithm. J. For. Res. 2020, 31, 209–216. [Google Scholar] [CrossRef]
- Qiu, R.; Wang, Y.; Wang, D.; Qiu, W.; Wu, J.; Tao, Y. Water temperature forecasting based on modified artificial neural network methods: Two cases of the Yangtze River. Sci. Total Environ. 2020, 737, 139729. [Google Scholar] [CrossRef]
- Liang, Y.; Niu, D.; Hong, W. Short Term Load Forecasting Based on Feature Extraction and Improved General Regression Neural Network model. Energy 2019, 166, 653–663. [Google Scholar] [CrossRef]
- Shao, Z.; Qiu, L.F.; Zhang, Y.P. Design of Wideband Differentially Fed Multilayer Stacked Patch Antennas Based on Bat Algorithm. IEEE Antennas Wirel. Propag. Lett. 2020, 19, 1172–1176. [Google Scholar] [CrossRef]
- Pan, Z.; Quynh, N.V.; Ali, Z.M.; Dadfar, S.; Kashiwagi, T. Enhancement of Maximum Power Point Tracking Technique Based on PV-Battery System using Hybrid BAT Algorithm and Fuzzy Controller. J. Clean. Prod. 2020, 274, 123719. [Google Scholar] [CrossRef]
- Ge, C. Research and Practice on Innovation and Entrepreneurship Education in Colleges and Universities based on Professional Perspective. Int. J. Technol. Manag. 2016, 4, 19–21. [Google Scholar]
- Hameed, I.; Khan, M.B.; Shahab, A.; Hameed, I.; Qadeer, F. Science, Technology and Innovation through Entrepreneurship Education in the United Arab Emirates (UAE). Sustainability 2016, 8, 1280. [Google Scholar] [CrossRef]
- Mahmoud, A. Technology Innovation and Engineering’ Education and Entrepreneurship (TIEE) in Engineering Schools: Novel Model for Elevating National Knowledge Based Economy and Socio-Economic Sustainable Development. Sustainability 2017, 9, 171. [Google Scholar]
- Temino-Boes, R.; Romero-Lopez, R.; Ibarra-Zavaleta, S.P.; Romero, I. Using grey clustering to evaluate nitrogen pollution in estuaries with limited data. Sci. Total Environ. 2020, 722, 137964. [Google Scholar] [CrossRef]
- Kurniawan, F.H.; Surarso, B.; Suseno, J.E. Supplier selection in rank order using fuzzy ahp and fuzzy molp with sensitivity analysis. J. Phys. Conf. Ser. 2020, 1524, 012094. [Google Scholar] [CrossRef]
- Kumar, S.; Singh, R. Rank order clustering and imperialist competitive optimization based cost and RAM analysis on different industrial sectors. J. Manuf. Syst. 2020, 56, 514–524. [Google Scholar] [CrossRef]
- Wei, G.; Sun, P.; Zhang, Z.; Ouyang, X. The Coordinated Relationship between Investment Potential and Economic Development and Its Driving Mechanism: A Case Study of the African Region. Sustainability 2020, 12, 442. [Google Scholar] [CrossRef]
- Li, C.; Sun, L.; Jia, J.; Cai, Y.; Wang, X. Risk assessment of water pollution sources based on an integrated k-means clustering and set pair analysis method in the region of Shiyan, China. Sci. Total Environ. 2016, 557–558, 307–316. [Google Scholar] [CrossRef]
- Niu, D.; Wang, H.; Chen, H.; Liang, Y. The General Regression Neural Network Based on the Fruit Fly Optimization Algorithm and the Data Inconsistency Rate for Transmission Line Icing Prediction. Energies 2017, 10, 2066. [Google Scholar] [CrossRef]
- Adarsh, B.R.; Raghunathan, T.; Jayabarathi, T.; Yang, X.S. Economic dispatch using chaotic bat algorithm. Energy 2016, 96, 666–675. [Google Scholar] [CrossRef]
- Sureshkumar, K.; Ponnusamy, V. Power flow management in micro grid through renewable energy sources using a hybrid modified dragonfly algorithm with bat search algorithm. Energy 2019, 181, 1166–1178. [Google Scholar] [CrossRef]
- Zhang, X.; Wei, Z. A Hybrid Model Based on Principal Component Analysis, Wavelet Transform, and Extreme Learning Machine Optimized by Bat Algorithm for Daily Solar Radiation Forecasting. Sustainability 2019, 11, 4138. [Google Scholar] [CrossRef]
- Ma, B.; Chang, L.; Wang, C.; Li, J.; Wang, X.; Shi, Y.-Q. Robust image watermarking using invariant accurate polar harmonic Fourier moments and chaotic mapping. Signal Process. 2020, 172, 107544. [Google Scholar] [CrossRef]


| First Grade Indexes | Second Index | Third Grade Indexes |
|---|---|---|
| Innovation and Entrepreneurship Education Environment of Clean Energy Major in Colleges and Universities (C) | External support environment (C1) | Government support policy (C11) |
| Social assistance (C12) | ||
| School implementation environment (C2) | Clean energy major training program (C21) | |
| Organization and management institution setting (C22) | ||
| Entrepreneurship income distribution system (C23) | ||
| Entrepreneurship of clean energy major (C3) | Technology transfer (C33) | |
| Investment in Innovation and Entrepreneurship Education of Clean Energy Major in Colleges and Universities (I) | Faculty of clean energy major (I1) | Teaching staffing of clean energy Major (I11) |
| The proportion of external tutors of clean energy major in entrepreneurship guidance teachers (I12) | ||
| The teacher-student ratio of innovation and entrepreneurship in clean energy major (I13) | ||
| The proportion of clean energy teachers with entrepreneurial experience (I14) | ||
| Funding of clean energy major (I2) | The proportion of school funds in innovation and entrepreneurship education of clean energy major in total school education funds (I21) | |
| Personal input of students majoring in clean energy (I22) | ||
| Practice platform of clean energy major (I3) | Practice teaching base of clean energy major (I31) | |
| Clean energy innovation and entrepreneurship activities (I32) | ||
| Clean energy professional practice base opening (I33) | ||
| Innovation and Entrepreneurship Education Process of Clean Energy Major in Colleges and Universities (P) | Curriculum system of clean energy major (P1) | The number of innovation and entrepreneurship courses accounted for the proportion of professional courses of clean energy major (P11) |
| The proportion of innovation and entrepreneurship course hours in the total course hours of clean energy major (P12) | ||
| The proportion of credits for innovation and entrepreneurship courses to the total credits for clean energy major (P13) | ||
| The penetration of innovation and entrepreneurship courses in clean energy major (P14) | ||
| Service guidance support of clean energy major (P2) | Information release of innovation and entrepreneurship in clean energy (P21) | |
| The construction of innovative and entrepreneurial guidance institutions for clean energy (P22) | ||
| The construction of innovative and entrepreneurial education associations for clean energy (P23) | ||
| Student participation process of clean energy major (P3) | Attendance rate of clean energy students’ innovation and entrepreneurship courses (P31) | |
| Participation of clean energy students in innovation and entrepreneurship activities (P32) | ||
| Results of Innovation and Entrepreneurship Education for Clean Energy Major in Colleges and Universities (R) | Social impact (R1) | Proportion of clean energy graduates with success in innovation and entrepreneurship (R11) |
| Base training clean energy enterprises (R12) | ||
| Education effectiveness of clean energy major (R2) | The improvement of entrepreneurial quality of students majoring in clean energy (R21) | |
| The proportion of graduates majoring in clean energy in employment (R22) |
| Evaluation Indicators | Types | Level 1 | Level 2 | Level 3 | Level 4 | Level 5 |
|---|---|---|---|---|---|---|
| C11 | Qualitative | 60 | 70 | 80 | 90 | 100 |
| C12 | Qualitative | 60 | 70 | 80 | 90 | 100 |
| C21 | Qualitative | 60 | 70 | 80 | 90 | 100 |
| C22 | Qualitative | 60 | 70 | 80 | 90 | 100 |
| C23 | Qualitative | 60 | 70 | 80 | 90 | 100 |
| C33 | Qualitative | 60 | 70 | 80 | 90 | 100 |
| I11 | Qualitative | 60 | 70 | 80 | 90 | 100 |
| I12 | Quantitative | 20 | 30 | 40 | 50 | 70 |
| I13 | Quantitative | 0.1 | 0.2 | 0.3 | 0.4 | 0.7 |
| I14 | Quantitative | 10 | 30 | 50 | 70 | 90 |
| I21 | Quantitative | 10 | 20 | 30 | 40 | 50 |
| I22 | Qualitative | 60 | 70 | 80 | 90 | 100 |
| I31 | Qualitative | 60 | 70 | 80 | 90 | 100 |
| I32 | Qualitative | 60 | 70 | 80 | 90 | 100 |
| I33 | Qualitative | 60 | 70 | 80 | 90 | 100 |
| P11 | Quantitative | 10 | 20 | 30 | 40 | 50 |
| P12 | Quantitative | 10 | 20 | 30 | 40 | 50 |
| P13 | Quantitative | 10 | 20 | 30 | 40 | 50 |
| P14 | Qualitative | 60 | 70 | 80 | 90 | 100 |
| P21 | Qualitative | 60 | 70 | 80 | 90 | 100 |
| P22 | Qualitative | 60 | 70 | 80 | 90 | 100 |
| P23 | Qualitative | 60 | 70 | 80 | 90 | 100 |
| P31 | Quantitative | 25 | 50 | 70 | 90 | 100 |
| P32 | Quantitative | 20 | 40 | 60 | 80 | 100 |
| R11 | Quantitative | 15 | 30 | 45 | 60 | 75 |
| R12 | Qualitative | 60 | 70 | 80 | 90 | 100 |
| R21 | Qualitative | 60 | 70 | 80 | 90 | 100 |
| R22 | Quantitative | 10 | 25 | 40 | 55 | 70 |
| Index Number | RO Method Weight | Weight of Entropy Weight Method | Combination Weight | Index Number | RO Method Weight | Weight of Entropy Weight Method | Combination Weight |
|---|---|---|---|---|---|---|---|
| C11 | 0.047 | 0.030 | 0.048 | I33 | 0.002 | 0.049 | 0.004 |
| C12 | 0.062 | 0.027 | 0.057 | P11 | 0.015 | 0.047 | 0.024 |
| C21 | 0.059 | 0.024 | 0.047 | P12 | 0.005 | 0.056 | 0.009 |
| C22 | 0.037 | 0.033 | 0.042 | P13 | 0.007 | 0.061 | 0.015 |
| C23 | 0.042 | 0.027 | 0.039 | P14 | 0.049 | 0.026 | 0.043 |
| C33 | 0.064 | 0.024 | 0.053 | P21 | 0.032 | 0.028 | 0.031 |
| I11 | 0.039 | 0.029 | 0.039 | P22 | 0.054 | 0.028 | 0.051 |
| I12 | 0.022 | 0.042 | 0.031 | P23 | 0.030 | 0.028 | 0.028 |
| I13 | 0.017 | 0.054 | 0.031 | P31 | 0.025 | 0.039 | 0.033 |
| I14 | 0.010 | 0.060 | 0.020 | P32 | 0.052 | 0.031 | 0.054 |
| I21 | 0.012 | 0.053 | 0.022 | R11 | 0.020 | 0.044 | 0.030 |
| I22 | 0.069 | 0.024 | 0.056 | R12 | 0.067 | 0.018 | 0.041 |
| I31 | 0.034 | 0.024 | 0.028 | R21 | 0.044 | 0.028 | 0.043 |
| I32 | 0.057 | 0.022 | 0.042 | R22 | 0.027 | 0.041 | 0.038 |
| Samples | Eigenvalues | Grades | Samples | Eigenvalues | Grades |
|---|---|---|---|---|---|
| S1 | 3.2563 | 3 | S16 | 4.5037 | 5 |
| S2 | 4.4815 | 4 | S17 | 3.3244 | 3 |
| S3 | 3.3096 | 3 | S18 | 3.7034 | 4 |
| S4 | 3.1629 | 3 | S19 | 3.5067 | 4 |
| S5 | 3.2473 | 3 | S20 | 3.2091 | 3 |
| S6 | 3.2918 | 3 | S21 | 3.1557 | 3 |
| S7 | 3.2815 | 3 | S22 | 3.2794 | 3 |
| S8 | 1.5499 | 2 | S23 | 4.4747 | 4 |
| S9 | 3.4314 | 3 | S24 | 4.4795 | 4 |
| S10 | 3.1982 | 3 | S25 | 3.2524 | 3 |
| S11 | 3.3574 | 3 | S26 | 1.5308 | 2 |
| S12 | 1.5367 | 2 | S27 | 4.4924 | 4 |
| S13 | 4.5139 | 5 | S28 | 3.3823 | 3 |
| S14 | 3.4967 | 3 | S29 | 3.3110 | 3 |
| S15 | 3.3597 | 3 | S30 | 3.3878 | 3 |
| Samples | Classic Evaluation Results | CBA-GRNN | BA-GRNN | GRNN | BPNN | SVM | |||||
|---|---|---|---|---|---|---|---|---|---|---|---|
| Evaluation Result | Relative Error | Evaluation Result | Relative Error | Evaluation Result | Relative Error | Evaluation Result | Relative Error | Evaluation Result | Relative Error | ||
| S21 | 3.1557 | 3.0828 | −2.31% | 3.0393 | −3.69% | 3.3306 | 5.54% | 3.3981 | 7.68% | 2.9462 | −6.64% |
| S22 | 3.2794 | 3.3846 | 3.21% | 3.1144 | −5.03% | 3.1469 | −4.04% | 3.1308 | −4.53% | 3.0423 | −7.23% |
| S23 | 4.4747 | 4.3713 | −2.31% | 4.2254 | −5.57% | 4.6563 | 4.06% | 4.0827 | −8.76% | 4.6899 | 4.81% |
| S24 | 4.4795 | 4.3635 | −2.59% | 4.3607 | −2.65% | 4.7979 | 7.11% | 4.6703 | 4.26% | 4.7868 | 6.86% |
| S25 | 3.2524 | 3.2338 | −0.57% | 3.3955 | 4.40% | 3.3685 | 3.57% | 3.4056 | 4.71% | 3.0107 | −7.43% |
| S26 | 1.5308 | 1.5837 | 3.46% | 1.4349 | −6.26% | 1.6326 | 6.65% | 1.4515 | −5.18% | 1.6295 | 6.45% |
| S27 | 4.4924 | 4.5625 | 1.56% | 4.2610 | −5.15% | 4.2799 | −4.73% | 4.8859 | 8.76% | 4.7804 | 6.41% |
| S28 | 3.3823 | 3.4638 | 2.41% | 3.5653 | 5.41% | 3.2260 | −4.62% | 3.6252 | 7.18% | 3.6752 | 8.66% |
| S29 | 3.3110 | 3.2289 | −2.48% | 3.4676 | 4.73% | 3.4898 | 5.40% | 3.0537 | −7.77% | 3.4663 | 4.69% |
| S30 | 3.3878 | 3.3207 | −1.98% | 3.1903 | −5.83% | 3.6087 | 6.52% | 3.5992 | 6.24% | 3.5562 | 4.97% |
| Samples | Classic Evaluation Results | CBA-GRNN | BA-GRNN | GRNN | BPNN | SVM |
|---|---|---|---|---|---|---|
| S21 | 3 | 3 | 3 | 3 | 3 | 3 |
| S22 | 3 | 3 | 3 | 3 | 3 | 3 |
| S23 | 4 | 4 | 4 | 5 | 4 | 5 |
| S24 | 4 | 4 | 4 | 5 | 5 | 5 |
| S25 | 3 | 3 | 3 | 3 | 3 | 3 |
| S26 | 2 | 2 | 1 | 2 | 1 | 2 |
| S27 | 4 | 5 | 4 | 4 | 5 | 5 |
| S28 | 3 | 3 | 4 | 3 | 4 | 4 |
| S29 | 3 | 3 | 3 | 3 | 3 | 3 |
| S30 | 3 | 3 | 3 | 4 | 4 | 4 |
| relative error | - | 10% | 20% | 30% | 50% | 50% |
Publisher’s Note: MDPI stays neutral with regard to jurisdictional claims in published maps and institutional affiliations. |
© 2021 by the authors. Licensee MDPI, Basel, Switzerland. This article is an open access article distributed under the terms and conditions of the Creative Commons Attribution (CC BY) license (https://creativecommons.org/licenses/by/4.0/).
Share and Cite
Liang, Y.; Wang, H.; Hong, W.-C. Sustainable Development Evaluation of Innovation and Entrepreneurship Education of Clean Energy Major in Colleges and Universities Based on SPA-VFS and GRNN Optimized by Chaos Bat Algorithm. Sustainability 2021, 13, 5960. https://doi.org/10.3390/su13115960
Liang Y, Wang H, Hong W-C. Sustainable Development Evaluation of Innovation and Entrepreneurship Education of Clean Energy Major in Colleges and Universities Based on SPA-VFS and GRNN Optimized by Chaos Bat Algorithm. Sustainability. 2021; 13(11):5960. https://doi.org/10.3390/su13115960
Chicago/Turabian StyleLiang, Yi, Haichao Wang, and Wei-Chiang Hong. 2021. "Sustainable Development Evaluation of Innovation and Entrepreneurship Education of Clean Energy Major in Colleges and Universities Based on SPA-VFS and GRNN Optimized by Chaos Bat Algorithm" Sustainability 13, no. 11: 5960. https://doi.org/10.3390/su13115960
APA StyleLiang, Y., Wang, H., & Hong, W.-C. (2021). Sustainable Development Evaluation of Innovation and Entrepreneurship Education of Clean Energy Major in Colleges and Universities Based on SPA-VFS and GRNN Optimized by Chaos Bat Algorithm. Sustainability, 13(11), 5960. https://doi.org/10.3390/su13115960