Abstract
In internal combustion engines, a significant share of the fuel energy is wasted via the heat losses. This study aims to understand the heat losses and analyze the potential of the waste heat recovery when biofuels are used in SI engines. A numerical model is developed for a single-cylinder, four-stroke and air-cooled SI engine to carry out the waste heat recovery analysis. To verify the numerical solution, experiments are first conducted for the gasoline engine. Biofuels including pure ethanol (E100), E15 (15% ethanol) and E85 (85% ethanol) are then studied using the validated numerical model. Furthermore, the exhaust power to heat loss ratio () is investigated for different compression ratios, ethanol fuel content and engine speed to understand the exhaust losses potential in terms of the heat recovery. The results indicate that heat loss to brake power ratio () increases by the increment in the compression ratio. In addition, increasing the compression ratio leads to decreasing the ratio for all studied fuels. According to the results, there is a direct relationship between the ethanol in fuel content and ratio. As the percentage of ethanol in fuel increases, the ratio rises. Thus, the more the ethanol in the fuel and the less the compression ratio, the more the potential for the waste heat recovery of the IC engine. Considering both power and waste heat recovery, the most efficient fuel is E100 due to the highest brake thermal efficiency and ratio and E85, E15 and E00 (pure gasoline) come next in the consecutive orders. At the engine speeds and compression ratios examined in this study (3000 to 5000 rpm and a CR of 8 to 11), the maximum efficiency is about 35% at 5000 rpm and the compression ratio of 11 for E100. The minimum percentage of heat loss is 21.62 happening at 5000 rpm and the compression ratio of 8 by E100. The minimum percentage of exhaust loss is 35.8% happening at 3000 rpm and the compression ratio of 11 for E00. The most is 2.13 which is related to E100 at the minimum compression ratio of 8.
1. Introduction
The demand for fossil fuels has increased overwhelmingly in the transportation industry in the last decades. This has worsened environmental issues such as air quality degradation and global warming [1,2]. During recent years, different solutions such as using alternative fuels including biofuels have been considered for conventional vehicles in order to reduce the emissions of fossil fuels [3,4,5,6]. For using alternative fuels, researchers applied different methods to ameliorate the performance of engines consuming biofuels. These methods included making various mixtures of the main fuel with ethanol, methanol and butanol [7,8,9,10,11], changing the geometry of the engine for using biofuels [12,13,14] and using different strategies for biofuels injections [15,16,17].
Feng et al. [18] evaluated the combustion performance of a dual injection SI engine by using an n-butanol direct injection and gasoline port fuel injection in a single-cylinder SI engine. Their results indicated that the dual injection strategy with n-butanol had benefits in improving various engine outputs including fuel efficiency compared with gasoline PFI. It was shown that at maximum brake torque spark timings, the engine produced 5% and 2.2% higher indicated mean effective pressure (IMEP) in comparison to gasoline port fuel injection (PFI) and gasoline direct injection (GDI), respectively. In another work, Turner et al. [19] carried out an experimental analysis on a direct injection, spark ignition engine at a part load and speed condition. The benefits of adding ethanol into gasoline were demonstrated in terms of reducing the engine-out emissions and increasing the efficiency. Tornatore et al. [20] examined the effect of E85 injection mode on performance, gaseous and particle emissions of a turbocharged port fuel SI engine at 3000 rpm and high engine load for different air–fuel ratios. In their research, ethanol and gasoline were supplied into the intake manifold by two different ways: through two separated low-pressure fuel injection systems and in a blend. The ratio between ethanol and gasoline was fixed at 0.85 by volume (E85). Results showed that adding ethanol can resolve over-fueling with an increase in thermal efficiency without engine load penalties.
Compression ratio (CR) is an important parameter for the performance and efficiency of internal combustion engines. Different researchers have studied the role of CR in combustion characteristics, emissions and the thermal efficiency of spark ignition [21,22,23,24]. Wittek et al. [25] investigated experimentally the potential of variable compression ratio (VCR) technology in a 3-cylinder, direct injection turbocharged SI engine fueled with regular road octane number (RON) 95 gasoline. They applied a 2-stage variable compression ratio system to a series engine. Results showed that a higher compression ratio would result in a lower fuel consumption in both low and high load. Balki and Sayin [26] studied experimentally the effect of the compression ratio on an SI engine using pure methanol, ethanol and unleaded gasoline. They concluded that brake mean effective pressure, cylinder gas pressure, brake thermal efficiency and brake specific fuel consumption increase by using ethanol and methanol at all compression ratios. Celik et al. [27] used methanol at a high compression ratio to increase performance and decrease emissions of a single-cylinder gasoline engine. Their results showed that by increasing the compression ratio with methanol, the engine power and brake thermal efficiency increased by up to 14% and 36%, respectively. Furthermore, Costa and Sodre [28] investigated the influence of compression ratio on the performance of an SI engine fueled by a blend of 78% gasoline and 22% ethanol (E22) and E100. They found that higher compression ratios improved engine performance for both fuels at all engine speeds. In another study, Thomas et al. [29] carried out an experimental investigation on an SI engine, using pure gasoline and 20% n-butanol blend (B20) at different loads in order to examine the variation of different parameters with respect to the compression ratio changes. Their results showed that brake thermal efficiency increases with the increase of CR at all loads.
In internal combustion engines, a major part of the fuel power is wasted via exhaust gases and some is dissipated through heat transfer and friction losses [30,31,32]. Accordingly, various technologies including turbochargers, thermoelectric generators (TEG) and organic rankine cycles (ORC) are utilized in order to reuse the exhaust power from ICEs [33,34]. To achieve a highly efficient vehicle, it is crucial to reduce various losses. In this concept, CR is the single important parameter affecting the engine losses and engine efficiency. As demonstrated, the majority of the previous studies on CR focused only on its influence on performance characteristics of large-scale and water-cooled SI or CI engines. However, detailed research about a thermal balance analysis of bio-fueled engines at various compression ratios, and the potential for waste heat recovery especially when the biofuels are used is missing in literature. Waste heat recovery could be a solution in reducing the fuel consumption in engine applications. For the purpose of the waste heat recovery, the engine exhaust power can be conveniently converted to useful work. Thus, it is highly important to find the appropriate engine operation conditions for the waste heat recovery while keeping the engine performance at the optimum condition.
2. Methodology
In this paper, an investigation of the energy balance of a single-cylinder, four-stroke and air-cooled engine is carried out to understand the potential waste heat recovery. First, the experimental tests are performed at 50% wide-open throttle in 3000, 4000 and 5000 rpm using pure gasoline (E00) and the collected data are used for validation. Pure ethanol (E100) and ethanol–gasoline blends of E15 (15% ethanol + 85% gasoline) and E85 (85% ethanol + 15% gasoline) as alternative biofuels are then investigated numerically. To assess and compare the effect of compression ratio on energy balance, various CRs including 8, 9, 10 and 11 are examined numerically. Unlike the heat transfer, the power of exhaust gases can be recovered easily due to the notable energy quality (high temperature and pressure) of the exhaust. In order to specify the waste heat recovery potential, the ratio of exhaust losses to the heat losses () is calculated and the impact of CR, the percentage of ethanol in fuel content and engine speed ratio is examined. Furthermore, other key performance parameters such as the heat transfer to brake power ratio () and brake specific fuel consumption (BSFC) are considered in this paper.
2.1. Experimental Analysis
A single-cylinder, four-stroke and spark ignition engine is employed in this study. Schematic diagrams of the measurement instruments and laboratory equipment are shown in Figure 1.
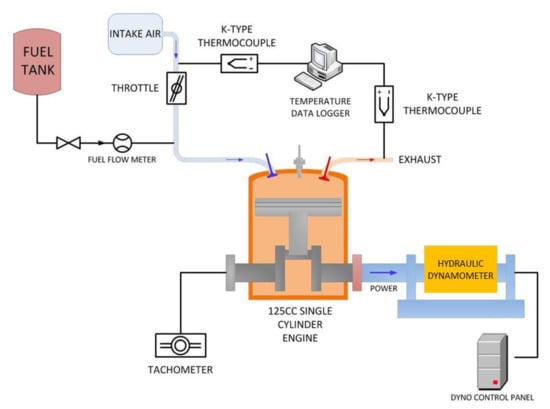
Figure 1.
Engine Test Setup.
The experimental setup consisted of K-type thermocouples, flow meter, engine and hydraulic dynamometer. Temperature measurements were performed by K-type thermocouple with accuracy of 2.2 °C. The dynamometer of this test setup was a hydraulic dynamometer made by an oil pump. The engine output shaft was connected to the pump input shaft by a chain. The pump was not fixed and could rotate freely through two bearings with very low friction. As the engine operated, the pump tended to rotate due to Newton’s third law of motion. A load cell was placed in such a way that it did not allow the pump to rotate and resisted the rotation of the pump. The load cell and the strain gauge were calibrated with precise weights. During engine operation, the force inserted by the pump to the load cell was measured and recorded by a data logger. Then, having the distance between the pump shaft center and the place where the force acts, the applied torque was calculated. The dynamometer was connected to the control panel and its accuracy was about 0.1 . Measurement instruments were calibrated before each test. To achieve the steady-state operating condition, the engine was run for about twenty minutes with conventional gasoline (E00) before any measurement. A gasoline engine with a compression ratio of 9.1:1 without any modifications was used for this research. The experiments were conducted at half throttle in various engine speeds including 3000, 4000 and 5000 rpm and all experiments were repeated 3 times. Indeed, experiments were conducted at 50% wide-open throttle and part load. In order to achieve the target engine speeds including 3000, 4000 and 5000 rpm at half throttle, the dynamometer braking torque was adjusted. The required engine parameters for thermodynamic simulation such as geometry of engine, fuel consumption, etc., were measured experimentally and used in the model.
A creative and accurate method was used to measure the fuel consumption. In this method, a transparent calibrated tank was used as the fuel tank. The fuel consumption during engine operation was filmed using the time-lapse technique. Then, the video was analyzed using an image processing code in MATLAB software (MathWorks, Natick, MA, USA). In this way, the fuel consumption was calculated knowing the time interval and size scale which was used to calibrate the tank.
2.2. Numerical Analysis
The engine used in this study is an air-cooled, one-cylinder engine with a carburetor fuel delivery system. A great advantage of the carburetor fuel delivery system is the ability to change the air to fuel ratio manually. In all parts of this study, stoichiometric ratios were assumed for different fuel mixtures. The engine technical specifications are presented in Table 1. The numerical investigation was carried out without any modifications of the bore and the stroke of the engine because it affects the engine heat transfer and friction characteristic significantly. The clearance volume of the engine was changed in order to adjust different compression ratios.

Table 1.
Technical Specifications of the Studied Engine.
The engine is modeled numerically by a differential equation to simulate total energy balance and operating conditions. The cylinder pressure versus crank angle is calculated from Equation (1) which is a type of implicit ordinary differential equation (ODE). The Runge–Kutta 4th order method is utilized to solve the equation.
Required parameters are attained from the engine geometry and models of combustion and heat transfer which are presented in following sections.
2.2.1. Geometry
The cylinder displacement is calculated by Equation (2), where is the distance between the piston pin and crankshaft axes as given in Equation (3) [35].
2.2.2. Combustion
The mass fraction burned at any crank angle is calculated from the integral of the energy release normalized by the total energy release. The energy release profile is curve-fitted with Weibe function as specified in Equation (4). varies from 0 to 0.99.
Weibe function is a very useful tool to model the characteristic feature of heat release in an internal combustion engine. The laminar flame speed and consequently the heat release rate of ethanol is greater than gasoline. This changes their combustion and heat transfer characteristics and finally their heat recovery capability which is the main concern of this research. In this study, although the same function and method was used for all different blends, two adjustable parameters in Weibe function, “a” and “m”, were changed to calibrate the Weibe function according to the percentage of alcohol in the fuel [36,37].
2.2.3. Heat Transfer
For simulation of the internal combustion engines and estimation of heat transfer in the combustion chamber, several models such as Annand, Woschni and Hohenber have been proposed in the literature. Although the Woschni model was initially introduced for diesel engines, it was later investigated numerically and experimentally for SI engines and its validity was confirmed [38,39,40,41]. The Woschni heat transfer correlation is highly accurate and acceptable in spark ignition engines to calculate the heat transfer coefficient as given in Equation (5).
where B, P and T are cylinder bore, instantaneous cylinder pressure and gas temperature, respectively. The average cylinder gas velocity is specified in Equation (6).
where , are mean piston speed and motored cylinder pressure at the same crank angle as P. Also, , and are defined as working fluid temperature, pressure and volume at some reference state, respectively. The amounts of , as constant parameters for engine processes based on engine speed and swirl are used from Heywood [35]. The simulated model is validated in previous studies [42,43]; therefore, the amount of can be calculated by Equation (7).
2.2.4. Fuel
In order to simulate the engine, fuel properties are applied in a numerical simulation. Properties of primary fuels that consist of pure gasoline (E00) and pure ethanol (E100) are given in Table 2. It is worth mentioning that in all parts of this study stoichiometric air to fuel ratios were assumed for different fuel mixtures.
Table 2.
Properties of Gasoline and Ethanol [44].
2.2.5. Engine Energy Balance
The energy balance analysis is a beneficial method in order to investigate the distribution of energy and find out how total fuel energy is divided into different parts. Steady flow energy balance in control volume is given in Equation (8).
The first law of thermodynamics in IC engines is applied by Equation (9).
Total fuel power, brake power and exhaust power are specified in Equations (10)–(12), respectively.
In Equation (10), is the total energy of the fuel after combustion. The parameter ηc in this equation indicates that unburned fuel is not considered in . In SI engines, the combustion efficiency is usually in the range of 95–98% [35]. By having the combustion efficiency and heating value of any studied fuel, QHV, fuel mass flow rate and can be calculated. Combustion efficiencies are the same from the experimental calculations and numerical simulations.
The specific heat of air at the mean exhaust temperature is considered the average specific heat of the exhaust gases [45,46,47,48]. Brake mean effective pressure (BMEP) is obtained by Equation (13). Subsequently, indicated mean effective pressure (IMEP) and friction mean effective pressure (FMEP) are given by Equations (14) and (15) [49]. There are several models for calculating engine friction. Some of these correlations are based only on engine speed and have low accuracy. However, the maximum pressure is especially important in addition to the engine speed. Therefore, Equation (15) is used which has included the pressure in addition to the engine speed. This correlation is of ordinary accuracy but it is simple and can be used easily. There are other correlations that are more complex containing multiple constants and have higher accuracy [50].
Thus, heat loss term dissipated through air, friction and lubrication oil is calculable via Equation (9).
3. Results and Discussion
3.1. Validation
Zero-dimensional models, despite their simplicity, are very efficient in making an accurate judgment of engine operation and they have been used extensively to study the thermodynamic engine performance in the literature. However, they do not take the dimensions in combustion and heat transfer into account, and like any other simulation tools they can face some degree of inaccuracy. The error can originate from several sources in engine simulation; one of the most important ones is the volumetric efficiency. In addition, the role of the heat transfer coefficient as an error source cannot be ignored. Therefore, the model should be validated against the experimental data prior to any simulation study.
In order to validate numerical solutions, four parameters including ratio, total fuel power, exhaust power and output power were obtained experimentally and compared with numerical results at a compression ratio of 9.1:1. As mentioned before, the experiments were conducted with conventional gasoline (E00) and data were collected at 3000, 4000 and 5000 rpm. Table 3 compares the data from the experiment with the simulation results. The accuracy of validations is acceptable; hence the results are dependable. Deviations of four validated parameters are calculated and given in Table 3.
Table 3.
Comparison of Engine Model Data with Experimental Tests Using E00.
To calculate the total fuel power, brake power and exhaust power from the experiments, Equations (10)–(12) are utilized. Subsequently, the amount of heat loss is achieved from Equation (9). As specified in Table 3, the amount of brake power, exhaust power and total fuel power rises by increasing the engine speed. Experimental and numerical analysis show that approximately one-third of the fuel energy is converted to effective power. Furthermore, as the engine speed increases the heat transfer to brake power ratio decreases in both experimental and numerical investigations. Although both brake power and heat transfer increase with engine speed, brake power growth is more than heat transfer; therefore, the ratio decreases.
3.2. Energy Balance Investigation
Energy distribution of the engine using pure gasoline (E00), E15, E85 and pure ethanol (E100) at different compression ratios is demonstrated in Table 4, Table 5, Table 6 and Table 7, respectively. Results were obtained by running the simulation at compression ratios of 8, 9, 10 and 11 with an engine speed of 3000, 4000 and 5000 rpm. To provide a better understanding of the data, each table is followed by the relevant bar graphs, shown as Figure 2, Figure 3, Figure 4 and Figure 5.
Table 4.
Energy Balance of Engine Using Pure Gasoline (E00) at Different Compression Ratios; (a) 8, (b) 9, (c) 10, (d) 11.
Table 5.
Energy Balance of Engine Using E15 at Different Compression Ratios; (a) 8, (b) 9, (c) 10, (d) 11.
Table 6.
Energy Balance of Engine Using E85 at Different Compression Ratios; (a) 8, (b) 9, (c) 10, (d) 11.
Table 7.
Energy Balance of Engine Using Pure Ethanol (E100) at Different Compression Ratios; (a) 8, (b) 9, (c) 10, (d) 11.

Figure 2.
Total Energy Balance of Engine Using Pure Gasoline (E00) vs. Compression Ratio at 3000, 4000 and 5000 rpm.

Figure 3.
Total Energy Balance of Engine Using E15 vs. Compression Ratio at 3000, 4000 and 5000 rpm.

Figure 4.
Total Energy Balance of Engine Using E85 vs. Compression Ratio at 3000, 4000 and 5000 rpm.
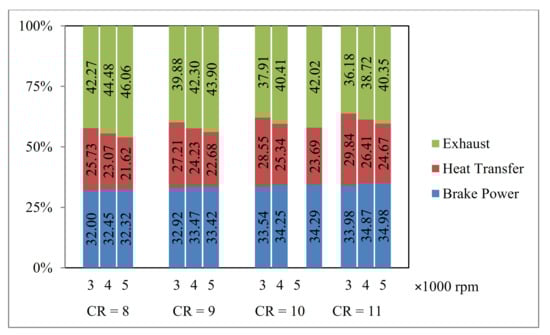
Figure 5.
Total Energy Balance of Engine Using Pure Ethanol (E100) vs. Compression Ratio at 3000, 4000 and 5000 rpm.
As given in Table 4, Table 5, Table 6 and Table 7 and Figure 2, Figure 3, Figure 4 and Figure 5, all three main parameters of the total energy, i.e., brake power, heat loss and exhaust energy, are increased by the engine speed. When the engine speed increases, more air and fuel enter the combustion chamber. As a result, more energy is released during the combustion cycle. On the other hand, by increasing the engine speed, the time of one cycle decreases; so, the amount of brake power as well as the power loss through heat and exhaust increases. Another noteworthy point in this section is that at a constant compression ratio, the share of heat loss decreases with increasing speed, and thus the share of power output and exhaust losses increase. The reason for this is the shortening of the cycle time by speed increment. As the time of a cycle decreases, the time for heat transfer decreases and the percentage of heat loss decreases; although, as mentioned above, its amount increases. Identical results were achieved in prior studies performed by Yusri et al. [51] and Sayin et al. [52]. As reported by Yusri et al. [51], by using gasoline the percentage of heat transfer was decreased by 2.14% in a compression ratio of 9.5 when the engine speed was changed from 3000 to 4000 rpm. This reduction was 3.04% and 3.28% for a compression ratio of 9 and 10, respectively.
At a constant engine speed, by increasing the compression ratio the brake power and heat loss increases, while the exhaust power decreases. By increasing the compression ratio due to the increase in temperature and pressure of the combustion chamber, more work is produced. This can also be inferred from the efficiency of an internal combustion engine; when the compression ratio increases, the efficiency of an internal combustion engine increases, which means an increase in brake work per energy input of the engine. Similar results were reported in previous studies in literature by Thakur et al. [53], Costa and Sodre [28] and Yucesu et al. [22]. Owen and Coley [54], for example, reported an improvement of 16% on the performance of a single-cylinder ethanol-fueled engine when the compression ratio was increased from 8 to 18. In this investigation, by using E100, the improvement of brake thermal efficiency is 8.23% by changing the compression ratio from 8 to 11 at 5000 rpm. On the other hand, by the increase in temperature because of increasing the compression ratio, the temperature difference between the combustion chamber and the environment increases, and thus more heat loss happens. In addition, increasing the pressure and temperature due to the increase of the compression ratio promotes the mobility of gases inside the combustion chamber, as a result, the convection heat transfer coefficient increases. This also contributes to the increase of the heat loss which was approved by Celik et al. [27]. Therefore, considering the principle of energy balance in the engine, with increasing work and heat losses, exhaust losses decrease.
At engine speeds between 3000 to 5000 rpm, the maximum efficiency is 34.98% happening at 5000 rpm and a compression ratio of 11 for E100. The minimum percentage of heat loss is 21.62% happening at 5000 rpm and a compression ratio of 8 for E100. The minimum percentage of exhaust loss is 35.8% happening at 3000 rpm and a compression ratio of 11 for E00. As shown in Table 4, Table 5 and Table 6, pure ethanol (E100) is ranked first in terms of converting total fuel energy to brake power for the same rpms and CRs. E85, E15 blends and E00 as conventional gasoline come next in the consecutive orders. Technically, there is a direct relationship between engine brake power and ethanol content of the blended fuel which is in compliance with Bayraktar [55] and Najafi et al. [56].
The total energy balance of the IC engine using four different fuels at operating conditions of CR = 8, 11 and 5000 rpm are illustrated in Figure 6. As can be seen, by increasing the compression ratio, the output power rises. In addition, for the same compression ratios, the highest percentage of brake power belongs to E100. Subsequently, other fuels including E85, E15 and E00 come next, according to the results. The reason for this is the flame speed and the engine combustion’s tendency to constant volume combustion. Ethanol has a higher flame speed than gasoline, which means the combustion is closer to a constant volume combustion. According to the thermodynamic principals, the more we move towards constant volume combustion, the higher the engine efficiency can be. Therefore, it is observed that the highest percentage of brake work is related to pure ethanol fuel (E100).
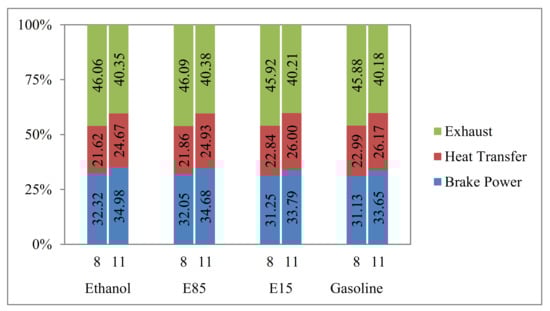
Figure 6.
Total Energy Balance of Engine Using Four Studied Fuels at Engine Speed of 5000 rpm and Compression Ratio of 8 and 11.
3.3. Heat Loss to Brake Power Ratio ()
Heat loss to brake power ratio (), as a key parameter to understand the engine wasted heat, is studied in various compression ratios and engine speeds. As presented in Figure 7a–c, there is a direct relationship between the ratio and compression ratio for all four studied fuels at all rpms. This is due to the increase of the heat loss by the compression ratio due to the increase of in-cylinder temperature, and the convection heat transfer coefficient parameter increases for all cases. The maximum is 0.96% for the gasoline at the 3000 rpm and the CR of 11. By increasing the ethanol percentage, the ratio reduces for various compression ratios and the lowest belongs to E100 at the highest rpm, i.e., 5000 rpm with a minimum CR of 8. Table 8 summarizes the effect of various parameters on . Furthermore, by increasing the engine speed the ratio decreases for all the fuels. This is due to the short time of heat transfer at high engine speeds.
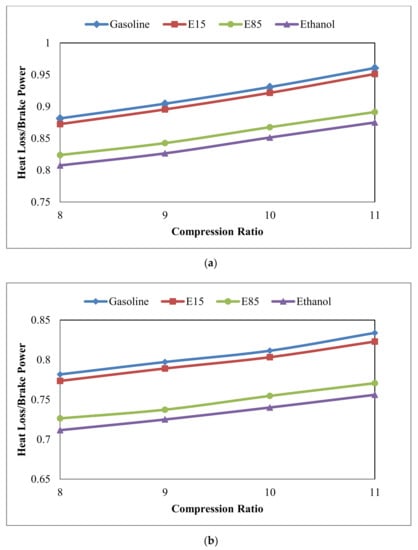
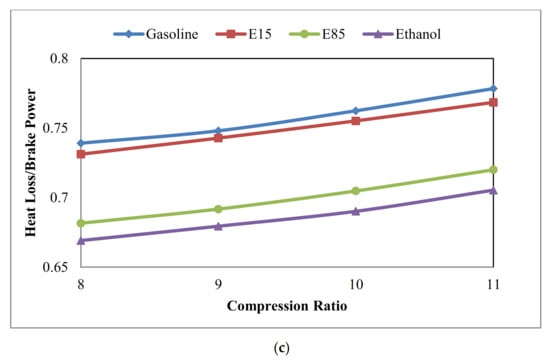
Figure 7.
Heat Losses to Brake Power Ratio of Engine Using Various Fuels at (a) 3000 rpm, (b) 4000 rpm and (c) 5000 rpm vs. Compression Ratio.
Table 8.
Effect of Various Parameters on
3.4. Exhaust Losses to Heat Losses Ratio ()
The analysis of four studied fuels in three different engine speeds shows that increasing the compression ratio leads to decreasing the ratio as shown in Figure 8a–c. When the compression ratio rises, exhaust losses decrease. The reason for this is the direct effects of the compression ratio on expansion ratio, so by the increase in the expansion ratio more work can be taken out of the cycle, and the less losses occur in the exhaust process. Furthermore, heat losses increase with the increase of the CR; therefore, with the increase of the compression ratio, the decreases. This can be interpreted as the reduction in waste heat recovery potential.
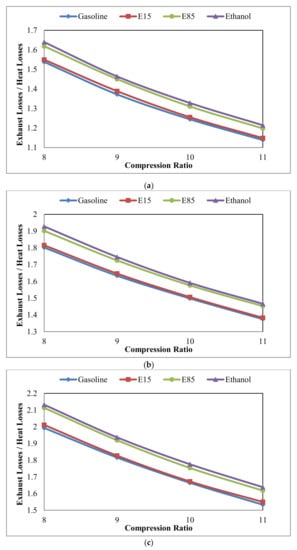
Figure 8.
Exhaust Power to Heat Transfer Ratio of Engine Using Various Fuels at (a) 3000 rpm, (b) 4000 rpm and (c) 5000 rpm vs. Compression Ratio.
There is a direct relationship between the ethanol content of the fuel and the ratio. As the percentage of ethanol in fuel increases, the ratio rises. This happens due to the flame temperature reduction by the increase of the ethanol amount in the fuel. Therefore, heat loss is reduced, and exhaust losses increases. As illustrated in Figure 8a–c, in comparison with other fuels, E100 (100% ethanol) has the highest ratio in all compression ratios and engine speeds. The most is related to E100 at the minimum compression ratio of 8. Then, E85 (85% ethanol), E15 (15% ethanol) and pure gasoline or E00 (0% ethanol) come next in the consecutive order. It can be concluded that the E100 has the highest potential for the waste heat recovery. Table 9 summarizes the effect of various parameters on .
Table 9.
Effect of Various Parameters on
3.5. Brake Specific Fuel Consumption (BSFC)
The brake specific fuel consumption (BSFC) is an important parameter which represents the performance of internal combustion engines in terms of the fuel consumption. This factor is determined by dividing the fuel mass flow rate to output power. As seen in Figure 9a–c, BSFC reduces by the compression ratio increment in all investigated engine speeds and for all fuels. It is realized that E00 has the minimum BSFC in comparison with others since gasoline has the highest heating value among other studied biofuels. In other words, when the ethanol content in the blend increases, the BSFC also rises due to the lower heating value of biofuels. Similar results were observed in previous studies carried out by Thakur et al. [53], Balki and Sayin [26], Di lorio et al. [57] and Celik et al. [27]. Balki and Sayin [26] reported that at a compression ratio of 9, BSFC was 6.19% lower compared to the compression ratio of 8 for the SI engine using ethanol at 2400 rpm. In this study, the decrement of BSFC in the engine using E100 at 3000 rpm from the compression ratio of 8 to 9 was 2.79%. According to Di lorio et. al. [57], the engine BSFC at a compression ratio of 11.5 for E100 in comparison to E85 was increased by 11.25% and 5.88% in 3000 and 4000 rpm, respectively. Similarly, as shown in Figure 9a–c, E15, E85 and E100 show greater BSFCs, respectively.
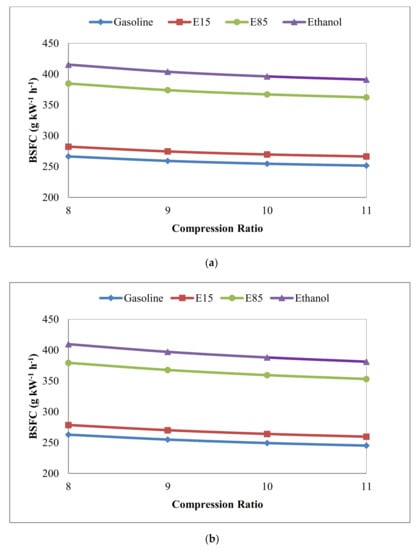
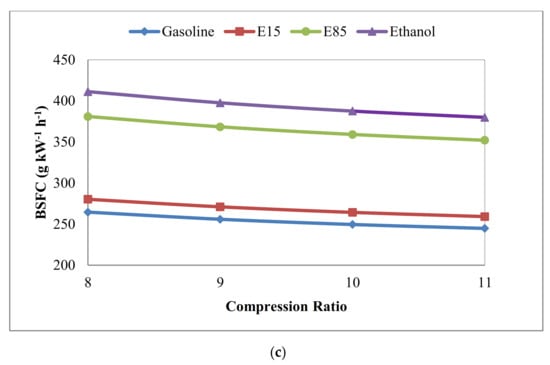
Figure 9.
Brake Specific Fuel Consumption of Engine Using Various Fuels at (a) 3000 rpm, (b) 4000 rpm and (c) 5000 rpm vs. Compression Ratio.
4. Conclusions
In this research, the influence of the compression ratio (CR) on energy balance with respect to the potential waste heat recovery for an air-cooled, one-cylinder spark ignition engine using ethanol–gasoline blends was studied. Experiments were carried out by pure gasoline and experimental data were used for validating the numerical model. Then, ethanol (E100) and ethanol–gasoline blends of E85 and E15 were investigated for different performance characteristics by using the validated model. To determine the feasibility of waste heat recovery, exhaust power to heat loss ratio () was studied. In addition, heat loss to brake power ratio () and brake specific fuel consumption (BSFC) as substantial factors were examined in order to introduce the most efficient fuel in different aspects. In summary, the following conclusions were achieved:
- (1)
- At a constant engine speed, by increasing the compression ratio, the brake power and heat loss increase while the exhaust power decreases.
- (2)
- At engine speeds of 3000 to 5000 rpm, the maximum brake power is produced at 5000 rpm and a compression ratio of 11 by pure ethanol (E100). E85, E15 blends and E00 come next in the consecutive order.
- (3)
- For the range of the engine speeds and compression ratios examined in this study (3000 to 5000 rpm and CR of 8 to 11), the maximum efficiency is 34.98% happening at 5000 rpm and the compression ratio of 11 for E100. The minimum percentage of heat loss is 21.62% at 5000 rpm and the compression ratio of 8 for E100. The minimum percentage of exhaust loss is 35.8% happening at 3000 rpm and the compression ratio of 11 by E00.
- (4)
- As the percentage of heat loss increases by the compression ratio increment, ratio increases and the lowest is found for ethanol.
- (5)
- For all studied fuels, the decreasing compression ratio leads to increasing the ratio. Thus, the less the compression ratio, the more the capability of waste heat recovery.
- (6)
- According to the results, there is a direct relationship between ethanol in fuel content and the ratio. As the percentage of ethanol in fuel increases, the ratio rises. It is found that pure ethanol (100% ethanol) has the highest ratio for all tested compression ratios and engine speeds. E85 (85% ethanol), E15 (15% ethanol) and gasoline (0% ethanol) come next, respectively. Thus, the more the ethanol in the fuel, the more the potential for the waste heat recovery of the IC engine.
- (7)
- E00 (pure gasoline), due to its highest heating value, has the minimum BSFC among all investigated fuels.
Further experimental research is needed to determine the effects of applying ethanol on the waste heat recovery. Similar studies are also recommended for other types of biofuels such as methanol.
Author Contributions
Conceptualization, A.Q.; Experimental setup, P.A.; Experimental investigation, P.A.; Numerical investigation, S.J.H.; Validation, S.J.H.; Data analysis, A.Q., P.A., and S.J.H.; Writing—original draft preparation, P.A.; Writing—review and editing, A.Q. and M.B.; Supervision, A.Q. and M.B. All authors have read and agreed to the published version of the manuscript.
Funding
This research received no external funding.
Institutional Review Board Statement
Not applicable.
Informed Consent Statement
Not applicable.
Conflicts of Interest
The authors declare no conflict of interest.
Abbreviations
| CR | Compression Ratio |
| Ht/Br | Heat Transfer to Brake Power Ratio |
| Ex/Ht | Exhaust Power to Heat Transfer Ratio |
| E100 | Pure Ethanol |
| E00 | Pure Gasoline |
| E85 | Mixture of 85% Ethanol and 15% Gasoline |
| E15 | Mixture of 15% Ethanol and 85% Gasoline |
| BMEP | Brake Mean Effective Pressure |
| IMEP | Indicated Mean Effective Pressure |
| FMEP | Friction Mean Effective Pressure |
| BSFC | Brake Specific Fuel Consumption |
| Cylinder Pressure, kPa | |
| Crank Angle, degree | |
| Specific Heat Ratio | |
| In-Cylinder Volume, m3 | |
| Cylinder Clearance Volume, m3 | |
| Cylinder Bore, m | |
| Connecting Rod’s Length, m | |
| Crank Radius, m | |
| Distance Between Piston Pin Axis and Crank Axis, m | |
| Adjustable Parameter | |
| Adjustable Parameter | |
| Mass Fraction Burned | |
| Start of Combustion, degree | |
| Total Combustion Duration | |
| Heat Transfer Coefficient, W/m2K | |
| Temperature, K | |
| Average Cylinder Gas Velocity, m/s | |
| Wall Area, m2 | |
| Wall Temperature, K | |
| In-Cylinder Gas Temperature, K | |
| Constant Parameter | |
| Mean Piston Speed, m/s | |
| Constant Parameter | |
| Working-Fluid Temperature, K | |
| Working-Fluid Pressure, kPa | |
| Working-Fluid Volume, m3 | |
| In-Cylinder Maximum Pressure, kPa | |
| Motored Cylinder Pressure, kPa | |
| Engine Speed, rpm | |
| Rate of Energy, kJ | |
| Total Heat Addition, J | |
| Heat Transfer from the Combustion Chamber Wall, J | |
| Fuel Power, kW | |
| Brake Power, kW | |
| Dissipated Power by Exhaust, kW | |
| Dissipated Power by Heat Transfer, kW | |
| Fuel Heating Value, kJ/kg | |
| Combustion Efficiency | |
| Mass Flow Rate of Air, kg/s | |
| Mass Flow Rate of Fuel, kg/s | |
| Exhaust Gases Temperature, | |
| Ambient Temperature, | |
| Average Specific Heat of Exhaust Gases, kJ/kg.K | |
| Displacement Volume, m3 | |
| Number of Cylinders |
References
- Zabihi, N.; Saafi, M. Recent Developments in the Energy Harvesting Systems from Road Infrastructures. Sustainability 2020, 12, 6738. [Google Scholar] [CrossRef]
- Sher, F.; Curnick, O.; Azizan, M. Sustainable Conversion of Renewable Energy Sources. Sustainability 2021, 13, 2940. [Google Scholar] [CrossRef]
- Markiewicz, M.; Muślewski, Ł. The Impact of Powering an Engine with Fuels from Renewable Energy Sources including its Software Modification on a Drive Unit Performance Parameters. Sustainability 2019, 11, 6585. [Google Scholar] [CrossRef]
- Tucki, K.; Mruk, R.; Orynycz, O.; Wasiak, A.; Botwińska, K.; Gola, A. Simulation of the Operation of a Spark Ignition Engine Fueled with Various Biofuels and Its Contribution to Technology Management. Sustainability 2019, 11, 2799. [Google Scholar] [CrossRef]
- Sarabi, M.; Aghdam, E.A. Experimental analysis of in-cylinder combustion characteristics and exhaust gas emissions of gasoline–natural gas dual-fuel combinations in a SI engine. J. Therm. Anal. Calorim. 2019, 139, 3165–3178. [Google Scholar] [CrossRef]
- Miskat, M.; Ahmed, A.; Chowdhury, H.; Chowdhury, T.; Chowdhury, P.; Sait, S.; Park, Y.-K. Assessing the Theoretical Prospects of Bioethanol Production as a Biofuel from Agricultural Residues in Bangladesh: A Review. Sustainability 2020, 12, 8583. [Google Scholar] [CrossRef]
- Lapuerta, M.; Ballesteros, R.; Barba, J. Strategies to Introduce n-Butanol in Gasoline Blends. Sustainability 2017, 9, 589. [Google Scholar] [CrossRef]
- Al-Esawi, N.; Al Qubeissi, M.; Sazhin, S.S.; Whitaker, R. The impacts of the activity coefficient on heating and evaporation of ethanol/gasoline fuel blends. Int. Commun. Heat Mass Transf. 2018, 98, 177–182. [Google Scholar] [CrossRef]
- Shirazi, S.A.; Foust, T.D.; Reardon, K.F. Identification of Promising Alternative Mono-Alcohol Fuel Blend Components for Spark Ignition Engines. Energies 2020, 13, 1955. [Google Scholar] [CrossRef]
- Behrad, R.; Aghdam, E.A.; Ghaebi, H. Experimental study of knocking phenomenon in different gasoline–natural gas combinations with gasoline as the predominant fuel in a SI engine. J. Therm. Anal. Calorim. 2020, 139, 2489–2497. [Google Scholar] [CrossRef]
- Thakur, A.K.; Kaviti, A.K.; Mehra, R.; Mer, K.K.S. Performance analysis of ethanol–gasoline blends on a spark ignition engine: A review. Biofuels 2017, 8, 91–112. [Google Scholar] [CrossRef]
- Jang, J.; Choi, J.; Yi, H.; Park, S. Effects of the Bore to Stroke Ratio on Combustion, Gaseous and Particulate Emissions in a Small Port Fuel Injection Engine Fueled with Ethanol Blended Gasoline. Energies 2020, 13, 321. [Google Scholar] [CrossRef]
- Channappagoudra, M.; Ramesh, K.; Manavendra, G. Comparative study of standard engine and modified engine with different piston bowl geometries operated with B20 fuel blend. Renew. Energy 2019, 133, 216–232. [Google Scholar] [CrossRef]
- Hasan, A.O.; Al-Rawashdeh, H.; Al-Muhtaseb, A.H.; Abu-Jrai, A.; Ahmad, R.; Zeaiter, J. Impact of changing combustion chamber geometry on emissions, and combustion characteristics of a single cylinder SI (spark ignition) engine fueled with ethanol/gasoline blends. Fuel 2018, 231, 197–203. [Google Scholar] [CrossRef]
- Monsalve-Serrano, J.; Belgiorno, G.; Di Blasio, G.; Guzmán-Mendoza, M. 1D Simulation and Experimental Analysis on the Effects of the Injection Parameters in Methane–Diesel Dual-Fuel Combustion. Energies 2020, 13, 3734. [Google Scholar] [CrossRef]
- Babu, D.; Karvembu, R.; Anand, R. Impact of split injection strategy on combustion, performance and emissions characteristics of biodiesel fuelled common rail direct injection assisted diesel engine. Energy 2018, 165, 577–592. [Google Scholar] [CrossRef]
- Ashok, B.; Nanthagopal, K.; Chaturvedi, B.; Sharma, S.; Raj, R.T.K. A comparative assessment on Common Rail Direct Injection (CRDI) engine characteristics using low viscous biofuel blends. Appl. Therm. Eng. 2018, 145, 494–506. [Google Scholar] [CrossRef]
- Feng, D.; Wei, H.; Pan, M.; Zhou, L.; Hua, J. Combustion performance of dual-injection using n-butanol direct-injection and gasoline port fuel-injection in a SI engine. Energy 2018, 160, 573–581. [Google Scholar] [CrossRef]
- Turner, D.; Xu, H.; Cracknell, R.F.; Natarajan, V.; Chen, X. Combustion performance of bio-ethanol at various blend ratios in a gasoline direct injection engine. Fuel 2011, 90, 1999–2006. [Google Scholar] [CrossRef]
- Tornatore, C.; Marchitto, L.; Costagliola, M.A.; Valentino, G. Experimental Comparative Study on Performance and Emissions of E85 Adopting Different Injection Approaches in a Turbocharged PFI SI Engine. Energies 2019, 12, 1555. [Google Scholar] [CrossRef]
- Xu, Z.; Zhu, L.; He, Z.; Li, A.; Shao, Y.; Huang, Z. Performance optimization of in-cylinder thermochemical fuel reforming (TFR) with compression ratio in an SI natural gas engine. Fuel 2017, 203, 162–170. [Google Scholar] [CrossRef]
- Yücesu, H.S.; Topgül, T.; Cinar, C.; Okur, M. Effect of ethanol–gasoline blends on engine performance and exhaust emissions in different compression ratios. Appl. Therm. Eng. 2006, 26, 2272–2278. [Google Scholar] [CrossRef]
- Cooney, C.P.; Yeliana; Worm, J.J.; Naber, J.D. Combustion Characterization in an Internal Combustion Engine with Ethanol−Gasoline Blended Fuels Varying Compression Ratios and Ignition Timing. Energy Fuels 2009, 23, 2319–2324. [Google Scholar] [CrossRef]
- Leone, T.G.; Anderson, J.E.; Davis, R.S.; Iqbal, A.; Reese, R.A.; Shelby, M.H.; Studzinski, W.M. The Effect of Compression Ratio, Fuel Octane Rating, and Ethanol Content on Spark-Ignition Engine Efficiency. Environ. Sci. Technol. 2015, 49, 10778–10789. [Google Scholar] [CrossRef]
- Wittek, K.; Geiger, F.; Andert, J.; Martins, M.; Cogo, V.; Lanzanova, T. Experimental investigation of a variable compression ratio system applied to a gasoline passenger car engine. Energy Convers. Manag. 2019, 183, 753–763. [Google Scholar] [CrossRef]
- Balki, M.K.; Sayin, C. The effect of compression ratio on the performance, emissions and combustion of an SI (spark ignition) engine fueled with pure ethanol, methanol and unleaded gasoline. Energy 2014, 71, 194–201. [Google Scholar] [CrossRef]
- Çelik, M.B.; Özdalyan, B.; Alkan, F. The use of pure methanol as fuel at high compression ratio in a single cylinder gasoline engine. Fuel 2011, 90, 1591–1598. [Google Scholar] [CrossRef]
- Costa, R.C.; Sodré, J.R. Compression ratio effects on an ethanol/gasoline fuelled engine performance. Appl. Therm. Eng. 2011, 31, 278–283. [Google Scholar] [CrossRef]
- Thomas, R.; Sreesankaran, M.; Jaidi, J.; Paul, D.M.; Manjunath, P. Experimental evaluation of the effect of compression ratio on performance and emission of SI engine fuelled with gasoline and n-butanol blend at different loads. Perspect. Sci. 2016, 8, 743–746. [Google Scholar] [CrossRef]
- Luo, Q.-H.; Sun, B.-G. Experiments on the effect of engine speed, load, equivalence ratio, spark timing and coolant temperature on the energy balance of a turbocharged hydrogen engine. Energy Convers. Manag. 2018, 162, 1–12. [Google Scholar] [CrossRef]
- Ma, B.; Yao, A.; Yao, C.; Wang, B.; Gao, J.; Chen, C.; Wu, T. Experimental study on energy balance of different parameters in diesel methanol dual fuel engine. Appl. Therm. Eng. 2019, 159, 113954. [Google Scholar] [CrossRef]
- Shojaeefard, M.; Azarikhah, P.; Qasemian, A. Experimental Investigation of Thermal Balance and Valve Cover Heat Transfer in a Small Internal Combustion Engine. Int. J. Automot. Eng. 2017, 7, 2423–2433. [Google Scholar] [CrossRef]
- da Silva, J.A.; Seifert, V.; de Morais, V.O.; Tsolakis, A.; Herreros, J.; Torres, E. Exergy evaluation and ORC use as an alternative for efficiency improvement in a CI-engine power plant. Sustain. Energy Technol. Assess. 2018, 30, 216–223. [Google Scholar] [CrossRef]
- Saidur, R.; Rezaei, M.; Muzammil, W.K.; Hassan, M.H.; Paria, S.; Hasanuzzaman, M. Technologies to recover exhaust heat from internal combustion engines. Renew. Sustain. Energy Rev. 2012, 16, 5649–5659. [Google Scholar] [CrossRef]
- Heywood, J.B. Internal Combustion Engine Fundamentals; Mcgraw-Hill: New York, NY, USA, 1988. [Google Scholar]
- Ferguson, C.R.; Kirkpatrick, A.T. Internal Combustion Engines: Applied Thermosciences, 3rd ed.; John Wiley & Sons: New York, NY, USA, 2016. [Google Scholar]
- Cooney, C.; Worm, J.; Michalek, D.; Naber, J. Wiebe function parameter determination for mass fraction burn calculation in an ethanol-gasoline fuelled SI engine. J. Kones 2008, 15, 567–574. [Google Scholar]
- Choi, W.; Song, H.H. Composition-considered Woschni heat transfer correlation: Findings from the analysis of over-expected engine heat losses in a solid oxide fuel cell–internal combustion engine hybrid system. Energy 2020, 203, 117851. [Google Scholar] [CrossRef]
- De Cuyper, T.; Broekaert, S.; Chana, K.; De Paepe, M.; Verhelst, S. Evaluation of empirical heat transfer models using TFG heat flux sensors. Appl. Therm. Eng. 2017, 118, 561–569. [Google Scholar] [CrossRef][Green Version]
- Lounici, M.S.; Loubar, K.; Balistrou, M.; Tazerout, M. Investigation on heat transfer evaluation for a more efficient two-zone combustion model in the case of natural gas SI engines. Appl. Therm. Eng. 2011, 31, 319–328. [Google Scholar] [CrossRef]
- Mohammadi, A.; Yaghoubi, M. Estimation of instantaneous local heat transfer coefficient in spark-ignition engines. Int. J. Therm. Sci. 2010, 49, 1309–1317. [Google Scholar] [CrossRef]
- Qasemian, A.; Azarikhah, P.; Haqparast, S.J. Derivation of Specific Heat Rejection Correlation in an SI Engine; Experimental and Numerical Study. Int. J. Automot. Eng. 2018, 8, 2679–2691. [Google Scholar]
- Azarikhah, P.; Haghparast, S.J.; Qasemian, A. Investigation on total and instantaneous energy balance of bio-alternative fuels on an SI internal combustion engine. J. Therm. Anal. Calorim. 2019, 137, 1681–1692. [Google Scholar] [CrossRef]
- The National Institute for Occupational Safety and Health (NIOSH) Pocket Guide to Chemical Hazards. Available online: www.cdc.gov (accessed on 14 August 2019).
- Abedin, M.; Masjuki, H.; Kalam, M.; Sanjid, A.; Rahman, S.A.; Masum, B. Energy balance of internal combustion engines using alternative fuels. Renew. Sustain. Energy Rev. 2013, 26, 20–33. [Google Scholar] [CrossRef]
- Ozcan, H.; Söylemez, M. Thermal balance of a LPG fuelled, four stroke SI engine with water addition. Energy Convers. Manag. 2006, 47, 570–581. [Google Scholar] [CrossRef]
- Ajav, E.; Singh, B.; Bhattacharya, T. Thermal balance of a single cylinder diesel engine operating on alternative fuels. Energy Convers. Manag. 2000, 41, 1533–1541. [Google Scholar] [CrossRef]
- Martyr, A.J.; Plint, M.A. Engine Testing: Theory and Practice; Elsevier: Oxford, UK, 2011. [Google Scholar]
- Yun, K.T.; Cho, H.; Luck, R.; Mago, P.J. Modeling of reciprocating internal combustion engines for power generation and heat recovery. Appl. Energy 2013, 102, 327–335. [Google Scholar] [CrossRef]
- Sandoval, D.; Heywood, J.B. An Improved Friction Model for Spark-Ignition Engines. SAE Trans. 2003, 112, 1041–1052. [Google Scholar] [CrossRef]
- Yusri, I.; Mamat, R.; Azmi, W.; Najafi, G.; Sidik, N.; Awad, O.I. Experimental investigation of combustion, emissions and thermal balance of secondary butyl alcohol-gasoline blends in a spark ignition engine. Energy Convers. Manag. 2016, 123, 1–14. [Google Scholar] [CrossRef]
- Sayin, C.; Hosoz, M.; Canakci, M.; Kiliçaslan, I. Energy and exergy analyses of a gasoline engine. Int. J. Energy Res. 2007, 31, 259–273. [Google Scholar] [CrossRef]
- Thakur, A.K.; Kaviti, A.K.; Mehra, R.; Mer, K. Progress in performance analysis of ethanol-gasoline blends on SI engine. Renew. Sustain. Energy Rev. 2017, 69, 324–340. [Google Scholar] [CrossRef]
- Owen, K.; Coley, T. Automotive fuels reference book. In Fuel and Energy Abstracts; Society of Automotive Engineers: Warrendale, PA, USA, 1995; Volume 1, p. 10. [Google Scholar]
- Bayraktar, H. Experimental and theoretical investigation of using gasoline–ethanol blends in spark-ignition engines. Renew. Energy 2005, 30, 1733–1747. [Google Scholar] [CrossRef]
- Najafi, G.; Ghobadian, B.; Tavakoli, T.; Buttsworth, D.; Yusaf, T.; Faizollahnejad, M. Performance and exhaust emissions of a gasoline engine with ethanol blended gasoline fuels using artificial neural network. Appl. Energy 2009, 86, 630–639. [Google Scholar] [CrossRef]
- Di Iorio, S.; Mancaruso, E.; Sementa, P.; Vaglieco, B.M. A comprehensive analysis of the impact of biofuels on the performance and emissions from compression and spark-ignition engines. Int. J. Engine Res. 2015, 16, 680–690. [Google Scholar] [CrossRef]
Publisher’s Note: MDPI stays neutral with regard to jurisdictional claims in published maps and institutional affiliations. |
© 2021 by the authors. Licensee MDPI, Basel, Switzerland. This article is an open access article distributed under the terms and conditions of the Creative Commons Attribution (CC BY) license (https://creativecommons.org/licenses/by/4.0/).