
Potential of Utilization of Renewable Energy Technologies in Gulf Countries

 ,
, 

 ,
,  , ,
, ,  ,
,  and
and 
Abstract
:1. Introduction
2. Bioenergy Generation through Bioelectrochemical Systems in GCC Regions
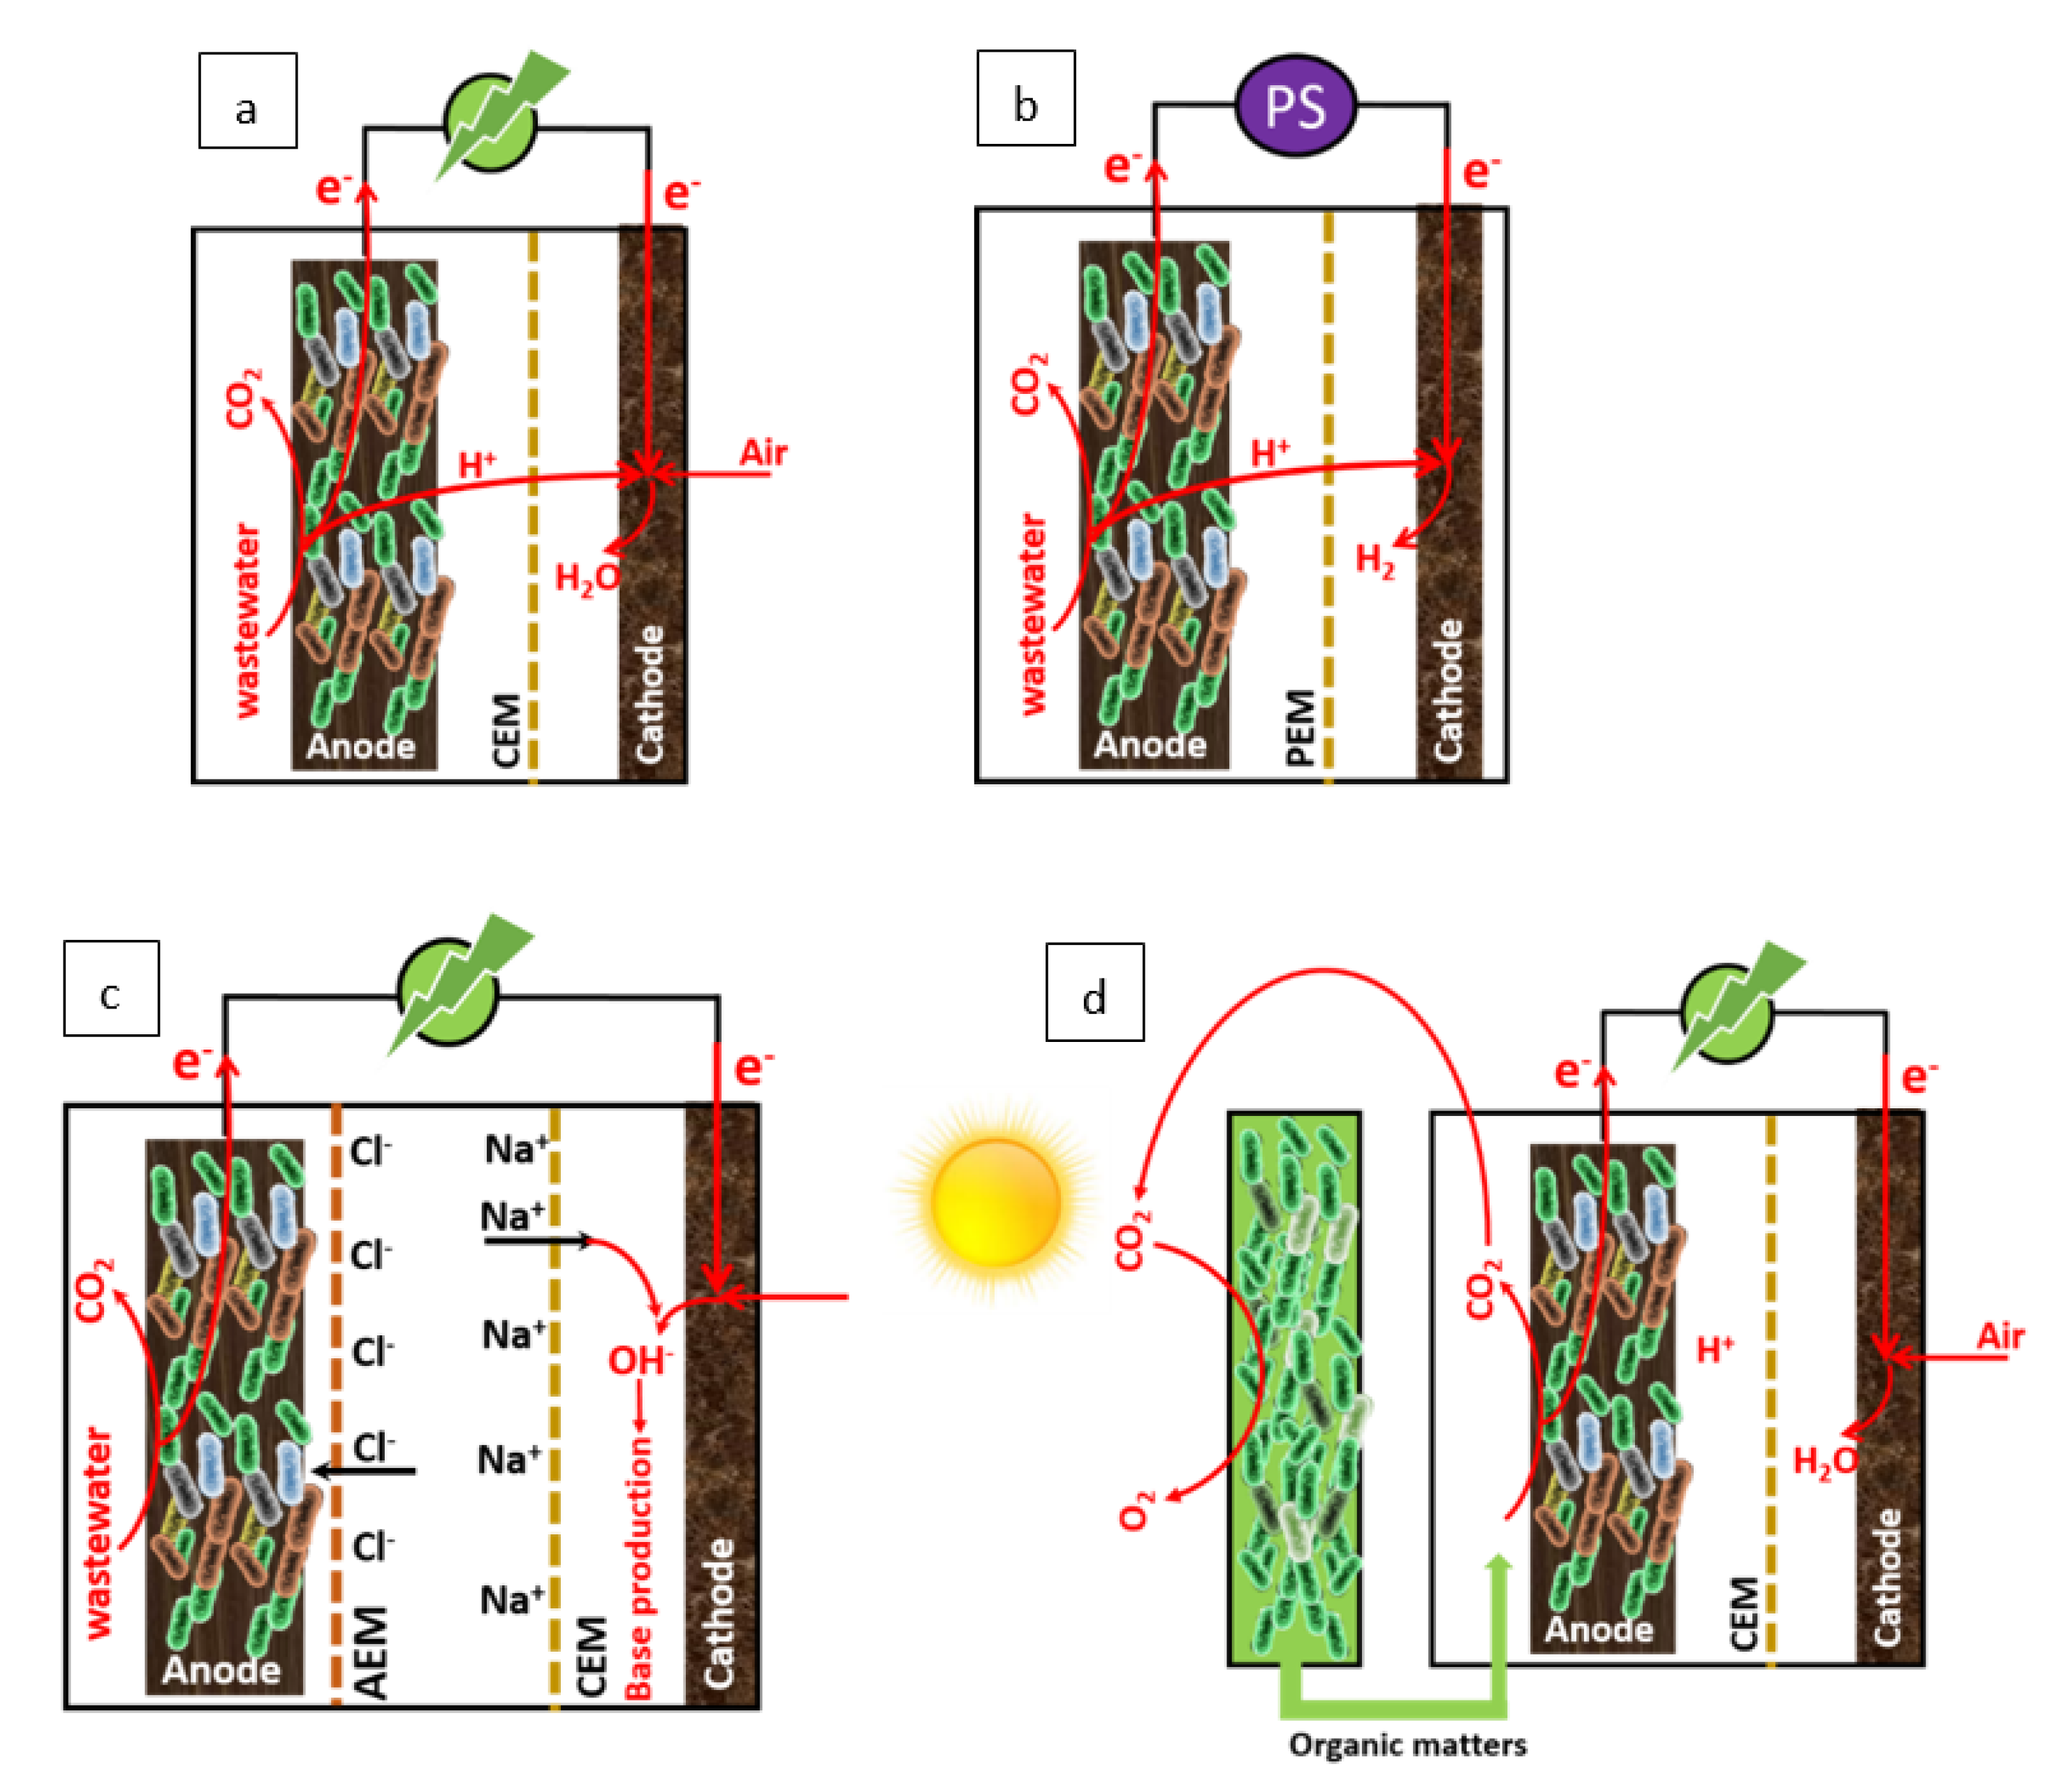
2.1. Microbial Fuel Cells
2.2. Microbial Electrolysis Cell
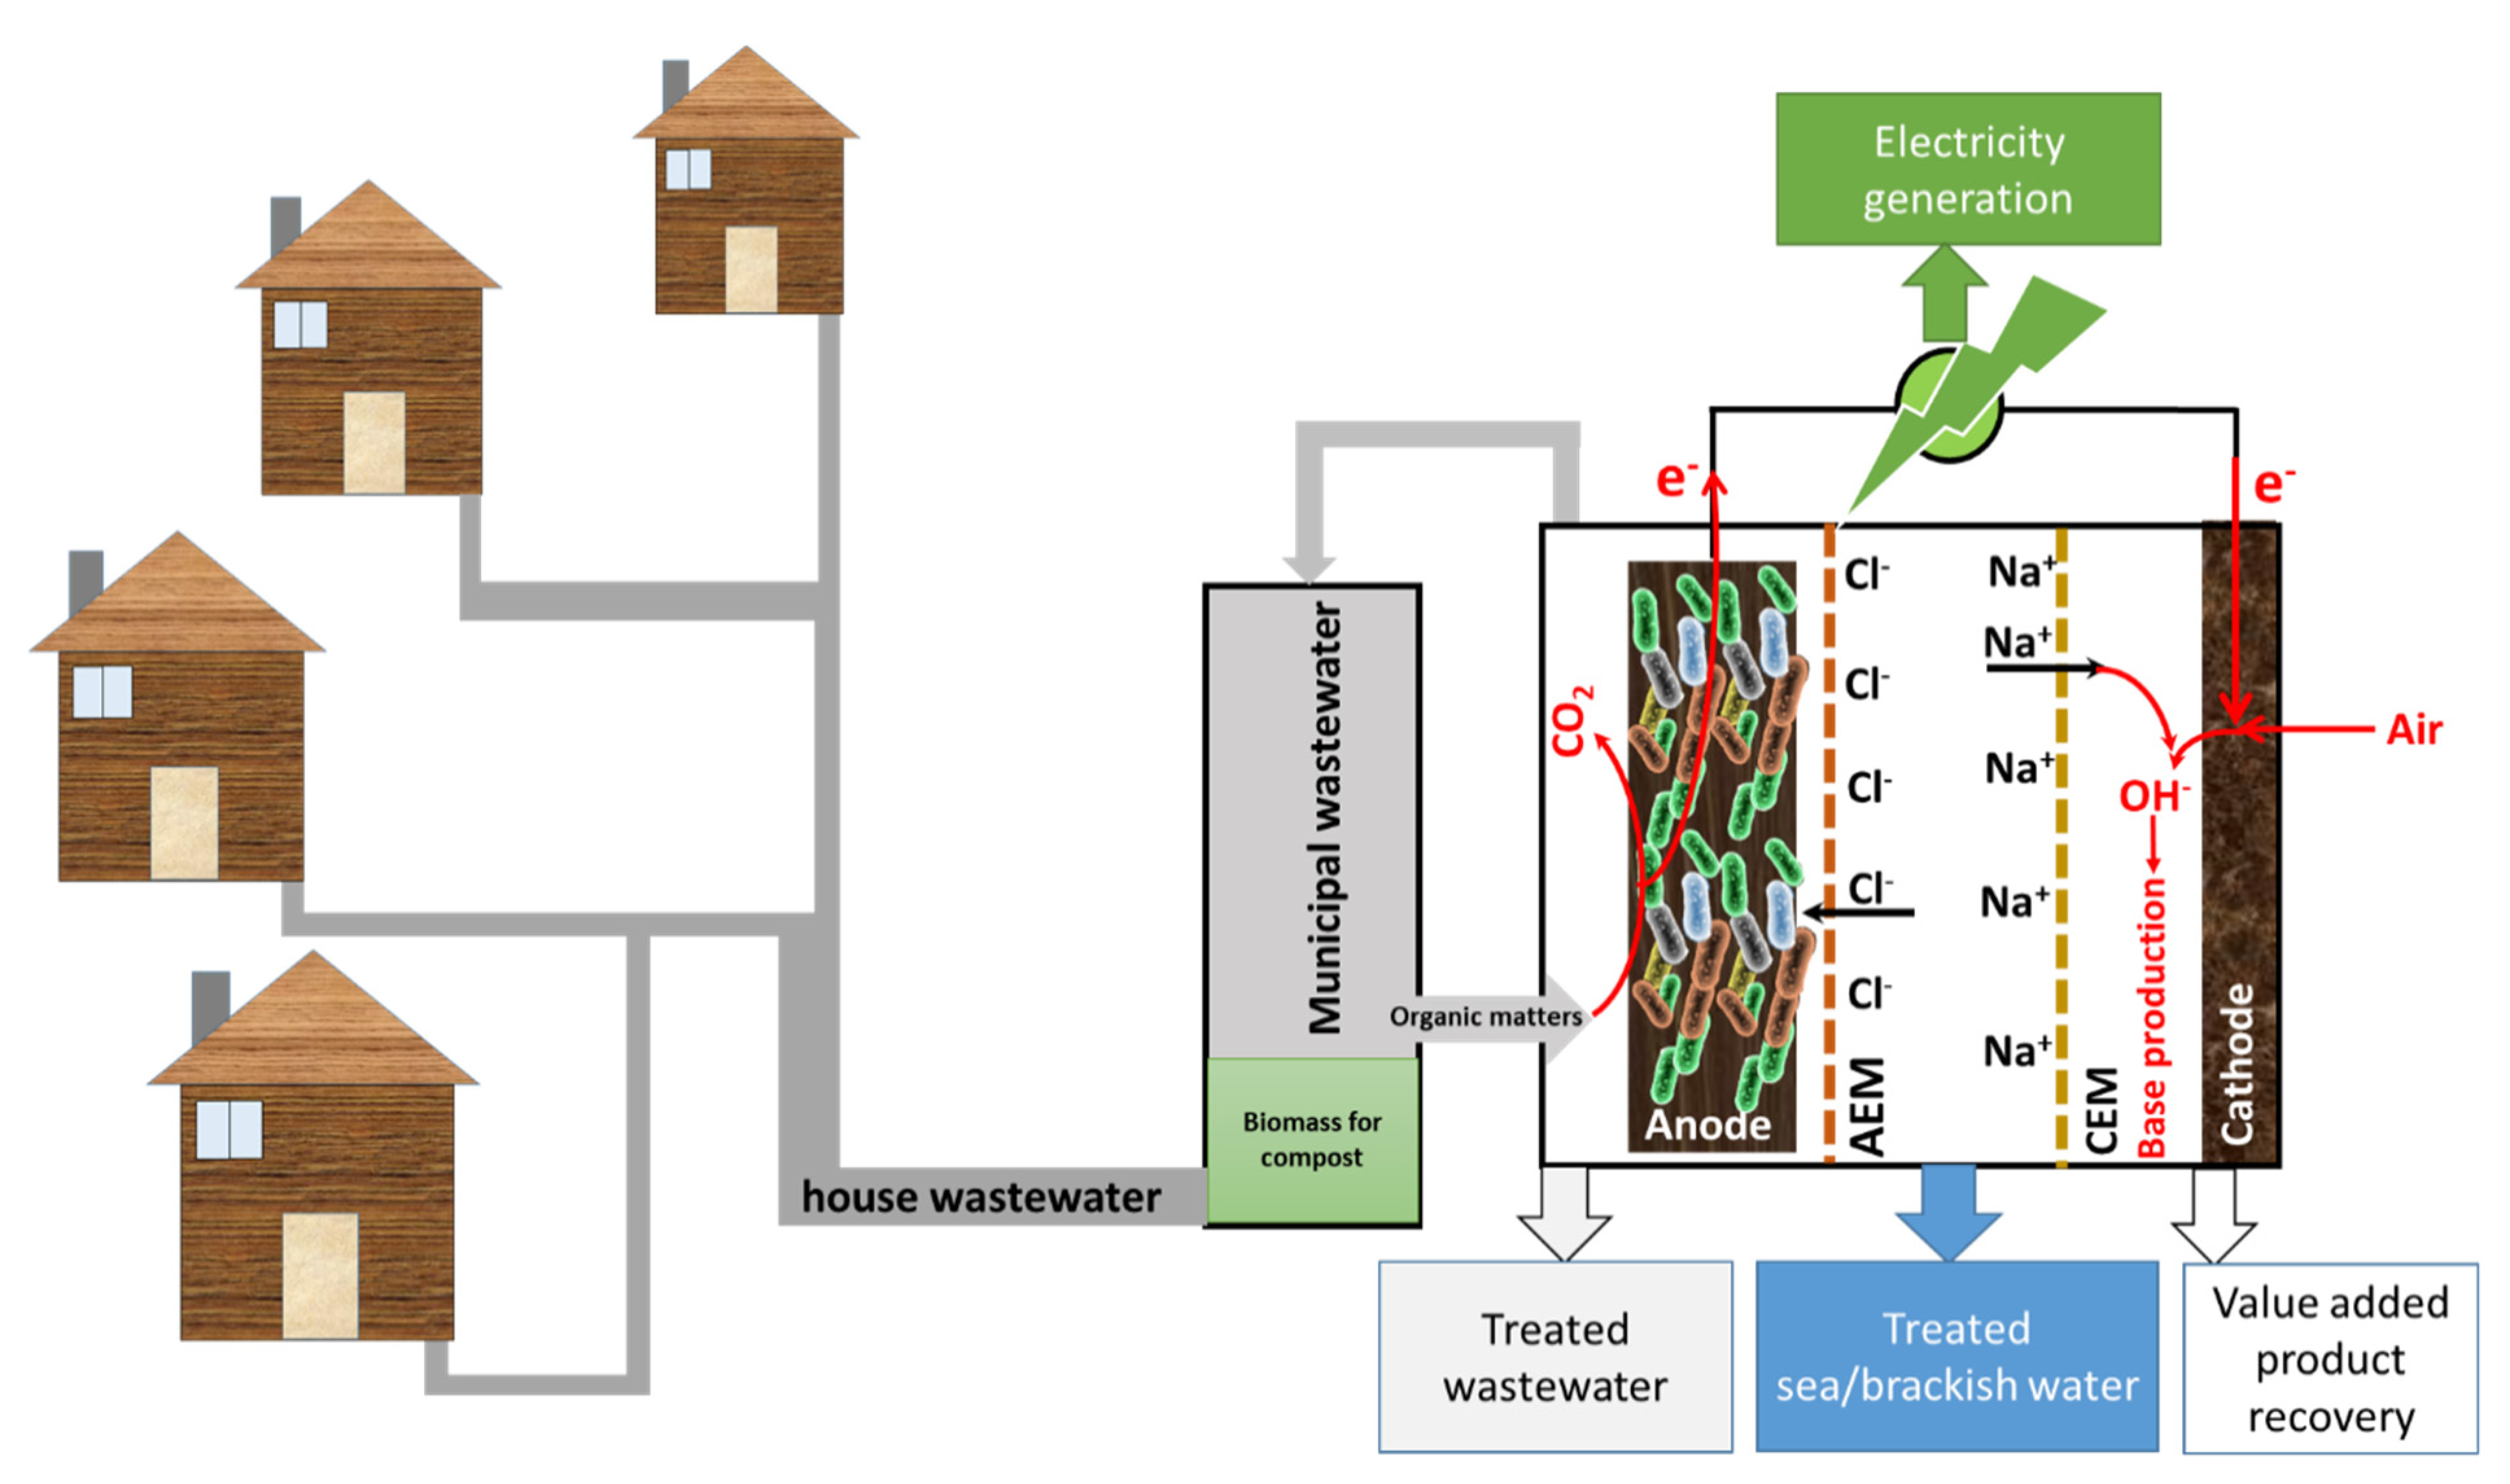
2.3. Microbial Desalination Cell
2.4. Microbial Solar Cells
3. Biomass Energy Potential in the GCC Region
4. Solar Energy Potential in the GCC Region
5. Wind Energy Potential in the GCC Region
5.1. Recent Developments in Saudi Arabia
5.2. Recent Developments in Kuwait
5.3. Recent Developments in Qatar
5.4. Recent Developments in the UAE
5.5. Recent Developments in Bahrain
5.6. Recent Developments in Oman
6. Tidal Wave Energy Potential in the GCC Region
- Dielectric elastomers: fewer moving parts and to reduce power take-off complexity
- Third-generation tidal energy devices: to exploit untapped resources efficiently
- A novel approach to first-generation wave energy: to increase energy capture and quality power output
- Innovation tidal and wave energy power take-off: to increase the reliability of ocean energy devices
- Improve morning compliance: to improve power production and survivability of ocean energy devices.
- Blades innovation: to reduce fatigue and extend the lifetime
- Rotor innovation: to increase power capture and overall efficiency
- Flouting tidal concepts: to ease installation and maintenance and optimal power extraction in the upper part of the water column
- Breakthrough materials for first-generation tidal devices: to reduce structural weight and to improve the thrust loading capacity
7. Conclusions
Author Contributions
Funding
Institutional Review Board Statement
Informed Consent Statement
Data Availability Statement
Acknowledgments
Conflicts of Interest
References
- Mujtaba, M.A.; Cho, H.M.; Masjuki, H.; Kalam, M.; Ong, H.; Gul, M.; Harith, M.; Yusoff, M. Critical review on sesame seed oil and its methyl ester on cold flow and oxidation stability. Energy Rep. 2020, 6, 40–54. [Google Scholar] [CrossRef]
- Hussain, F.; Alshahrani, S.; Abbas, M.M.; Khan, H.M.; Jamil, A.; Yaqoob, H.; Soudagar, M.E.M.; Imran, M.; Ahmad, M.; Munir, M. Waste Animal Bones as Catalysts for Biodiesel Production; A Mini Review. Catalysts 2021, 11, 630. [Google Scholar] [CrossRef]
- Razzaq, L.; Imran, S.; Anwar, Z.; Farooq, M.; Abbas, M.M.; Mehmood Khan, H.; Asif, T.; Amjad, M.; Soudagar, M.E.M.; Shaukat, N. Maximising yield and engine efficiency using optimised waste cooking oil biodiesel. Energies 2020, 13, 5941. [Google Scholar] [CrossRef]
- Razzaq, L.; Mujtaba, M.A.; Soudagar, M.E.M.; Ahmed, W.; Fayaz, H.; Bashir, S.; Fattah, I.M.R.; Ong, H.C.; Shahapurkar, K.; Afzal, A.; et al. Engine performance and emission characteristics of palm biodiesel blends with graphene oxide nanoplatelets and dimethyl carbonate additives. J. Environ. Manag. 2021, 282, 111917. [Google Scholar] [CrossRef] [PubMed]
- Ritchie, H.; Roser, M. Energy. Our World Data. 2020. Available online: https://ourworldindata.org/energy (accessed on 3 September 2021).
- Rahman, S.M.A.; Fattah, I.M.R.; Maitra, S.; Mahlia, T.M.I. A ranking scheme for biodiesel underpinned by critical physicochemical properties. Energy Convers. Manag. 2021, 229, 113742. [Google Scholar] [CrossRef]
- Rahman, S.M.A.; Fattah, I.M.R. Evaluation of a compression ignition engine performance and emission characteristics using diesel-essential oil blends of high orange oil content. Aust. J. Mech. Eng. 2021, 1–8. [Google Scholar] [CrossRef]
- Rahman, S.M.A.; Rizwanul Fattah, I.M.; Ong, H.C.; Zamri, M.F.M.A. State-of-the-Art of Strategies to Reduce Exhaust Emissions from Diesel Engine Vehicles. Energies 2021, 14, 1766. [Google Scholar] [CrossRef]
- Fattah, I.M.R.; Masjuki, H.H.; Liaquat, A.M.; Ramli, R.; Kalam, M.A.; Riazuddin, V.N. Impact of various biodiesel fuels obtained from edible and non-edible oils on engine exhaust gas and noise emissions. Renew. Sustain. Energy Rev. 2013, 18, 552–567. [Google Scholar] [CrossRef]
- Fattah, I.M.R.; Masjuki, H.H.; Kalam, M.A.; Mofijur, M.; Abedin, M.J. Effect of antioxidant on the performance and emission characteristics of a diesel engine fueled with palm biodiesel blends. Energy Convers. Manag. 2014, 79, 265–272. [Google Scholar] [CrossRef]
- Hasan, M.H.; Mahlia, T.M.; Mofijur, M.; Rizwanul Fattah, I.M.; Handayani, F.; Ong, H.C.; Silitonga, A.S. A Comprehensive Review on the Recent Development of Ammonia as a Renewable Energy Carrier. Energies 2021, 14, 3732. [Google Scholar] [CrossRef]
- Mujtaba, M.; Masjuki, H.; Kalam, M.; Noor, F.; Farooq, M.; Ong, H.C.; Gul, M.; Soudagar, M.E.M.; Bashir, S.; Rizwanul Fattah, I. Effect of Additivized Biodiesel Blends on Diesel Engine Performance, Emission, Tribological Characteristics, and Lubricant Tribology. Energies 2020, 13, 3375. [Google Scholar] [CrossRef]
- Arbab, M.I.; Varman, M.; Masjuki, H.H.; Kalam, M.A.; Imtenan, S.; Sajjad, H.; Rizwanul Fattah, I.M. Evaluation of combustion, performance, and emissions of optimum palm-coconut blend in turbocharged and non-turbocharged conditions of a diesel engine. Energy Convers. Manag. 2015, 90, 111–120. [Google Scholar] [CrossRef] [Green Version]
- Al-Badi, A.; Al Mubarak, I. Growing energy demand in the GCC countries. Arab. J. Basic Appl. Sci. 2019, 26, 488–496. [Google Scholar] [CrossRef] [Green Version]
- IRENA. Renewable Energy Market Analysis. 2019. Available online: https://www.irena.org/-/media/Files/IRENA/Agency/Publication/2019/Jan/IRENA_Market_Analysis_GCC_2019.pdf (accessed on 3 September 2021).
- Alnaser, W.E.; Alnaser, N.W. The status of renewable energy in the GCC countries. Renew. Sustain. Energy Rev. 2011, 15, 3074–3098. [Google Scholar] [CrossRef]
- Bhutto, A.W.; Bazmi, A.A.; Zahedi, G.; Klemeš, J.J. A review of progress in renewable energy implementation in the Gulf Cooperation Council countries. J. Clean. Prod. 2014, 71, 168–180. [Google Scholar] [CrossRef]
- Atalay, Y.; Biermann, F.; Kalfagianni, A. Adoption of renewable energy technologies in oil-rich countries: Explaining policy variation in the Gulf Cooperation Council states. Renew. Energy 2016, 85, 206–214. [Google Scholar] [CrossRef]
- Ejaz, A.; Babar, H.; Ali, H.M.; Jamil, F.; Janjua, M.M.; Fattah, I.M.R.; Said, Z.; Li, C. Concentrated photovoltaics as light harvesters: Outlook, recent progress, and challenges. Sustain. Energy Technol. Assess. 2021, 46, 101199. [Google Scholar] [CrossRef]
- Fattah, I.M.R.; Ong, H.C.; Mahlia, T.M.I.; Mofijur, M.; Silitonga, A.S.; Rahman, S.M.A.; Ahmad, A. State of the Art of Catalysts for Biodiesel Production. Front. Energy Res. 2020, 8. [Google Scholar] [CrossRef]
- Ong, H.C.; Tiong, Y.W.; Goh, B.H.H.; Gan, Y.Y.; Mofijur, M.; Fattah, I.M.R.; Chong, C.T.; Alam, M.A.; Lee, H.V.; Silitonga, A.S.; et al. Recent advances in biodiesel production from agricultural products and microalgae using ionic liquids: Opportunities and challenges. Energy Convers. Manag. 2021, 228, 113647. [Google Scholar] [CrossRef]
- Hussain, F.; Soudagar, M.E.M.; Afzal, A.; Mujtaba, M.; Fattah, I.; Naik, B.; Mulla, M.H.; Badruddin, I.A.; Khan, T.; Raju, V.D. Enhancement in Combustion, Performance, and Emission Characteristics of a Diesel Engine Fueled with Ce-ZnO Nanoparticle Additive Added to Soybean Biodiesel Blends. Energies 2020, 13, 4578. [Google Scholar] [CrossRef]
- Imtenan, S.; Varman, M.; Masjuki, H.H.; Kalam, M.A.; Sajjad, H.; Arbab, M.I.; Rizwanul Fattah, I.M. Impact of low temperature combustion attaining strategies on diesel engine emissions for diesel and biodiesels: A review. Energy Convers. Manag. 2014, 80, 329–356. [Google Scholar] [CrossRef]
- Ivase, T.J.-P.; Nyakuma, B.B.; Oladokun, O.; Abu, P.T.; Hassan, M.N. Review of the principal mechanisms, prospects, and challenges of bioelectrochemical systems. Environ. Prog. Sustain. Energy 2020, 39, 13298. [Google Scholar] [CrossRef]
- Jafary, T.; Al-Mamun, A.; Alhimali, H.; Baawain, M.S.; Rahman, M.S.; Rahman, S.; Dhar, B.R.; Aghbashlo, M.; Tabatabaei, M. Enhanced power generation and desalination rate in a novel quadruple microbial desalination cell with a single desalination chamber. Renew. Sustain. Energy Rev. 2020, 127, 109855. [Google Scholar] [CrossRef]
- Su, L.; Ajo-Franklin, C.M. Reaching full potential: Bioelectrochemical systems for storing renewable energy in chemical bonds. Curr. Opin. Biotechnol. 2019, 57, 66–72. [Google Scholar] [CrossRef] [PubMed]
- Zheng, T.; Li, J.; Ji, Y.; Zhang, W.; Fang, Y.; Xin, F.; Dong, W.; Wei, P.; Ma, J.; Jiang, M. Progress and Prospects of Bioelectrochemical Systems: Electron Transfer and Its Applications in the Microbial Metabolism. Front. Bioeng. Biotechnol. 2020, 8. [Google Scholar] [CrossRef] [Green Version]
- Gadkari, S.; Gu, S.; Sadhukhan, J. Towards automated design of bioelectrochemical systems: A comprehensive review of mathematical models. Chem. Eng. J. 2018, 343, 303–316. [Google Scholar] [CrossRef]
- Caizán-Juanarena, L.; Borsje, C.; Sleutels, T.; Yntema, D.; Santoro, C.; Ieropoulos, I.; Soavi, F.; ter Heijne, A. Combination of bioelectrochemical systems and electrochemical capacitors: Principles, analysis and opportunities. Biotechnol. Adv. 2020, 39, 107456. [Google Scholar] [CrossRef]
- Ngo, H.H.; Ye, Y.; Guo, W.; Du, B.; Wei, D.; Wei, Q.; Liu, Y. 12-Nutrient recovery in anaerobic membrane bioreactors. In Current Developments in Biotechnology and Bioengineering; Ngo, H.H., Guo, W., Ng, H.Y., Mannina, G., Pandey, A., Eds.; Elsevier: Amsterdam, The Netherlands, 2020; pp. 283–307. [Google Scholar] [CrossRef]
- Strik, D.P.B.T.B.; Timmers, R.A.; Helder, M.; Steinbusch, K.J.J.; Hamelers, H.V.M.; Buisman, C.J.N. Microbial solar cells: Applying photosynthetic and electrochemically active organisms. Trends Biotechnol. 2011, 29, 41–49. [Google Scholar] [CrossRef] [Green Version]
- Nguyen, C.-L.; Tartakovsky, B.; Woodward, L. Harvesting energy from multiple microbial fuel cells with a high-conversion efficiency power management system. ACS Omega 2019, 4, 18978–18986. [Google Scholar] [CrossRef]
- Satinover, S.J.; Rodriguez, M.; Campa, M.F.; Hazen, T.C.; Borole, A.P. Performance and community structure dynamics of microbial electrolysis cells operated on multiple complex feedstocks. Biotechnol. Biofuels 2020, 13, 1–21. [Google Scholar] [CrossRef]
- Imoro, A.Z.; Mensah, M.; Buamah, R. Developments in the microbial desalination cell technology: A review. Water-Energy Nexus 2021, 4, 76–87. [Google Scholar] [CrossRef]
- Jafary, T.; Daud, W.R.W.; Ghasemi, M.; Kim, B.H.; Md Jahim, J.; Ismail, M.; Lim, S.S. Biocathode in microbial electrolysis cell; present status and future prospects. Renew. Sustain. Energy Rev. 2015, 47, 23–33. [Google Scholar] [CrossRef]
- Santoro, C.; Arbizzani, C.; Erable, B.; Ieropoulos, I. Microbial fuel cells: From fundamentals to applications. A review. J. Power Sources 2017, 356, 225–244. [Google Scholar] [CrossRef] [PubMed]
- Kim, B.-H.; Kim, H.-J.; Hyun, M.-S.; Park, D.-H. Direct electrode reaction of Fe (III)-reducing bacterium, Shewanella putrefaciens. J. Microbiol. Biotechnol. 1999, 9, 127–131. [Google Scholar]
- Kim, B.H.; Park, H.S.; Kim, H.J.; Kim, G.T.; Chang, I.S.; Lee, J.; Phung, N.T. Enrichment of microbial community generating electricity using a fuel-cell-type electrochemical cell. Appl. Microbiol. Biotechnol. 2004, 63, 672–681. [Google Scholar] [CrossRef]
- Jafary, T.; Ghoreyshi, A.A.; Najafpour, G.D.; Fatemi, S.; Rahimnejad, M. Investigation on performance of microbial fuel cells based on carbon sources and kinetic models. Int. J. Energy Res. 2013, 37, 1539–1549. [Google Scholar] [CrossRef]
- Jafary, T.; Rahimnejad, M.; Ghoreyshi, A.A.; Najafpour, G.; Hghparast, F.; Daud, W.R.W. Assessment of bioelectricity production in microbial fuel cells through series and parallel connections. Energy Convers. Manag. 2013, 75, 256–262. [Google Scholar] [CrossRef]
- Rahimnejad, M.; Ghoreyshi, A.A.; Najafpour, G.; Jafary, T. Power generation from organic substrate in batch and continuous flow microbial fuel cell operations. Appl. Energy 2011, 88, 3999–4004. [Google Scholar] [CrossRef]
- Sadeqzadeh, M.; Mostafa, G.; Ghannadzadeh, A.; Babak, S.; Tahereh, J.; Wan, R.; Hassan, S.H.A. Mass transfer limitation in different anode electrode surface areas on the performance of dual chamber Microbial Fuel Cell. Am. J. Biochem. Biotechnol. 2012, 8, 320–325. [Google Scholar]
- Rahimnejad, M.; Adhami, A.; Darvari, S.; Zirepour, A.; Oh, S.-E. Microbial fuel cell as new technology for bioelectricity generation: A review. Alex. Eng. J. 2015, 54, 745–756. [Google Scholar] [CrossRef] [Green Version]
- Palanisamy, G.; Jung, H.-Y.; Sadhasivam, T.; Kurkuri, M.D.; Kim, S.C.; Roh, S.-H. A comprehensive review on microbial fuel cell technologies: Processes, utilization, and advanced developments in electrodes and membranes. J. Clean. Prod. 2019, 221, 598–621. [Google Scholar] [CrossRef]
- Feng, C.; Hu, A.; Chen, S.; Yu, C.-P. A decentralized wastewater treatment system using microbial fuel cell techniques and its response to a copper shock load. Bioresour. Technol. 2013, 143, 76–82. [Google Scholar] [CrossRef]
- Robles, Á.; Capson-Tojo, G.; Gales, A.; Viruela, A.; Sialve, B.; Seco, A.; Steyer, J.P.; Ferrer, J. Performance of a membrane-coupled high-rate algal pond for urban wastewater treatment at demonstration scale. Bioresour. Technol. 2020, 301, 122672. [Google Scholar] [CrossRef]
- Hsu, L.; Arias-Thode, M.; Salvacion, M.; Benavidez, Z.; Mirhosseini, A.; Babanova, S.; Chen, S.; Bretschger, O.J.E.T. Demonstration of an Energy-Neutral, Off-Grid Microbial Fuel Cell System for Decentralized Wastewater Treatment. ECS Trans. 2017, 75, 19. [Google Scholar] [CrossRef]
- Castro, C.J.; Goodwill, J.E.; Rogers, B.; Henderson, M.; Butler, C.S. Deployment of the microbial fuel cell latrine in Ghana for decentralized sanitation. J. Water Sanit. Hyg. Dev. 2014, 4, 663–671. [Google Scholar] [CrossRef] [Green Version]
- Valladares Linares, R.; Domínguez-Maldonado, J.; Rodríguez-Leal, E.; Patrón, G.; Castillo-Hernández, A.; Miranda, A.; Diaz Romero, D.; Moreno-Cervera, R.; Camara-chale, G.; Borroto, C.G.; et al. Scale up of Microbial Fuel Cell Stack System for Residential Wastewater Treatment in Continuous Mode Operation. Water 2019, 11, 217. [Google Scholar] [CrossRef] [Green Version]
- Gadkari, S.; Fontmorin, J.-M.; Yu, E.; Sadhukhan, J. Influence of temperature and other system parameters on microbial fuel cell performance: Numerical and experimental investigation. Chem. Eng. J. 2020, 388, 124176. [Google Scholar] [CrossRef]
- Li, S.; Chen, G. Factors Affecting the Effectiveness of Bioelectrochemical System Applications: Data Synthesis and Meta-Analysis. Batteries 2018, 4, 34. [Google Scholar] [CrossRef] [Green Version]
- Heidrich, E.S.; Dolfing, J.; Wade, M.J.; Sloan, W.T.; Quince, C.; Curtis, T.P. Temperature, inocula and substrate: Contrasting electroactive consortia, diversity and performance in microbial fuel cells. Bioelectrochemistry 2018, 119, 43–50. [Google Scholar] [CrossRef]
- Li, L.; Sun, Y.; Yuan, Z.; Kong, X.; Li, Y. Effect of temperature change on power generation of microbial fuel cell. Environ. Technol. 2013, 34, 1929–1934. [Google Scholar] [CrossRef]
- Jafary, T.; Daud, W.R.W.; Ghasemi, M.; Kim, B.H.; Carmona-Martínez, A.A.; Bakar, M.H.A.; Jahim, J.M.; Ismail, M. A comprehensive study on development of a biocathode for cleaner production of hydrogen in a microbial electrolysis cell. J. Clean. Prod. 2017, 164, 1135–1144. [Google Scholar] [CrossRef]
- Morillo, J.; Usero, J.; Rosado, D.; El Bakouri, H.; Riaza, A.; Bernaola, F.-J. Comparative study of brine management technologies for desalination plants. Desalination 2014, 336, 32–49. [Google Scholar] [CrossRef]
- Alhimali, H.; Jafary, T.; Al-Mamun, A.; Baawain, M.S.; Vakili-Nezhaad, G.R. New insights into the application of microbial desalination cells for desalination and bioelectricity generation. Biofuel Res. J. 2019, 6, 1090. [Google Scholar] [CrossRef] [Green Version]
- Roberts, D.A.; Johnston, E.L.; Knott, N.A. Impacts of desalination plant discharges on the marine environment: A critical review of published studies. Water Res. 2010, 44, 5117–5128. [Google Scholar] [CrossRef] [PubMed]
- Jafary, T.; Al-Mamun, A.; Alhimali, H.; Baawain, M.S.; Rahman, S.; Tarpeh, W.A.; Dhar, B.R.; Kim, B.H. Novel two-chamber tubular microbial desalination cell for bioelectricity production, wastewater treatment and desalination with a focus on self-generated pH control. Desalination 2020, 481, 114358. [Google Scholar] [CrossRef]
- Mateo, S.; Gonzalez del Campo, A.; Cañizares, P.; Lobato, J.; Rodrigo, M.A.; Fernandez, F.J. Bioelectricity generation in a self-sustainable Microbial Solar Cell. Bioresour. Technol. 2014, 159, 451–454. [Google Scholar] [CrossRef]
- Strycharz-Glaven, S.M.; Glaven, R.H.; Wang, Z.; Zhou, J.; Vora, G.J.; Tender, L.M. Electrochemical Investigation of a Microbial Solar Cell Reveals a Nonphotosynthetic Biocathode Catalyst. Appl. Environ. Microbiol. 2013, 79, 3933–3942. [Google Scholar] [CrossRef] [Green Version]
- Behera, B.K.; Varma, A. Bioelectricity Generation. In Bioenergy for Sustainability and Security; Springer: Singapore, 2019; pp. 265–299. [Google Scholar]
- Rizzo, A. Automatic Test Equipment for Plant Microbial Fuel Cells for Energy Harvesting. Ph.D. Dissertation, Politecnic di Torino, Torino, Italy, 2019. [Google Scholar]
- Kabutey, F.T.; Zhao, Q.; Wei, L.; Ding, J.; Antwi, P.; Quashie, F.K.; Wang, W. An overview of plant microbial fuel cells (PMFCs): Configurations and applications. Renew. Sustain. Energy Rev. 2019, 110, 402–414. [Google Scholar] [CrossRef]
- Khan, M.D.; Khan, N.; Sultana, S.; Khan, M.Z.; Sabir, S.; Azam, A. Microbial fuel cell: Waste minimization and energy generation. In Modern Age Environmental Problems and Their Remediation; Springer: Cham, Switzerland, 2018; pp. 129–146. [Google Scholar]
- Wu, S.; Li, H.; Zhou, X.; Liang, P.; Zhang, X.; Jiang, Y.; Huang, X. A novel pilot-scale stacked microbial fuel cell for efficient electricity generation and wastewater treatment. Water Res. 2016, 98, 396–403. [Google Scholar] [CrossRef]
- Rousseau, R.; Etcheverry, L.; Roubaud, E.; Basséguy, R.; Délia, M.-L.; Bergel, A. Microbial electrolysis cell (MEC): Strengths, weaknesses and research needs from electrochemical engineering standpoint. Appl. Energy 2020, 257, 113938. [Google Scholar] [CrossRef]
- Ping, Q.; He, Z. Improving the flexibility of microbial desalination cells through spatially decoupling anode and cathode. Bioresour. Technol. 2013, 144, 304–310. [Google Scholar] [CrossRef] [PubMed]
- Yang, E.; Chae, K.-J.; Choi, M.-J.; He, Z.; Kim, I.S. Critical review of bioelectrochemical systems integrated with membrane-based technologies for desalination, energy self-sufficiency, and high-efficiency water and wastewater treatment. Desalination 2019, 452, 40–67. [Google Scholar] [CrossRef]
- Enamala, M.K.; Dixit, R.; Tangellapally, A.; Singh, M.; Dinakarrao, S.M.P.; Chavali, M.; Pamanji, S.R.; Ashokkumar, V.; Kadier, A.; Chandrasekhar, K. Photosynthetic microorganisms (algae) mediated bioelectricity generation in microbial fuel cell: Concise review. Environ. Technol. Innov. 2020, 19, 100959. [Google Scholar] [CrossRef]
- Velasquez-Orta, S.B.; Curtis, T.P.; Logan, B.E. Energy from algae using microbial fuel cells. Biotechnol. Bioeng. 2009, 103, 1068–1076. [Google Scholar] [CrossRef]
- Zaman, B.; Samadikun, B.; Budihardjo, M.; Hardyanti, N.; Rachma, A.; Hasna, S. Potential of phytotechnology in wastewater treatments to produce alternative electrical energy: A review. Proc. J. Phys. Conf. Ser. 2020, 1524, 012082. [Google Scholar] [CrossRef]
- Bala Prasad, K.; Dhana Raju, V.; Ahamad Shaik, A.; Gopidesi, R.K.; Sreekara Reddy, M.B.S.; Soudagar, M.E.M.; Mujtaba, M.A. Impact of injection timings and exhaust gas recirculation rates on the characteristics of diesel engine operated with neat tamarind biodiesel. Energy Sources Part A Recovery Util. Environ. Eff. 2021, 1–19. [Google Scholar] [CrossRef]
- Wategave, S.; Banapurmath, N.; Sawant, M.; Soudagar, M.E.M.; Mujtaba, M.; Afzal, A.; Basha, J.S.; Alazwari, M.A.; Safaei, M.R.; Elfasakhany, A. Clean combustion and emissions strategy using reactivity controlled compression ignition (RCCI) mode engine powered with CNG-Karanja biodiesel. J. Taiwan Inst. Chem. Eng. 2021, 124, 116–131. [Google Scholar] [CrossRef]
- Sateesh, K.A.; Yaliwal, V.S.; Soudagar, M.E.M.; Banapurmath, N.R.; Fayaz, H.; Safaei, M.R.; Elfasakhany, A.; El-Seesy, A.I. Utilization of biodiesel/Al2O3 nanoparticles for combustion behavior enhancement of a diesel engine operated on dual fuel mode. J. Therm. Anal. Calorim. 2021, 1–15. [Google Scholar] [CrossRef]
- Afzal, A.; Soudagar, M.E.M.; Belhocine, A.; Kareemullah, M.; Hossain, N.; Alshahrani, S.; Saleel, C.; Subbiah, R.; Qureshi, F.; Mujtaba, M. Thermal Performance of Compression Ignition Engine Using High Content Biodiesels: A Comparative Study with Diesel Fuel. Sustainability 2021, 13, 7688. [Google Scholar] [CrossRef]
- Aneeque, M.; Alshahrani, S.; Kareemullah, M.; Afzal, A.; Saleel, C.A.; Soudagar, M.E.M.; Hossain, N.; Subbiah, R.; Ahmed, M.H. The Combined Effect of Alcohols and Calophyllum inophyllum Biodiesel Using Response Surface Methodology Optimization. Sustainability 2021, 13, 7345. [Google Scholar] [CrossRef]
- Prabhu, C. Potential for Biomass Energy Generation under Study. Oman Dly. Obs. 2016, 2, 15–29. Available online: https://www.omanobserver.om/article/92861/1003/potential-for-biomass-energy-generation-under-study (accessed on 3 September 2021).
- Welfle, A.; Alawadhi, A. Bioenergy opportunities, barriers and challenges in the Arabian Peninsula—Resource modelling, surveys & interviews. Biomass Bioenergy 2021, 150, 106083. [Google Scholar] [CrossRef]
- Ioannidis, R.; Koutsoyiannis, D.J.A.E. A review of land use, visibility and public perception of renewable energy in the context of landscape impact. Appl. Energy 2020, 276, 115367. [Google Scholar] [CrossRef]
- Karagiannidis, A. Waste to Energy. Opportunities and Challenges for Developing and Transition Economies; Springer: London, UK, 2012. [Google Scholar]
- Damoom, M.M.; Hashim, S.; Aljohani, M.S.; Saleh, M.A.J.T.E.J. Adding sustainable sources to the Saudi Arabian electricity sector. Electr. J. 2018, 31, 20–28. [Google Scholar] [CrossRef]
- Masdar. Sharjah Waste-to-Energy Project. Available online: https://masdar.ae/en/masdar-clean-energy/projects/sharjah-waste-to-energy-project. (accessed on 3 September 2021).
- King, D.C. Oman; Marshall Cavendish Benchmark: New York, NY, USA, 2009. [Google Scholar]
- Sait, H.H.; Hussain, A.; Salema, A.A.; Ani, F.N. Pyrolysis and combustion kinetics of date palm biomass using thermogravimetric analysis. Bioresour. Technol. 2012, 118, 382–389. [Google Scholar] [CrossRef] [PubMed]
- Islam, M.N.; Najmul Hoque, S.; Joardder, M. Fixed bed pyrolysis of date seed waste for liquid oil production. In Proceedings of the 8th International Conference on Mechanical Engineering, Dhaka, Bangladesh, 26–28 December 2009; pp. 1–4. [Google Scholar]
- Al-Yahyai, R.; Khan, M.M. Date palm status and perspective in Oman. In Date Palm Genetic Resources and Utilization; Al-Khayri, J., Jain, S., Johnson, D., Eds.; Springer: Dordrecht, The Netherlands, 2015; pp. 207–240. [Google Scholar]
- Amani, M.A.; Davoudi, M.S.; Tahvildari, K.; Nabavi, S.M.; Davoudi, M.S. Biodiesel production from Phoenix dactylifera as a new feedstock. Ind. Crops Prod. 2013, 43, 40–43. [Google Scholar] [CrossRef]
- Funke, A.; Niebel, A.; Richter, D.; Abbas, M.M.; Müller, A.K.; Radloff, S.; Paneru, M.; Maier, J.; Dahmen, N.; Sauer, J. Fast pyrolysis char—Assessment of alternative uses within the bioliq® concept. Bioresour. Technol. 2016, 200, 905–913. [Google Scholar] [CrossRef] [PubMed]
- Li, X.; Wei, Y.; Moore, K.J.; Michaud, R.; Viands, D.R.; Hansen, J.L.; Acharya, A.; Brummer, E.C. Association mapping of biomass yield and stem composition in a tetraploid alfalfa breeding population. Plant Genome 2011, 4, 4. [Google Scholar] [CrossRef] [Green Version]
- Ritchie, H.; Roser, M. Meat and Dairy Production. Available online: https://ourworldindata.org/meat-production (accessed on 3 September 2021).
- Zafar, S. Waste-to-Energy Pathways. Available online: https://www.ecomena.org/wte-pathways/ (accessed on 10 September 2021).
- Hoang, A.T.; Ong, H.C.; Fattah, I.M.R.; Chong, C.T.; Cheng, C.K.; Sakthivel, R.; Ok, Y.S. Progress on the lignocellulosic biomass pyrolysis for biofuel production toward environmental sustainability. Fuel Process. Technol. 2021, 223, 106997. [Google Scholar] [CrossRef]
- Bujak, J.W. New insights into waste management—Meat industry. Renew. Energy 2015, 83, 1174–1186. [Google Scholar] [CrossRef]
- Hamad, T.A.; Agll, A.A.; Hamad, Y.M.; Sheffield, J.W. Solid waste as renewable source of energy: Current and future possibility in Libya. Case Stud. Therm. Eng. 2014, 4, 144–152. [Google Scholar] [CrossRef] [Green Version]
- Siddiki, S.Y.A.; Uddin, M.N.; Mofijur, M.; Fattah, I.M.R.; Ong, H.C.; Lam, S.S.; Kumar, P.S.; Ahmed, S.F. Theoretical calculation of biogas production and greenhouse gas emission reduction potential of livestock, poultry and slaughterhouse waste in Bangladesh. J. Environ. Chem. Eng. 2021, 9, 105204. [Google Scholar] [CrossRef]
- Mofijur, M.; Fattah, I.M.R.; Kumar, P.S.; Siddiki, S.Y.A.; Rahman, S.M.A.; Ahmed, S.F.; Ong, H.C.; Lam, S.S.; Badruddin, I.A.; Khan, T.M.Y.; et al. Bioenergy recovery potential through the treatment of the meat processing industry waste in Australia. J. Environ. Chem. Eng. 2021, 9, 105657. [Google Scholar] [CrossRef]
- Kantarli, I.C.; Kabadayi, A.; Ucar, S.; Yanik, J. Conversion of poultry wastes into energy feedstocks. Waste Manag. 2016, 56, 530–539. [Google Scholar] [CrossRef]
- Almandoz, M.C.; Pagliero, C.L.; Ochoa, N.A.; Marchese, J. Composite ceramic membranes from natural aluminosilicates for microfiltration applications. Ceram. Int. 2015, 41, 5621–5633. [Google Scholar] [CrossRef]
- Zamri, M.F.M.A.; Bahru, R.; Suja, F.; Shamsuddin, A.H.; Pramanik, S.K.; Fattah, I.M.R. Treatment strategies for enhancing the removal of endocrine-disrupting chemicals in water and wastewater systems. J. Water Process. Eng. 2021, 41, 102017. [Google Scholar] [CrossRef]
- Strezov, V. Properties of biomass fuels. In Biomass Processing Technologies; Strezov, V., Evans, T.J., Eds.; CRC Press, Taylor & Francis Group: Boca Raton, FL, USA, 2015; pp. 1–31. [Google Scholar]
- Zamri, M.F.M.A.; Hasmady, S.; Akhiar, A.; Ideris, F.; Shamsuddin, A.H.; Mofijur, M.; Fattah, I.M.R.; Mahlia, T.M.I. A comprehensive review on anaerobic digestion of organic fraction of municipal solid waste. Renew. Sustain. Energy Rev. 2021, 137, 110637. [Google Scholar] [CrossRef]
- Thrän, D. (Ed.) Smart Bioenergy Technologies and Concepts for a More Flexible Bioenergy Provision in Future Energy Systems; Springer: Leipzig, Germany, 2015. [Google Scholar]
- Akram, N.; Sadri, R.; Kazi, S.; Ahmed, S.; Zubir, M.; Ridha, M.; Soudagar, M.; Ahmed, W.; Arzpeyma, M.; Tong, G.B. An experimental investigation on the performance of a flat-plate solar collector using eco-friendly treated graphene nanoplatelets—Water nanofluids. J. Therm. Anal. Calorim. 2019, 138, 609–621. [Google Scholar] [CrossRef]
- Akram, N.; Sadri, R.; Kazi, S.; Zubir, M.N.M.; Ridha, M.; Ahmed, W.; Soudagar, M.E.M.; Arzpeyma, M. A comprehensive review on nanofluid operated solar flat plate collectors. J. Therm. Anal. Calorim. 2020, 139, 1309–1343. [Google Scholar] [CrossRef]
- Hemadrasa, D. Cost Effective Analysis of Solar and Wind Power in Oman. J. Sci. Res. Electrotech. Electron. 2013, 48, 5–6. [Google Scholar]
- Jathar, L.D.; Ganesan, S.; Shahapurkar, K.; Soudagar, M.E.M.; Mujtaba, M.; Anqi, A.E.; Farooq, M.; Khidmatgar, A.; Goodarzi, M.; Safaei, M.R. Effect of various factors and diverse approaches to enhance the performance of solar stills: A comprehensive review. J. Therm. Anal. Calorim. 2021, 1–32. [Google Scholar] [CrossRef]
- Akram, N.; Montazer, E.; Kazi, S.; Soudagar, M.E.M.; Ahmed, W.; Zubir, M.N.M.; Afzal, A.; Muhammad, M.R.; Ali, H.M.; Márquez, F.P.G. Experimental investigations of the performance of a flat-plate solar collector using carbon and metal oxides based nanofluids. Energy 2021, 227, 120452. [Google Scholar] [CrossRef]
- Khan, T.Y.; Soudagar, M.E.M.; Kanchan, M.; Afzal, A.; Banapurmath, N.R.; Akram, N.; Mane, S.D.; Shahapurkar, K. Optimum location and influence of tilt angle on performance of solar PV panels. J. Therm. Anal. Calorim. 2020, 141, 511–532. [Google Scholar] [CrossRef]
- Munawwar, S.; Ghedira, H. A review of Renewable Energy and Solar Industry Growth in the GCC Region. Energy Procedia 2014, 57, 3191–3202. [Google Scholar] [CrossRef] [Green Version]
- Bierman, B.; Al-Lawatia, H.; DiFilippo, M.; O’Donnell, J. Deploying enclosed trough for thermal EOR at commercial scale. AIP Conf. Proc. 2018, 2033, 030002. [Google Scholar] [CrossRef]
- Al-Saidi, M. From Economic to Extrinsic Values of Sustainable Energy: Prestige, Neo-Rentierism, and Geopolitics of the Energy Transition in the Arabian Peninsula. Energies 2020, 13, 5545. [Google Scholar] [CrossRef]
- Alharbi, F.; Csala, D. GCC Countries’ Renewable Energy Penetration and the Progress of Their Energy Sector Projects. IEEE Access 2020, 8, 211986–212002. [Google Scholar] [CrossRef]
- Mofijur, M.; Fattah, I.M.R.; Alam, M.A.; Islam, A.B.M.S.; Ong, H.C.; Rahman, S.M.A.; Najafi, G.; Ahmed, S.F.; Uddin, M.A.; Mahlia, T.M.I. Impact of COVID-19 on the social, economic, environmental and energy domains: Lessons learnt from a global pandemic. Sustain. Prod. Consum. 2021, 26, 343–359. [Google Scholar] [CrossRef] [PubMed]
- Mas’ud, A.A.; Wirba, A.V.; Alshammari, S.J.; Muhammad-Sukki, F.; Abdullahi, M.A.M.; Albarracín, R.; Hoq, M.Z. Solar Energy Potentials and Benefits in the Gulf Cooperation Council Countries: A Review of Substantial Issues. Energies 2018, 11, 372. [Google Scholar] [CrossRef] [Green Version]
- Alnaser, W.E.; Alnaser, N.W. The Impact of the Rise of Using Solar Energy in GCC Countries. In Renewable Energy and Sustainable Buildings: Selected Papers from the World Renewable Energy Congress WREC 2018; Sayigh, A., Ed.; Springer International Publishing: Cham, Switzerland, 2020; pp. 167–183. [Google Scholar] [CrossRef] [Green Version]
- GWEC. Global Wind Report 2017; Global Wind Energy Council: Brussels, Belgium, 2017. [Google Scholar]
- Al-Salem, K.; Neelamani, S.; Al-Nassar, W. Wind energy map of Arabian Gulf. Nat. Resour. 2018, 9, 212–228. [Google Scholar] [CrossRef] [Green Version]
- Ramli, M.A.M.; Twaha, S.; Al-Hamouz, Z. Analyzing the potential and progress of distributed generation applications in Saudi Arabia: The case of solar and wind resources. Renew. Sustain. Energy Rev. 2017, 70, 287–297. [Google Scholar] [CrossRef]
- Baseer, M.A.; Rehman, S.; Meyer, J.P.; Alam, M.M. GIS-based site suitability analysis for wind farm development in Saudi Arabia. Energy 2017, 141, 1166–1176. [Google Scholar] [CrossRef] [Green Version]
- Al-Sharafi, A.; Sahin, A.Z.; Ayar, T.; Yilbas, B.S. Techno-economic analysis and optimization of solar and wind energy systems for power generation and hydrogen production in Saudi Arabia. Renew. Sustain. Energy Rev. 2017, 69, 33–49. [Google Scholar] [CrossRef]
- Alharbi, F.; Csala, D. Saudi Arabia’s Solar and Wind Energy Penetration: Future Performance and Requirements. Energies 2020, 13, 588. [Google Scholar] [CrossRef] [Green Version]
- Al-Marri, W.; Al-Habaibeh, A.; Watkins, M. An investigation into domestic energy consumption behaviour and public awareness of renewable energy in Qatar. Sustain. Cities Soc. 2018, 41, 639–646. [Google Scholar] [CrossRef] [Green Version]
- Marafia, A.H.; Ashour, H.A. Economics of off-shore/on-shore wind energy systems in Qatar. Renew. Energy 2003, 28, 1953–1963. [Google Scholar] [CrossRef]
- Bahaj, A.S.; Mahdy, M.; Alghamdi, A.S.; Richards, D.J. New approach to determine the Importance Index for developing offshore wind energy potential sites: Supported by UK and Arabian Peninsula case studies. Renew. Energy 2020, 152, 441–457. [Google Scholar] [CrossRef]
- Jahangiri, M.; Shamsabadi, A.A.; Mostafaeipour, A.; Rezaei, M.; Yousefi, Y.; Pomares, L.M. Using fuzzy MCDM technique to find the best location in Qatar for exploiting wind and solar energy to generate hydrogen and electricity. Int. J. Hydrogen Energy 2020, 45, 13862–13875. [Google Scholar] [CrossRef]
- Ganoe, R.E.; Stackhouse, P.; DeYoung, R.J. RETScreen® Plus Software Tutorial; National Aeronautics and Space Administration, Langley Research Center: Hampton, VA, USA, 2014. Available online: https://ntrs.nasa.gov/api/citations/20150000447/downloads/20150000447.pdf (accessed on 3 September 2021).
- Bachellerie, I.J. Renewable Energy in the GCC Countries: Resources, Potential, and Prospects. 2012. Available online: http://library.fes.de/pdf-files/bueros/amman/09008.pdf (accessed on 3 September 2021).
- Sgouridis, S.; Abdullah, A.; Griffiths, S.; Saygin, D.; Wagner, N.; Gielen, D.; Reinisch, H.; McQueen, D. RE-mapping the UAE’s energy transition: An economy-wide assessment of renewable energy options and their policy implications. Renew. Sustain. Energy Rev. 2016, 55, 1166–1180. [Google Scholar] [CrossRef]
- Trichakis, P.; Carter, N.; Tudhope, S.; Patel, I.; Sgouridis, S.; Griffiths, S. Enabling the UAE’s Energy Transition—Top Ten Priority Areas for Renewable Energy Policymakers; Ministry of Energy and Industry, UAE: Dubai, United Arab Emirates, 2018. Available online: https://www.emiratesnaturewwf.ae/sites/default/files/doc-2018-09/Enabling%20the%20UAE%E2%80%99s%20energy%20transition_%20F4_EWSWWF_WEB.pdf (accessed on 3 September 2021).
- Elgabiri, M.; Palmer, D.; Al Buflasa, H.; Thomson, M. Offshore wind energy potential for Bahrain via multi-criteria evaluation. Wind. Eng. 2021, 45, 838–856. [Google Scholar] [CrossRef]
- Haji, S.; Bin Shams, M.; Akbar, A.S.; Abdali, H.; Alsaffar, A. Energy analysis of Bahrain’s first hybrid renewable energy system. Int. J. Green Energy 2019, 16, 733–748. [Google Scholar] [CrossRef]
- Bin Shams, M.; Haji, S.; Salman, A.; Abdali, H.; Alsaffar, A. Time series analysis of Bahrain’s first hybrid renewable energy system. Energy 2016, 103, 1–15. [Google Scholar] [CrossRef]
- Al-Yahyai, S.; Charabi, Y.; Gastli, A.; Al-Alawi, S. Assessment of wind energy potential locations in Oman using data from existing weather stations. Renew. Sustain. Energy Rev. 2010, 14, 1428–1436. [Google Scholar] [CrossRef]
- Azam, M.H.; Abushammala, M. Assessing the Effectiveness of Solar and Wind Energy in Sultanate of Oman. J. Stud. Res. 2017. [Google Scholar] [CrossRef]
- Al Busaidi, A.S.; Kazem, H.A.; Al-Badi, A.H.; Farooq Khan, M. A review of optimum sizing of hybrid PV-Wind renewable energy systems in oman. Renew. Sustain. Energy Rev. 2016, 53, 185–193. [Google Scholar] [CrossRef]
- Praveen, R.; Keloth, V.; Abo-Khalil, A.G.; Alghamdi, A.S.; Eltamaly, A.M.; Tlili, I. An insight to the energy policy of GCC countries to meet renewable energy targets of 2030. Energy Policy 2020, 147, 111864. [Google Scholar] [CrossRef]
- Oman Observer. Wind Power Projects Planned in 7 Locations in Oman. Available online: https://www.omanobserver.om/article/1105513/business/energy/wind-power-projects-planned-in-7-locations-in-oman (accessed on 28 August 2021).
- Umar, T.; Wamuziri, S. Briefing: Conventional, wind and solar energy resources in Oman. Proc. Inst. Civ. Eng. Energy 2016, 169, 143–147. [Google Scholar] [CrossRef]
- Soleimani, K.; Ketabdari, M.J.; Khorasani, F. Feasibility study on tidal and wave energy conversion in Iranian seas. Sustain. Energy Technol. Assess. 2015, 11, 77–86. [Google Scholar] [CrossRef]
- Greaves, D.; Iglesias, G. Wave and Tidal Energy; John Wiley & Sons: Oxford, UK, 2018. [Google Scholar]
- Adiputra, R.; Utsunomiya, T.; Koto, J.; Yasunaga, T.; Ikegami, Y. Preliminary design of a 100 MW-net ocean thermal energy conversion (OTEC) power plant study case: Mentawai island, Indonesia. J. Mar. Sci. Technol. 2020, 25, 48–68. [Google Scholar] [CrossRef] [Green Version]


| Country | Total Capacity (MW) (2018) | Wind (MW) | Solar (MW) | Bioenergy (MW) | |
|---|---|---|---|---|---|
| Photovoltaic (PV) | Concentrated Solar Power (CSP) | ||||
| UAE | 596 | 2 | 494 | 100 | – |
| Oman | 8 | – | 8 | – | – |
| Qatar | 43 | – | 5 | – | 38 |
| Bahrain | 6 | 1 | 5 | – | – |
| Kuwait | 41 | 10 | 31 | – | – |
| Saudi Arabia | 142 | 3 | 89 | 50 | – |
| Country | Solar | Wind MW | Bioenergy MW | Total MW | ||
|---|---|---|---|---|---|---|
| Concentrated Solar Power (CSP) MW | Utility PV MW | Building Integrated Photovoltaics (BIPV) MW | ||||
| UAE | 6000 | 18,900 | 4200 | 300 | 600 | 30,000 |
| Bahrain | 70 | 520 | 70 | 20 | 20 | 700 |
| Saudi Arabia | 9500 | 10,500 | 750 | 3500 | 750 | 25,000 |
| Kuwait | 1000 | 5800 | 1000 | 200 | – | 8000 |
| Qatar | 600 | 2250 | 150 | – | 100 | 3100 |
| Oman | 770 | 2420 | 990 | 1210 | 110 | 5500 |
| Raw Resources | Harvesting Technology | Output | Technology Development Status (Lab/Small/Pilot/Industrial Scale) | Energy Output | Advantages | Disadvantages | References |
|---|---|---|---|---|---|---|---|
| Wastewater, organic matters, plants, etc. | MFC | Bioelectricity | Pilot scale | 50 W/m3 a | Low activated sludge generation, wide operating range for pH, temperature, and biomass, no harmful environmental impact | Low power output, high capital cost for membrane and electrode, membrane and electrode fouling | [44,64,65] |
| MEC | Hydrogen, methane | Pilot scale | 17.8 LH2/d/m2 b | Low activated sludge generation, High theoretical energy and thermal yield, self-sustainable, low equilibrium cell voltage, a wide range of feedstock | Impurity of product, low production rate, High capital cost for membrane and electrode, membrane and electrode fouling | [66] | |
| MDC | Bioelectricity and desalination | Small scale | 82.6 W/m3 a | Low activated sludge generation, an ecofriendly desalination approach, no need for energy or pressure input | Membrane and electrode fouling, high material cost, no real-scale database, low desalination rate | [67,68] | |
| MSC | Bioelectricity and chemicals | Small scale | 277 W/m3 a | CO2 neutral, self-sustainable, high-value products, aquaculture and animal feed production | High material cost, long-term operation stability challenge, not applicable in areas with low sun exposure, low power output | [69,70,71] |
| Waste per Capita per Day (kg) | Total Waste Generated (Mtpa) | Waste Processed through Landfill Management Strategies | Organic Wastes as a Proportion of Total Wastes | |
|---|---|---|---|---|
| UAE | 1.6 | 12.3 | 71.0% | 64.0% |
| Saudi Arabia | 1.4 | 17.4 | 85.0% | 77.5% |
| Bahrain | 1.8 | 2.6 | 92.0% | 71.9% |
| Oman | 1.2 | 4.0 | 100% | 49.0% |
| Kuwait | 1.5 | 3.2 | 100% | 67.0% |
| Qatar | 1.3 | 11.4 | 93.0% | 68.0% |
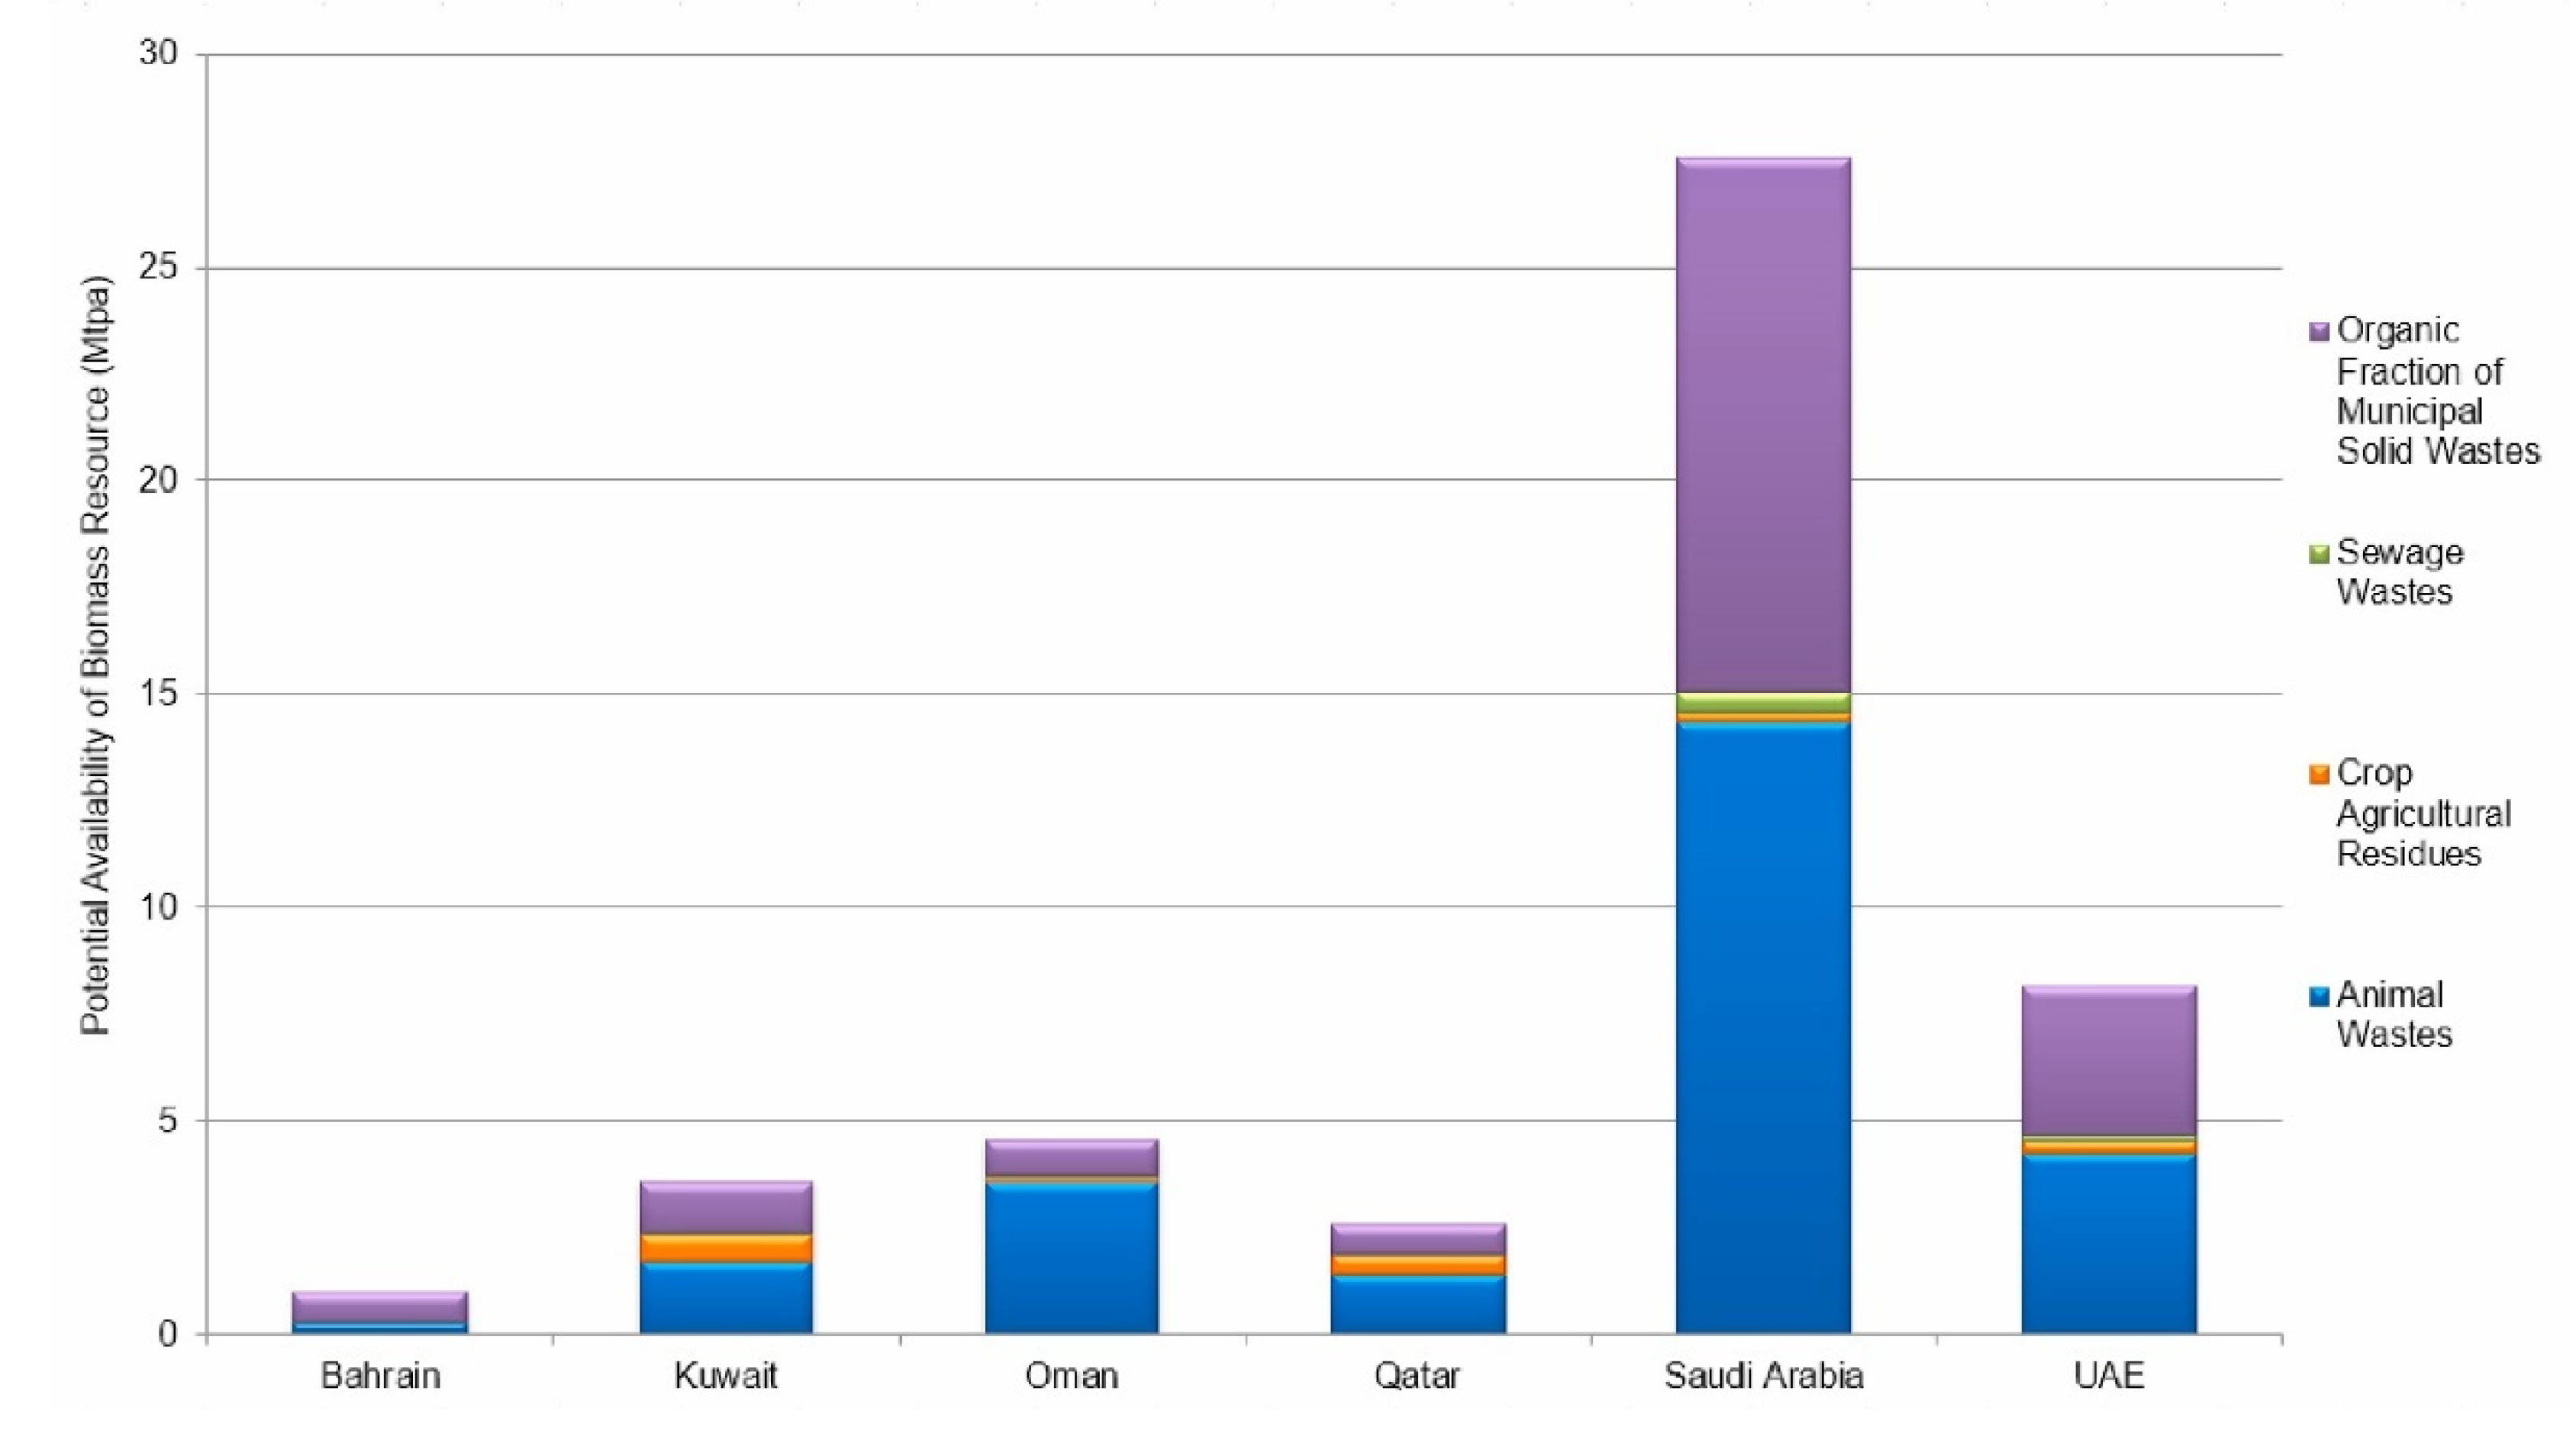
| Biomass Resource Potential (Mtpa) | Bioenergy Potential (PJelec) | Proportion of Overall Electricity Consumption (%) | ||||
|---|---|---|---|---|---|---|
| Animal Wastes | Crop Residues | Sewage | MSW | |||
| UAE | 4.24 | 0.30 | 0.15 | 3.46 | 50.71 | 11.0% |
| Qatar | 1.39 | 0.47 | 0.04 | 0.68 | 16.40 | 9.9% |
| Oman | 3.57 | 0.07 | 0.07 | 0.85 | 27.59 | 22.5% |
| Saudi Arabia | 14.35 | 0.20 | 0.51 | 12.50 | 179.45 | 14.4% |
| Bahrain | 0.27 | 0.01 | 0.02 | 0.68 | 6.59 | 6.3% |
| Kuwait | 1.71 | 0.64 | 0.06 | 1.17 | 23.10 | 10.1% |
| Total | 25.52 | 1.68 | 0.87 | 19.35 | 303.84 | 13.07% |
| Raw Resources | Harvesting Technology | Output Product | Technology Development (Lab/Small/Pilot Scale) | Energy Output | Advantages | Limitations | References |
|---|---|---|---|---|---|---|---|
| Date Palm- Seed, Leaf, and Leaf Stem | Pyrolysis and thermal degradation | Biofuel, biochar | Small scale | Calorific Value of Date Seed 18.97 MJ/kg, Date Leaf 17.9 MJ/kg, Date Leaf stem 10.9 MJ/kg | High calorific value as compared to another biomass. High energy density and high bulk density, low pyrolysis temperature in a range of 200–300 °C, lower residue after thermal degradation | The high moisture content in the leaf steam yields a lower calorific value as compared to a seed. Date leaf and leaf stem other than date seed need some preprocessing cost to remove the moisture content. | [84,85] |
| Date Palm- Seed | Fixed Bed Pyrolysis and Transesterification | Bio-oil, solid char and gas. | Small scale | Liquid oil—28.636 MJ/kg | The liquid yield of 50 wt% is obtained at a reactor bed temperature of 500 °C. | Operating temperature specific. If the temperature is varied, the yield and the product are not yielded in an optimum manner. | [87] |
| Date Seed | Transesterification | Bio diesel | Small scale | HHV: 39.55 MJ/kg | Biodiesel from the date seed oil is high cetane number (60.3), low iodine value (46), viscosity (3.84 mm2/s) and flash point (140 °C) | One main disadvantage of its high pouring point (−1 °C), which limits the use of date seed biodiesel in cold weather. | [87] |
| Meat and Poultry Waste | Direct combustion, Thermal Waste Recycling System | Steam Generation, Mineral fertilizer | Pilot-scale | 1.1 kW/kg and 0.22 kg/kg of bone | The heat efficiency of the entire system was 58.1%, and heat flux for the steam generation was 759.1 kW. Better heat recovery for steam generation, Reduction in pollution, and production of mineral fertilizers from the ashes after the incarnation. | --- | [93] |
| Raw Resources | Harvesting Technology | Output Product | Technology Development Status (Lab/Small/Pilot/Industrial Scale) | Energy Output | Advantages | Disadvantages | References |
|---|---|---|---|---|---|---|---|
| Solar Energy Potential in GCC Countries | Concentrated Solar Power (CSP) | Solar Electricity | Concentrated reflectors and mirrors, Heat engines, and electric generators | 7–25% | More efficient compared to photovoltaics. Less maintenance is required because solar energy is converted into heat energy first and running heat engines and electric generators. | Long time required to convert water into steam. Construction and installation cost is very large. Large space is required for installation. | [105,109,114,115] |
| Photovoltaic (PV) solar project | Solar Electricity | Solar panels or semiconductors materials | 15–22% | In photovoltaics, solar energy is directly converted into electrical energy. This type of solar energy use consists of a photon is the emitting electron that drives a DC current. This DC current can be used directly in some device or can be converted into AC with the help of investors to insert in power plants. | Important to clean the solar plates to obtain maximum efficiency of solar panels. Due to dust particles, the efficiency of solar panels is decreasing. Efficiency is depending upon the intensity of light. Not suitable for cloudy weather and nighttime. | [105,109,114,115] |
| Name of the Renewable Resource | Country | Energy Output | Best Installation Location | Wind Energy Simulation Software | Future Strategic Plan | References |
|---|---|---|---|---|---|---|
| WIND | KSA | 17 GW, 8 MW turbine | Dhahran (151 W/m2, 5.2 m/s) Arar (182 W/m2, 5.4 m/s) Yanbu (142 W/m2, 4.9 m/s), Dhulum (176 W/m2, 5.7 m/s), Qassim (91 W/m2, 4.3 m/s) | Monte Carlo simulation (MCS) and | 50 GW of wind and solar capacity by the year 2040 producing 9.5 GW/year of renewable energy by 2023 | [118,119,124] |
| Kuwait | 4.9 GW, 8 MW turbine | Beacon N6 580 Watt/m2, South Dolphin 360 Watt/m2 Ahmadi oil pier 320 Watt/m2, beacon M28 140 Watt/m2 | Weibull distribution | Generate 10% of its energy needs by the year 2020 | [117,124] | |
| Qatar | 0.9 GW, 8 MW turbine | AbuSamrah 3.77 m/s Ar-Ruways 4.06 m/s Doha Intl Airport 4.10 m/s, Duhan 3.82 m/s Musayid 3.76 m/s | HOMER software and fuzzy MCDM | Membrane and electrode fouling, high material cost, no real-scale database, low desalination rate | [124,125] | |
| UAE | Negligible compare with other GCC countries | Abu Dhabi with 850 KW, wind turbine prototype, installed in Sir Bani Yas Island | ---- | 7% clean energy sources by 2020, 25% 2030 and 75% by 2050. Solar energy collectively makes up 90% of all RE use in the RE map 2030 Case, with the remaining 10% provided by geothermal heat, wind power and waste-to-energy systems | [18,124] | |
| Bahrain | 2.37 GW, 8 MW turbine | --- | Boxe Jenkins | renewable energy target of 5 percent by 2025 and 10 percent by 2035 | [124,132] | |
| Oman | 8 GW, 8 MW turbine | Thumrait 4500 KWh/m2/year c, 8.2 m/s, Qairoon Hairiti 4250 KWh/m2/year, 9 m/s, Masirah 4300 KWh/m2/year, 8.2 m/s Joba 3600 KWh/m2/year, 7.8 m/s 80 m above ground level | A high-resolution regional climate model (EC-EARTH) obtained from CORDEX program for the MENA | 200 MW solar plant in Dakhiliya region and 50 MW wind plant in Dofar region, 2020 | [133,138] |
| Raw Resources | Harvesting Technology | Output Product | Technology Development Status (Lab/Small/Pilot/Industrial Scale) | Advantages | Disadvantages | Ref |
|---|---|---|---|---|---|---|
| Tidal Stream | Underwater turbines | Electricity | Industrial scale | Zero harmful emissions, predictable and constant validity. | High costs affect the coastline ecosystems and high corrosion. | [140] |
| Tidal Rang | Tidal barrages | Electricity | Industrial scale | Zero harmful emissions, predictable and constant validity | High cost and large barrier which can affect the marine environment, affect the coastline ecosystems, and high corrosion. | |
| Waves | Mooring lines | Electricity | Industrial scale | Zero harmful emissions, predictable and constant validity. | High cost can affect the marine environment and high corrosion. | |
| Offshore Wind | Wind turbine | Electricity | Industrial scale | Zero harmful emissions, predictable and constant validity | High cost and large long columns can affect the marine environment, affect the coastline ecosystems, and high corrosion. | |
| Ocean Thermal | OTEC | Electricity | Industrial scale | Zero harmful emissions, predictable and constant validity | High cost, it can affect the marine and high corrosion | [141] |
Publisher’s Note: MDPI stays neutral with regard to jurisdictional claims in published maps and institutional affiliations. |
© 2021 by the authors. Licensee MDPI, Basel, Switzerland. This article is an open access article distributed under the terms and conditions of the Creative Commons Attribution (CC BY) license (https://creativecommons.org/licenses/by/4.0/).
Share and Cite
Basha, J.S.; Jafary, T.; Vasudevan, R.; Bahadur, J.K.; Ajmi, M.A.; Neyadi, A.A.; Soudagar, M.E.M.; Mujtaba, M.; Hussain, A.; Ahmed, W.; et al. Potential of Utilization of Renewable Energy Technologies in Gulf Countries. Sustainability 2021, 13, 10261. https://doi.org/10.3390/su131810261
Basha JS, Jafary T, Vasudevan R, Bahadur JK, Ajmi MA, Neyadi AA, Soudagar MEM, Mujtaba M, Hussain A, Ahmed W, et al. Potential of Utilization of Renewable Energy Technologies in Gulf Countries. Sustainability. 2021; 13(18):10261. https://doi.org/10.3390/su131810261
Chicago/Turabian StyleBasha, J. Sadhik, Tahereh Jafary, Ranjit Vasudevan, Jahanzeb Khan Bahadur, Muna Al Ajmi, Aadil Al Neyadi, Manzoore Elahi M. Soudagar, MA Mujtaba, Abrar Hussain, Waqar Ahmed, and et al. 2021. "Potential of Utilization of Renewable Energy Technologies in Gulf Countries" Sustainability 13, no. 18: 10261. https://doi.org/10.3390/su131810261
APA StyleBasha, J. S., Jafary, T., Vasudevan, R., Bahadur, J. K., Ajmi, M. A., Neyadi, A. A., Soudagar, M. E. M., Mujtaba, M., Hussain, A., Ahmed, W., Shahapurkar, K., Rahman, S. M. A., & Fattah, I. M. R. (2021). Potential of Utilization of Renewable Energy Technologies in Gulf Countries. Sustainability, 13(18), 10261. https://doi.org/10.3390/su131810261