Article

Efficiency of Natural Clay Mineral Adsorbent Filtration Systems in Wastewater Treatment for Potential Irrigation Purposes

1
Central Laboratory for Environmental Quality Monitoring (CLEQM), National Water Research Center (NWRC), Qalyobia 13621, Egypt
2
National Water Research Center (NWRC), Water Management Research Institute (WMRI), Qalyobia 13621, Egypt
3
Agricultural Research Center (ARC), On-Farm Irrigation and Drainage Engineering Research Department, Agricultural Engineering Research Institute (AEnRI), Giza 256, Egypt
4
Department of Environmental Engineering, Faculty of Civil Engineering, Technical University of Kosice, 04200 Kosice, Slovakia
5
Department of Building Facilities, Faculty of Civil Engineering, Technical University of Kosice, 04200 Kosice, Slovakia
6
Department of Soil Science, Faculty of Agriculture, Zagazig University, Zagazig 44511, Egypt
*
Author to whom correspondence should be addressed.
Sustainability 2021, 13(10), 5738; https://doi.org/10.3390/su13105738
Submission received: 4 April 2021 / Revised: 18 May 2021 / Accepted: 18 May 2021 / Published: 20 May 2021
(This article belongs to the Special Issue Bioeconomy, Circular Economy and Sustainability)

Abstract

:
This project investigated the relative efficiencies of three pilot-scale constructed columns for enhancing drainage wastewater treatment processes to ensure compliance with Egyptian and international water quality criteria. In this investigation, basic materials (sand and gravel) and variable natural clay minerals zeolite (Z), diatomite (D) and bentonite (B) were utilized as packing materials to build up a Z column (ZC), D column (DC) and B column (BC), respectively. The three columns’ ability to remove pollutants from waste water for re-use in irrigation was investigated throughout one year (12 trials). The results revealed that the influent water had 211 mg/L total suspended solids, 6.09 mg/L total nitrogen, 36.67 mg/L biochemical oxygen demand, 56 mg/L chemical oxygen demand, 1700 mg/L total dissolved solids, 0.97 mg/L copper (Cu2+), 1.12 mg/L iron (Fe2+), 1.07 mg/L manganese (Mn2+), 1.02 mg/L lead (Pb2+), 1.05 mg/L zinc (Zn2+), and 46 × 103 CFU/mL fecal coliforms. These parameters were higher than the values permitted by Egyptian and international licenses. The range of removal efficiency of these pollutants by ZC was 96–21%, by BC was 99–29.8%, and by DC was 99–19.80%. Regeneration studies for the spent adsorbents demonstrated that the percentages of pollutant removal were sufficiently high. The treated effluent produced by the three columns was suitable for irrigation purposes, especially at a contact time of four hours, with the order for column treatment efficiency being BC ˃ DC ˃ ZC. Treated water was classified for irrigation suitability according to the Agrifood Water Quality Index (AFWQI) as marginal from the ZC, very good from the DC, and excellent from the BC. Treatment of such drainage water using the BC and DC appears feasible, because the process is easily operated and leads to final treated effluent of high quality for agricultural uses. The economic cost also confirms the feasibility of this treatment.

1. Introduction

Water scarcity is one of the major global issues of this century in the light of population growth, agriculture uses, industrial utilization, and climate change. Industrial or domestic wastewater contains numerous pollutants including inorganic and organic compounds, as well as pathogenic microorganisms which are dangerous to humans, animals, and plants. The most efficient wastewater treatment leads to the production of effluent meeting the required quality standards, both at low cost and with minimal operational and maintenance prerequisites. The deficiency of water and increasing demand for clean water have attracted the attention of researchers globally to find cost-effective solutions for the management, purification, and re-use of wastewater.
There are numerous chemical techniques which have been employed in wastewater treatment, such as chemical coagulation [1], Fenton reaction [2], ion exchange [3], precipitation [4], combined ultrasound-ozone [5], ultra-filtration [6], electrochemical techniques [7], adsorption [8,9,10], and packed columns in water treatment applications [11,12] to eliminate trace and heavy elements, micropollutants and other hazardous materials (i.e., biochemical oxygen demand (BOD), chemical oxygen demand (COD), paint, phenol, oil and grease, total suspended solids (TSS), and coliform bacteria) from industrial, municipal and drainage wastewaters, and aqueous media [1]. Among all of the above-mentioned techniques, adsorption in clay minerals is viewed as an especially powerful procedure, particularly regarding the use of low-cost, biodegradable, and environmentally-friendly materials for the removal of pollutants from wastewaters and aqueous solutions [13].
Clay minerals form excellent natural barriers due to their small grain size, specific surface area, high efficiency with high uptake capacity, and their diagenetic processes (which cause high natural density) [14]. In addition, they have the ability to close fissures and cracks (which may form paths for leachates). Moreover, their chemical reactivity enables the immobilization of important contaminants [15,16]. The majority of studies have demonstrated that natural materials can act as good sorbents for toxic materials, including heavy metals [17], while the sorts and accessibility of clay minerals are also significant because they are involved in selecting which contaminants are treated. In this study, we utilized three types of clay minerals (i.e., zeolite, diatomite, and dolomite minerals) to be compared in the treatment of blended wastewater (fresh, brackish, domestic, drainage, and industrial) which have different resources, regarding the fact that this wastewater was referred to the Central Laboratory for Environmental Quality Monitoring (CLEQM) as samples to be analyzed for different parameters. The leftovers from these samples were discharged into CLEQM’s drainage wastewater.
Natural zeolites are hydrated aluminosilicate materials with phenomenal ion-exchange and sorption properties. Zeolite structure consists of three-dimensional frameworks of tetrahedral SiO4 and AlO4 [18]. The interesting three-dimensional porous structure gives natural zeolites distinctive application prospects. Zeolites belong in the group of cationic exchangers due to the abundance of negative charge on their surface, which results from the isomorphic replacement of silicon by aluminum in the primary structural units. The net negative charge is balanced by the exchangeable cation (sodium, potassium, or calcium). The exchangeability of cations with ammonium and heavy metal ions (lead, cadmium, zinc, and manganese) functions in solutions [19]. Later studies of natural zeolites focused on their properties, especially the modification of their structure required for them to be utilized as adsorbents in drinking water and wastewater treatment. Clinoptilolite has been examined concerning 34/137Cs, 90Sr, and ammonium adsorption for the treatment of wastewater [20,21,22,23].
Diatomite (SiO2_nH2O) is a soft, lightweight, pale-colored sedimentary rock formed primarily of silica microfossils from aquatic unicellular algae [24]. A past investigation by Lemonas [25] demonstrated that diatomite is created from a wide assortment of shapes in a structure containing up to 80–90% voids, and has a particle size ranging from 10 to 200 mm. Diatomite has been utilized as a filtration medium for adsorption of both inorganic and organic chemicals because of its specific attributes, namely its low density, highly porous structure and high surface area. The natural and modified structures of diatomite have attracted the attention of researchers as an adsorbent for heavy metals and uranium [26,27].
Bentonite is a natural clay formation at the earth’s surface consisting mainly of montmorillonite, it belongs in the 2:1 smectite clay mineral group. The fundamental structural unit is formed of two tetrahedrally coordinated sheets of silicon ions Si4+ encompassing a sandwiched octahedral coordinated sheet of aluminum ions Al3+. The negative charge on the bentonite clay surface results from isomorphous substitution of the trivalent cation Al3+ for Si4+ in the tetrahedral layer and the divalent cation Mg2+ for Al3+ in the octahedral layer [28]. Bentonite clay can be utilized as a successful adsorbent for many toxic substances and cations in soil, water and air, but it shows a lower affinity towards negative groups (phosphates) because of the absence of reactive adsorption sites for anions in water. Compared with other clay types, it has great sorption properties, and has sorption sites accessible inside its interlayer space as well as on its outer surface and edges [29].
Many studies have investigated the efficiency of zeolite, diatomite, and bentonite in removing metal ions from wastewater [22,23,26,27,29]. However, no applied studies have been conducted so far investigating and comparing pilot-scale bed columns made from the above-mentioned materials for removal of metals from drainage effluent at CLEQM. The objective of this study was therefore to evaluate the results of a new investigation concerning three pilot-scale columns for improving drainage water quality, as well as to determine and compare the efficiency of wastewater pollutant removal and cost-benefit analysis for the three columns involved. Both chemical and physical treatments for the spent adsorbents were carried out, and, finally, the suitability of the treated water samples for irrigation purposes was evaluated.

2. Materials and Method

2.1. Case Study and Sampling

Interventionary studies involving animals or humans, and other studies requiring ethical approval, must list the authority which provided approval and the corresponding ethical approval code. CLEQM is a multidisciplinary organization, an internationally accredited facility, which obtained its accreditation 17,025 from the Canadian Association for Environmental Analytical Laboratories (CALA) from 2004 until 2022. CLEQM receives water resources (fresh, brackish, drainage water, sewage water, industrial wastewater) from various areas throughout Egypt for analyses. The leftover wastewater is treated in CLEQM’s treatment plant before being discharged into the freshwater bodies. We aimed to find an alternative approach to treating wastewater. Hence, wastewater samples were collected from the CLEQM’s drainage wastewater influent of the CLEQM treatment plant. The samples were gathered monthly for a year, January to December 2019. The samples for analysis were collected in polyethylene bottles from every wastewater treatment column. The preservation and analyses of the gathered samples were conducted according to the Standard Methods for the Examination of Water and Wastewater [30].

2.2. Adsorbents Preparation

Natural zeolite was obtained from an Egyptian company (TechnoLab El-Bahaa group). It was crushed using a ball mill device and sieved to obtain an appropriate particle size of less than 0.25 mm to maximize the adsorption capacity. The material obtained was washed with de-ionized water to remove any non-adhesive impurities, then dried at 70 °C for 24 h to remove moisture. A representative sample of diatomite was collected from Gebel Elow El Masakheet in south-western El-Fayoum Governorate, Egypt. The diatomite material was washed with distilled water to remove any non-adhesive impurities, dried in an oven at 80 °C for 24 h to remove any moisture, then stored in a desiccator, and finally crushed to 0.25 mm particle size to be utilized in this study [31]. Natural bentonite purchased from the Masr Company for Mineralization and Bentonite, Burg El-Arab, Egypt, was crushed and sieved to obtain the appropriate particle size 0.25 mm. The material was then activated with 1 M HCl for 24 h, separated from the acid in a Buchner funnel, and washed with de-ionized water until the pH became neutral. Then it was dried in an oven at a temperature of 105 °C for two hours, then calcinated in the oven at 450 °C for 4 h, and finally left to cool in a desiccator [32].

2.3. Adsorbents Characterization

Ground zeolite, diatomite, and bentonite samples were squeezed into pellets for examination and characterization by means of X-ray fluorescence (XRF) utilizing an ARL SMS-Omega XRF instrument to distinguish their elemental composition. An XRD PANalytical X’Pert Pro diffractometer with an angular scanning range of 5–80° and an angular speed of 2 θ/s over a range of 2 to 50, operated at 40 kW and 40 mA, and X’Pert High Score search/match software were utilized for identification and characterization of the minerals. The Brunauer-Emmett-Teller gas adsorption method (BET, HitachiVP-SEM S-3400N, Germany) was utilized to estimate the mineral surface area.

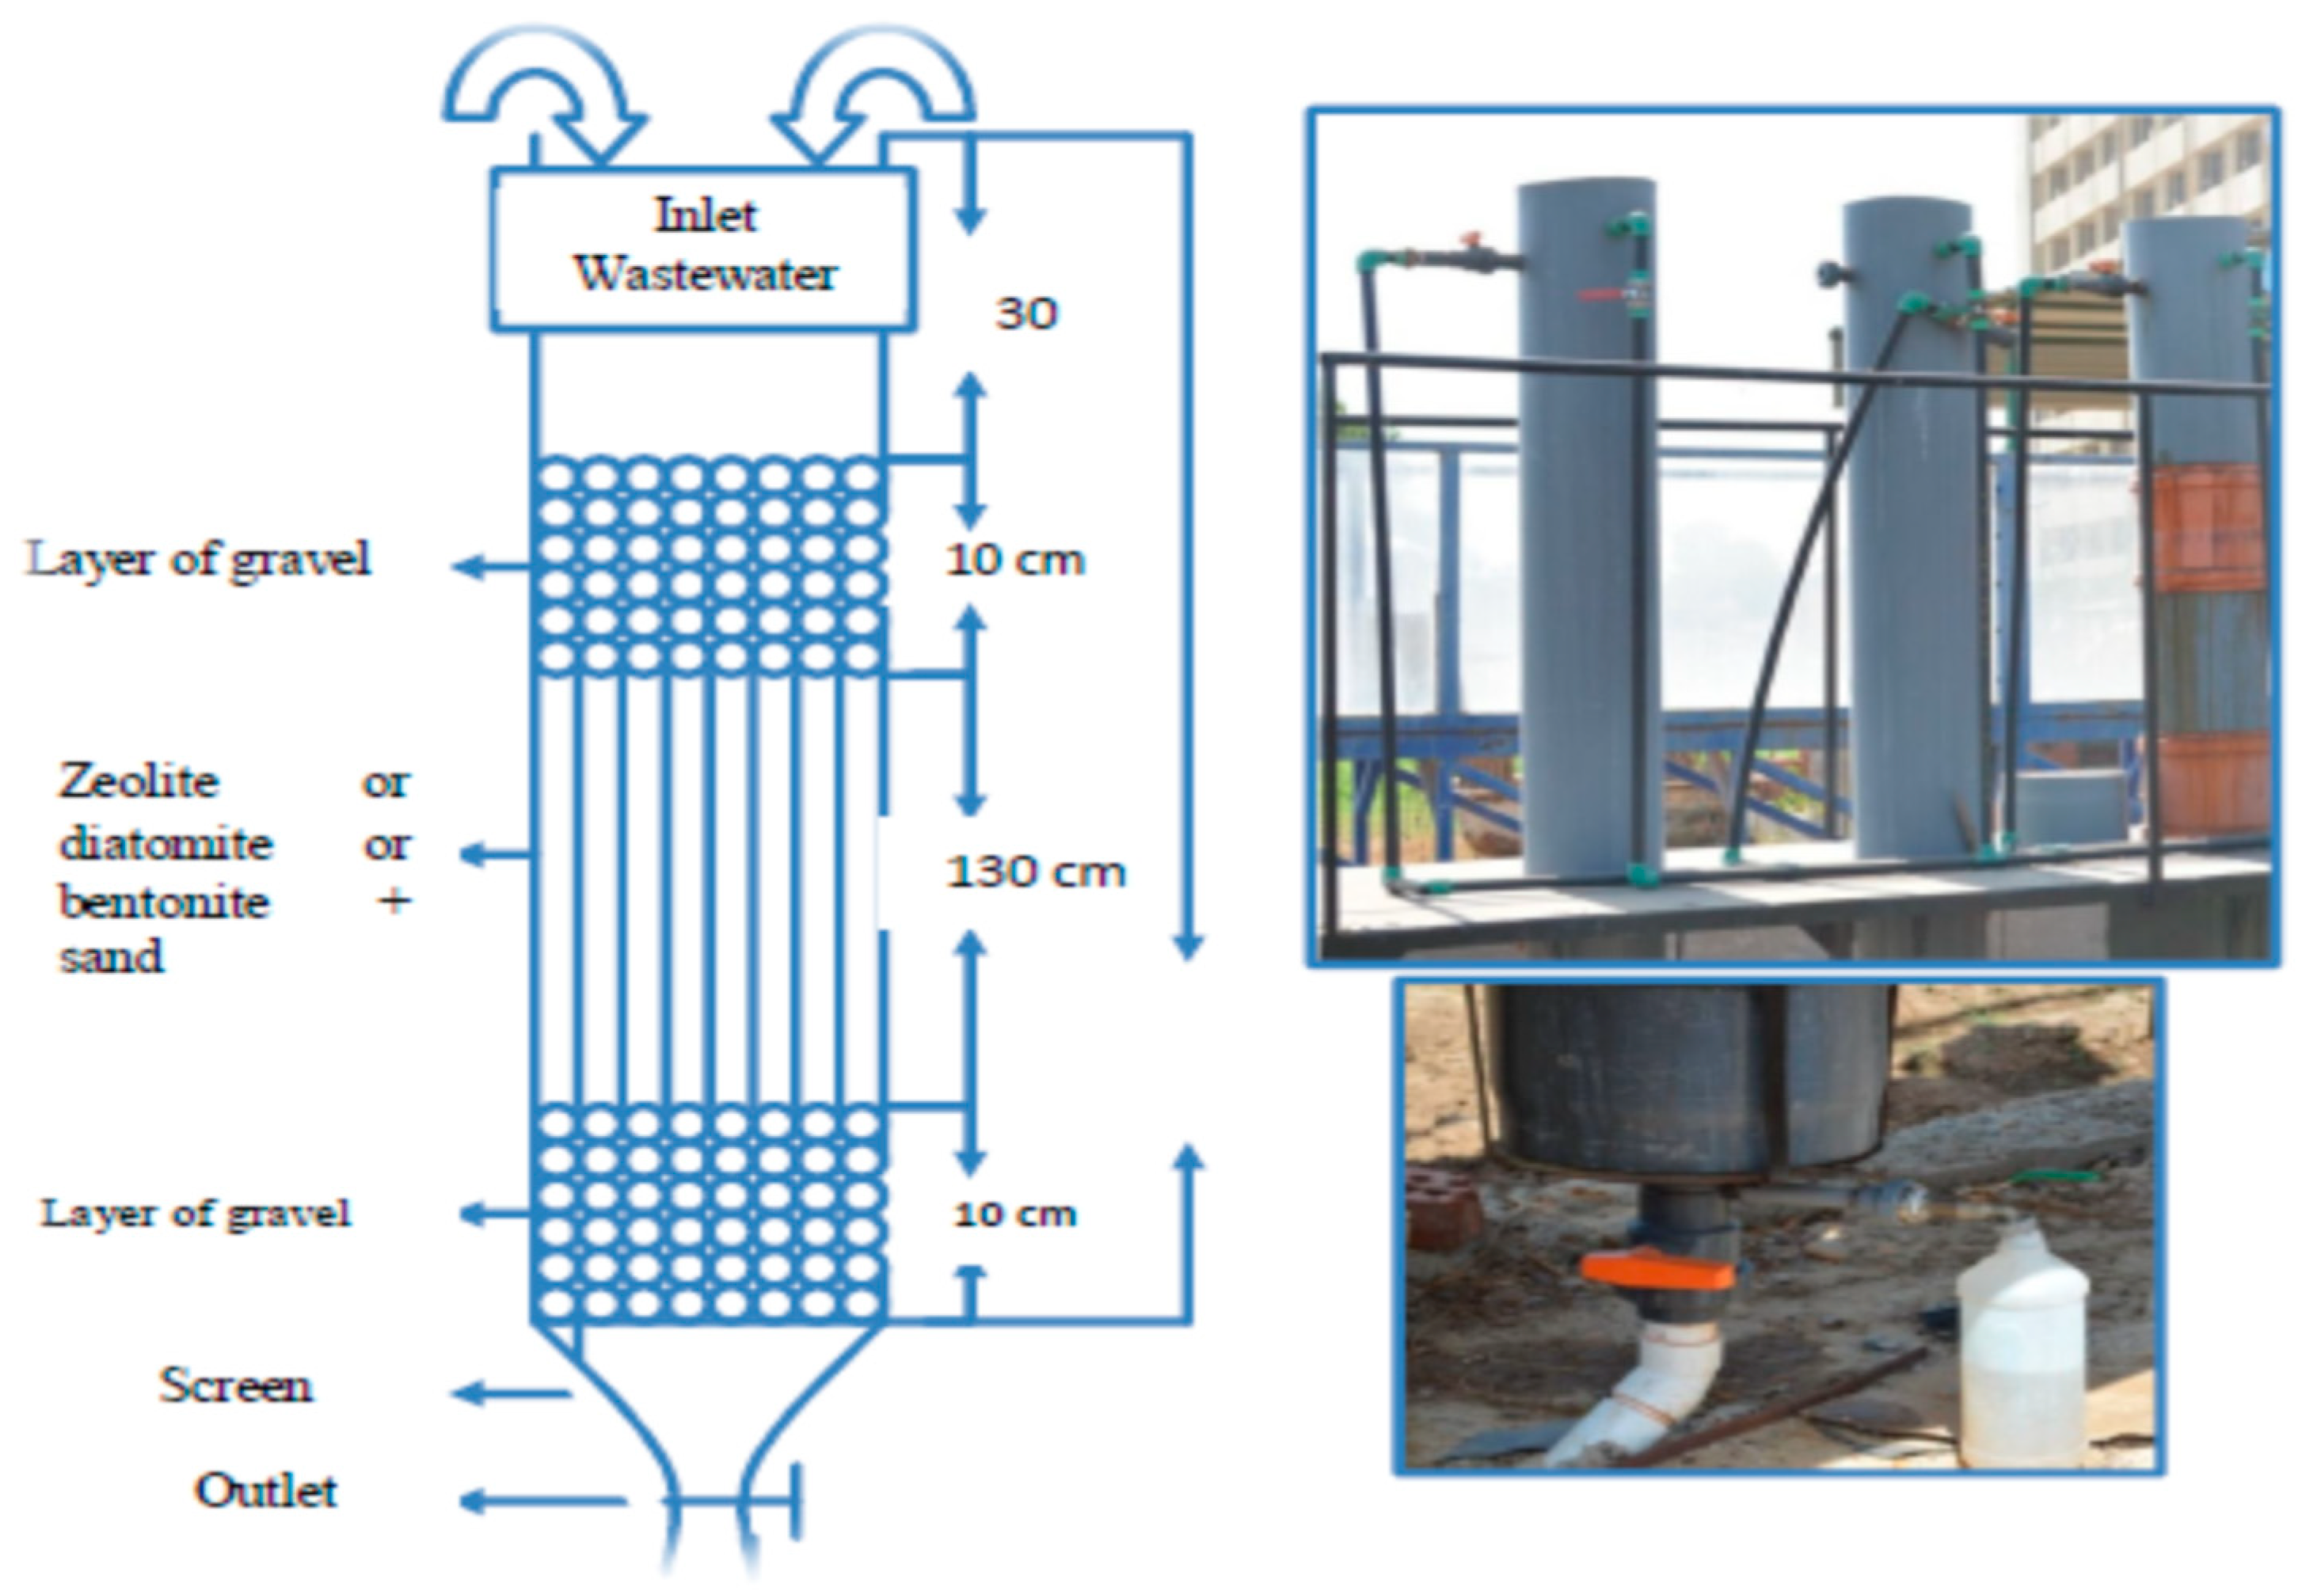
2.4. Experimental Device and Adsorption Methodology

Figure 1 shows the design of the experimental pilot-scale columns used in this study, which consisted of an opaque PVC column, 40 cm in diameter and 180 cm in height. The column was filled with the following materials: the top and the bottom parts were filled with 10 cm of gravel (0.5–1.5 cm). The top gravel layer was intended to remove suspended solids from the wastewater samples to protect the ion exchange beds. The middle of the column (130 cm) was filled with ion exchange beds, composed of sand (4–6 mm) and one of the studied materials for each column with a sand:adsorbent ratio of 1:2. The studied materials were zeolite in the zeolite column (ZC), diatomite in the diatomite column (DC), and bentonite in the bentonite column (BC). The supply of 1.6 m3/day of wastewater was provided sequentially for each column. The wastewater samples from the CLEQM drainage wastewater were passed through a cotton cloth before being loaded into the columns. The drainage wastewater then passed down through the column by gravity flow.
After 1, 2, 3, 4, and 24 h contact time (between the adsorbent and wastewater), the treated effluent samples were collected and analyzed as described in the next section. Finally, all analytical experiments were repeated over 12 months and the mean values were calculated.

2.5. Regeneration of Adsorbents

Recycling or recovery of the spent adsorbents ((zeolite, bentonite and diatomite) + sand) was carried out by means of chemical and physical treatments. The adsorbents were washed gently with 1 M KCl to remove the desorbed metal ions from their surface, then with deionized water to remove any residual KCl. The washed adsorbents were dried at 80 °C, then calcinated in an oven at 550 °C for 4 h, and left to cool in a desiccator. A repeat experiment was carried out for comparison of the original and the regenerated adsorbents with contact time of 4 h.

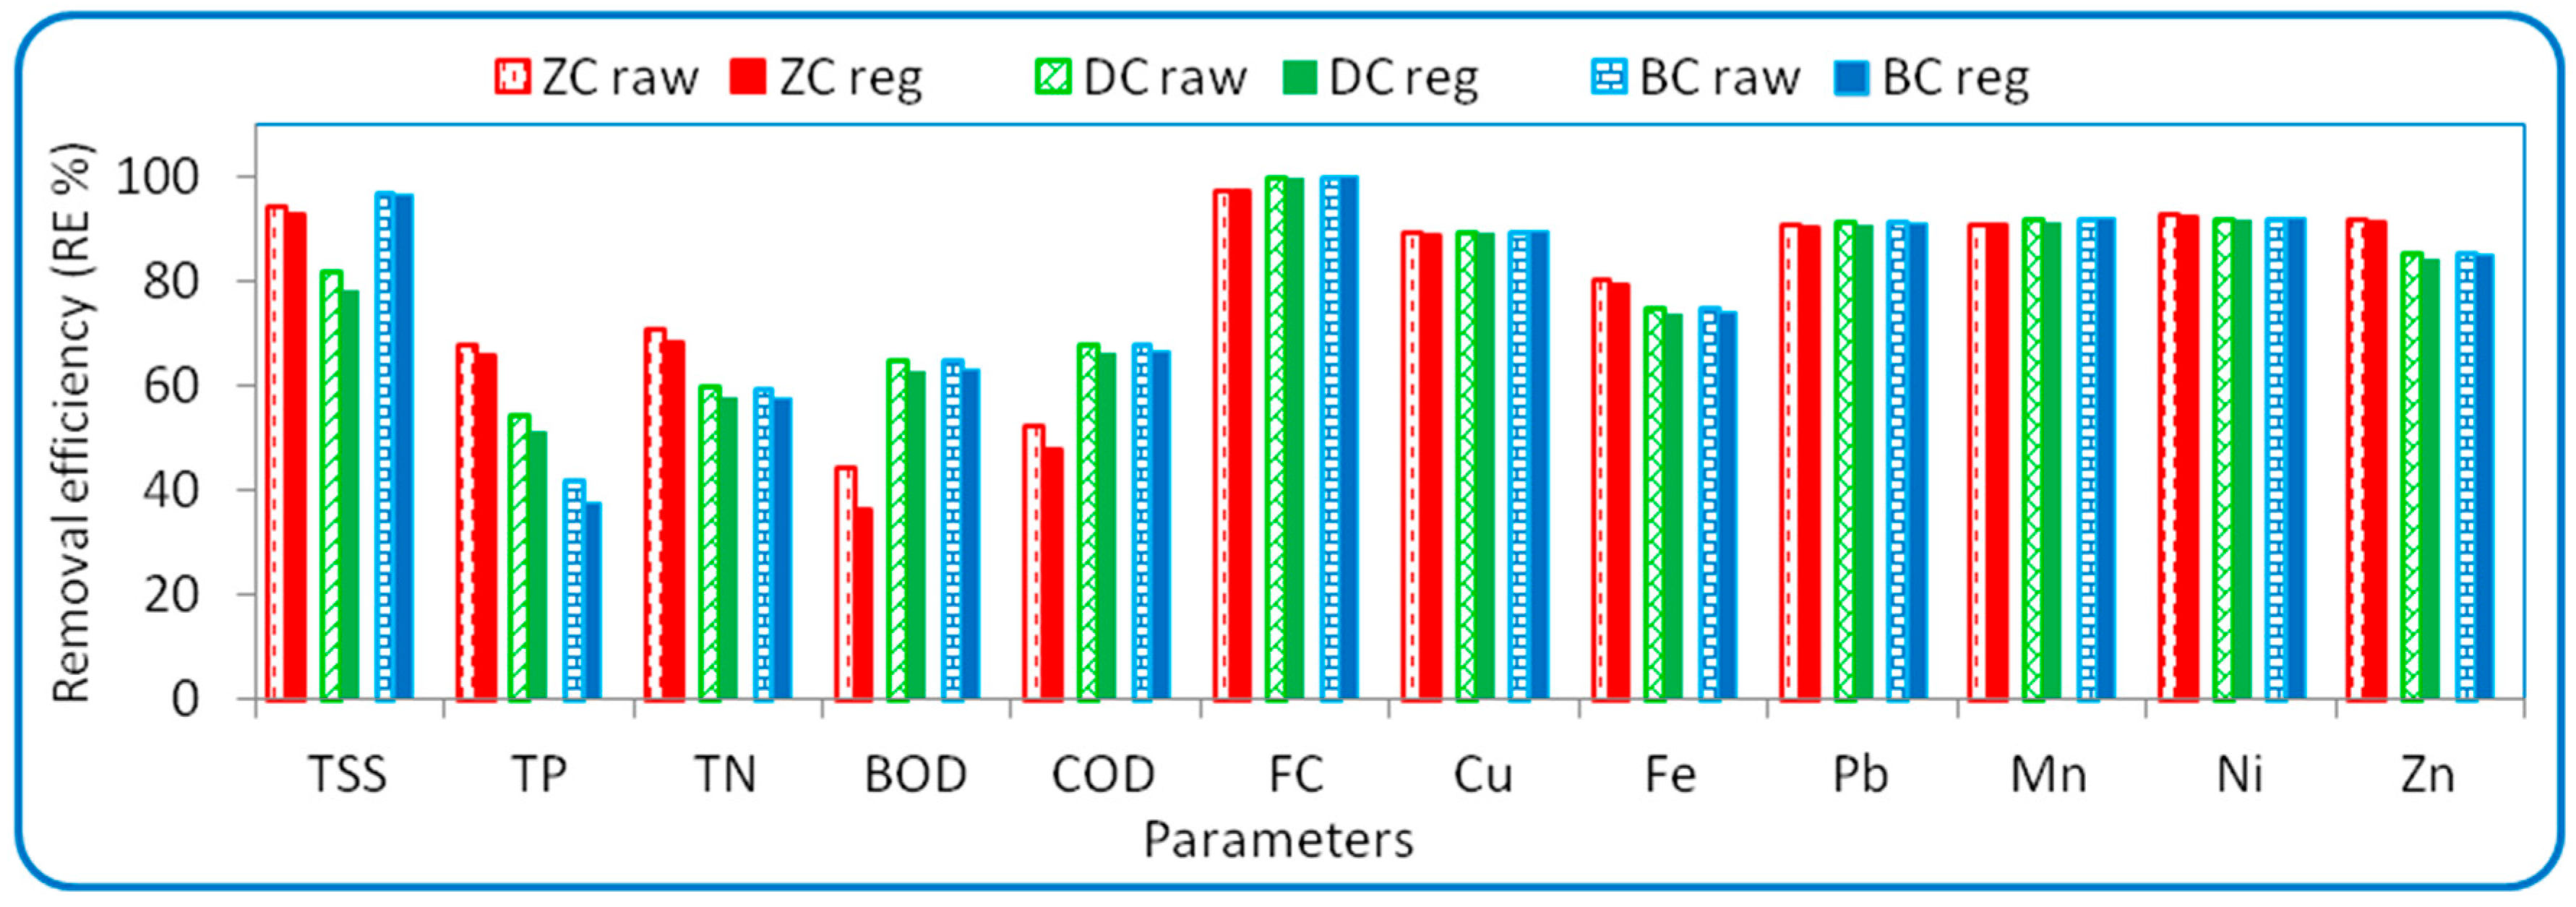
2.6. Removal Efficiency (RE)

The removal efficiency (RE) was calculated using Equation (1) after contact times of 1, 2, 3, 4 and 24 h. The initial (Ci) and final (Cf) concentrations are given in mg/L [2,9].
Removal   efficiency     ( RE   % ) = [ ( Ci     Cf ) Ci ]   ×   100     in   mg / L

2.7. Laboratory Analyses for Water Samples

For water analyses, the raw wastewater and treated water were evaluated by monitoring typical quality parameters (TSS, TN, TP, BOD, COD, Copper (Cu), Iron (Fe), Lead (Pb), manganese (Mn), zinc (Zn), and fecal coliforms) to estimate their removal efficiency. The following physicochemical characteristics were examined according to standard strategies for testing freshwater and wastewater [30]. Total suspended salt (TSS) was determined gravimetrically by filtering a known volume of water through a 0.45 µm filter paper and noting the increase in weight of the filter paper after heating to dryness at 103–105 °C. Total nitrogen (TN) concentration was analyzed by utilizing the Kjeldahl method, while the colorimetric method was used for estimation of total phosphorus (TP) after acid digestion of the sample and extraction of neutralized digest with deionized water [33]. Chloride (Cl), sulfate (SO42−), phosphate (PO43−), and nitrate (NO3) were measured using ion chromatography (IC) on a Dionex model DX5000 device. Calcium (Ca2+), potassium (K+), magnesium (Mg2+), sodium (Na+), and heavy and trace metals (Cu2+, Fe2+, Pb2+, Mn2+, and Zn2+) were estimated in water by means of inductively-coupled plasma-optical emission spectrometry (ICP-OES) using a Dual View 5300DV instrument.
Biological oxygen demand (BOD) was estimated using a BOD fast respirometry system model TS606/2 with 20 °C incubation in a thermostatic incubator chamber model WTW for five days. A Hach-DR-2010 spectrophotometer was used for the determination of chemical oxygen demand (COD) calorimetrically. A block heater COD reactor (150 ± 2 °C) was used for oxidation of organic carbon.
For bacteriological analyses, the raw wastewater and treated water samples were examined over a period of six hours following gathering and treatment, respectively. Fecal coliform enumeration was done using a membrane filter procedure using a filtration system ending with a stainless-steel autoclavable manifold and an “oil-free” vacuum/pressure pump. The filtration of samples was done through a sterile membrane (diameter of 47 mm and a pore size of 0.45 μm). The data were recorded as colony-forming units (CFU/100 mL) using the accompanying equation:
Colonies 100 mL = Counted   colonies mL   of   sample   filtered   ×   100

2.8. Statistical Analysis

All statistical procedures were done with the IBM SAS ver. 20 statistical package (SAS Institute, Cary, NC, USA). The three experiments were repeated regularly for 12 months during the year 2019. The data were analyzed and exhibited as min, max, and mean ± SD (standard deviation).

3. Results and Discussions

Samples gathered from CLEQM’s drainage wastewater were analyzed in triplicate and the mean values and standard deviations were ascertained for the examined parameters. The results of statistical analyses of the chemical and microbiological variables in the samples are presented in Table 1. The composition and XRD patterns of natural clay are exhibited in Figure 2 and Figure 3. The results of the water treatment are given in Figure 4 and Table 2. The outcome of clay regeneration is shown in Figure 5, and the Agrifood Water Quality Index (AFWQI 1.0) values are presented in Figure 6.

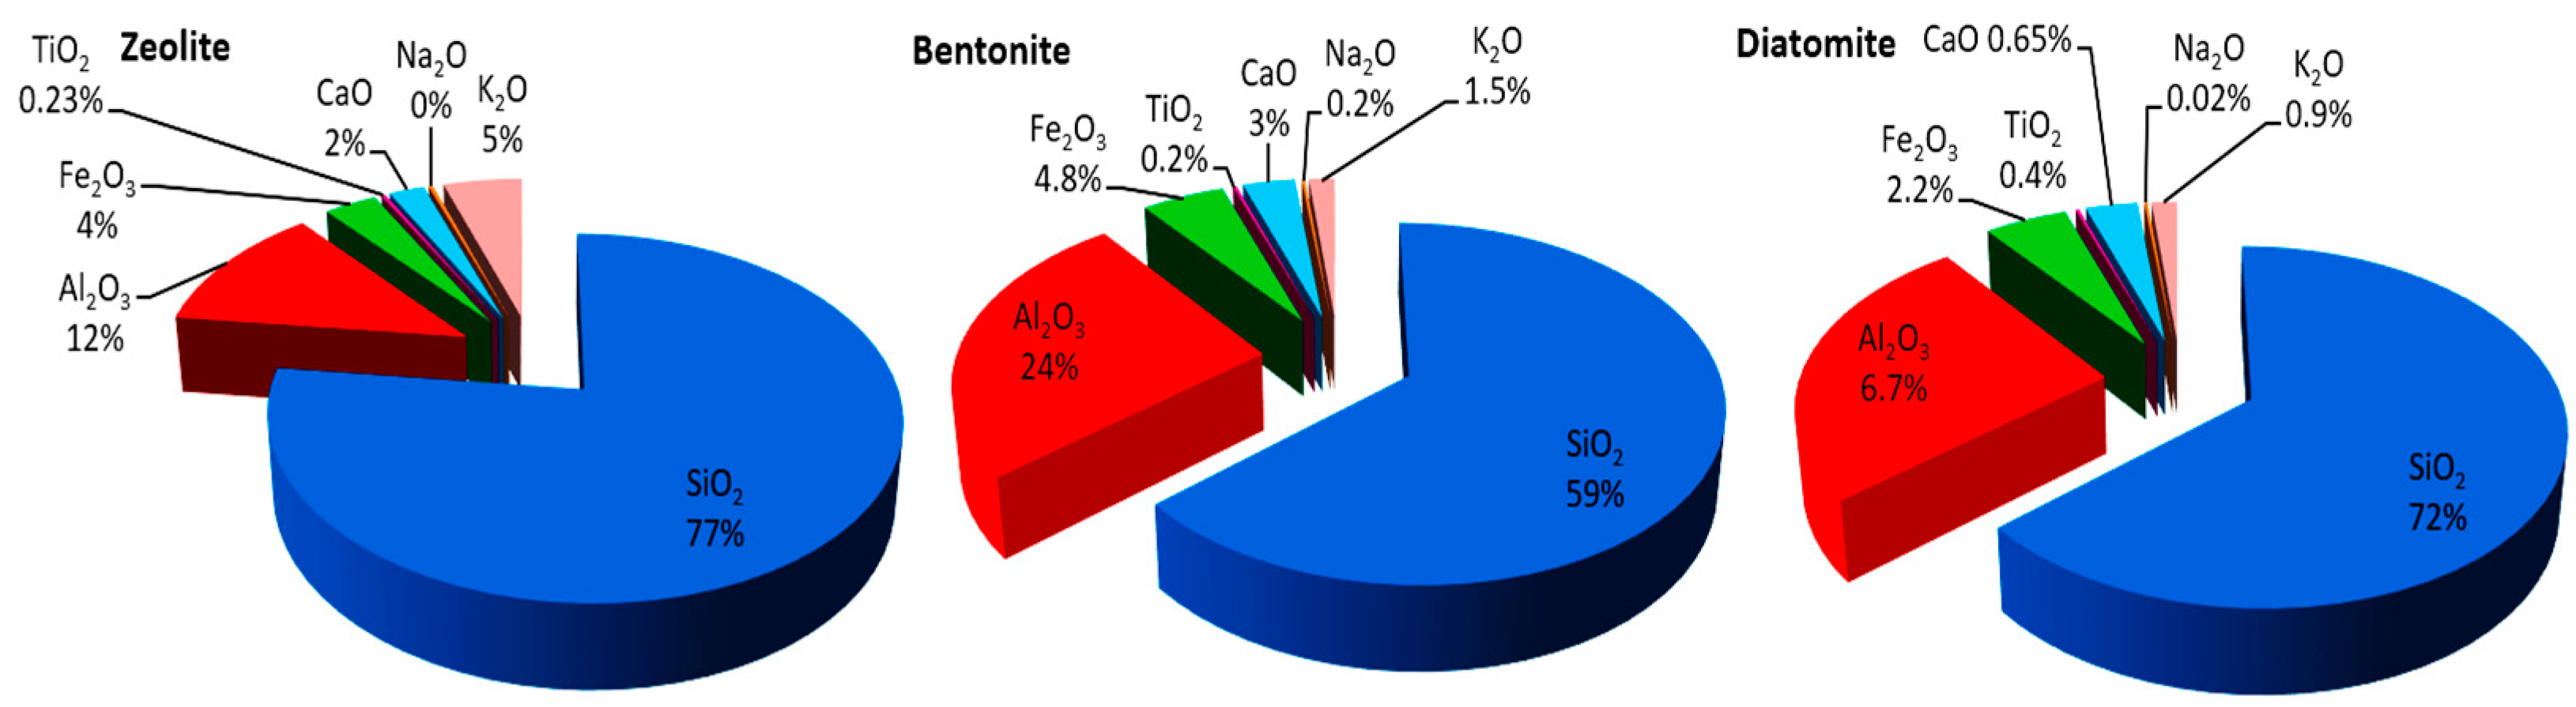
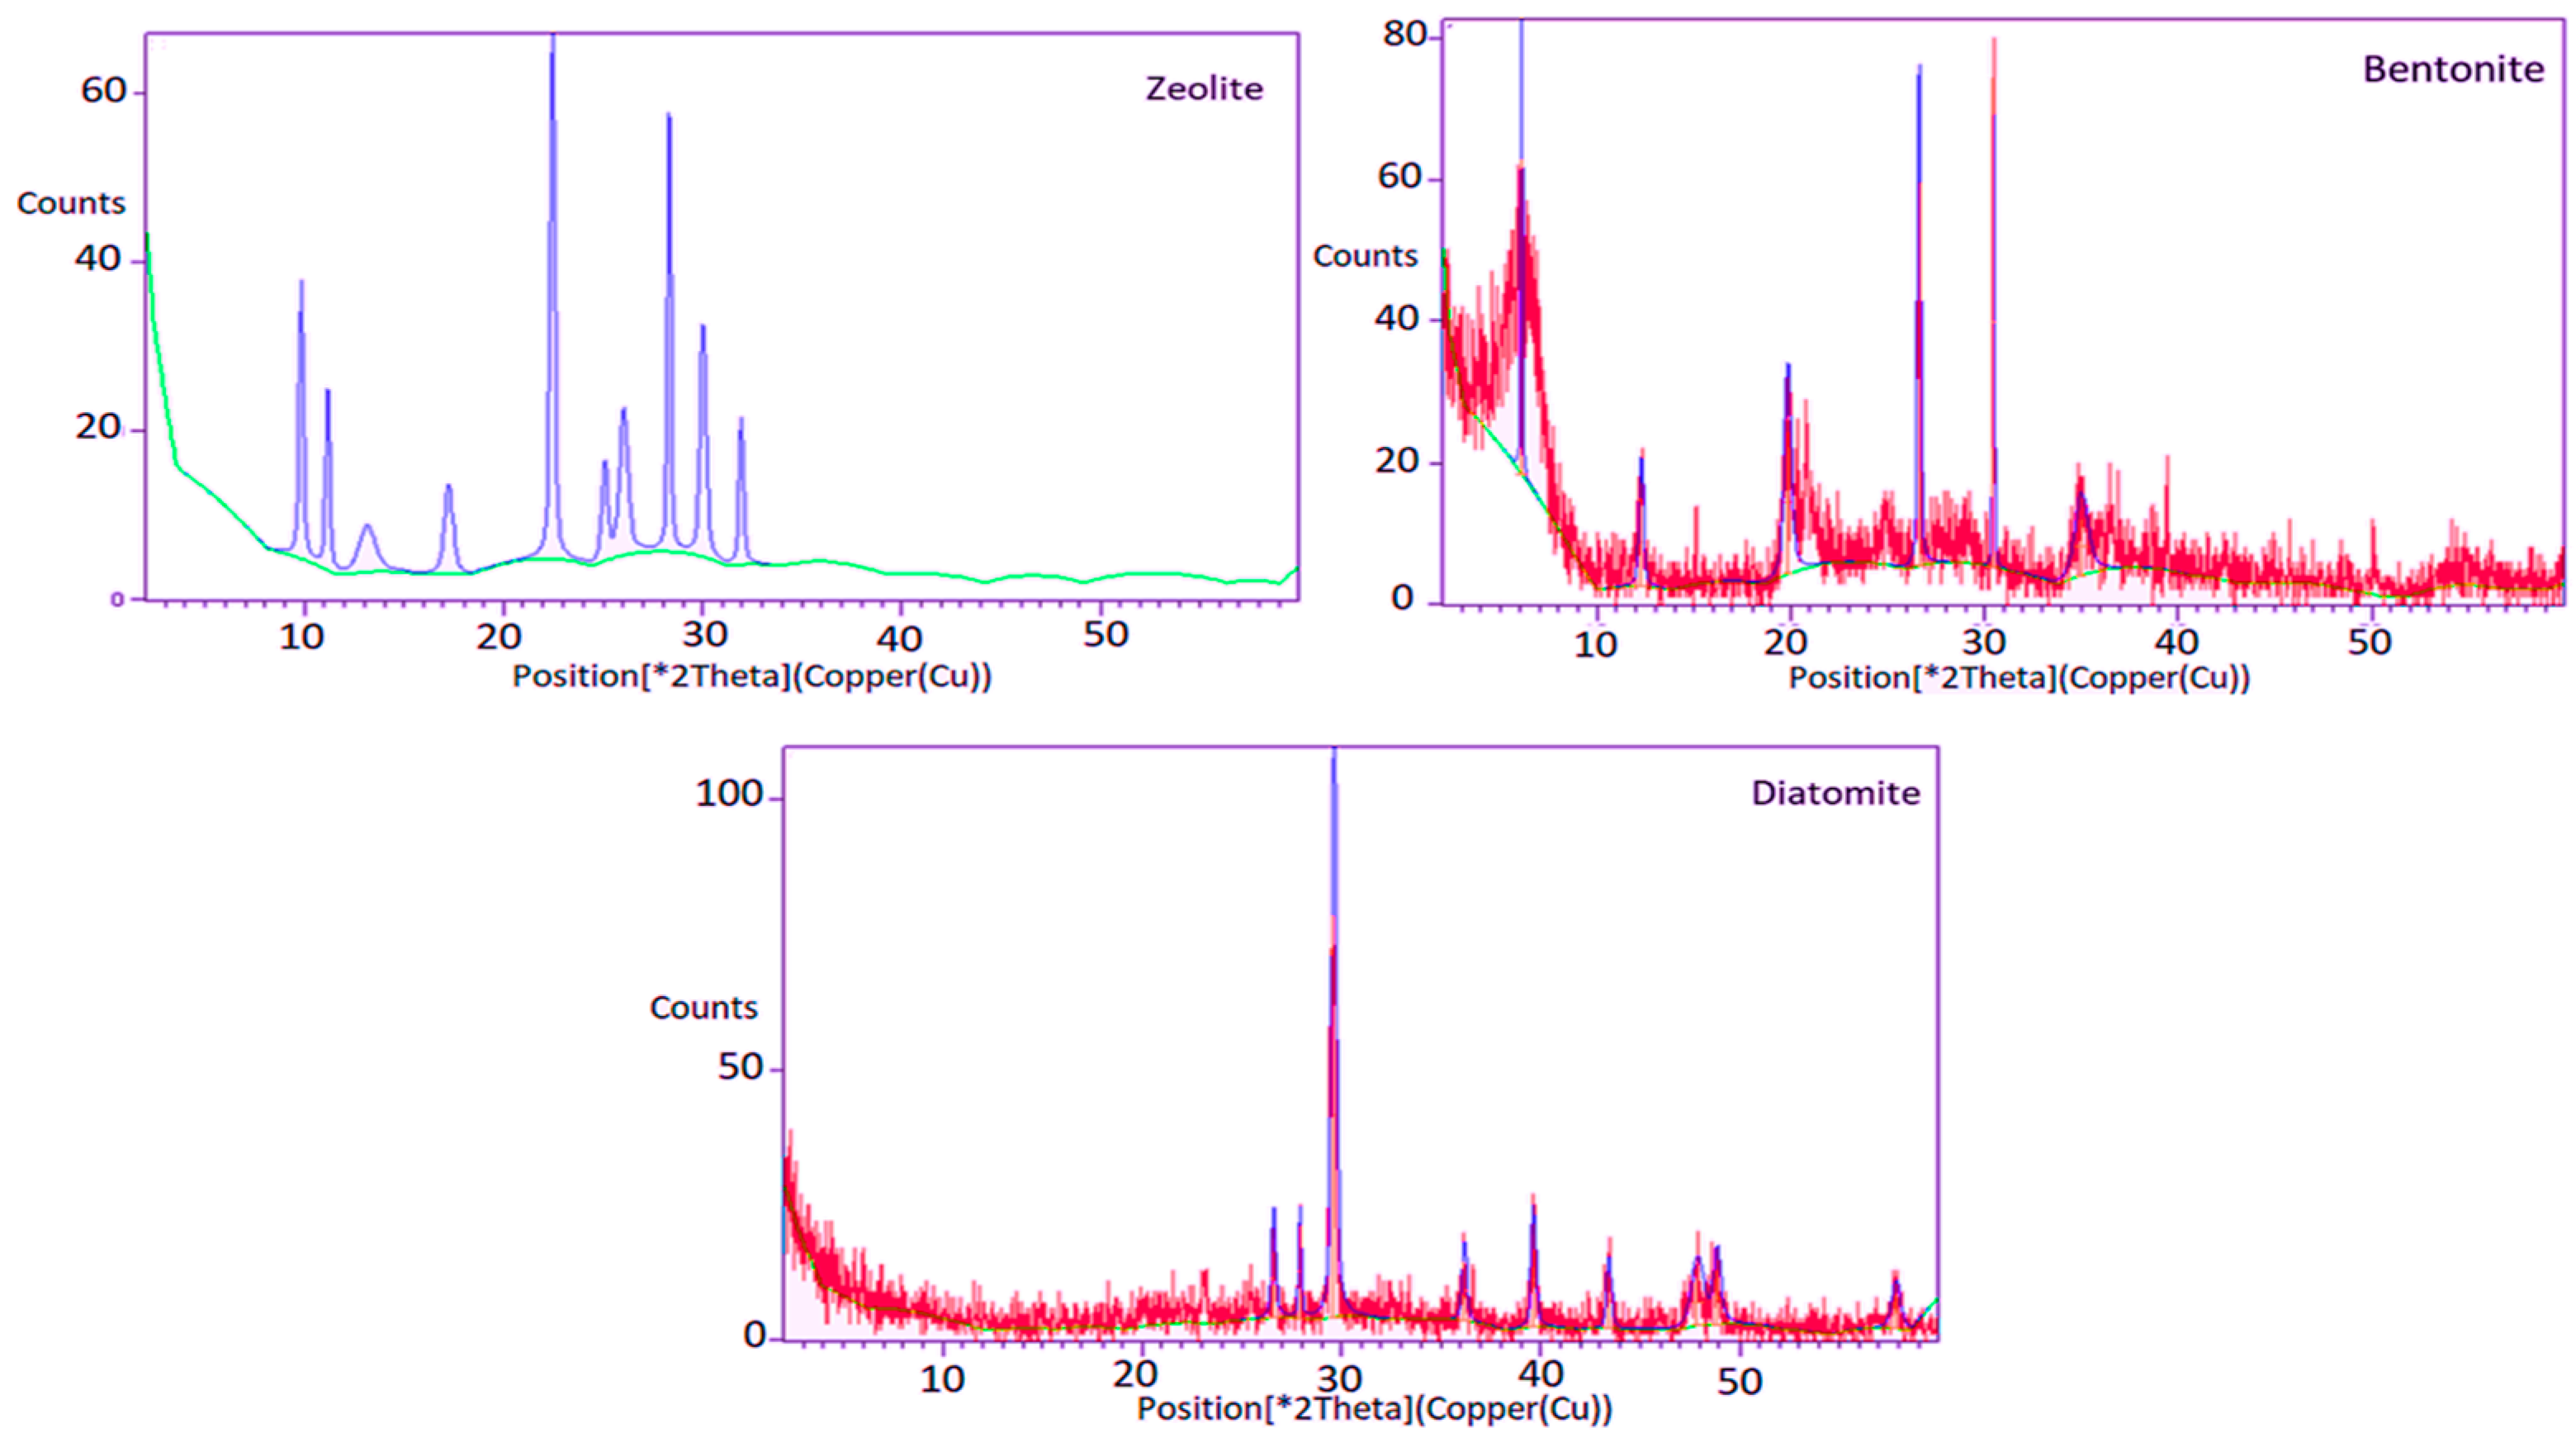
3.1. Characterizations of Natural Adsorbents

The chemical composition of natural zeolite, bentonite, and diatomite plays an important role in the removal of metals from wastewater, as outlined in Figure 2. The characterization of zeolite using X-ray diffraction indicates that the zeolite investigated in the present study was predominantly clinoptilite-Na, with the chemical formula Na7.19Si27.12Al8.89O97.92 (Figure 3). The bentonite utilized in this work was dominated by quartz (Si3O6), montmorillonite (Si7.8Al11.71Li0.15 Fe0.21Mg0.29O20), kaolinite (Al2Si2O9H4), and dolomite (Ca3Mg3C6O18) (Figure 3). The diatomite contained calcite (Ca5.62Mg0.38C6O18), quartz (Si3O6), and sodian anorthite (Na1.92Ca2.08Si10Al6O32). These outcomes of XRF analysis are in line with those reported by Li et al., (2017), who demonstrated that diatomite was composed mainly of SiO2 with percentages ranging from 62.8% to 90.1%. The surface areas of zeolite, bentonite and diatomite are 365, 550, 28 m2/g, respectively.

3.2. Characteristics of Wastewater

The outcome of CLEQM drainage wastewater quality analysis appears in Table 1. The raw effluent characteristics were assessed on the basis of Ministry of Irrigation and Water Resources Law no. 48/1982, enacted via decision no. 92, 2013; article 50 sets the guidelines which must be applied in the treatment of industrial wastewaters before they are emitted into freshwater bodies [34]. The results confirmed that the raw wastewater contained amounts of TSS, TN, BOD, COD, total Coliforms (TC), iron (Fe), manganese (Mn), lead (Pb), zinc (Zn), and TDS higher than those permitted by Egyptian license (see Table 1). Based on FAO [35] and WHO [36] regulations, the raw effluents from CLEQM are not suitable for irrigation use due to their high concentrations of manganese and fecal coliforms.

3.3. Characterizations of Natural Adsorbents

Zeolite, diatomite, and bentonite are selective scavengers of various trace elements and cations which can be removed from liquid effluents through the process of ion exchange. Ion exchange is another method used successfully in industry for the removal of heavy metals from effluent. An ion exchanger is a solid capable of exchanging either cations or anions from the surrounding materials.
This study found that filtering with zeolite, diatomite, and bentonite offers a versatile and environmentally friendly option for capturing most contaminants in wastewater. Diatomite has unique properties due to the presence of calcite in its composition, which sorbs materials by forming metal hydroxide or metal carbonate [37]. The structures of bentonite are composed of quartz and montmorillonite. Quartz mineral has a hexagonal crystal structure made of trigonal crystallized silica (silicon dioxide, SiO2), while montmorillonite is a mineral containing compounds of Al2O3 and 4Si·H2O. Quartz structure possesses unique physicochemical characteristics, so it can also be used as a sorbent substance [38]. The outcomes indicate that passing wastewater gathered from CLEQM drainage wastewater through three columns filled with successive materials (gravel, clay and gravel) is an efficient treatment method for wastewater and decreases concentrations of pollutants, i.e., TSS, TN, BOD, COD, total Coliforms (TC), iron (Fe), manganese (Mn), lead (Pb), Zinc (Zn), TDS, and fluoride (F-) due to the high sorption capacity of the clay materials used.
Regarding total suspended solids abatement, TSS were substantially reduced after percolation through the three columns. Figure 4 shows significant reduction in TSS as the time of exposure increases from 1 to 24 h for the three columns, and it varies between 5% and 97% for the ZC, 20 to 88% for the DC and from 79 to 97% for the BC. One of the interesting physico-chemical characteristics of gravels is their large surface area, which contributed by serving as primary barriers to suspended solids in the aqueous medium. The results also demonstrate that the BC and ZC achieved excellent reduction in TSS, much better than the DC with the same contact times. This could be explained in terms of the larger surface area of B and Z compared with D, as summarized in Section 3.2.
Regarding total phosphorus (TP) abatement, the results reveal that the efficiency of its removal increased with increasing contact time, as depicted in Figure 4. At 4 and 24 h, the removal efficiency showed a slight increase in comparison with the first contact period of 1, 2, and 3 h, because pollutants formed a layer on the surface which prevented more adsorption to the ZC, BC, and DC. The relative efficiencies appeared as the ZC > DC > BC for TP removal.
Regarding total nitrogen (TN) abatement, the results in Figure 4 show that the highest removal efficiency for TN was achieved by the DC at 1 h, and then it decreased until it became constant between 4 and 24 h. The adsorption capacity increased rapidly at the beginning of the study, but it slowed in the latter stages until it reached equilibrium because pollutants formed a layer on the surface, which prevented more adsorption to the DC. BC showed slightly more stable adsorption at all contact times. While the ZC demonstrated higher constant adsorption after 2, 3 and 4 h, its recovery took more time.
Regarding TDS abatement, the removal efficiency for TDS improved as the contact time increased by 21, 19.8 and 29.8% for the ZC, DC and BC, respectively. The removal efficiency of salts depends on the ion-exchange process due to their net negative charge present on the surface, which is balanced by the exchangeable cation (sodium, potassium, magnesium or calcium). Indeed, the adsorption of cations (sodium, potassium, magnesium or calcium) proceeded well on the negatively-charged surfaces of Z, B, and D. The BC was considered most effective for mitigation of TDS compared with the others, the ZC and DC. The low reduction of TDS by zeolite is in line with the results obtained by Rezvantalab and Bahadori [39]. The outcomes of BC treatment were worse than those obtained by Al-Essa [33], who found that activated bentonite reduced TDS by 71%, which reflects the conditions of that experiment, the ratio of activated bentonite to water in the column, and the time of contact. According to Jarboui et al. [40] the reduction in TDS is explained by the ionic absorption phenomenon after its migration through the column filled with soil (clay and sand).
Regarding BOD and COD abatement, our analysis of the dissolved BOD and COD revealed that the organic matter content in the wastewater samples collected from CLEQM drainage wastewater decreased appreciably after their passage through the three columns. Both BOD and COD underwent the same manner of removal by ZC, DC, and BC. BOD decreased from 36.7 to 19.2, 12.8, 12.9 mg/L, while COD concentration decreased from 58 to 23, 19, 19 mg/L by ZC, DC and BC, respectively, after 24 h of treatment. The outcomes presented in Figure 4 show that about 60%, 65%, and 65% of total COD were removed after a contact time of 24 h, while for BOD it was 57%, 61%, and 61% for the ZC, DC, and BC, respectively. Both the DC and BC showed higher efficiency for BOD and COD removal than the ZC. The elimination of BOD and COD depends on physical phenomena, including sedimentation and filtration of particulate forms. The removal efficiency varies due to differences in adsorbent mass which may impact the adsorption suspension. A larger mass of adsorbent can adsorb larger amounts of BOD and COD due to the availability of more surface area at the adsorbent and sorption sites [41,42]. These results are lower than those from the previous study conducted by Oladoja et al. [43], who carried out a pilot study using fortified clay soil to treat wastewater from three different industrial sources (a brewery, natural rubber processing factory, and a textile factory) by means of single column treatment, in which 80% COD removal was recorded. Moreover, they were in line with Al-Essa [33], who recorded 80% COD removal by a bentonite column. This was explained by the nature of the materials and the composition used for the preparation of the three columns. However, Santi et al. (2008) observed a relatively slight reduction in COD (37%) during the treatment of wastewater with soil as adsorbent. On the other hand, Patel and Vashi [44] found that zeolite was more effective in the removal of COD and BOD than bentonite, Fuller’s earth, or china-clay materials.
Regarding trace element abatement, our results reveal that the efficiency of removal increased with increasing contact times for the ZC, DC and BC, as depicted in Figure 4. The values for trace elements demonstrate that copper, lead and manganese underwent the same manner of removal in the three columns. Adsorption of heavy or trace elements by zeolite decreased in the order Zn > Mn > Pb > Cu > Fe, while for diatomite and bentonite the order was Mn > Pb > Cu > Zn > Fe. The three columns were able to reduce the concentrations to less than the standard license values. The removal of metal ions by each of the studied column depended on the affinity of metal ions to the column type and the ionic strength of the solution, as well as increased competition for sorbing sites in the columns.
A significantly higher removal efficiency for fecal coliforms by ZC, BC and DC is shown in Figure 4. The removal of bacteria occurred through mechanical trapping and adsorption [45]. Mechanical trapping took place through surface filtration, whereby particles that were too large to pass through the pores were trapped at the top of the column. The adsorption occurred through physical trapping after deeper penetration into the sand bed [46].
Finally, the outcomes of the treatment process demonstrate that the bentonite column (BC) was able to remove TSS, TN, BOD, COD, total coliforms (TC), iron (Fe), manganese (Mn), lead (Pb), Zinc (Zn), and TDS from CLEQM’s raw wastewater to within the range of the Egyptian license values [34].

3.4. Regeneration of Spent Adsorbent Materials

The most significant issue in wastewater treatment is the regeneration of spent adsorbent materials. Regeneration is an alternative to disposal for the spent adsorbent, as it removes the contaminant from the spent material after repeated reuse of the adsorbent in the treatment. In this investigation, after 12 monthly trials, we utilized KCl, de-ionized water, and 450 °C for calcination of the cleaned adsorbent material for 4 h. After that, the experimental columns were reconstructed to compare their efficiency before and after calcination. The outcomes demonstrate that the removal efficiencies for the ZC, BC, and DC were reduced by an average of 2%, 1.1%, and 1.5%, respectively, after regeneration (Figure 5).

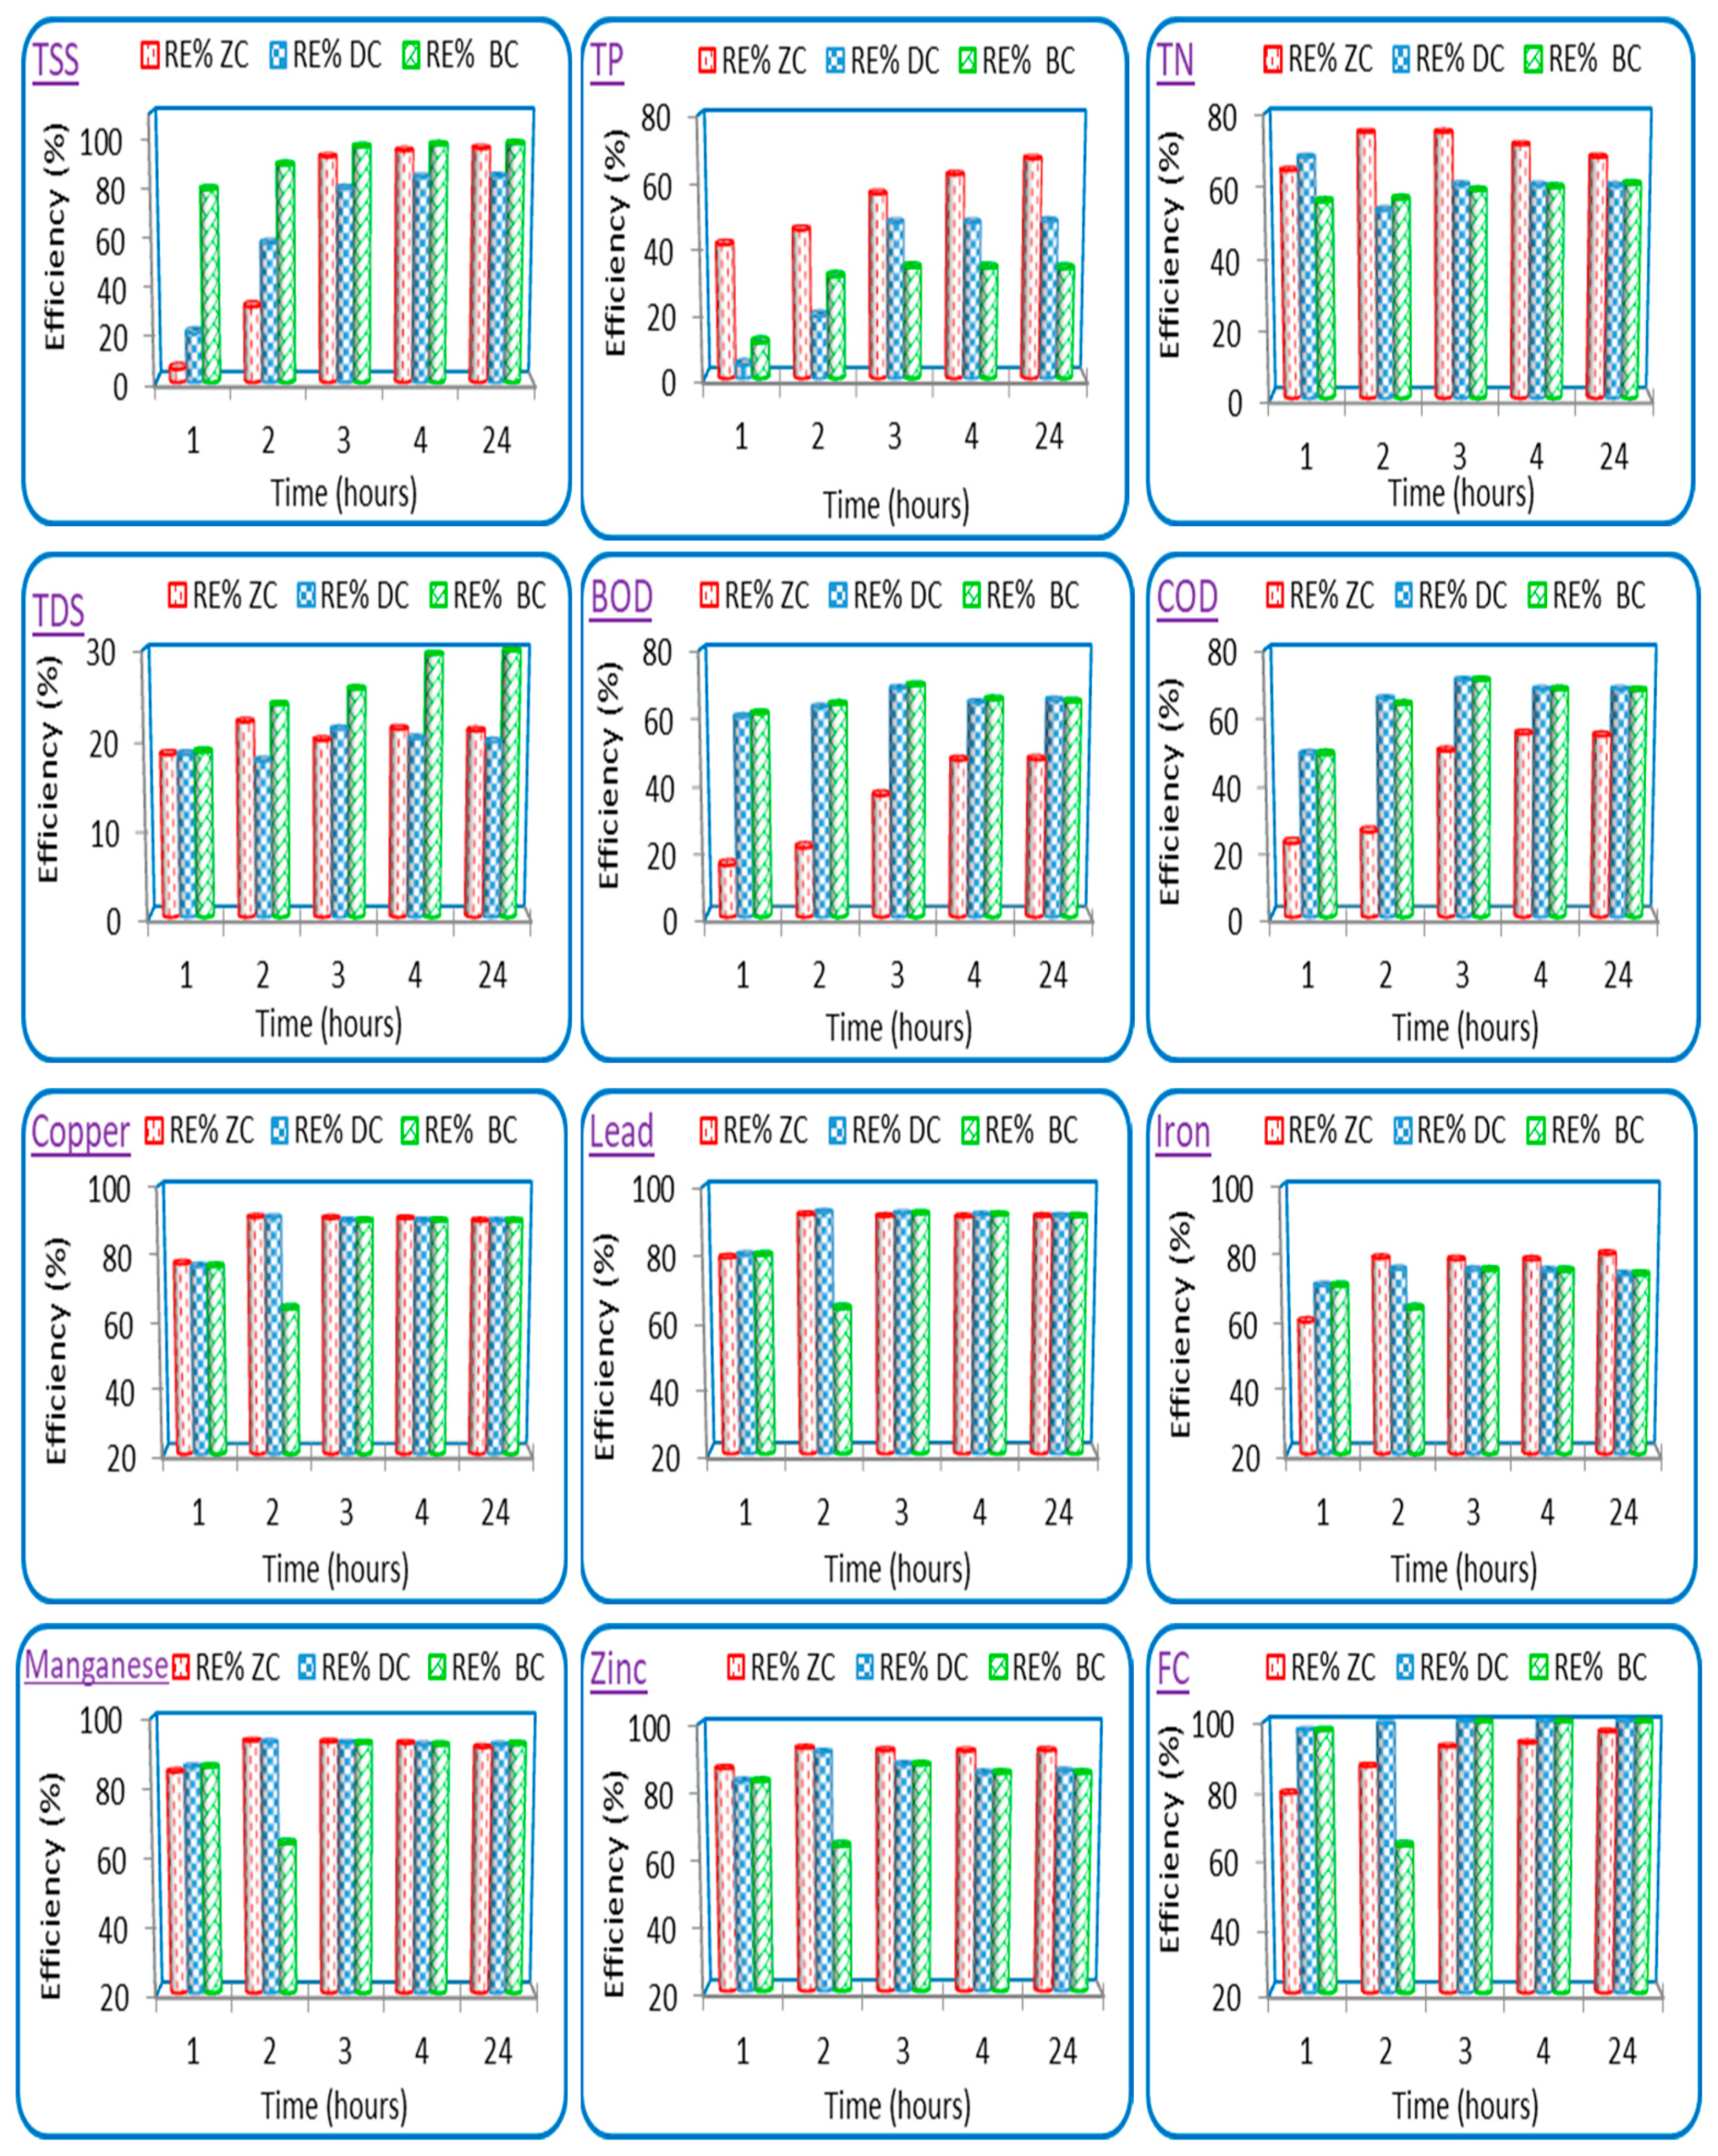
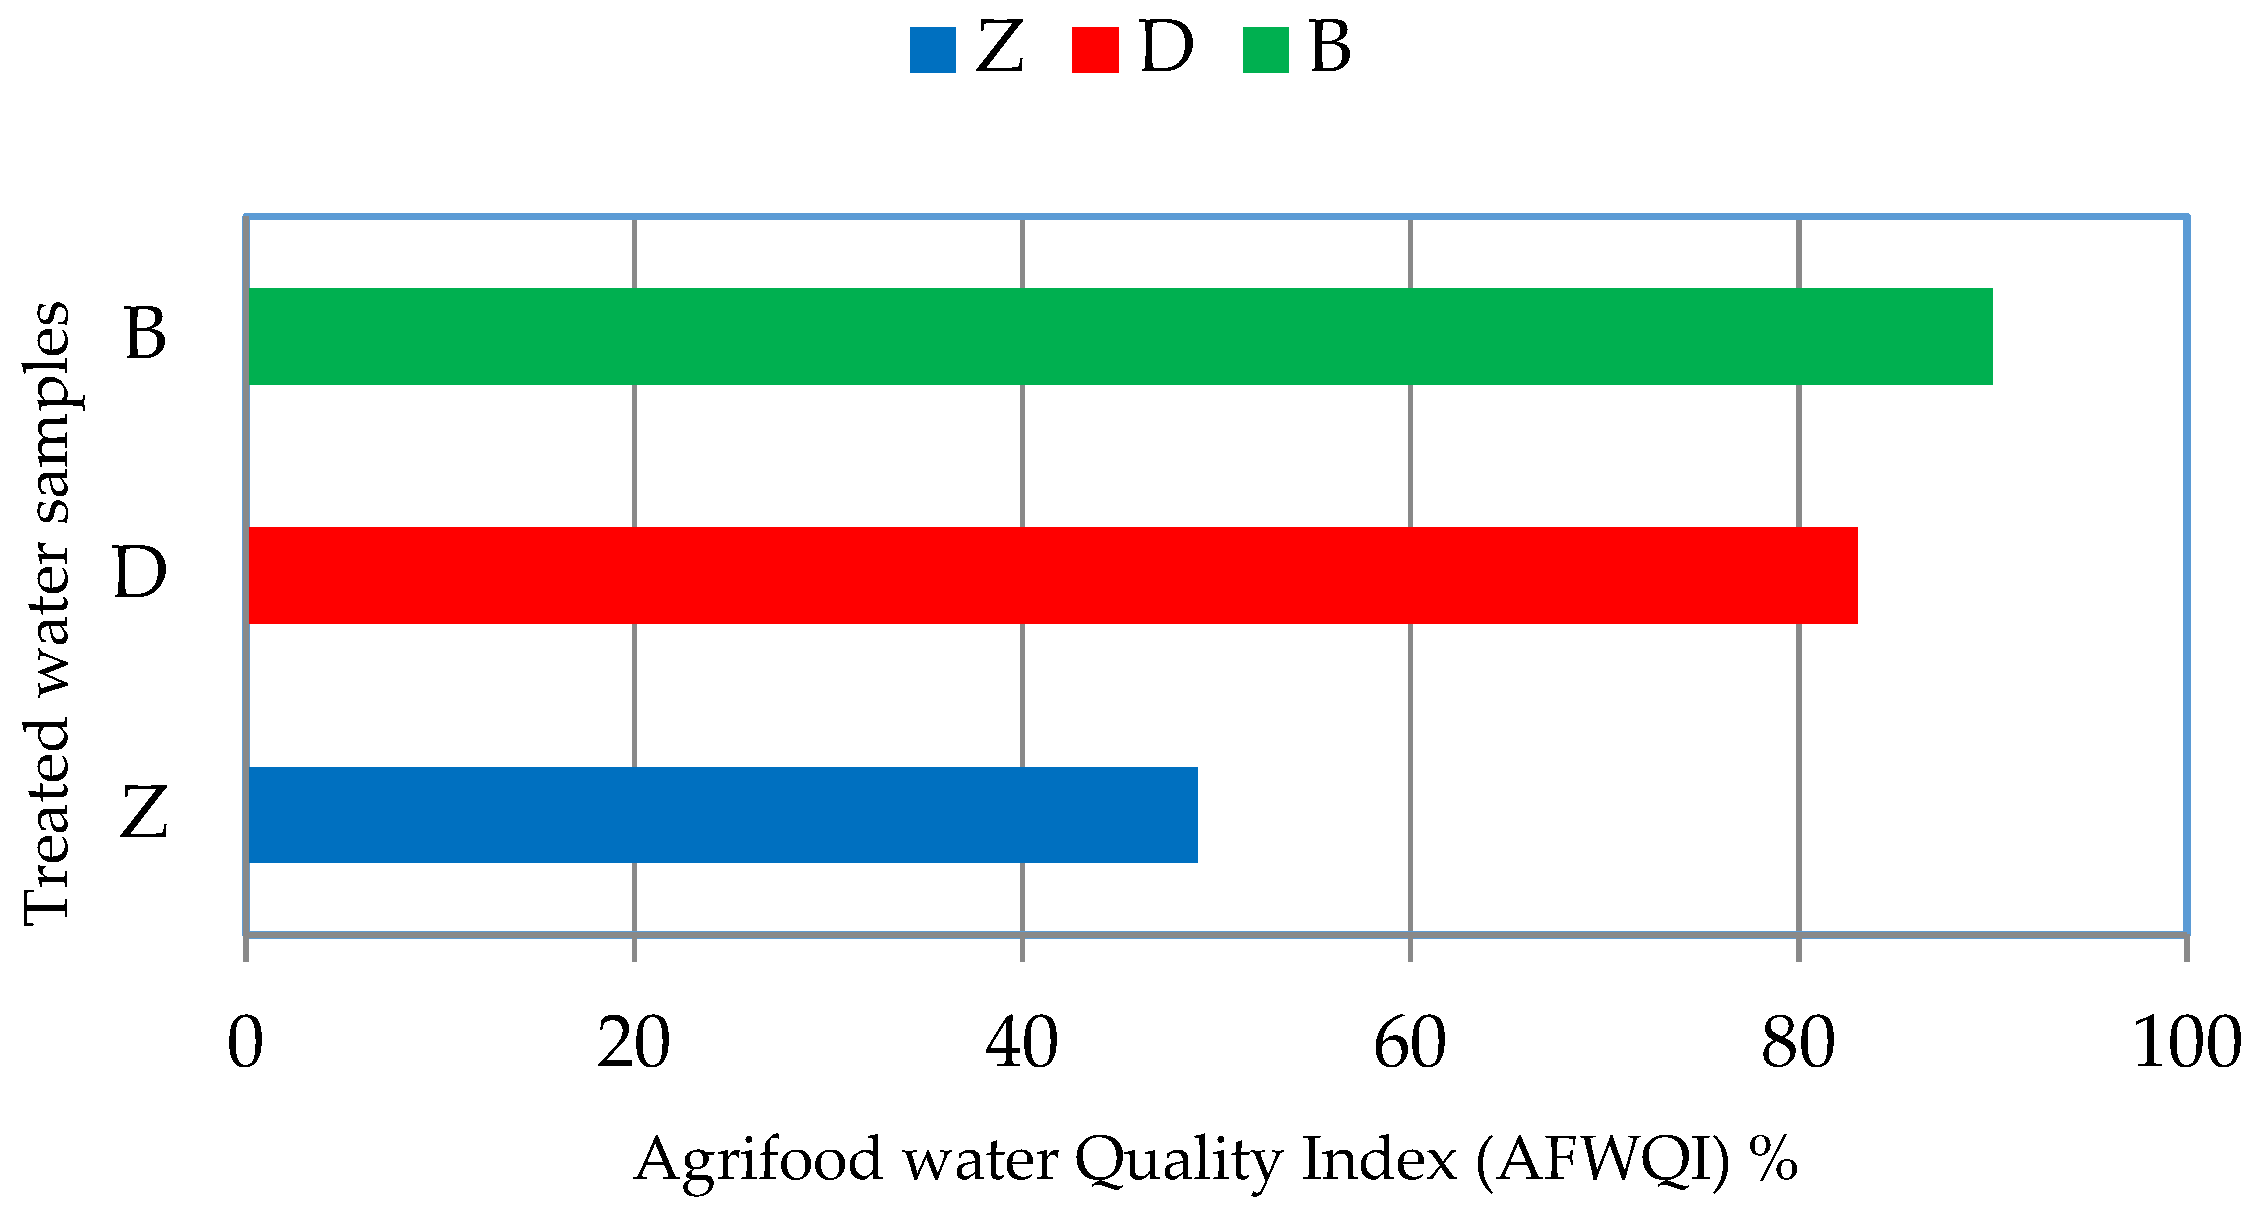
3.5. Evaluation of Treated Water for Reuse in Irrigation

Treated wastewater may be reused for other purposes after contaminant removal. Reusing is one of the viable options for sustainable management of wastewater and for reducing pressure on existing freshwater supplies. Reusing means the utilization of treated wastewater for a purpose other than that originally generated. Below, the authors evaluate treated water for reuse in irrigation depending on its physical, chemical, and biological aspects (Table 2).
The mean pH values of re-used water were 7.34, 7.33 and 7.31 for Z, D, and B, respectively, which indicates these waters were neutral or slightly alkaline (Table 2). These pH values are in the normal range (6–9) for irrigation of public areas, irrigation of restricted access areas, and agricultural irrigation for food crops [47]. Bicarbonate ion (HCO3) in waters treated with Z, D and B had mean values 3.85, 3.85 and 4.08 meq/L, respectively, indicating that slight to moderate restriction must be applied when using these waters for irrigation (Table 2). Residual sodium carbonate (RSC) is used to express bicarbonate hazard, which is calculated from the meq/L concentration for bicarbonate, carbonate, calcium and magnesium, as shown in Equation (3). The results indicate that our Z-, D-, and B-treated water samples had RSC of less than zero, which is good for irrigation purposes [48].
R S C   =   ( H C O 3 + C O 3 2 )   ( C a 2 +   +   M g 2 + )   , w h e r e   i o n s   c o n c .   i n   m e q / L
The residual sodium bicarbonate (RSBC) values computed using Equation (4) are less than 5 meq/L for Z-, D-, and B-treated water samples. According to Gupta and Gupta [49], RSBC values < 5, 5–10 and >10 meq/L should be tentatively considered as safe, marginal, and unsatisfactory, respectively. Therefore, all of our treated water samples were safe for irrigation due to higher Ca2+ concentration relative to HCO3.
R S B C   =   ( H C O 3 )   ( C a 2 + ) , w h e r e   i o n s   c o n c   m e q / L
The mean values for TSS in our treated water samples were 9.2, 25, and 5.05 mg/L for Z, D and B, respectively (Table 2). According to Harivandi [50], TSS values below 50 mg/L are safe for drip irrigation systems, while values above 100 mg/L will cause clogging. Moreover, TSS values below or equal to 30 mg/L are safe for irrigation of restricted access areas and agricultural irrigation. As a result, our Z-, B-, and D-treated waters were all safe for irrigation of restricted access areas (soda farms, silviculture), agricultural irrigation for commercially-processed food crops, non-food crops and pastures, as well as for drip irrigation systems.
Total phosphorus TP mean values for the treated water samples were 0.15, 0.21, and 0.26 mg/L for Z, D, and B mg/L, respectively, which are all less than the recommended value of 0.5 mg/L [51].
TN mean values were 1.84, 2.51, and 2.52 mg/L for Z, D, and B, respectively, which are all less than the recommended value of 5 mg/L [51]. The mean BOD values for Z, D, and B water samples were 19.2, 12.8, and 12.9 mg/L, respectively, so all treated waters were within the recommended limit (˂30 mg/L) for irrigation of commercially-processed food crops and non-food crops and pastures [46].
TDS mean values for the treated water samples were 1343, 1363, and 1193 mg/L for Z, D, and B, respectively, which do not exceed the critical level of 4000 mg/L, so these waters will incur no salinity problem if applied to crops [52]. Based on classifications of TDS [53], all the treated water samples have TDS values in the range of 1000 to 2000 mg/L, so these waters are suitable for irrigation. According to FAO [35] regulations, slight to moderate restrictions must be undertaken when using these waters for irrigation: they are useful for moderately tolerant crops such as vegetable crops (watermelon, spinach, broad beans, cucumber, and tomato), fruit crops (fig and olive), and field crops (rice paddy, peanut, sorghum, soybean, wheat, and cotton).
Our Z, D and B treated water samples contained concentrations of Ca2+, Mg2+, and K+ which are less than the recommended values 20, 5, and 2 meq/L, respectively, for irrigation. Na+ and Cl concentrations were higher than the critical values 9 and 10 meq/L, respectively, which are useable for moderately tolerant plants, e.g., lucerne [54]. Sulphate (SO42−) concentrations were less than the recommended value of 20 meq/L [53], so our water samples would not have major damaging effects on plants or soils and could be used in sprinkler irrigation, nor would they cause any damage to leaves or fruits. Nitrate NO3 mean values in the Z-, D-, and B-treated water were all 0.22 mg/L, which is significantly below the 10 mg/L permitted limit [35].
Sodium adsorption ratio (SAR) is a measure of the suitability of water for use in agricultural irrigation, as sodium concentration can reduce soil permeability and damage soil structure [55]. According to Equation (5), the SAR for water is the relative proportion of sodium to calcium and magnesium ions in meq/L [55]. The calculated SAR values for our Z, D and B samples were 4.9 ± 0.03, 4.7 ± 0.29 and 4.5 ± 0.11, indicating that these waters are excellent and suitable for all types of crops (except for those especially sensitive to sodium) and all types of soils.
S A R   =   N a +   ( C a 2 +   +   M g 2 + ) 2 ,   w h e r e   i o n s   c o n c   m e q / L
Sodium percentage (%Na) is a viable parameter for assessing sodium hazard, calculated using Equation (6). The mean values of Na% in our Z, D, and B samples were 50.8%, 48.9%, and 48.9%, respectively, indicating that these waters belong in the permissible category [55].
N a %   =   ( N a + ) ( N a +   + K + +   C a 2 +   +   M g 2 + ) × 100 ,   w h e r e   i o n s   c o n c   m e q / L
Magnesium hazard (MH) is considered, as high levels of magnesium in water adversely affect crop yields. MH was calculated in terms of calcium and magnesium in meq/L, using Equation (7). MH values exceeding 50 are supposed to be harmful for irrigation uses. In the current study, the MH values for Z, D, and B samples were less than 50%, indicating that these waters are suitable for re-use in irrigation.
M H   =   ( M g 2 + ) (   C a 2 +   +   M g 2 + ) × 100 ,   w h e r e   i o n s   c o n c   i n   m e q / L
The permeability index (PI) indicates whether treated water is suitable for irrigation purposes. Na+, Ca2+, Mg2+, and HCO3 in treated water all affect soil permeability after long-term utilization of these waters for irrigation. PI for our water samples was calculated using Na+, Ca2+, Mg2+, and HCO3 in meq/L and applying Equation (8) according to Doneen [56]. The results presented in Table 2 indicate that PI values for all waters were in the range 25 to 75%, which is Class II, confirming that the waters are good for irrigation.
P I   =   ( N a + + H C O 3 ) ( N a +   +   C a 2 +   +   M g 2 + ) × 100 ,   w h e r e   i o n s   c o n c   i n   m e q / L
The mean ferrous iron (Fe) values for Z, D, and B treated water samples were 0.228, 0.289, and 0.290 mg/L, respectively, which are less than the maximum permissible Fe in irrigation water, 5.0 mg/L [35], indicating that these samples are suitable for irrigation. Manganese (Mn) mean values were 0.089, 0.080, and 0.081 mg/L, respectively, which are less than the maximum allowable limit for Mn in irrigation water, i.e., 0.20 mg/L [35]. Zinc (Zn) and lead (Pb) mean values in the treated water samples were also less than the recommended value 5 mg/L for irrigation water [35]. Copper (Cu) concentrations were less than the recommended value 0.2 mg/L [35].
A maximum limit of 200 fecal coliforms/100 mL is recommended [46]. The D- and B-treated waters contained fecal coliforms equal or below 200 FCU/100 mL, which indicates their suitability for irrigation of restricted access areas, irrigation of commercially processed food crops, non-food crops, and pastures, although the Z-treated water is not suitable for irrigation of food and non-food crops according to the US EPA [47] and WHO [57]. The counts of fecal coliforms in Z water exceeded the 1000 CFU/100 mL level, which suggests fecal pollution and raises the possibility of the presence of pathogenic microorganisms in irrigated vegetables and a threat to public health [58].
The Water Quality Index (WQI) is a tool which summarizes water quality data into simple, reliable terms (i.e., excellent, very good, good, fair, and marginal) for better understanding by decision-makers and the general public [59]. The WQI was created by the Canadian Council of Ministers for the Environment (CCME) and was adjusted for Agrifood Canada WQI (AFWQI). AFWQI 1.0 was programmed to run on ExcelTM 2000 SP-3, and later using Visual Basic. It assesses and ranks the quality of water bodies for different helpful uses of water, including agricultural irrigation [59,60,61,62,63].
The results of our AFWQI calculations demonstrate that our B-treated water was classified as very good water (i.e., water quality with a virtual absence of threat) with a WQI = 90. The D-treated sample was classified as good water (i.e., water quality with a slight threat) with a WQI = 85. The Z-treated sample was classified as marginal surface water (i.e., water quality of threat much of the time) with a WQI = 49 (Figure 6).

3.6. Cost-Benefit Analysis

The annual operating costs of our pilot-scale constructed columns were estimated, taking into account 360 days of operation including column composition, recovery of natural clays, utilities, and maintenance requirements during the pilot process. The cost analysis summarized in Table 3 shows that an amount of more than USD 40 can be incurred annually for the production of 220 cubic meters/year, as the results show the feasibility of recovering the consumed natural materials after regeneration and retesting them once. This means the cost of treatment was 0.18–0.2 USD/m3. These results are mostly consistent with the study conducted by Senante et al. [64], who found that the average wastewater treatment plant operating costs were 0.14, 0.31, and 0.38 USD/m3 for primary, secondary, and tertiary treatments, respectively. From this, it is clear that the required investment cost to produce 2 million cubic meters/day is USD 401,818, 367,273, and 374,545 for the ZC, BC, and DC, respectively.

4. Conclusions and Recommendations

This investigation of the physical, chemical, and bacteriological characteristics of wastewater gives a significant insight into CLEQM’s drainage wastewater quality (raw wastewater assembled before treatment in CLEQM’s plant). The outcomes indicate that the raw input wastewater had TSS, TN, BOD, COD, total Coliforms (TC), copper (Cu), iron (Fe), manganese (Mn), lead (Pb), zinc (Zn), and TDS values higher than permitted by Egyptian Law 48/1982 and not suitable for irrigation due to the high concentration of manganese and fecal coliforms.
This investigation was undertaken to evaluate the relative efficiencies of three pilot-scale columns containing zeolite, bentonite, and diatomite materials for treating CLEQM’s raw wastewater. The outcomes confirm that the three columns demonstrated higher removal efficiencies, whereby the BC was more efficient than the DC and ZC in ensuring that the examined parameters ended up within the range of values permitted in the Egyptian water quality license. The best removal efficiencies for the examined parameters occurred at a contact time of 4 h, after which a steady state of removal continued (24 h). The removal efficiencies of TSS, TN, BOD, COD, fecal coliforms (FC), copper (Cu), iron (Fe), manganese (Mn), lead (Pb), zinc (Zn), and TDS by ZC were 96%, 68%, 47%, 54%, 96%, 90%, 80%, 91%, 91%, 92%, and 21%, respectively, while by BC they were 97%, 60%, 65%, 68%, 99%, 89%, 74%, 92%, 91%, 85%, and 29.8%, respectively, and by DC they were 84%, 59%, 65%, 68%, 99%, 89%, 74%, 92%, 91%, 85%, and 19.80%, respectively. Successive regeneration of the spent adsorbents resulted in the reduction of efficiencies of the regenerated adsorbents by approximately 2% compared with the natural adsorbents. Assessment of the suitability of water samples treated in the ZC, BC, and DC for re-use for irrigation purposes demonstrated that the BC- and DC-treated waters were appropriate for irrigation of restricted access areas, irrigation of commercially processed food crops, non-food crops, and pastures in terms of the FAO [35], US EPA, [51] and WHO [36] criteria. ZC-, DC-, and BC-treated waters were classified, respectively, as marginal, very good, and excellent for irrigation according to the Agrifood Water Quality Index. The outcomes of economic cost-benefit analysis for the pilot-scale ZC, BC, and DC were 0.2, 0.18, and 0.19 USD/day, respectively.
The authors propose the utilization of water treated in BCs and DCs for irrigation. Further investigations are required in situ to assess the impact of using this treated water for irrigation under different types of soil and crop conditions. Moreover, further studies are required to investigate the pre-removal of solids before the actual water purification process by adsorption and ion exchange in natural clay materials.

Author Contributions

This research article includes several contributions: conceptualizations were prepared by E.E., L.A.I., and M.A.-H., E.E. and L.A.I. performed the field survey. The data sample analysis and the investigations were prepared and analyzed by E.E., L.A.I., and A.G. The original draft preparation of the article was written by E.E., L.A.I., and M.A.-H. During the writing, review and editing were finalized by M.Z., L.A.I., A.G., and Z.V. Supervision and funding acquisition were carried out by M.A.-H., M.Z., and Z.V. The final version of the article was revised by M.A.-H., M.Z., E.E., and L.A.I. All authors have read and agreed to the published version of the manuscript.

Funding

This research received no external funding.

Institutional Review Board Statement

Not applicable.

Informed Consent Statement

Not applicable.

Data Availability Statement

Not applicable.

Acknowledgments

The authors are also grateful to the Directors of the Central Laboratory for Environmental Quality Monitoring (CLEQM) and Water Management Research Institute (WMRI) for assisting and giving us the chance to complete this study. We are grateful to have been supported through the ERANETMED project “Decentralized Treatment Wetlands for Sustainable Water Management in Rural and Remote Areas of Semi-Arid Regions”, through the Ministry of Education of the Slovak Republic project VEGA 1/0217/19 “Research of Hybrid Blue and Green Infrastructure as Active Elements of a Sponge City” and the Slovak Research and Development Agency project APVV-18-0360 “Active Hybrid Infrastructure Towards a Sponge City”.

Conflicts of Interest

The authors declare no conflict of interest.

References

  1. Ibrahim, L.A.; Asaad, A.A.; Khalifa, E.A. Laboratory approach for wastewater treatment utilizing chemical addition case study: El-Rahway Drain, Egypt. Life Sci. J. 2019, 16, 56–67. [Google Scholar]
  2. Hsueh, C.L.; Huang, Y.H.; Wang, C.C.; Chen, C.Y. Degradation of Azo Dyes Using Low Iron Concentration of Fenton and Fenton-Like System. Chemosphere 2005, 58, 1409. [Google Scholar] [CrossRef] [PubMed]
  3. Jester, T.L.; Taylor, T.H. Industrial Waste Treatment at Scovill. Manufacturing Company. In Proceedings of the 28th Purdue Industrial Waste Conference, Lafayette, IN, USA, 1–3 May 1973. [Google Scholar]
  4. Kim, S.H.; Chung, H.; Jeong, S.; Nam, K. Identification of pH-dependent removal mechanisms of lead and arsenic by basic oxygen furnace slag: Relative contribution of precipitation and adsorption. J. Clean. Prod. 2021, 279, 123451. [Google Scholar] [CrossRef]
  5. Rossi, G.; Mainardis, M.; Aneggi, E.; Weavers, L.K.; Goi, D. Combined ultrasound-ozone treatment for reutilization of primary effluent—A preliminary study. Environ. Sci. Pollut. Res. 2021, 28, 700. [Google Scholar] [CrossRef]
  6. Mo, J.H.; Lee, Y.H.; Kim, J.; Jeong, J.Y.; Jegal, J. Treatment of dye aqueous solutions using nanofiltration polyamide composite membranes for the dye wastewater reuse. Dyes Pigm. 2008, 76, 429. [Google Scholar] [CrossRef]
  7. Chen, G. Electrochemical technologies in wastewater treatment. Sep. Purif. Technol. 2004, 38, 11–41. [Google Scholar] [CrossRef]
  8. Ibrahim, L.A.; El Gammal, H.A.A.; Mahran, B.N. In Vitro, Appraisal and abatement of drainage wastewater pollution in light of utilizing fly ash. Nat. Sci. 2017, 15, 2017. [Google Scholar]
  9. Goswami, R.K.; Mehariya, S.; Verma, P.; Lavecchia, R.; Zuorro, A. Microalgae-based biorefineries for sustainable resource recovery from wastewater. J. Water Process. Eng. 2021, 40, 101747. [Google Scholar] [CrossRef]
  10. Nan, X.; Lavrnić, S.; Toscano, A. Potential of wastewater treatment systems based on constructed wetlands for agricultural reuse under the EU framework. J. Environ. Manag. 2020, 275, 111219. [Google Scholar] [CrossRef]
  11. Maamoun, I.; Eljamal, O.; Falyouna, O.; Eljamal, R.; Sugihara, Y. Multi-objective optimization of permeable reactive barrier design for Cr (VI) removal from groundwater. Ecotoxicol. Environ. Saf. 2020, 200, 110773. [Google Scholar] [CrossRef]
  12. Maamoun, I.; Eljamal, O.; Khalil, A.M.E.; Sugihara, Y.; Matsunaga, N. Phosphate removal through the nano-zero-valent iron permeable reactive barrier; column experiment and reactive solute transport modeling. Transport Porous Med. 2018, 125, 395. [Google Scholar] [CrossRef]
  13. Swayampakula, K.; Boddu, V.M.; Nadavala, S.K.; Abburi, K. Competitive adsorption of Cu (II), Co (II) and Ni (II) from their binary and tertiary aqueous solutions using chitosan-coated perlite beads as biosorbent. J. Hazard. Mater. 2009, 170, 680–689. [Google Scholar] [CrossRef]
  14. Abdallah, S.M.; El-hussaini, O.M.; Mahdy, R.M. Towards a more safe environment (2) Characterization of some clay sediments in Egypt for safe environmental applications. Aust. J. Basic Appl. Sci. 2007, 1, 813–823. [Google Scholar]
  15. Abdallah, S.M.; El-hussaini, O.M.; Mahdy, R.M. Towards a more safe environment (4) Sorpability of vanadium by some clay sediments in Egypt. J. Appl. Sci. Res. 2005, 1, 168–175. [Google Scholar]
  16. Abdallah, S.M.; El-hussaini, O.M.; Mahdy, R.M. Towards a more safe environment: (6) Monitoring the recovery of boron adsorbed by some clay sediments in Egypt by FTIR spectroscopy. Aust. J. Basic Appl. Sci. 2009, 3, 1450–1460. [Google Scholar]
  17. Ali, M.M.A.; El-Sayed, E.E.; Kamel, M.Z. Removal of Hazardous Contaminants from Wastewater Using Natural Zeolite. J. Water Res. 2017, 138, 333–347. [Google Scholar]
  18. Ferretti, G.; Galamini, G.; Medoro, V.; Coltorti, M.; Giuseppe, D.D.; Faccin, B. Impact of Sequential Treatments with Natural and Na-Exchanged Chabazite Zeolite-Rich TuffonPig-Slurry Chemical Composition. Water 2020, 12, 310. [Google Scholar] [CrossRef] [Green Version]
  19. Erdem, E.; Karapinar, N.; Donat, R. The removal of heavy metal cations by natural zeolites. J. Colloid Interface Sci. 2004, 280, 309–314. [Google Scholar] [CrossRef]
  20. Shubaira, T.; Eljamala, O.; Taharab, A.; Sugiharaa, Y.; Matsunaga, N. Preparation of new magnetic zeolite nanocomposites for removal of strontium from polluted waters. J. Mol. Liq. 2019, 288, 111026. [Google Scholar] [CrossRef]
  21. Falyounaa, O.; Eljamala, O.; Maamouna, I.; Taharab, A.; Sugiharaa, Y. Magnetic zeolite synthesis for efficient removal of cesium in a lab-scale continuous treatment system. J. Colloid Interface Sci. 2020, 571, 66. [Google Scholar] [CrossRef]
  22. Dye, A.; Hriljac, J.; Evans, N. The use of columns of the zeolite clinoptilolite in the remediation of aqueous nuclear waste streams. J. Radioanal. Nucl. Chem. 2018, 318, 2473–2491. [Google Scholar]
  23. Demir, A.; Gunay, A.; Debik, E. Ammonium removal from aqueous solution by ion-exchange using packed bed natural zeolite. Water SA 2002, 28, 329–335. [Google Scholar] [CrossRef] [Green Version]
  24. Bakr, H.E.G.M.M. Diatomite: Its Characterization, Modifications and Applications. Asian J. Mater. Sci. 2010, 2, 121–136. [Google Scholar]
  25. Lemonas, J.F. Diatomite. Am. Ceramic Soc. Bull. 1997, 76, 92–95. [Google Scholar]
  26. Aytas, S.; Akyil, S.; Aslani, M.; Aytekin, U. Removal of uranium from aqueous solution by diatomite (Kieselguhr). J. Radioanal. Nucl. Chem. 1999, 240, 973–976. [Google Scholar] [CrossRef]
  27. Osmanlioglu, A.E. Natural diatomite process for removal of radioactivity from liquid waste. Appl. Radiat. Isot. 2007, 65, 17–2018. [Google Scholar] [CrossRef]
  28. Luckham, P.F.; Rossi, S. The colloidal and rheological properties of bentonite suspensions. Adv. Colloid Interface Sci. 1999, 82, 43–92. [Google Scholar] [CrossRef] [Green Version]
  29. Tabak, A.; Afşin, B.; Aygün, S.F.; Köksal, E. Structural characteristics of organomodified bentonites of different origin. J. Therm. Anal. Calorim. 2007, 87, 375–381. [Google Scholar] [CrossRef]
  30. Standard Methods for the Examination of Water and Wastewater, 21st ed.; American Public Health Association Inc.: New York, NY, USA, 2005.
  31. Reddy, K.R.; Dastgheibi, T.X.S. Removal of heavy metals from urban stormwater runoff using different filter materials. J. Environ. Chem. Eng. 2014, 2, 282–292. [Google Scholar] [CrossRef]
  32. Al-Essa, K. Activation of Jordanian Bentonite by Hydrochloric Acid and Its Potential for Olive Mill Wastewater Enhanced Treatment. J. Chem. 2018, 2018. [Google Scholar] [CrossRef] [Green Version]
  33. Agbenin, J.O. Laboratory Manual for Soil and Plant Analysis; Ahmadu Bello University: Zaria, Nigeria, 1995; pp. 30–72. [Google Scholar]
  34. Egyptian Governmental Law No. 48/1982-Decision 92. The Implementer Regulations for Law 48/1982, Decision 92/2013 Regarding the Protection of the River Nile and Water Ways from Pollution. Map Periodical Bull. 2013, 21, 21–30.
  35. Wastewater Treatment and Use in Agriculture; FAO Irrigation and Drainage Paper no. 47; Pescod, M.B. (Ed.) Food and Agriculture Organization (FAO): Rome, Italy, 1992; p. 125. [Google Scholar]
  36. WHO Guidelines for the Safe Use of Wastewater, Excreta and Greywater. In Wastewater Use in Agriculture; World Health Organization: Geneva, Switzerland, 2006; Volume 2.
  37. Al-Wakeel, M.I. Characterization and process development of the Nile diatomaceous sediment. Int. J. Miner. Process. 2009, 92, 128–136. [Google Scholar] [CrossRef]
  38. Ibrahim, S.S.; Selim, A.Q. Evaluation of Egyptian diatomite for filter aid applications. Physicochem. Probl. Miner. Process. 2011, 47, 113–122. [Google Scholar]
  39. Rezvantalab, S.; Bahadori, F. Application of Natural Zeolites on Wastewater Treatment. Asian J. Agric. Res. 2015, 9, 343–349. [Google Scholar]
  40. Jarboui, R.; Sellami, F.; Kharroubi, A.; Gharsallah, N.; Ammar, E. Olive millwastewater stabilizationin open-airponds:impacton clay-sandysoil. Bioresour. Technol. 2008, 99, 7699–7708. [Google Scholar] [CrossRef] [PubMed]
  41. Sumanjit; Walia, T.P.S.; Ravneet, K. Removal of health hazards causing acidic dyes from aqueous solutions by the process of adsorption. J. Health Allied Sci. 2008, 6, 3. [Google Scholar]
  42. Namasivayam, C.; Radhika, R.; Suba, S. Uptake of dyes by a promising locally available agricultural solid waste: Coir pith. Waste Manag. 2001, 21, 381–387. [Google Scholar] [CrossRef]
  43. Oladoja, N.A.; Ademoroti, C.M.A.; Asia, I.O. Treatment of industrial effluent using fortified soil clay. Desalination 2006, 197, 247–261. [Google Scholar] [CrossRef]
  44. Patel, H.; Vashi, R.T. COD and BOD Removal from Textile Wastewater using Natural Materials. Int. J. Appl. Environ. Sci. 2010, 5, 179–188. [Google Scholar]
  45. Manz, D.H. Slow Sand Filtration—Demand Operated and Cleaned Using Backwash; Oasis Filter International Ltd.: Calgary, AB, Canada, 2010. [Google Scholar]
  46. Sobsey, M.D. Managing Water in the Home: Accelerated Gains from Improved Water Supply; World Health Organization: Geneva, Switzerland, 2002. [Google Scholar]
  47. Kang, S.J.; Olmstead, K.; Takacs, K.; Collins, J. Municipal Nutrient Removal Technologies Reference Document; United State Environmental Protection Agency (EPA): Washington, DC, USA, 2008; Volume 1.
  48. Richards, L.A. Diagnosis and Improvement of Saline and Alkaline Soils; Agriculture Handbook; U.S. Department of Agriculture: Washington, DC, USA, 1954; p. 60.
  49. Gupta, S.K.; Gupta, I.C. Management of Saline Soils and Waters; Oxford and IBH Publishing Company: New Delhi, India, 1987. [Google Scholar]
  50. Harivandi, M. nterpreting Turfgrass Irrigation Water Test Results; UCANR Publications: Davis, CA, USA, 1999. [Google Scholar]
  51. Dec, N. Environmental Guidelines—Use of Effluent by Irrigation; NSW Department of Environment and Conservation: Sydney, Australia, 2004.
  52. Dhirendra, M.; Alok, K.; Namita, A. Assessment of the irrigation water quality of river Ganga in Haridwar district. Rasayan J. Chem. 2009, 2, 285–292. [Google Scholar]
  53. Ayers, R.S.; Westcot, D.W. Water Quality for Agriculture. FAO Irrigation and Drainage Paper 29. Revision; FAO: Rome, Italy, 1994. [Google Scholar]
  54. Rahman, M.M.; Hagare, D.; Maheshwari, B. Benefits and Risks. In Balanced Urban Development: Options and Strategies for Liveable Cities; Maheshwari, B., Singh, V.P., Thoradeniya, B., Eds.; Springer: Cham, Switzerland, 2016; Volume 72. [Google Scholar]
  55. Todd, D.K. Groundwater Hydrology; John Wiley and Sons Publication: Hoboken, NJ, USA, 2001; pp. 280–281. [Google Scholar]
  56. Doneen, L.D. Notes on Water Quality in Agriculture; Water Science and Engineering, University of California: Davis, CA, USA, 1964. [Google Scholar]
  57. Abakpa, G.O.; Umoh, V.J.; Ameh, J.B.; Yakubu, S.E. Microbial quality of irrigation water and irrigated vegetables in Kano State, Nigeria. Int. Food Res. J. 2013, 20, 2933–2938. [Google Scholar]
  58. Jahin, H.S.; Abuzaid, A.S.; Abdellatif, A.D. Using multivariate analysis to develop irrigation water quality index for surface water in Kafr El-Sheikh Governorate, Egypt. Environ. Technol. Innov. 2020, 17, 100532. [Google Scholar] [CrossRef]
  59. Ghieth, M.I.; Soliman, K.G.; Abu-Hashim, M.S. Quality of Surface Water in Some Selected Drains and Canals in Fyoum Governorate. Zagazig J. Agric. Res. 2019, 46, 2271–2285. [Google Scholar] [CrossRef]
  60. Abd-Elaty, I.; Zelenakova, M.; Straface, S.; Vranayova, Z.; Abu-hashim, M. Integrated Modelling for Groundwater Contamination from Polluted Streams Using New Protection Process Techniques. Water 2019, 11, 2321. [Google Scholar] [CrossRef] [Green Version]
  61. Zelenakova, M.; Purcz, P.; Pintilii, R.; Hlustik, P.; Oracova, A.; Abu-hashim, M. Spatio-temporal Variations in Water Quality Parameter Trends in River Waters. Rev. Chim. 2018, 69, 2940–2974. [Google Scholar] [CrossRef]
  62. Zelenakova, M.Z.; Repel, A.; Kaposztasova, D. Surface Runoff in Urban Area—Case Study. In New Trends in Urban Drainage Modelling. UDM 2018. Green Energy and Technology; Mannina, G., Ed.; Springer: Cham, Switzerland, 2018. [Google Scholar] [CrossRef]
  63. Markovič, G.; Zelenakova, M.; Vranayova, Z.; Kaposztasova, D. Research of Infiltration Facility Efficiency and Quality of Rainwater Harvested from Surface Runoff in Real Conditions. In Storm Water Management; Hlavínek, P., Zeleňáková, M., Eds.; Springer Hydrogeology; Springer: Cham, Switzerland, 2015. [Google Scholar] [CrossRef]
  64. Senante, M.M.; Sancho, F.H.; Garrido, R.S. Economic feasibility study for wastewater treatment: A cost–benefit analysis. Sci. Total Environ. 2010, 408, 4396–4402. [Google Scholar] [CrossRef]
Figure 1. Experimental schema for the pilot-scale columns (ZC, BC, and DC).
Sustainability 13 05738 g001
Figure 2. Chemical composition of natural clay materials (zeolite, bentonite, and diatomite) utilized for wastewater treatment.
Sustainability 13 05738 g002
Figure 3. XRD patterns of natural clay materials (zeolite, bentonite, and diatomite) utilized for wastewater treatment.
Sustainability 13 05738 g003
Figure 4. Percentages of removal efficiency (RE%) for TSS, TN, TP, TDS, BOD, COD, copper, lead, iron, manganese, zinc and FC removed from wastewater by zeolite (ZC), diatomite (DC), and bentonite (BC) columns.
Sustainability 13 05738 g004
Figure 5. Percentage of removal efficiency (RE%) for TSS, TN, TP, TDS, BOD, COD, FC, Cu, Fe, Pb, Mn, Ni, and Zn removed from wastewater by zeolite (ZC), diatomite (DC), and bentonite (BC) before (raw) and after regeneration (reg), respectively.
Sustainability 13 05738 g005
Figure 6. Agrifood Water Quality Index (AFWQI 1.0) for water treated in zeolite (Z), diatomite (D), and bentonite (B) columns(C).
Sustainability 13 05738 g006
Table 1. Descriptive statistics (min, max, and mean ± SD) for CLEQM’s drainage raw wastewater, Egyptian Law 48 (decision 91, 2013), FAO, and WHO.
ParametersMinMaxMean ± SDLaw 48, Decision 91 (2013) Article 50FAO [35] and WHO [36]
Concentration (mg/L)Rosetta and Damietta BranchRiver Nile
pH *7.297.417.35 ± 0.066–96–96.5–8.4
Total suspended solids (TSS)193220211 ± 153030-
Total phosphorus (TP)0.3410.4620.4 ± 0.111-
Total nitrogen (TN)4.019.426.09 ± 2.955-
Biological oxygen demand (BOD)363836.67 ± 1.23020-
Chemical oxygen demand (COD)555856 ± 1.74030-
Copper (Cu)0.9471.0290.97 ± 0.05110.2
Iron (Fe)1.051.161.12 ± 0.06115
Lead (Pb)1.0141.021.02 ± 0.0030.10.15
Manganese (Mn)1.0051.191.07 ± 0.110.50.50.2
Zinc (Zn)1.021.121.05 ± 0.06112
Total dissolved solids TDS165917411700 ± 411200800450–2000
Calcium142192151 ± 8.04--400
Potassium176120.30 ± 2.62--78
Magnesium418847.60 ± 5.89--60
Sodium366427386.00 ± 19.22--620
Chloride486543502.00 ± 15.47--1065
Nitrate0.32410.34 ± 0.02--10
Sulphate241291250 ± 8.92--960
Bicarbonate239286245 ± 5.58--610
Fecal coliforms (FC) * (CFU/100 mL)46 × 103114 × 10391 × 103 ± 39 × 10310001000< 1000
* Units of measurement for all parameters are mg/L, except for pH (dimensionless) and fecal coliforms CFU/100 mL.
Table 2. Descriptive statistics (min, max, and mean ± SD) for water treated with zeolite (Z), diatomite (D), and bentonite (B).
Treated Water (Z)Treated Water (D)Treated Water (B)
MinMaxMean ± SDMinMaxMean ± SDMinMaxMean ± SD
dimensionless
pH7.317.387.34 ± 0.037.327.337.33 ± 0.0017.307.347.31 ± 0.01
SAR4.894.974.94 ± 0.034.385.074.75 ± 0.294.424.634.52 ± 0.11
MH30.2030.8030.5 ± 0.2732.2932.9232.3 ± 0.1731.5436.4635.1 ± 1.6
meq/L
RSC−6.89−6.53−6.63 ± 0.14−8.05−6.86−7.42 ± 0.50−6.55−5.77−6.29 ± 0.30
RSBC−3.60−3.40−3.44 ± 0.08−4.35−3.40−3.78 ± 0.37−2.69−2.59−2.64 ± 0.05
%
Na%50.5051.0450.86 ± 0.2146.5350.9548.92 ± 1.8548.1549.7548.93 ± 0.82
PI60.361.061.0 ± 0.456.061.058.7 ± 2.158.760.959.6 ± 1
mg/L
TSS4.0017.009.20 ± 5.1325.0031.0025.00 ± 7.894.007.005.05 ± 1.01
TP0.140.150.15 ± 0.0010.210.210.21 ± 0.0010.250.290.26 ± 0.01
TN1.592.021.84 ± 0172.502.512.51 ± 0.012.482.592.52 ± 0.04
BOD16.0024.0019.20 ± 3.1611.0014.0012.80 ± 1.1811.0014.0012.95 ± 1.01
COD23.0029.0025.40 ± 2.3716.0019.0017.80 ± 1.1816.0019.0017.95 ± 1.01
TDS133913611343 ±9.03134013821363 ± 17.21117511991193 ± 7.74
Copper0.0980.1000.099 ± 0.0010.0970.0970.097 ± 0.0010.0970.0970.097 ± 0.001
Iron0.2270.2290.228 ± 0.0010.2870.2910.289 ± 0.0020.2870.2910.290 ± 0.001
Lead0.0910.0940.093 ± 0.0010.0830.0910.088 ± 0.0030.0830.0910.088 ± 0.003
Manganese0.0840.0930.089 ± 0.0040.0740.0840.080 ± 0.0040.0740.0840.081 ± 0.003
Zinc0.0810.0840.083 ± 0.0010.1240.1740.154 ± 0.020.1240.1740.157 ± 0.017
meq/L
Bicarbonate3.793.883.85 ± 0.043.793.883.85 ± 0.044.054.154.08 ± 0.03
Calcium7.247.397.29 ± 0.067.298.137.62 ± 0.336.696.796.72 ± 0.03
Potassium0.410.490.45 ± 0.030.410.560.50 ± 0.060.360.410.37 ± 0.02
Magnesium3.133.293.19 ± 0.063.453.783.64 ± 0.163.133.873.64 ± 0.26
Sodium11.3111.3111.31 ± 0.00110.6611.7411.26 ± 0.4410.1810.4410.29 ± 0.13
Chloride13.8214.1313.98 ± 0.1413.4014.6714.17 ± 0.5010.9210.9710.96 ± 0.02
Nitrate0.220.220.22 ± 0.0010.220.220.22 ± 0.0010.220.220.22 ± 0.001
Phosphate0.030.030.03 ± 0.0010.030.030.03 ± 0.0010.030.030.03 ± 0.001
Sulphate4.935.355.10 ± 0.164.935.355.10 ± 0.164.394.834.70 ± 0.15
CFU/mL
FC240034002800 ± 300180245200 ± 20180230190 ± 20
Key: SAR: sodium adsorption ratio, MH: magnesium hazard, RSC: residual sodium carbonate, RSBC: residual sodium bicarbonate, Na%: sodium percentage, PI: permeability index, TP: total phosphorus, TSS: total suspended solids, TN: total nitrogen, BOD: biological oxygen demand, COD: chemical oxygen demand, TDS: total dissolved solids, and FC: fecal coliforms.
Table 3. Cost analysis and economic benefit.
ItemsVariablesZCBCDC
Variable cost (USD)Average natural clay consumption per year40.21
Cost of sand per year444
Cost of gravel per year1.21.21.2
Fixed Cost (USD)Cost of PVC column888
Cost of column accessories 777
Variable cost (USD)Annual cost for spent clay recovery per year555
Operating cost including utilities, transportation, power, and maintenance per year151515
Total annual cost44.240.441.2
Amount of treated water (m3/year)220220220
Total cost for 2 million m3/day401,818367,273374,545
Publisher’s Note: MDPI stays neutral with regard to jurisdictional claims in published maps and institutional affiliations.

