Article

Data Exchange Processes for the Definition of Climate-Proof Design Strategies for the Adaptation to Heatwaves in the Urban Open Spaces of Dense Italian Cities

by
Eduardo Bassolino
*,
Valeria D’Ambrosio
and
Alessandro Sgobbo
Dipartimento di Architettura (DiARC), Università degli Studi di Napoli Federico II, Via Toledo 402, 80134 Naples, Italy
*
Author to whom correspondence should be addressed.
Sustainability 2021, 13(10), 5694; https://doi.org/10.3390/su13105694
Submission received: 28 March 2021 / Revised: 11 May 2021 / Accepted: 14 May 2021 / Published: 19 May 2021
(This article belongs to the Special Issue Public Transport Integration, Urban Density and Sustainability)

Abstract

:
The growing awareness of the danger of extreme weather phenomena highlights the inadequacy of current cities and the increase in their level of vulnerability concerning the impacts resulting from climate change. The theme of design to combat climate impacts requires the development of knowledge and process models capable of managing the complexity of the information necessary to direct a climate-proof transformation of the urban systems. The research made it possible to develop a methodology based on the exchange of data between GIS-based ICT tools and for parametric design, to analyze the microclimatic and performance behavior of recurrent types of urban open spaces in Italian cities, characterized by different climatic conditions, through generic urban patterns, homogeneous in terms of building density and morphology. The goal achieved was to define the critical aspects of urban open spaces with the performance offered in response to the phenomenon of heatwaves, to verify and measure the performance effectiveness of climate-proof intervention categories, to transfer these results in the form of database, hazard maps, and potential levels of adaptation, and to define guidelines for the climate-oriented project. The transfer of the project data took place through a decision support webGIS platform (SDSS).

1. Introduction

The current climate emergency poses new major challenges for cities and large metropolises, which require the development of strategies capable of reducing climate impacts and improving the adaptability of the urban system. The progressive increase in global warming causes extreme climatic events that have negative repercussions on communities [1,2]. In recent decades, the increase of the frequency and intensity of climatic phenomena, which have serious repercussions in terms of impacts on the built environment, requires the tools to support decision-making processes for the urban project aimed at climate adaptation were directed toward innovative and appropriate methodologies. Heatwaves have significant implications for humans and the environment. If we add to this the increase in their frequency, duration, and intensity, in the near future as foreseen by the IPCC—Intergovernmental Panel on Climate Change [3,4,5], it is clear that appropriate methodologies need to be developed to support the design of built urban space [6,7].
In this context, a consideration of the relationship between urban density, extreme climatic impacts, and the environmental interaction of built urban systems is at least necessary both downstream of what is occurring in terms of environmental alterations due to climate impacts, and to introduce the reasons that led to the definition of this study.

1.1. Plan the Dense City

The natural aptitude to densification of the areas already anthropized, which had distinguished urban development over the centuries, in the industrial city has not only confronted the health and hygiene problems, but also social problems that accompany the high concentration of inhabitants. While an attempt is being made to remedy this by implementing plant networks capable of improving the management of urban metabolism [8], ideal models of return to a balanced, symbiotic relationship between anthropogenic space and nature [9], are beginning to establish themselves. Criticism of high density, however, finds a brake on the need for contiguity between production, services and housing, so much so that the proposed alternative models of cities are accompanied by utopian social, economic, and productive transformations [10]. In the post-war period, urban growth took on the meaning of horizontal expansion. This significance is supported by the illusion of the unlimited space available and by technological innovation, which, with the spread of motorized vehicles, appears capable of reducing the need for centrality but also of overcoming the limits imposed by nature on the settlement capacity of the territory [11]. However, this approach has begun to clash with the finiteness of the biosphere, so that several scholars [12] have affirmed the concept of ecological economy and sustainable growth as alternatives to unlimited growth.
The recognition of the anthropogenic origin of climate change and the increased sensitivity to land, urge the scientific community to reconsider urban density positively [13,14]. The shape and organization of cities are no strangers to the causes and intensities of the harmful consequences of very energetic societies and wasteful of natural resources such as that of the soil, to focus attention on an object of urban discipline. To correct these flaws, we have long been oriented toward multifunctionality [15] and densification, both objectives that reduce mobility and consumption of rare resources [16,17,18].
Densification should be understood not only as a criterion for the design of urban expansions but also as a reference point for the regeneration of urbanized areas or to be converted into uses. Moreover, it cannot be followed as the only and absolute objective, but rather it must be framed in the cognitive and normative heritage of models of cities that are environmentally healthy and balanced as well as socially fair. This means that its application must resolve dilemmas and provide balances such as that with public space, standards, and housing quality.
Density, although conjugated in different ways in different countries, is a fundamental global parameter [19]. Studies and discussions are therefore available with different emphasis, together with the need to reach shared conclusions to be able to reform the existing parameters that take on normal value. To this end, it is essential to clarify and verify all the criteria from which the proposed density thresholds derive with the relevant ideas of cities that underlie them, as well as the indicators necessary to define their objective value within the identified thresholds. From this point of view, the purely technical data of the density index come into terms with all the complexity of factors that affect the urban form and which are the mirror of the current phase of the evolution of human settlements.
In the disciplinary debate, the topic attracts the attention of numerous scholars who identify it as an opportunity to respond effectively to the need for environmental sustainability by mixing the objectives of efficiency of services and economic and social development [20,21,22]. The concentration of demand for services supports economies of scale that ensure their accessibility to large portions of the population; compact urbanization enhances the ecological effectiveness of remote climate control infrastructures which, being able to count on the exploitation of parasitic resources (co-trigeneration, recovery of production heat, balance of competing needs), significantly reduce climate-changing inputs; the contiguity with local public transport nodes increases its operational efficiency and, consequently, the quality of the service offered, encouraging collective mobility; intensive land use supports the substantial investment needed for urban regeneration.
Density, however, is also critical. In public opinion, the intensive exploitation of the land for building purposes evokes speculation and concreting. The suggestion is reflected in the political attitude where, in terms of consensus, it is considered more convenient to hinder the vertical growth of settlements. The dense city moves away from the traditional planning of the territory; it is a model synthetically judged “not on a human level” that suggests exclusion and social unrest. In the disciplinary field, the main criticisms of density/densification concern the unsustainability of the ecological footprint generated [23], the incompatibility of the vertically developed model with the needs of identity and landscape protection, and the assumed inherent lack of resilience.

1.2. Environmental Design for the Control of Adaptation Processes in Dense Cities

The theme of urban density must be framed by considering some areas of in-depth study among which emerges that of the relationship between environmental design and the density of the built-in context of new climate regimes. The control of the relationships between building organisms, open spaces, and the environment, starting from the concepts of compatibility and ecosystem integration of interventions, introduces qualitative and cultural innovations in the design. The environmental issue linked to new climate regimes becomes no longer amendable and finds in density a mode of approach in determining the causes and possible solutions for the reduction of negative impacts due to climate change, in an ecosystem view of the problem [24,25,26,27].
Downstream of this, the relationship between urban density and the principles that guide the environmental design emerges robustly, which can be recalled as a factor in solving numerous urban problems related to the field of environmental and climatic impacts, from the lack of efficiency in the management of resources within highly dense urban contexts. Environmental design can make a specific contribution to regenerative urban projects, defining design and meta-design scenarios in which environmental issues are decisive in decision-making choices. The components of environmental design interact starting from the conceptual approach phase of the urban project, helping to direct its regenerative criteria and contributing to the definition of urban strategies, purposes and configurations aimed at establishing clear principles of intervention, this also through the systemization of scientific knowledge, policies and operational practices to inform the design for its adequate development and implementation in a climate-proof perspective.
Climate adaptation and ecological change are today the cross-cutting themes of many of the objectives set out in the United Nations 2030 Agenda for Sustainable Development, outline actions to define a key strategy for the fight to climate change and environmental sustainability, as set out in Goal 13 [28]. Besides, it is one of the priority objectives of the main European plans and programmes for the sustainable development of territories, including the Green Deal [29] and the European Biodiversity Strategy [30], to promote actions concerning the reduction of emissions of climate-altering agents, the fight against the impacts of climate change, the reduction of degradation and environmental pollution phenomena, the improvement of well-being and health conditions, social cohesion and at the same time promoting the integration of adaptation criteria into local and sectoral planning processes and instruments.
In this context, the definition of design actions at the local scale becomes relevant, which can lead to a significant update of technical policies, also through the search for new models and methods of global sharing (web-platform) [31] for the development of climate-proof oriented urban design projects, to bring together local authorities, the world of research, designers, and industrial partners through an interdisciplinary approach that can integrate knowledge, methods, and tools from different disciplinary fields.
In the literature, some of the exemplary cases related to the definition of processes and models for the evaluation of adaptation to climatic alteration phenomena on a local scale, defined through GIS-based methodologies (Geographic information system), focus on the description of vulnerability and impact models related to actual climatic conditions and future scenarios, delegating the contribution of climate-adaptive design aspects to the definition of frameworks of canonical solutions or guidelines for climate adaptation [32,33,34], but also social involvement and gamification operations [35,36].
While there is a need to investigate the altering potential of local climate change action, the requirement emerges to define actions and solutions able to counteract its effects. With the introduction of simulation processes implemented with ICT (Information and Communication Technologies) environmental investigation tools [37,38], capable of operating on a neighborhood and urban block scale, it is possible to define the potential of transformation actions in response to phenomena related to climate change, transferring and verifying ideal models of climate-adaptive urban transformation [39], also through recursive testing operations. These data exchanges, now simplified by dedicated ICT tools, have introduced approaches and methodologies able of integrating data with different levels of definition and information and, at the same time, performing specialized simulation, obtainable only through dedicated software and tools [40,41].
The paper proposes the development of one of the results obtained from the research project called “PLANNER-Piattaforma per LA GestioNe dei rischi Naturali in ambiEnti uRbanizzati” which sees the participation of ETT spa (lead subject), Genegis GI, STRESS S.c.a.r.l.-Sviluppo Tecnologie e Ricerca per l’Edilizia Sismicamente Sicura ed ecosostenibile. The research project, which has been proposed to advance knowledge on climate adaptation in the urban environment and digitization of processes and information for the urban design, has been divided into four products of the research and has seen the realization of the goal of creating a decision-support tool that allows to map the level of vulnerability concerning environmental risks (seismic hazard and heatwaves) and provide a complete kit of interoperable tools, technologies, and methodologies for evaluation, risk management, and mitigation through measures to increase urban resilience.
In this context, among the targets and outputs of PLANNER, the defined aim is to be able to evaluate the climatic resilience of the physical system of urban aggregates, producing results starting from certified and open access data to make available, accessible and replicable the tools, analyses, and scenario assessments on the entire national territory. The development of a model for assessing climate resilience scenarios started from the implementation of a vulnerability and climate impact assessment model already present in the literature [1] which involved the development of a database of technical and design solutions multiscalars of climate adaptation and mitigation of CO2 emissions. The design of the model for assessing climate resilience scenarios concerned, in particular, the physical subsystem of the urban system—consisting of residential buildings and open spaces—intended as minimum units affected by the interventions in the processes of planning, regeneration, and urban redevelopment, oriented to provide effective responses to climatic stress conditions. The model is designed with the aim of producing knowledge frameworks and resilience scenarios starting from open data available throughout the country. For this reason, the ISTAT (Istituto nazionale di statistica) census area [42] was identified as the minimum atomic space element at the base of the process. This process, which bases its development starting from the generation of vulnerability maps of urban physical subsystems (building subsystem and open spaces subsystem), hazard and impact scenario maps, has made it possible to obtain a process for assessing resilience levels by classifying census areas by recurrent building types and urban patterns to select optimal impact reduction actions and increase the adaptability and mitigation capacity chosen from those prepared and codified in a database of climate-proof technical alternatives (Figure 1).
The objective is the development of a recursive and replicable process at a national level that will allow obtaining, starting from recalculation operations, both maps relating to new impact scenarios outcome of the application of technical alternatives, and adaptation cards capable of expressing levels of indoor and outdoor comfort achievable, as well as maps on mitigation capacity expressed with CO2 emission levels and concentrations. The process, which allows to automatically select, based on the building type and the recurring urban pattern, the optimal climate-proof technical solutions to be applied to residential buildings and open spaces included within the census section, is an effective tool of meta-design capable of carrying out an initial assessment on the adequacy of adaptation and climate mitigation interventions in the different climatic contexts within the Italian national territory. At the same time, the oriented meta-design process aims to develop processes for the evaluation of the actual feasibility, replicability, and effectiveness in the application of climate-proof intervention categories to the urban scale.

2. Materials and Methods

As already enlightened above, this article deals with the construction of the methodology with which the evaluation model of the capacity of adaptation of urban open spaces to the environmental and climatic stimuli due to the impact of the phenomenon of heatwaves was developed, as a consequence of climate change on Italian cities, with an applied and experimental focus on the test area represented by the city of Naples.

2.1. Summary of the Methodological Approach

Through PLANNER, a workflow (Figure 2) was obtained through the digitization of information and data processing based on the data exchange operations between ITC as GIS-based tools and parametric design software in association with visual programming languages (VPL), such as Rhinoceros and Grasshopper, as well as dedicated tools and plug-ins capable of operating complex simulation processes (ENVI-met, Ladybug, Honeybee, and Dragonfly) [43,44], to obtain simulations that could return performance verification data of different types of open spaces and output data on process scenarios of urban resilience.
The will to make replicable the simulation and analysis processes for the definition of the microclimatic and performance behavior of open spaces to be able to identify critical aspects and to verify the effectiveness of the application of climate-proof intervention categories is based on the construction of models of recurrent urban patterns [45,46], obtained by dimensional parameters found within the urban morphology of Italian cities such as the ratio of built to the unbuilt area, the average height of buildings, the sky view factor [47,48,49], the hillshade [50,51]. This operation made it possible to identify different types of open spaces classified typologically with building aggregation such as terrace-courts, pavilion-courts, terraces, pavilion/towers, sprawl-pavilion, as well as squares, open spaces, and green areas. The further classification was carried out through the investigation of the built density (mc/sqm) and the territorial coverage ratio, which led to the classification of urban patterns by high, medium, and low density [52,53]. Concerning the squares and the open spaces, the perimeter percentage of the building and the height of the surrounding buildings were considered as parameters of classification and identification. At last, the green areas were first classified according to the percentage of tree cover and the typology (agricultural green, uncultivated green, urban green, and wooded areas) [54,55], and then to be included in macro-categories according to the different types of green areas (medium green areas and green areas).

2.2. Measurement of Microclimatic and Performance Behavior of Typical Open Spaces

The definition of generic morphologically homogeneous urban patterns allows in this context to make a simplified and expedited measurement of the microclimatic and performance behavior of different types of open spaces that make up cities, also with the different climatic and environmental stimuli characteristic of homogeneous climatic areas of Italy. For this purpose, it emerged the need to make the retrieval, selection, and use of climate information in different national climatic contexts, using as basic elements the data on the climatic conditions of Italian cities.
The National Climate Change Adaptation Plan (PNACC) provides a “Climate Zonation over the 1981–2010 reference period,” which identifies six “homogeneous climate macro-regions” for which the observed data report similar climatic conditions over the last thirty years (1981–2010), and elaborated through the cluster analysis methodology applied to a set of climate indicators [56,57]. In this sense, the classification of climatic macro-regions has been adopted, to divide the geographical areas and Italian cities. Within each climate macroregion, a reference city has been identified to set climate data to carry out energy-environmental simulations. The reference cities identified are:
  • Turin for the Climate Macro-region 1 “PREALPS AND NORTHERN APENNINES;”
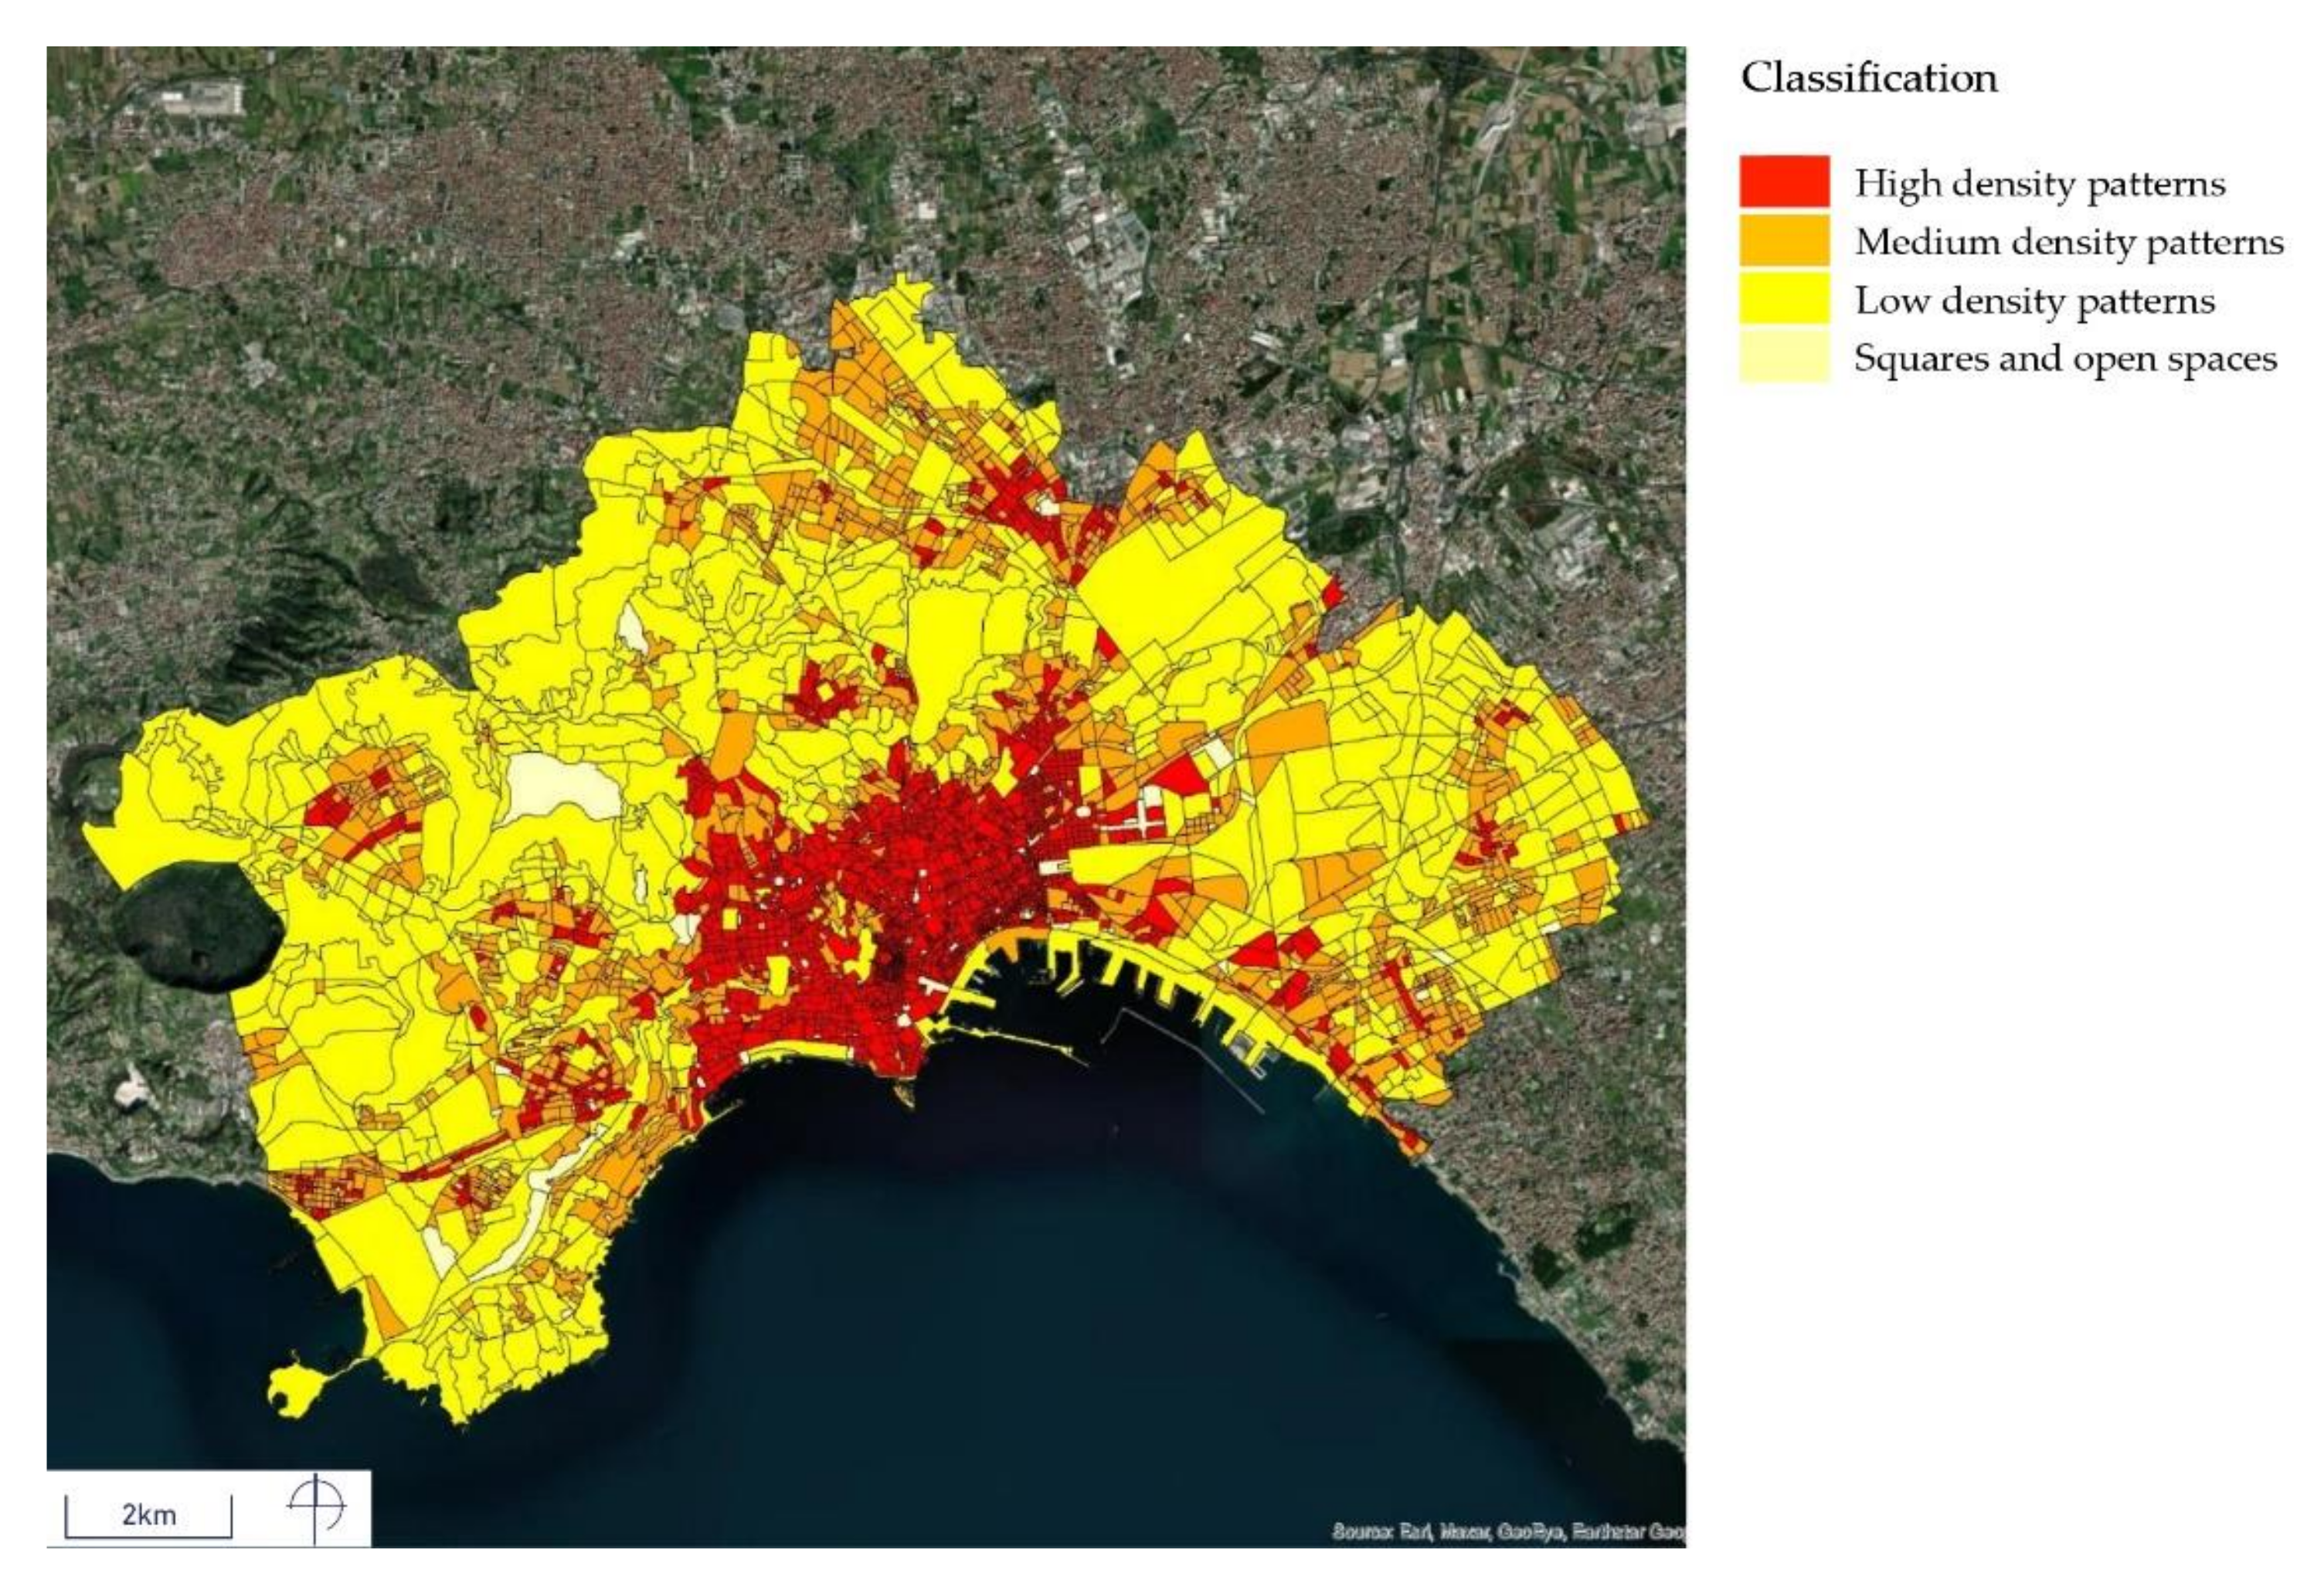
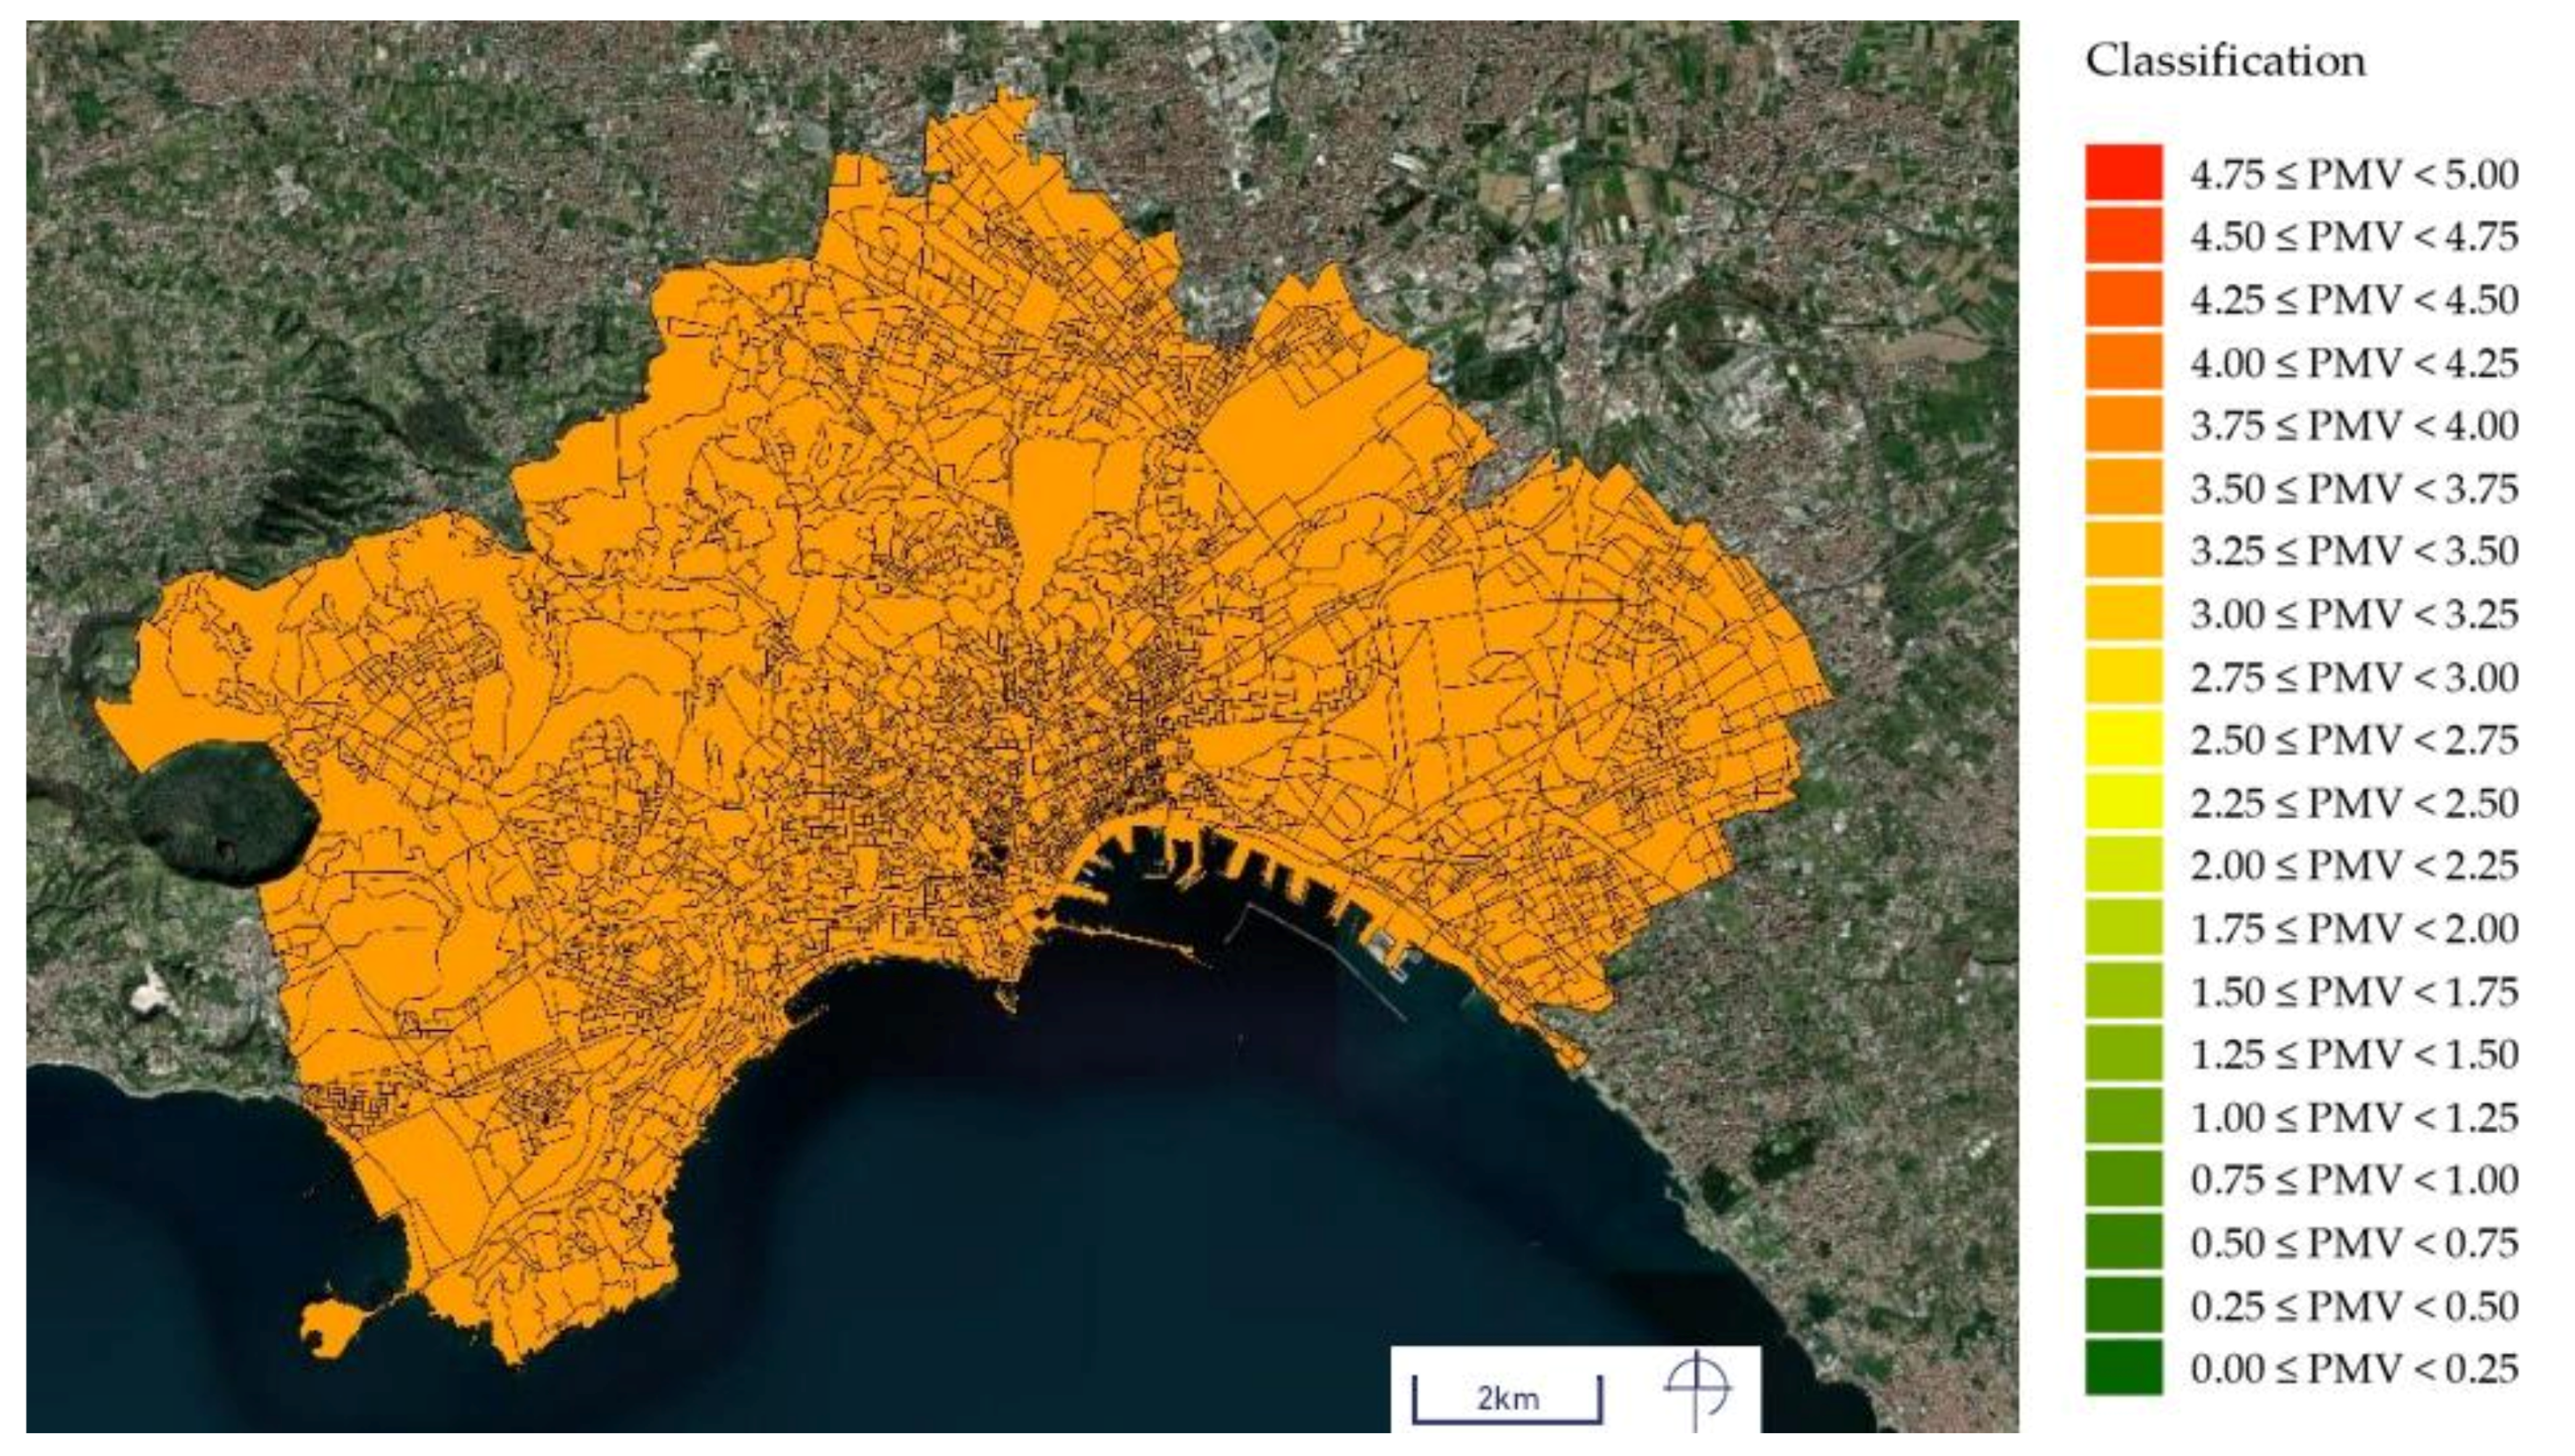
  • Naples, for the Climate Macro-region 2 “PADANA PLAIN, HIGH ADRIATIC SIDE AND COASTAL AREAS OF SOUTHERN CENTRAL OF ITALY;”
  • Potenza, for the Climate Macro-region 3 “SOUTHERN CENTER APENNINES;”
  • Bolzano, for the Climate Macro-region 4 “ALPINE AREA;”
  • Trieste for the Climate Macro-region 5 “CENTRAL-NORTHERN ITALY;”
  • Palermo for the Climate Macro-region 6 “INSULAR AREAS AND EXTREME SOUTH OF ITALY.”
Processes of simulation of the microclimatic behavior of recurrent urban patterns, in the absence and with the application of climate-proof intervention categories identified as greening, de-paving, shading, water bodies, cool materials, have been conducted for each of the six cities and the types of recurring identified open spaces. To simulate current climatic conditions, reference has been made to EPW climate data [58], which refer to the thirty years 1990–2019 (2000s), while to obtain the simulation of climatic conditions in a medium-term climate scenario in the thirty years 2040–2069 (2050s), data obtained through morphing operations of the same climate data [59,60,61].

2.3. Description of the Microclimatic Behaviour of Open Spaces

The methodological approach developed for the definition of urban patterns of recurrent open spaces was based on a data exchange process between GIS-based tools (Figure 3), parametric tools for the simulation of microclimatic behavior and the selection of indicators useful for reading and classifying the heterogeneous urban morphologies within the different urban patterns that characterize Italian cities. The articulation of the methodological process has been structured according to a sequence of phases:
  • Identification of generic urban patterns from scientific literature;
  • Generation of an abacus of typical urban patterns capable of describing the morphology of urban patterns of Italian cities;
  • Development of a classification system based on the physical-dimensional, quantitative and qualitative characteristics of open spaces;
  • Selection of a system of indicators capable of describing and parameterizing the complexity of the urban morphology of the reference cities;
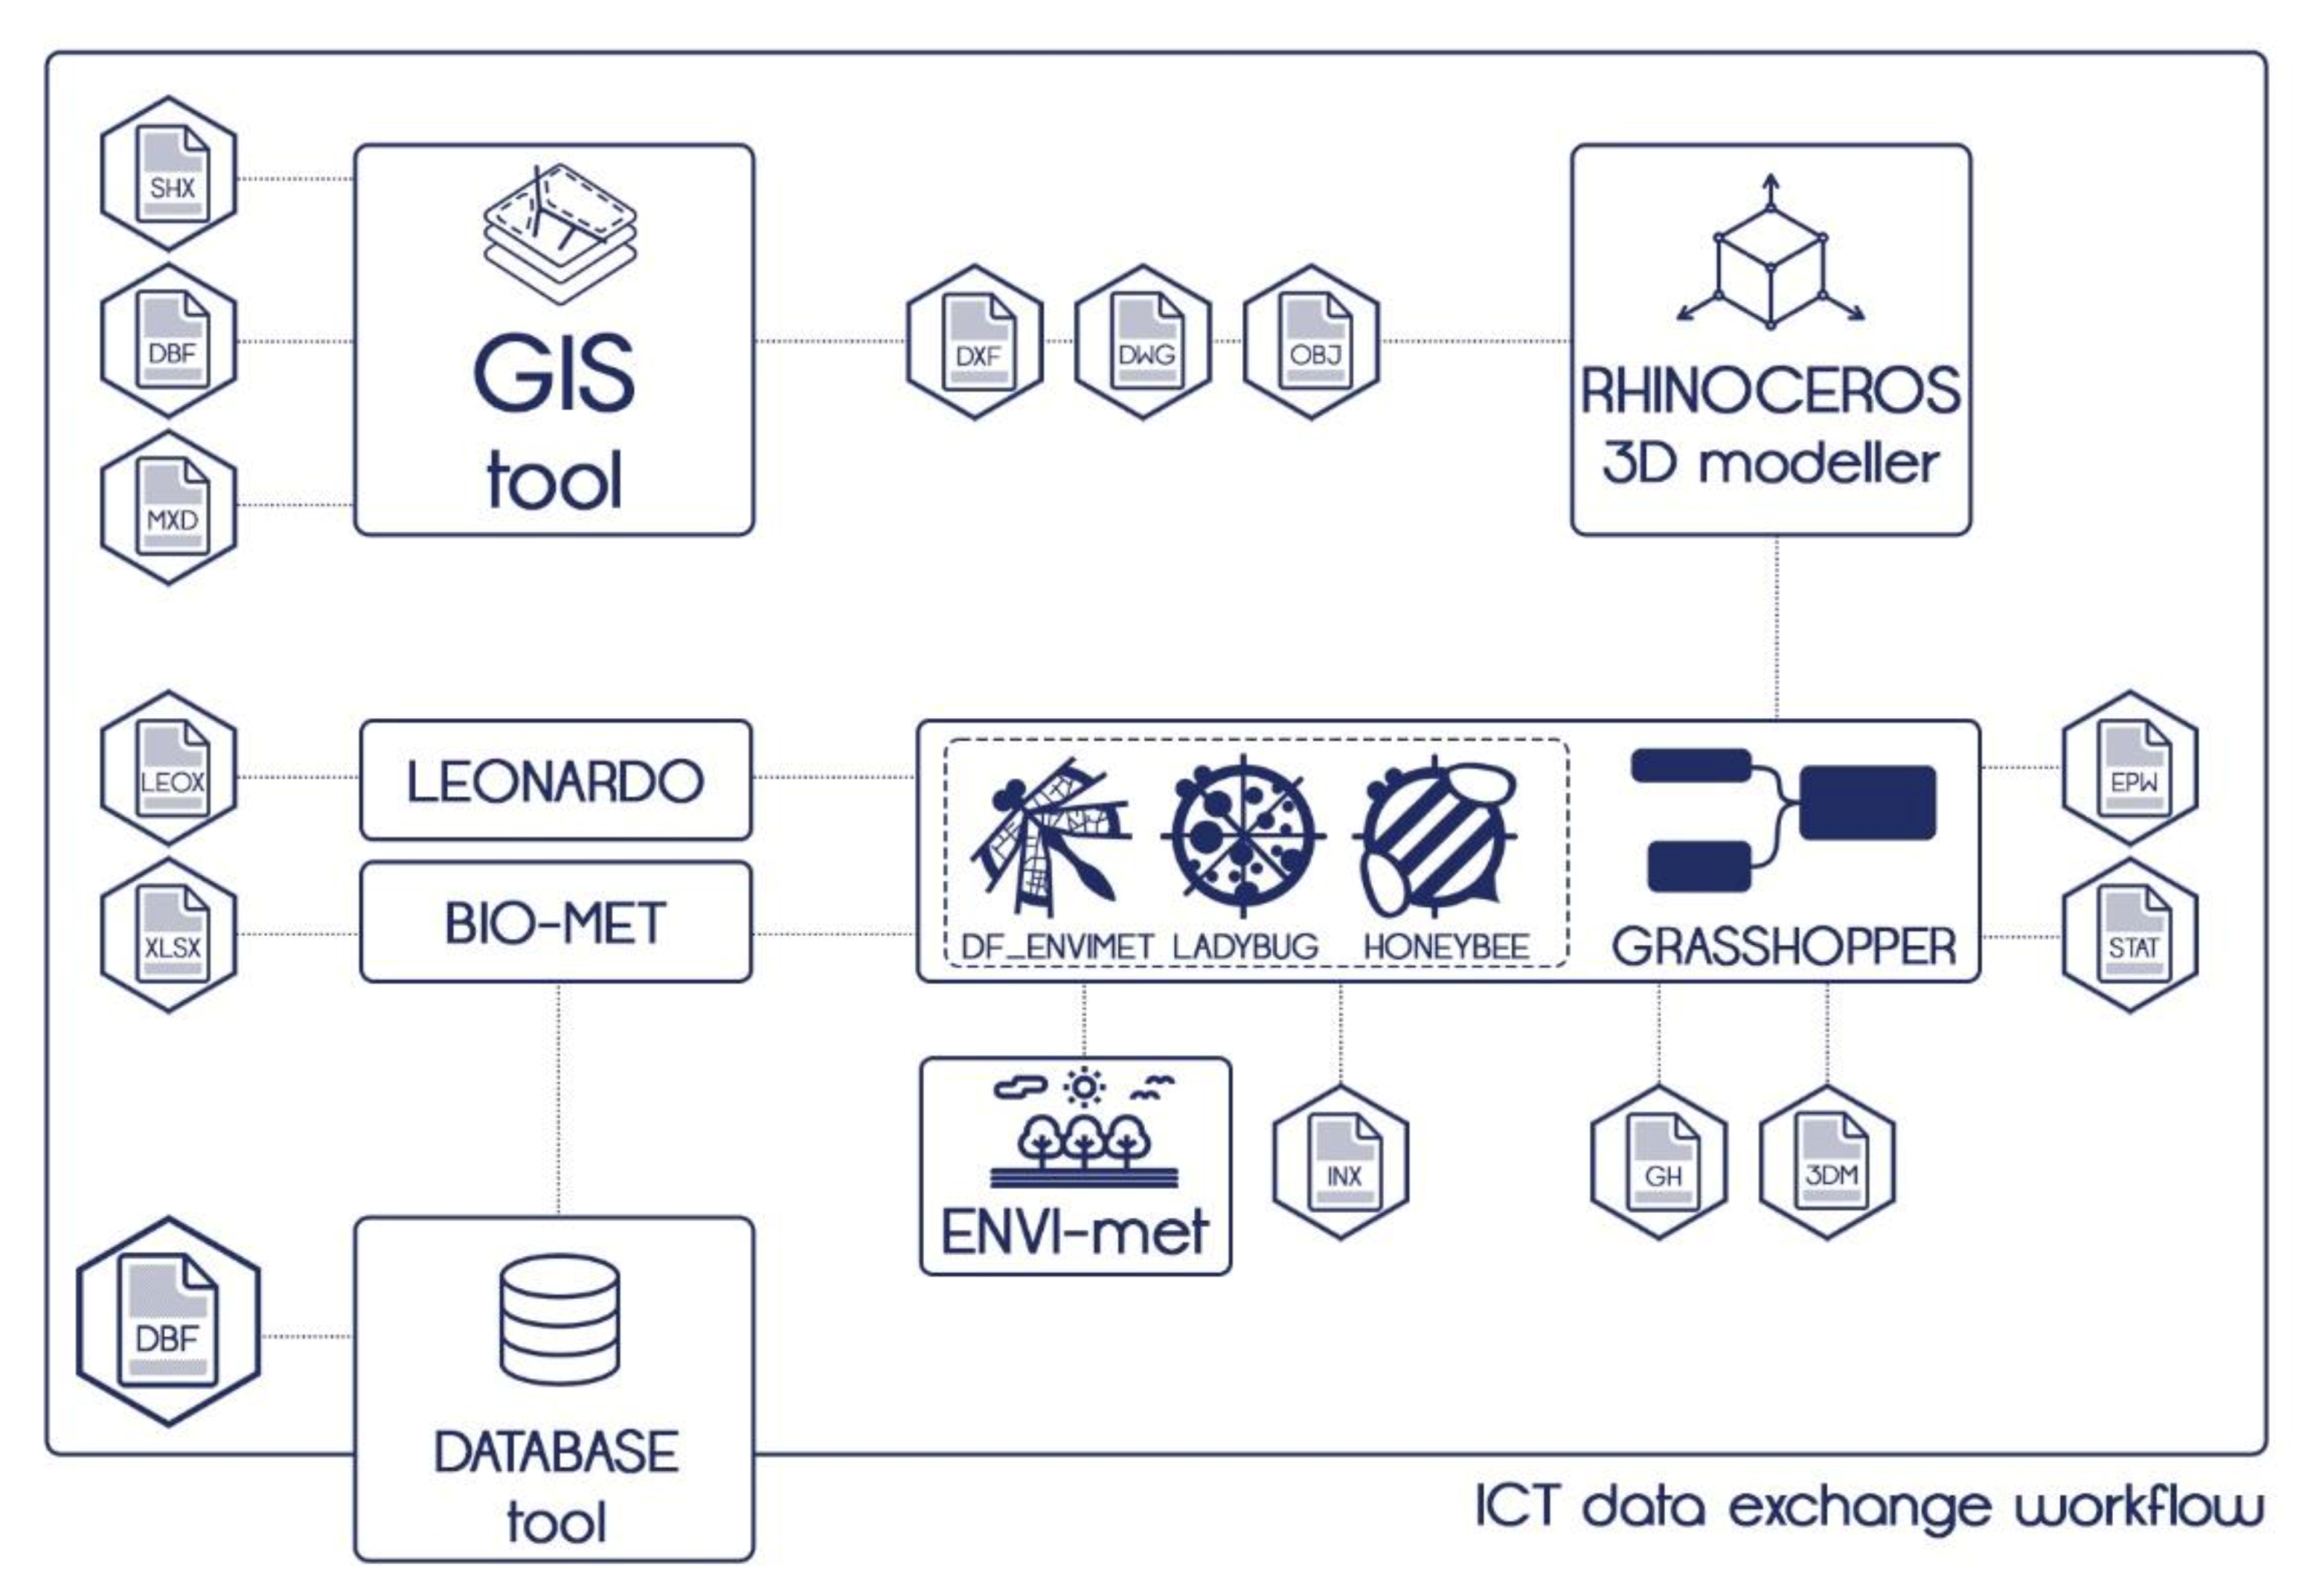
  • Comparison of environmental and microclimatic performance between real urban patterns of Italian cities and urban patterns typical through testing and verification operations through data exchange between GIS-based and parametric design tools;
  • Process of verifying the accuracy of extrapolated data according to the system of real and typical urban patterns.
The aim of the process is both to obtain the analysis of the performance behavior of recurrent and peculiar types of open spaces, whose output data can be associated with real urban patterns and to define aspects of environmental criticality and the possibility to verify afterwards the efficiency of the application of technical solutions and climate-adaptive design actions categories.

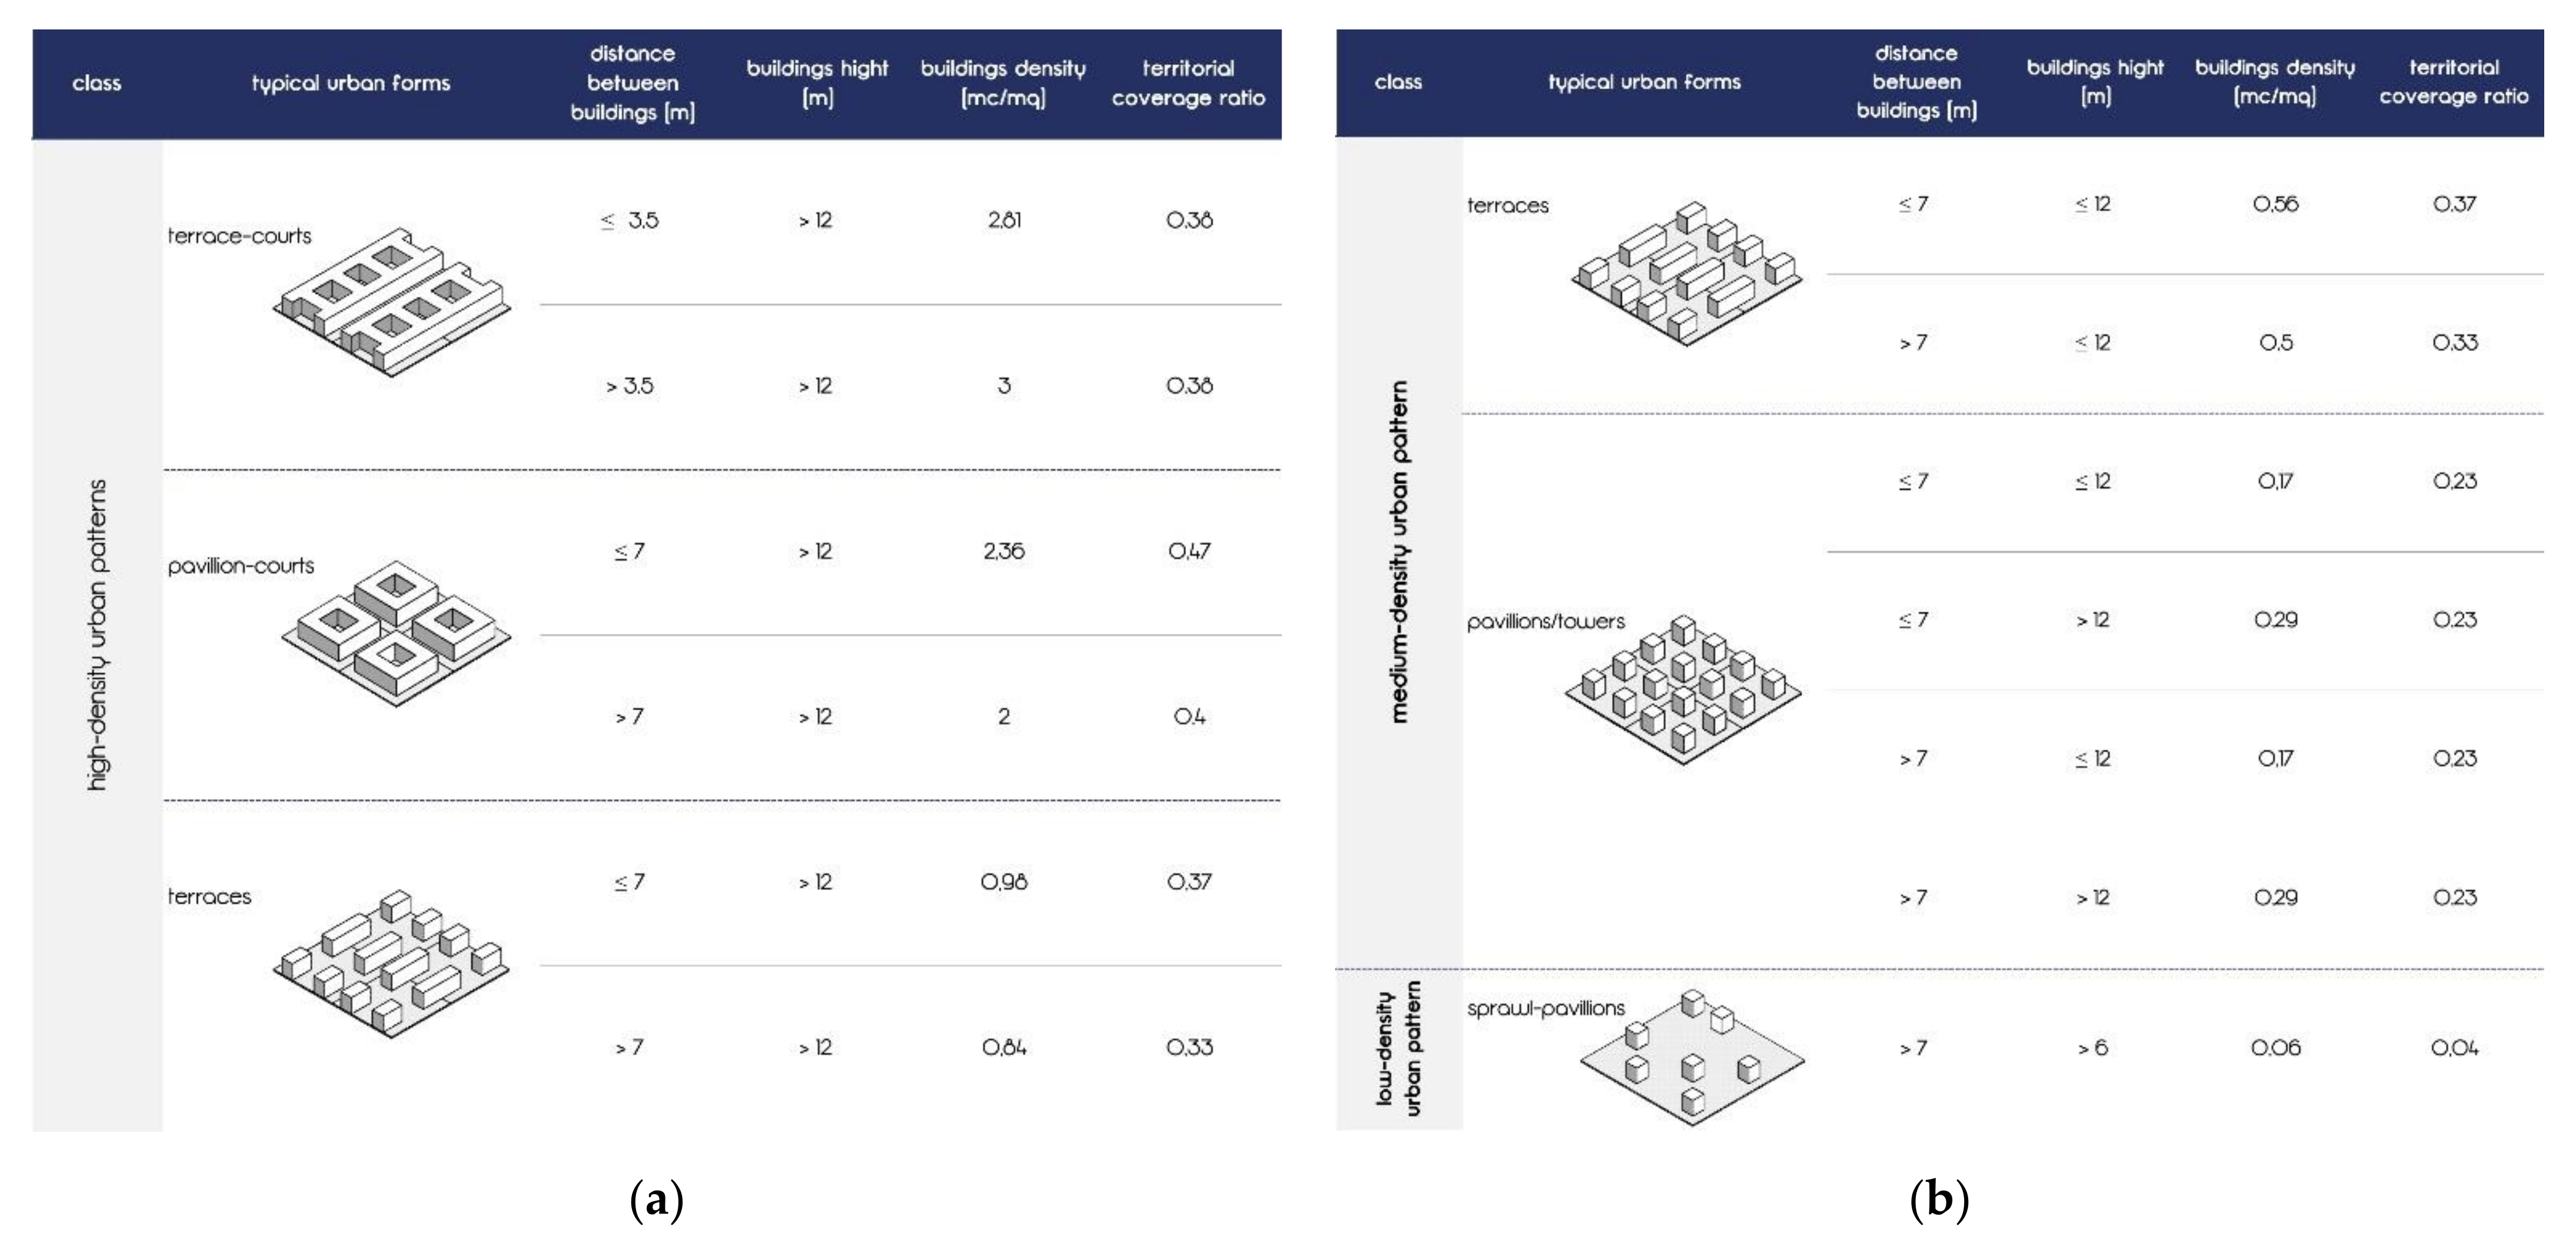
2.3.1. Typical Urban Patterns

Based on the existing scientific literature on the abstraction of urban patterns, reference was made to the studies carried out by Carlo Ratti [46], which follows the research conducted in the 1960s by Leslie Martin, Lionel March and other scholars [45], who had analyzed the question of urban pattern in relationship with land use. Martin and March had identified, analyzed, and compared different archetypes of urban patterns, and then were taken up by Ratti, who reassessed them in environmental terms, addressing their relationship with the climate, analyzing these generic urban patterns through raster image processing techniques and a series of indicators for the description of urban geometry, such as the sky view factor or shadow density [46], highlighting the relationship between different urban configurations and environmental behaviors.
The choice to adopt models of recurrent urban patterns as descriptors of the urban morphology of the Italian cities considered is finalized to limit the complexity of urban patterns in the reality and to be able to analyze and subsequently compare the environmental impacts on the different types of geometry and urban morphology among the increase in urban temperatures and the phenomenon of heatwaves. For this classification, it has been hypothesized to use urban patterns that consider the archetypes of urban patterns (Figure 4), to be able to construct geometric models representative of the different urban morphologies based on dimensional ratios [62,63] typically described and presented within the chosen representative cities.

2.3.2. Classification of Typical Urban Patterns

The definition of urban patterns took place by combining the information inferred from the scientific literature [45,46] and an analysis of the typical dimensional ratios of the urban morphology of Italian cities [64], as well as from phases of interpretative reading, comparison, and testing of recurrent morphological characteristics (Figure 5).
For the definition of urban patterns, a first typological classification of spaces has been carried out:
  • Urban patterns;
  • Squares and open spaces;
  • Green areas.
A subclassification has been defined for each category. Urban patterns are divided according to the different types of aggregation of buildings such as:
  • Terrace-courts;
  • Pavilion-courts;
  • Terraces;
  • Pavilion/towers;
  • Sprawl-pavilion.
As discriminants for their classification the following were considered:
  • The distance between buildings [62,63];
  • The buildings height [62,63].
The further classification was carried out through:
  • The building density (cum/sqm) [52];
  • The territorial coverage ratio [53].
This procedure leads to the definition of a sub-classification:
  • High-density patterns;
  • Medium-density patterns;
  • Low-density patterns.
A different classification was made for the squares and the open spaces, for which the following were taken into account as classification factors:
  • The buildings perimeter percentage (BPP);
  • The buildings height (m).
Finally, a classification for green areas was necessarily adopted to highlight the different characteristics as eco-systemic value [25,65], with a dual classification. First, these were classified according to the percentage of tree cover and the type:
  • Agricultural green;
  • Uncultivated green;
  • Urban green;
  • Wooded areas.
Subsequently, a subdivision was made which classified the green areas according to the tree cover percentage (TCP) into:
  • Medium green areas (0 < TCP ≤ 25%; 25% < TCP ≤ 50%; TCP > 50);
  • Green areas (TCP ≥ 90%).
The proposed classification considerations denote the importance of correct identification of the recurrence characteristics of urban open spaces, suggesting how seemingly similar areas can have a dissimilar influence on micro-climatic conditions, but also on urban metabolism, certainly influenced by boundary conditions [66], just as the types of available solutions in terms of mitigation and adaptation [67,68,69,70] may be different.

2.3.3. Definition of an Indicators System for the Urban Morphology Description

The need to verify the accuracy between the different simulation processes has guided the study toward the definition of operations to compare environmental and microclimatic performance between real urban patterns of Italian cities and typical urban patterns through testing and verification operations of data exchange between GIS-based tools and tools for parametric design. This operation led to the construction of a set of indicators capable of describing and parameterizing the complexity of the urban morphology of the reference cities. These indicators were chosen within the GIS processes already used in the earlier phases of the project for the determination of the climate vulnerability model of the physical system [1,71,72], such as:
  • The relationship between the built-up area and empty spaces;
  • The average height of the buildings;
  • The sky view factor;
  • The hillshade.
A process of comparison, simulation, and data exchange between GIS-based tools and parametric tools in the Grasshopper environment to obtain homogeneous outputs between the different ICT tools according to the system of indicators was conducted (Figure 6). In this way, portions of real patterns of the city of Naples classified based on heterogeneous characteristics and capable of describing the existing morphological variety (width of the roadway, the distance between buildings, the average height of buildings, type of aggregation, presence of open spaces or green areas, etc.,), were associated with generated recurrent urban patterns, for which the corresponding values of the indicators of urban morphology chosen were identified. Urban patterns, both real and recurrent, have been enclosed within a dial sized 100 × 100 m, also to effectively size the models of typical urban patterns and to easily carry out simulation operations.
Following the selection of morphologically heterogeneous areas, the verification of accuracy among the outputs of the indicator system in the different ICT environments has been divided into phases:
  • Association of the corresponding generic urban pattern;
  • Calculation of data on the classification parameters of urban morphology for real areas identified through GIS processes;
  • Elaboration of a 3D model in a parametric environment corresponding to the real one starting from the dimensional information contained within the processed GIS model;
  • Calculation of indicator values, comparison of indicator data between GIS model and parametric model, and determination of accuracy;
  • Elaboration of a 3D model in a parametric environment based on the model of the corresponding generic urban pattern and the parameters of the dimensional parameters extracted from the GIS model;
  • Calculation of indicator values, comparison of indicator data between the parametric model based on real dimensional characteristics and the parametric model, and determination of accuracy.
The 3D models in the parametric environment and the corresponding values of urban morphology indicators were obtained through the use of LadyBug a Grasshopper’s plug-in, replicating the calculation processes implemented in the GIS environment, through the definition of generative algorithms.
In the different operations of comparing the outputs of the indicators obtained for the different models of urban patterns generated in different software environments, and with different purposes, a maximum margin of error of 35% was taken into account, which made it possible to verify the correctness in the generation of generic urban patterns.

2.4. Analysis of the Microclimatic Behavior of Recurrent Open Spaces

For the determination of the ability to adapt to the phenomenon of heatwaves in the urban environment of urban patterns of recurring open spaces, a process of simulation and analysis of microclimatic behavior was conducted with ICT tools on the six sample cities chosen to represent the climatic variation within the Italian territory.
To evaluate the performative response to the extreme summer climatic stresses of cities open spaces due to climate change and therefore the degree of adaptation, it was chosen to use both PMV (predicted mean vote) [73] and the air temperature (°C) as indexes to evaluate the feeling of perceived outdoor thermal comfort [74] by users based on the morphological, environmental, thermal, and physical characteristics of the materials that make up the urban space.
The simulation process for determining the calculation of thermal comfort within recurrent urban patterns was carried out both for the current climate scenario and a forecast medium-term climate scenario (2050s) through EPW climate files [57,75] for the six representative cities, and the morphing to 2050s of these [59,61], using 15th of July as the simulation day (it is an expression of the average data collected for a heatwave event on The Italian territory), and extracting the data relating to 12:00 p.m. The assessment of the satisfaction degree within an open space under heatwave conditions was calculated both for an individual considered standard (man, height 175 cm, 75 kg, 35 years, clothing value: 0.70) and for individuals considered representative of the so-called weak bands, an old person (man, height 165 cm, 65 kg, 75 years, clothing with clothing value: 0.70), and a child (man, height 141 cm, 30 kg, 8 years, clothing with clothing value: 0.40).
Also, the simulation processes, in addition to the PMV and air temperature (°C), allowed to extrapolate the relative values of greenhouse gas concentrations, expressed in ppm (particles per million). The latter will allow returning a reading of the potential for reducing CO2 concentrations that climate adaptation solutions will be able to guarantee in absolute terms, considering that ENVI-met software is configured with a starting value of 400 ppm [76,77,78,79], maintaining this value also for medium-term simulations. In this sense, the outputs of the potential levels of reduction of CO2 concentrations should be read as an alteration related only to the increase in temperatures and will allow observing the absolute increase and/or reduction about the default value of 400 ppm.
The simulation and analysis process was carried out using the ENVI-met 4.4.5 microclimatic simulation software, which combines the three-dimensional model of an urban area with the simulation of the physical behavior of the present elements and determines their interaction with environmental components. The construction of the three-dimensional model was carried out through the use of Rhinoceros software and the Grasshopper’s plug-in, df_envimet [80]. The use of these extension has reduced the time required for the construction and simulation process of the three-dimensional models associated with the generic identified urban patterns.

2.5. Definition of a Recognition Process of Recurrent Urban Patterns

A process for the recognition of recurrent urban patterns of urban open spaces was developed in a GIS environment as a result of the definition of the morphological characteristics of recurrent urban patterns and the analysis of environmental performance in climatic conditions. The experimentation of this procedure was tested on the sample city of Naples and represented the starting point for the next generation of maps related to the adaptability of urban open spaces considering as a benchmark the perceived outdoor comfort (PMV).
The first operation consisted of the recognition of urban morphology and the automated association of recurrent urban patterns. This operation was carried out by calculating the density parameter of the built environment, calculated as a built volume (in cubic meters) on the unbuilt area (in square meters), obtained from the thematic classifications of the built and open space contained in the topographic database (DBT) and, subsequently, associating the corresponding value obtained by the classification of recurring urban patterns, calculated through the area and height values of the buildings present in the digital surface model (DSM) and the digital terrain model (DTM) of the city of Naples.
To obtain the density parameter of the built, starting from the atomic unit of the census section, the parameters of the building average height and the value of the covered area enclosed within the different polygons of buildings were calculated, as well as the percentage values of the surface treated to green were defined.
From the product of the area and height of the buildings was obtained the calculation of the attribute “Volume” of the buildings.
Subsequently, through an operation of “intersect,” it was possible to intersect the polygons of the buildings with the polygons of the census sections and, following a summarize operation, it was possible to associate the average value of the volume with the census sections. Finally, knowing the volume and surface area of the census section, the density of the building (D) was calculated, expressed as the ratio of the building’s volume (cum), to the extension (sqm) of the census section.
The data on the density of built by census section have been sorted according to the thematic classification given in Table 1.
The map (Figure 7) shows that the classification made only by density cannot be exhaustive of the association of census sections with urban patterns, as it is not able to consider the green areas. It was necessary to supply the classification with a sub-classification taking into account the percentage of land use by the elements constituting the census section.
The first sub-classification was carried out to identify the census sections with a prevalence of green-treated areas. For this purpose, a “training set” operation was carried out by a testing phase on a group of sections whose type of surface treatment and building density are known, through which it was possible to define the classification of “green areas” for those census sections that had an area occupied for at least 80% by vegetation (trees, meadows, uncultivated greenery, etc.,), while those census sections whose area was 55% to 80% were classified as “medium green areas.”
A further sub-classification concerned areas with a density greater than 17 cum/sqm, which had very tall buildings. Analyzing an area known with buildings of above-normal height, those census sections were defined as census sections belonging to the “medium dense fabric,” first classified as very dense fabric, the soil of which is however occupied only up to 55% by the surfaces of buildings.
Besides, a sub-classification of the percentage value of green surface within the census section obtained through the intersection with the green areas layer within the topographical database (Figure 8 and Figure 9) has been integrated into this classification.
The data obtained show how, through the generation of classification processes focused on the building density that includes the presence and prevalence of areas treated as green, it is possible to identify the type of urban patterns prevalent within clusters of information represented by the census sections and, only later, to be able to associate with it the data obtained from the processes of simulation of the environmental and microclimatic behavior of open spaces, to obtain maps on the adaptability and mitigation of urban patterns in cities.

3. Environmental Performances of Urban Open Spaces

The process of recognizing and associating recurrent urban patterns within existing urban patterns has made it possible to identify the type of morphologically homogeneous characteristics of open spaces. This made it possible to identify, through subsequent work of analysis of environmental performance, their performance behavior in warmer climatic conditions. The development of microclimatic simulations for each of the types of recurrent urban patterns identified for the six sample cities and in the two climate scenarios, 2000s and 2050s, provided data on environmental performance both for the urban patterns considered and for the types of open spaces they determine.
In particular, regarding the case study of the city of Naples, environmental analyses have shown for each of the generic urban patterns identified an overall situation of discomfort, read through the outputs of the PMV and air temperature index (°C), both for an adult and for vulnerable individuals (old people and children). The recorded values always fall under the conditions of “hot” or “very hot” depending on the climatic scenario (Table 2).
Similar results have been recorded for all other climatic macro-regions, where the discomfort condition stands on a widespread condition of “hot” or “very hot,” with more favorable conditions in the Alpine Area, where there is a feeling of “moderate heat,” and in Northern Central Italy, where the feeling is only “warm.” Values of “extremely hot” were recorded for the Insular Area and Extreme South-Italy. In all climatic macro-regions, there is an aggravation of the feeling of discomfort when reading the results obtained for the forecast and medium-term scenario. Data comparison is shown for the case study of Naples (Table 3).
Based on the results obtained, it can be seen that users of Italian cities are subjected to high levels of vulnerability because, about heatwaves, microclimatic phenomena originate with effects both on the people’s health and on the use of open spaces, whether they are public or private since they are configured as spaces within the conditions that make them livable are denied.
The simulation process carried out for recurrent urban patterns, which saw the processing of more than 300 simulations, allowed to understand what was the corresponding performance behavior in the current and the forecast medium-term scenario in the different climatic conditions of the Italian territory, in response to the phenomenon of heatwaves. Through a process of data exchange of the results obtained from the parametric simulation processes, it was possible to generate, on the sample city of Naples, thematic maps related to the ability to adapt the physical subsystem of urban open spaces considering as a reference parameter the perceived comfort index (PMV), to identify the possible climate-proof intervention actions for the increase of urban resilience (Figure 10 and Figure 11).

4. Climate Proof Design Strategies for Urban Open Spaces

Based on the obtained results from the simulation of environmental and microclimatic behavior of recurrent urban patterns in heatwave conditions, which have focused on the high levels of vulnerability to which users in the city are subjected by the extraction of the corresponding data of PMV, air temperature (°C), and concentrations of CO2 (ppm), it can be seen that within the open spaces of Italian cities, although traced back to a type, can be created microclimatic conditions capable of influencing not only the use of open spaces but also ensuring that negative effects may occur for the health of the population.

4.1. Climate-Proof Intervention Categories for Open Space

To counter the rise in temperatures and the phenomenon of urban heatwaves, and at the same time to foreshadow possible scenarios of adaptation and climate mitigation for Italian cities, five categories of climate-proof interventions have been identified, that collect technical solutions deduced from similar experiences at the national and international level. These include the Urban Adaptation Support Tool [81], developed as part of the European Climate Adaptation Platform Climate-Adapt [82] as a support tool for the Covenant of Mayors for Climate and Energy [83] and development and implementation of local adaptation plans, which are found within consolidated international best practices.
The action categories for the climate adaptation of open spaces are divided into:
  • Greening. The inclusion of elements such as trees, rain gardens or small flower beds, and green areas [84] helps to reduce greenhouse gases emissions (GHG) [85] and can increase the livability of cities. Planting trees on roads, squares, and parking lots creates shade and activates evapotranspiration phenomena [86], having a positive effect on the reduction of urban temperatures, the impacts of the heatwave and consequently the effect of the urban heat island [48,85,87,88,89].
  • De-paving. The removal of waterproof layers of horizontal urban surfaces to introduce permeable or semi-permeable flooring [90,91], with adequate thermal and physical capacities (albedo, roughness, emissivity, and technical conductivity) [92,93], allows urban surfaces to keep their temperatures lower, owing to the possibility of penetrating water into the sub-paving layers [94,95] together with the physical properties of the materials used for paving.
  • Shading. To reduce the thermal impact of solar radiation and reduce the phenomena of glare and immediate transmission of thermal energy from urban surfaces [83], the use of tensile structures and pergolas with reflective technical textiles to increase efficiency in response to the thermal load, but also natural elements such as tree-lined and covering climbing essences, contribute to the creation of shadowed areas and reducing the heating of horizontal and vertical urban surfaces [96].
  • Water bodies. Pools, fountains, small ponds, ponds, water blades, and also jets, waterfalls, and sprayed water, the insertion of which within urban areas leads to a decrease in air temperatures [84,97]. Water can reduce the air temperature by evaporation, absorption, and heat transport. In addition to an integrated strategy for the effects of climate change, water bodies can also be used as collecting basins for rainwater [98].
  • Cool materials. Materials so-called cool [90], are characterized by high solar reflectance [99], obtained through the use of materials with light colors or surfaces treated with applied paintings [91,92,93], and also through the creation of materials within special reflective pigments of the infrared radiation and capable of maintaining the desired color quality [99]. The use of cool materials within the urban environment favors the reduction of temperatures in the city and allows to reduce the urban heat island effect [100,101,102].

4.2. Collecting and Systematizing Results in a Database

To rationalize and manage the information coming from the microclimatic simulations carried out and allow their rapid updating according to the hypothesis in which the forecasts on future climate scenarios should be perfected, a database has been created within the intervention categories identified for climate adaptation on the open space have been catalogued, with particular reference to the phenomenon of the heatwaves.
The creation of a database allows to efficiently consult the collected data and favors an easier consultation of the information contained within decision-making processes and analysis by stakeholders.
The database contains data relating to:
  • The six climate macro-regions defined by the PNACC with the reference cities;
  • The 25 recurrent urban patterns for each climate macro-region;
  • Information on the dimensional relationships of recurrent urban patterns (distance between buildings, buildings height, building density, territorial coverage ratio);
  • Information on the size ratios of recurring urban patterns of squares and open spaces (buildings height, perimeter percentage);
  • Information on green areas (category, percentage of tree cover);
  • The values of urban morphology indicators for each of the recurring urban patterns (full-empty ratio, average height, sky view factor, hillshade);
  • The values of PMV, CO2 concentrations, air temperature (°C) of recurrent urban patterns about current climatic conditions and climatic conditions as of 2050s;
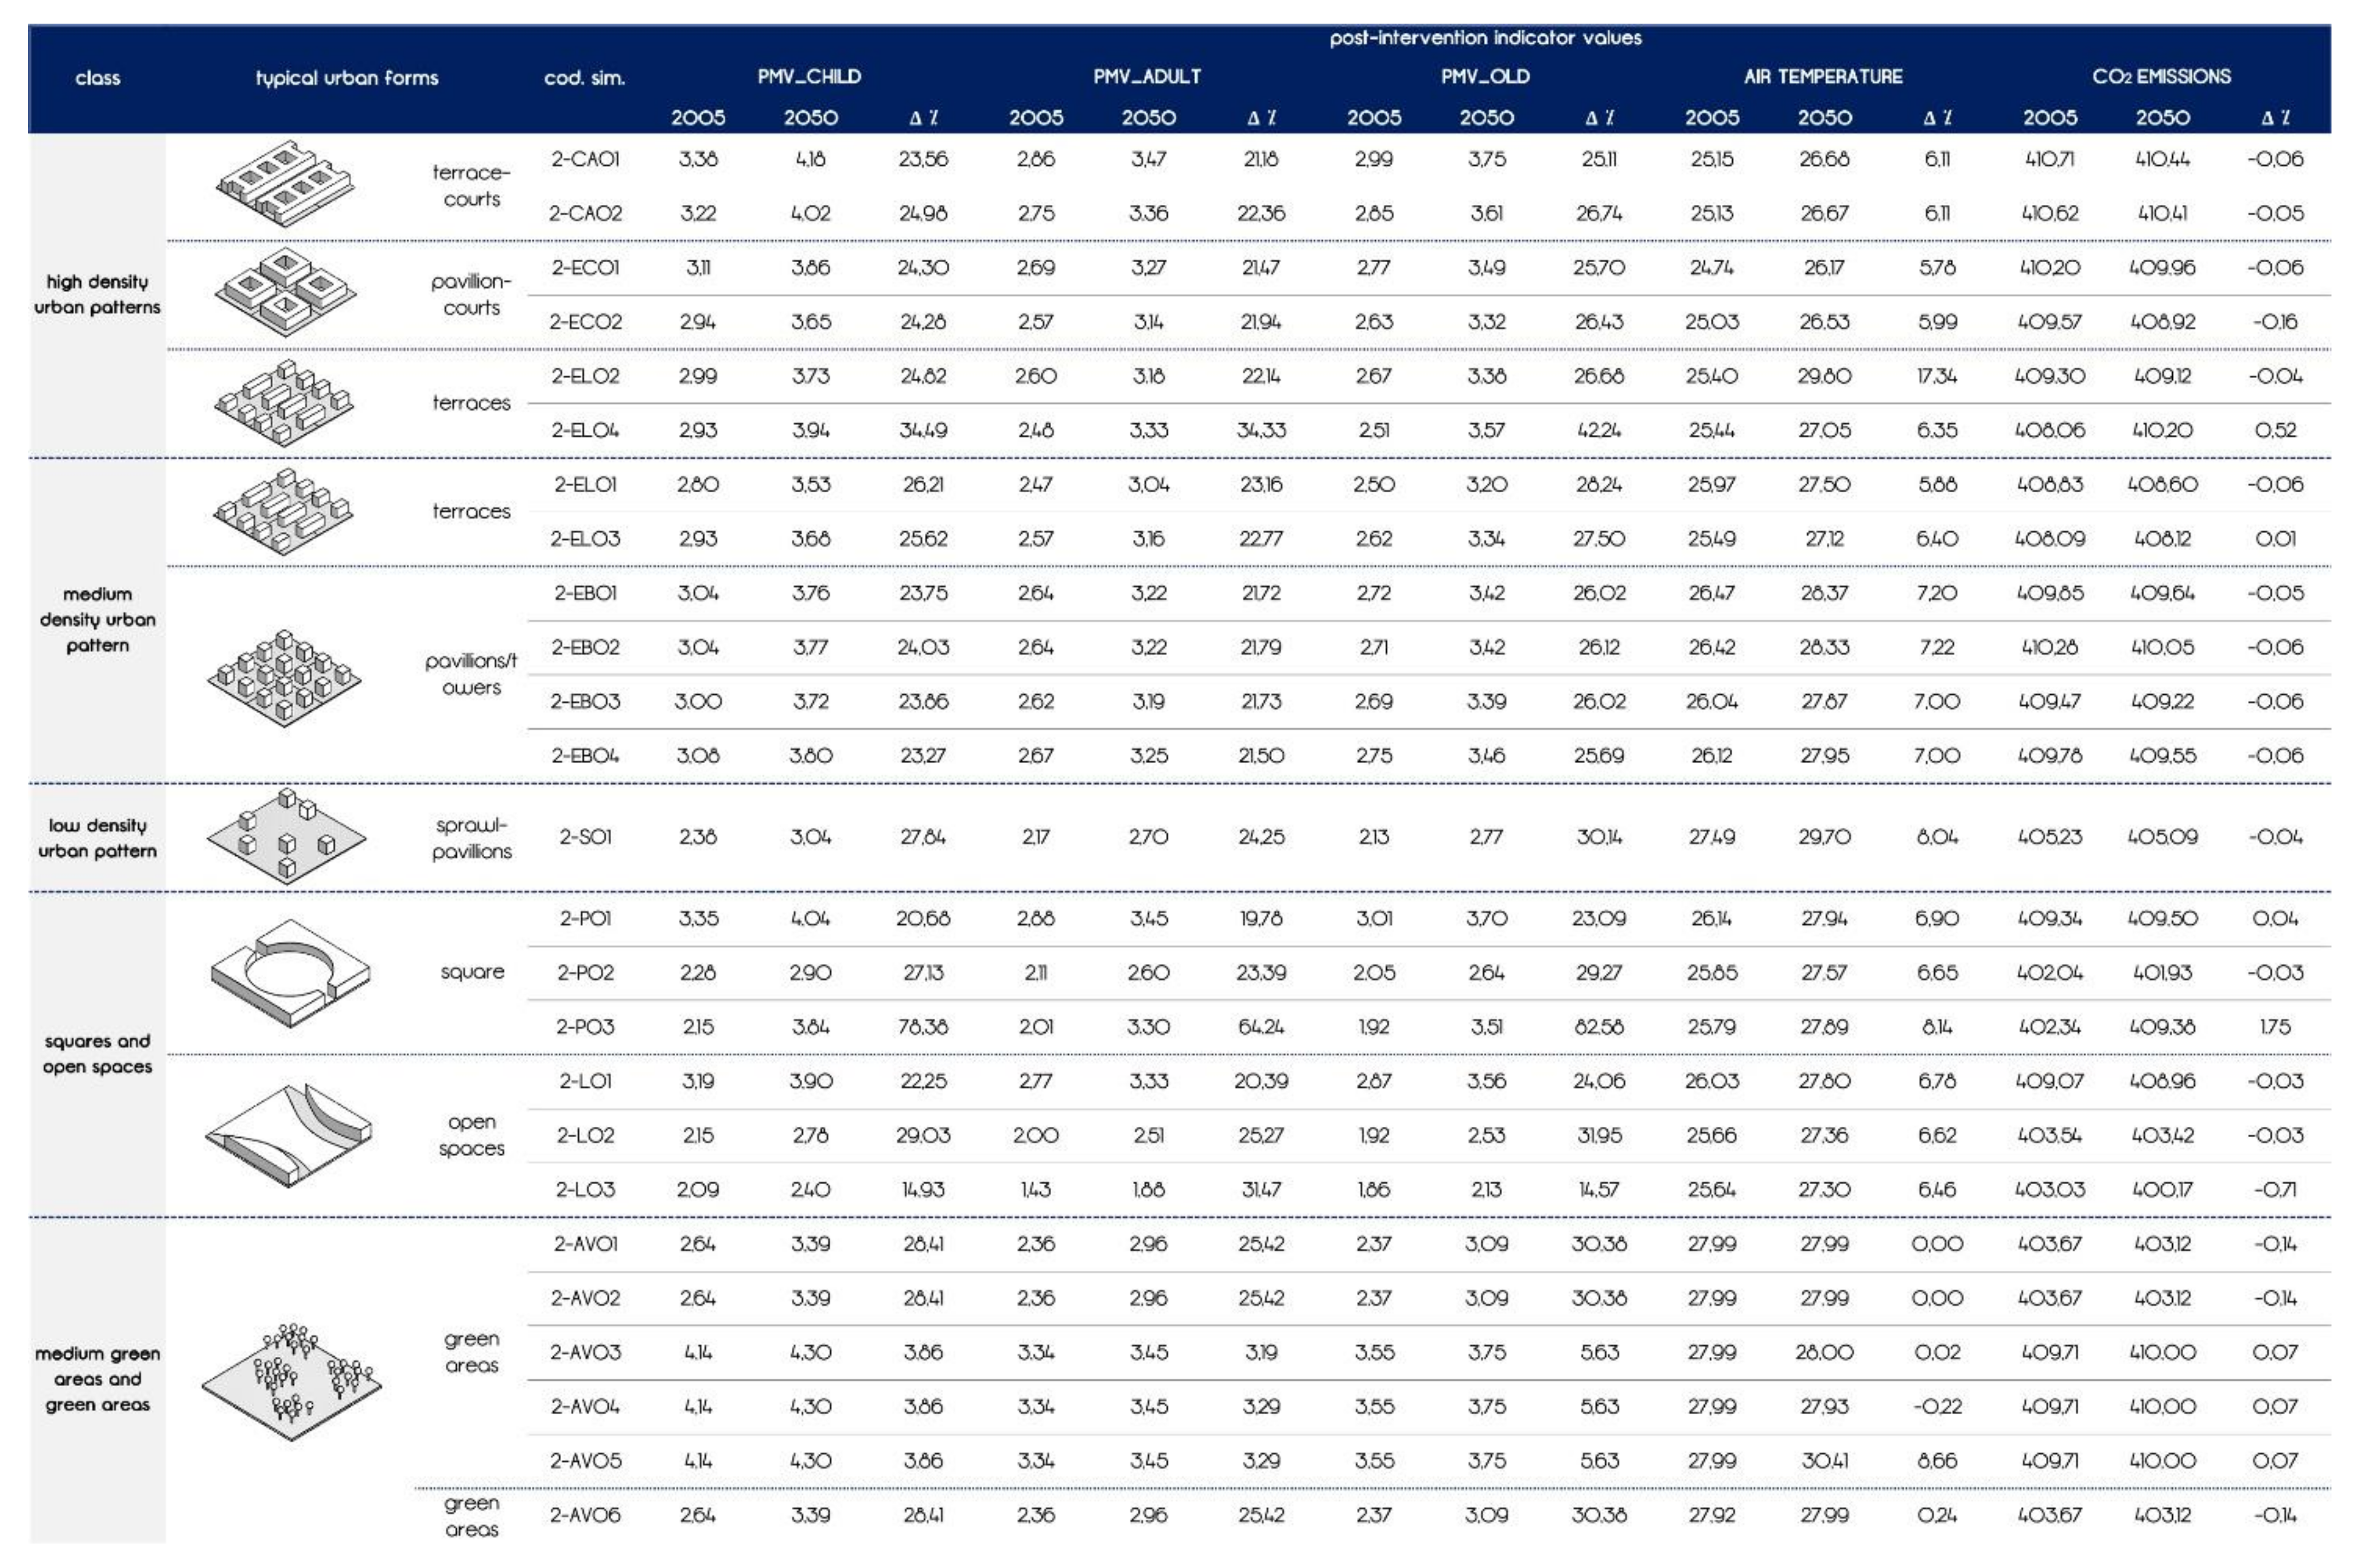
  • The values of PMV, CO2 concentrations, air temperature (°C) of recurrent urban patterns following the application of the intervention categories for climate adaptation about current climatic conditions and climatic conditions as of 2050s;
  • The values of PMV, CO2 concentrations, air temperature(°C) of recurrent urban patterns following the overall application of the intervention categories for climate adaptation about current climatic conditions and climatic conditions as at 2050s;
  • The percentage reduction values of PMV values, CO2 concentrations, air temperature (°C) of recurrent urban patterns following the application of climate-proof intervention categories calculated with current climatic conditions and climatic conditions as at 2050s;
  • The percentage reduction values of PMV values, CO2 concentrations, air temperature (°C) of recurrent urban patterns following the overall application of climate-proof intervention categories calculated with t current climatic conditions and climatic conditions as at 2050s.

4.3. Database Structure

The construction of an information database containing the results of climate-proof intervention categories for recurring open spaces (Figure 12) is structured into six sections, in which the set of simulation output data collected the outputs of simulations downstream of the application of the five intervention categories and the combination of them into current climatic conditions and 2050s.
Within the database, simulation data for each of the sections related to the intervention categories and their combination collect data on:
  • Indication of the climate macro-region;
  • Classification of recurrent urban patterns;
  • Recurrent urban pattern and simulation code;
  • Output simulations under current conditions (PMV adult, PMV child, PMV old people, air temperature, CO2 concentrations);
  • Output simulations under medium-term forecast conditions (PMV adult, PMV child, PMV old people, air temperature, CO2 concentrations);
  • The percentage difference between 2000s and 2050s term outputs (PMV adult, PMV child, PMV old people, air temperature, CO2 concentrations);
  • The percentage change between current conditions and application of intervention categories 2000s (PMV adult, PMV child, PMV old people, air temperature, CO2 concentrations);
  • Percentage change between current conditions and application of intervention categories 2050s (PMV adult, PMV child, PMV old people, air temperature, CO2 concentrations).
Besides, the open space database has an additional section within the associated code and the extent of the solutions related to the applicability within the recurring urban patterns and the corresponding classification of the urban density.

4.4. Experimental Database Usage Activities with Climate-Proof Technical Solutions for Climate Adaptation of Recurrent Open Spaces: Testing, Verification, and Simulation Process

The experimental activity for the use of the database of technical solutions aimed at the implementation of actions for the urban regeneration of recurrent open spaces for climate adaptation is based on the re-proposal of a testing and verification process through recursive microclimatic simulation operations carried out with the use of ICT tools already introduced within the developed methodology.
To evaluate the possible scenarios capable of acting on improving the outdoor comfort of the open spaces of Italian cities, and based on the data that emerged from the simulation of the microclimatic behavior of the recurrent urban patterns in the six climatic macro-regions both for the current climatic conditions and for the climatic conditions at 2050s, it was chosen to test and verify, through a meta-design application, the degree of applicability and performance response that the groups of intervention categories identified can ensure a concrete contribution to climate adaptation in the urban environment about the heatwave phenomenon.
Following the determination of the degree of total and partial applicability of the climate-proof intervention categories (Figure 13), the simulation process of more than 1800 processes has been initiated, which have determined, for each of the recurring urban patterns in each of the climatic macro-regions and the different climatic scenarios, the achievable performance levels expressed through the PMV index, air temperature (°C), and CO2 concentrations (ppm).
Following the execution of simulations in which climate-proof actions of a meta-design type are applied, it has been observed that these can return a different behavior from time to time about the morphological and technological-environmental specifications of the recurring urban patterns associated with the different parts of the cities analyzed, resulting in a substantial difference in performance on the micro-climate and environmental level.
The experimental application of the categories within the urban patterns representative of the identified open spaces has made it possible to obtain useful information to understand, to a greater extent, what are those characteristics of open spaces and actions that influence the perception of comfort, air temperature, and climate-changing gas emissions and also, to what extent these can be introduced in the urban environment to achieve adequate performance levels during periods of increased thermal stress, particularly during heatwaves.

5. Results

The recursive simulation process, as described in paragraph 3.4 has made it possible to test and verify through the meta-design application of climate-proof solutions, both their degree of applicability, and the potential offered performance response in different contexts.
The reading of the output data has made it possible to identify those aspects of greatest criticality detectable in the different morphological and climatic-environmental contexts in a representative condition of thermal stress, allowing to structure models of meta-design through the application of the climate-proof intervention categories identified, first single and then combined (Figure 14).
From the entire simulation process applied to the different urban patterns recurrent in all climatic macro-regions, it is possible to deduce general guidelines for the application of categories of intervention aimed at urban regeneration adaptive climate in response to the increase in urban temperatures, such as:
  • Greening. The insertion of plant elements contributes significantly to the improvement of outdoor comfort owing to the generation of shadows that reduces the thermal load on the ground. In particular, in low-density contexts, where the distances between buildings are greater, the contribution of the insertion of rows of trees substantially compensates for the morphological conditions more favorable than high-density urban patterns. Besides, the definition of small green areas, such as rain gardens or flower beds, contribute to the improvement of comfort owing to the reduction of non-natural surfaces and the triggering of evapotranspiration phenomena. In general, where it is possible, i.e., in urban patterns with medium and low-density factors, the insertion of green percentages of more than 60%, guarantees an improvement in the perception of comfort for all categories of users up to a percentage of between 5% and 30%, while in high-density patterns, where the percentages of insertion of urban greenery are low (3–15%), the improvement in comfort levels does not exceed 15%.
  • Cool materials. From the results obtained by the simulated apparatus, the insertion of materials with a high reflectance of solar radiation records contrasting data. In fact, despite a significant reduction in air temperature, the solution has led to an increase in perceived discomfort. This phenomenon can be traced back to the negative action produced by solar radiation immediately reflected in the environment [97]. Through testing actions, it has come to the definition that the materials inserted in the simulation processes, should have albedo factors between 0.40 and 0.50, profiling an average clear flooring. This parameter was combined with high emissivity values (0.98) and a roughness factor of 0.010, as well as the thermal conductivity of the material of 2.00 w/mk. The results of the simulations show two aspects, the first relating to a substantial difference for the different tissues. When in the most compact patterns (high density), the use of cool materials produces a worsening of the conditions of perceived well-being, a phenomenon that occurs due to the increase in reflections of solar radiation between horizontal and vertical surfaces of buildings, trapping radiation within urban canyons [97]. As the urban fabric becomes less dense, the effect of cool materials is positive. The second aspect is the difference between the categories of users. Old people and children suffer most from the negative effect of cool materials within dense tissues, while the contribution of these in less dense contexts guarantees them greater benefits.
  • De-paving. The increase in the permeability of horizontal urban surfaces allows keeping surface temperatures low, owing to the penetration of water into the sub-paving layers and the combination of thermophysical characteristics of cool materials. Experimentation with the use of permeable materials with albedo values between 0.40 and 0.45, emissivity between 0.90 and 0.93, roughness between 0.016 and 0.010, and hydraulic conductivity of 35 m/s × 10−6, has shown that the de-waterproofing of horizontal urban surfaces guarantees an improvement in comfort in all morphological conditions of between 15% and 20%.
  • Shading. The strategy of using shading elements aimed at reducing the solar thermal load and reducing the phenomena of glare and re-entry of thermal energy from urban surfaces is an effective solution, in fact, in medium and low-density contexts and squares and open spaces, the average contribution on the reduction of PMV is between 10% and 20%, while in compact patterns, where the insertion of shading elements is limited by urban morphology, the contribution does not exceed 5% reduction in absolute values of perception of comfort.
  • Water bodies. From the insertion of water bodies within the built environment, simulated only within squares and opens spaces, it emerges that the contribution in terms of performance improvement is widely influenced both by urban morphology and by their positioning in the direction of the prevailing summer winds. In squares and open spaces that have buildings at the perimeter of reduced height, winds flow into them and, lapping the surface of the water, lowers the surrounding temperatures with adiabatic cooling actions. On the contrary, with taller buildings creating a barrier effect, the action of the wind is braked or prevents them from penetrating.
  • The combination of the categories of intervention has led to heterogeneous positive results, which must be read and interpreted based on the ability of the different urban patterns to accommodate the solutions (Figure 15 and Figure 16 and Table 4).
In fact, within highly dense urban patterns, as is the case of the Historic Center of Naples UNESCO Site and the historical fabrics of the City of Naples and Italian cities, where it is not possible to intervene with high percentages of greening and shading, and sometimes where the use of permeable materials is not allowed, and also, where it is still not possible to resort to the use of water bodies, due both to the small size of the spaces and the conditions of legislative constraint ingrained and imposed to preserve its historical nature, the reduction of outdoor comfort has values between 5% and 20%. In contrast, in low-density patterns, squares and open spaces, high-performance levels have been achieved, resulting in a reduction in perceived comfort values of between 20% and 45% (Table 5).

6. Discussion

The objective that guided the definition of the methodological process for the analysis of the microclimatic behavior of recurring urban patterns of open spaces and the application of climate-proof intervention categories was to define guidelines for institutional decision-makers and designers, involved in the definition of site-specific interventions in the choice of the most appropriate design actions for the development of urban regeneration projects, to stimulate reasoning and awareness about the climatic and environmental phenomena that affect our cities (the increase in temperatures), and that is due to the occurrence of climate change.
The methodological apparatus developed, which has been based on the experimentation of an instrumental-simulation approach, is aimed to foreshadow models of knowledge and meta-design actions aimed at improving the perception of outdoor comfort in conditions of climate stress within the different urban contexts considered, in which morphology, density, climatic conditions, and microclimate were heterogeneous.
Among the aims of the research, there is the purpose of verifying the effective performance of the intervention categories identified for recurrent urban open spaces, capable of activating environmental processes for the improvement of outdoor thermal comfort in contrast to the increase in urban temperatures, both to the current scenario and the medium-term scenario, and achieved owing to the methodological-operational structuring of the instrumental-simulation approach.
Within the methodological process, the discrimination of building density allows to defining of those patterns of the city that are most intrinsically suited to the fight against climate change, and this also through the reduction of concentrations of climate-altering agents and the greater propensity to adapt, obtained thanks to a reduced vulnerability of urban systems [1] intended in its physical components and population. If in itself the compact and dense city represents an urban fabric intrinsically adaptive and capable of maintaining a microclimatic balance and resisting more to the rise of urban temperatures and heatwaves (Figure 15 and Figure 16), medium and low-density patterns show a greater propensity for climate-proof and adaptive oriented urban transformation and regeneration, where the margins for improvement, intended as a percentage deviation to the improvement of outdoor comfort and the reduction of high temperatures, are more significant (Table 5).
The final output, the structuring of guidelines on the meta-design application of climate-proof intervention categories, has the task of explaining the results, making them easily readable, interpretable, and immediately applied. The aim was either to foreshadow scenarios in which the urban project could be oriented toward a climate-adaptive design attitude to cope, both today and in the next future, with the increasing temperatures perceived in the city and the consequent increase in CO2 concentrations (Figure 17).

7. Conclusions

The settlement model of the contemporary metropolis is one of the main causes of the lack of environmental, social, and economic sustainability. This consideration leads to the definition of actions capable of reactivating those interdependencies between urban settlements and environmental characteristics, to the redefinition of urban habitats [103,104], in which the relationship between morphological characteristics and building density necessarily affect qualitative and relational aspects of the climate-oriented urban project.
To foreshadow urban regeneration scenarios capable of improving the microclimate of parts of the city with intrinsic benefits for citizens, the methodological process developed within the PLANNER project, gives back a cognitive framework on the adaptive capacity of urban fabrics of Italian cities.
High-density urban patterns, consisting of terrace courts, pavilion courts, and terraces, which mainly represent the historical fabrics of Italian cities, on the one hand, and to date can present resilience and intrinsic adaptive characteristics due mainly to both more favourable dimensional relationships [63], and relative to the construction systems used (e.g., load-bearing masonry with large thicknesses), on the other hand, they are conditioned in their ability to accommodate climate-proof design categories. Geometric factors such as the width of streets and squares and, more often administrative constraint conditions about the historical nature of city parts (e.g., the Historic Center of Naples UNESCO site), limit the use of climate-proof design categories such as cool materials and the creation of green areas and/or the insertion of trees and shading elements that preclude their ability to transform, therefore the degree of resilience achievable in forecasts of the increase in urban temperatures, making such interventions less effective in a systemic perspective of cities.
Concerning the adaptive capacity and the resilience of open spaces, the medium and low dense patterns, as well as the squares and open spaces, which at present have high criticalities in terms of environmental performance due to the increase in urban temperatures, represent in a systemic perspective of transformation ability of urban patterns of regenerative opportunities of strategic importance within the Italian cities. Most often, the absence of administrative constraints and the wider dimensional relationships of streets, squares, and open spaces, which can be considered today as critical issues, make these spaces more adequate for transformation. The meta-design activity on pattern types throughout these density categories has made it possible to verify how all the climate-proof design categories identified can be accepted and in a higher percentage than low-density patterns and also their combination can make open spaces highly adaptive.
Finally, the green areas, that already represent the elements of the city that most guarantee a better outdoor comfort perception during the summer season, will maintain these characteristics in the near future, as well as the medium-green areas, whose ability to accommodate transformation to increase the percentages of urban greenery, will represent those urban patterns with the highest capacity in terms of resilience and climate adaptation.
In the dissemination phase, such conditions and the data obtained for the open space system, as for the subsystem of buildings, will converge within a webGIS platform of SDSS type (Spatial Decision Support System), which will represent the final output of the project and which is configured as a decision support tool for the implementation of models for the assessment of the danger, vulnerability, climate impact, and mitigation and adaptation scenarios, through the creation of replicable maps throughout the national territory, capable of typologically mapping indoor and outdoor comfort conditions perceived.
The structuring of an intuitive and easy-to-consult tool will enable policy-makers and involved stakeholders in urban transformation processes to easily define the actions to be implemented in transformation processes on the urban-scale, introducing climate-proof strategies calibrated about different urban densities and, making it possible to foresee in the first place the improvement in the performance of the urban transformation action, operating as a tool for adapting to adverse environmental impacts due to the increase in urban temperatures and as a descriptor of the energy-environmental exchanges between buildings, open spaces, and the built environment.

Author Contributions

Conceptualization, E.B., V.D. and A.S.; methodology, E.B., V.D. and A.S.; software, E.B.; validation, E.B., V.D. and A.S.; formal analysis, E.B.; investigation, E.B., V.D. and A.S.; resources, E.B.; data curation, E.B.; writing—original draft preparation, E.B., V.D. and A.S.; writing—review and editing, E.B., V.D. and A.S.; visualization, E.B.; supervision, V.D. and A.S.; project administration, V.D.; funding acquisition, V.D. All authors have read and agreed to the published version of the manuscript.

Funding

This research was funded by POR CAMPANIA FESR 2014/2020, Asse 1-O.S. 1.1 “Incremento dell’attività di innovazione delle imprese”.

Institutional Review Board Statement

Not applicable.

Informed Consent Statement

Not applicable.

Data Availability Statement

Not applicable.

Acknowledgments

Authors thanks prof. Ferdinando Di Martino, Ph.D. candidate Sara Verde and arch. Umberto Gagliardi for their contribution.

Conflicts of Interest

The authors declare no conflict of interest.

References

  1. Apreda, C.; D’Ambrosio, V.; Di Martino, F. A climate vulnerability and impact assessment model for complex urban systems. Environ. Sci. Policy 2019, 93, 11–26. [Google Scholar] [CrossRef]
  2. Sgobbo, A. Inspiring & Training Energy-Spatial Socioeconomic Sustainability. Sustain. Mediterr. Constr. 2020, 12, 138–143. Available online: http://www.sustainablemediterraneanconstruction.eu/SMC/The_Magazine_n.12_files/1221.pdf (accessed on 1 February 2021).
  3. Zuo, J.; Pullen, S.; Palmer, J.; Bennetts, H.; Chileshe, N.; Ma, T. Impacts of heat waves and corresponding measures: A review. J. Clean. Prod. 2015, 92, 1–12. [Google Scholar] [CrossRef]
  4. IPCC. Climate Change 2014—Synthesis Report. 2015. Available online: https://www.ipcc.ch/site/assets/uploads/2018/05/SYR_AR5_FINAL_full_wcover.pdf (accessed on 1 February 2021).
  5. IPCC. Global Warming of 1.5 °C—Summary for Policymakers. 2018. Available online: https://www.ipcc.ch/site/assets/uploads/sites/2/2019/05/SR15_SPM_version_stand_alone_HR.pdf (accessed on 1 February 2021).
  6. Losasso, M. Climate risk, Environmental planning, Urban design. UPLanD J. Urban Plan. Landsc. Environ. Des. 2016, 4, 219–232. [Google Scholar] [CrossRef]
  7. Sgobbo, A. Eco-social innovation for efficient urban metabolisms. TECHNE J. Technol. Archit. Environ. 2017, 14, 337–344. [Google Scholar] [CrossRef]
  8. Giovannini, C. Risanare le Città: L’utopia Igienista di Fine Ottocento; FrancoAngeli: Milano, Italy, 1996. [Google Scholar]
  9. Orsini, F. Utopie Urbane, Forma Della Città; Maggioli Editore: Santarcangelo di Romagna, Italy, 2017. [Google Scholar]
  10. Calabi, D. Storia Dell’urbanistica Europea; Paravia Scriptorium: Torino, Italy, 2000. [Google Scholar]
  11. La Greca, P.; Sgobbo, A.; Moccia, F.D. Urban Density & Sustainability; Maggioli Editore: Santarcangelo di Romagna, Italy, 2021. [Google Scholar]
  12. Molesti, R. I Fondamenti Della Bioeconomia. La Nuova Economia Ecologica; FrancoAngeli: Milano, Italy, 2006. [Google Scholar]
  13. Moccia, F.D. L’urbanistica nella fase dei cambiamenti climatici. Urbanistica 2009, 140, 95–102. [Google Scholar]
  14. Sgobbo, A. Sostenibilità ecologica e resilienza: La strategia densità/densificazione. In Urban Density & Sustainability; La Greca, P., Sgobbo, A., Moccia, F.D., Eds.; Maggioli Editore: Santarcangelo di Romagna, Italy, 2021; pp. 153–172. [Google Scholar]
  15. Russo, M. Multiscalarità. Dimensioni e spazi della contemporaneità. Arch. Studi Urbani Reg. 2015, 113, 5–22. [Google Scholar] [CrossRef]
  16. Skovbro, A. Urban Densification—A Sustainable Urban Policy? In The Sustainable City II; Brebbia, C.A., Martin-Duque, J.F., Wadhwa, L.C., Eds.; WIT Press: Southampton, UK, 2002; Volume 54, pp. 517–527. [Google Scholar] [CrossRef]
  17. Conticelli, E.; Proli, S.; Tondelli, S. Integrating energy efficiency and urban densification policies: Two Italian case studies. Energy Build. 2017, 155, 308–323. [Google Scholar] [CrossRef]
  18. Sgobbo, A.; Basile, M. Sharing Sustainability. UPLanD J. Urban Plan. Landsc. Environ. Des. 2017, 2, 255–297. [Google Scholar] [CrossRef]
  19. Moccia, F.D. Urbanistica. Interpretazioni e Processi di Cambiamento; Clean Edizioni: Naples, Italy, 2012. [Google Scholar]
  20. Rees, W.; Wackernagel, M. Urban ecological footprints: Why cities cannot be sustainable—And why they are a key to sustainability. In Urban Ecology; Marzluff, J.M., Shulenberger, E., Endlicher, W., Alberti, A., Bradley, G., Ryan, C., Simon, U., ZumBrunnen, C., Eds.; Springer: Boston, MA, USA, 2008; pp. 537–555. [Google Scholar] [CrossRef]
  21. Ng, E. Designing High-Density Cities: For Social and Environmental Sustainability; Routledge: Abingdon, UK, 2009. [Google Scholar]
  22. Bay, J.H.P.; Lehmann, S. Growing Compact: Urban Form, Density and Sustainability; Routledge: Abingdon, UK, 2017. [Google Scholar]
  23. Lin, B.; Meyers, J.; Barnett, G. Understanding the potential loss and inequities of green space distribution with urban densification. Urban For. Urban Green. 2015, 14, 952–958. [Google Scholar] [CrossRef]
  24. Tira, M.; Sgobbo, A.; Cervigni, C.; Intensss, P.A. A Systematic Approach for Inspiring & Training Energy–Spatial–Socioeconomic Sustainability to Public Authorities; Maggioli Editore: Santarcangelo di Romagna, Italy, 2020. [Google Scholar]
  25. Gómez-Baggethun, E.; Gren, Å.; Barton, D.N.; Langemeyer, J.; McPhearson, T.; O’Farrell, P.; Andersson, E.; Hamstead, Z.; Kremer, P. Urban ecosystem services. In Urbanization, Biodiversity and Ecosystem Services: Challenges and Opportunities; Elmqvist, T., Fragkias, M., Goodness, J., Güneralp, B., Marcotullio, P.J., McDonald, R.I., Parnell, S., Schewenius, M., Sendstad, M., Seto, K.C., et al., Eds.; Springer: Dordrecht, The Netherlands, 2013; pp. 175–251. [Google Scholar] [CrossRef] [Green Version]
  26. Sgobbo, A. Recycling, waste management and urban vegetable gardens. WIT Trans. Ecol. Environ. 2016, 202, 61–72. [Google Scholar] [CrossRef] [Green Version]
  27. Apreda, C. Climate change, urban vulnerability and adaptation strategies to pluvial flooding. UPLanD J. Urban Plan. Landsc. Environ. Des. 2016, 1, 233–256. [Google Scholar] [CrossRef]
  28. UN—United Nations. Transforming Our World: The 2030 Agenda for Sustainable Development, A/RES/70/1; United Nations: New York, NY, USA, 2015; Available online: https://www.un.org/en/development/desa/population/migration/generalassembly/docs/globalcompact/A_RES_70_1_E.pdf (accessed on 1 February 2021).
  29. EC—European Commission. The European Green Deal. Communication from the Commission to the European Parliament, the European Council, the Council, the European Economic and Social Committee and the Committee of the Regions, COM (2019) 640 Final; EC: Bruxelles, Belgium, 2019; Available online: https://eur-lex.europa.eu/legal-content/EN/TXT/?uri=CELEX:52019DC0640 (accessed on 1 February 2021).
  30. EC—European Commission. EU Biodiversity Strategy for 2030. Communication from the Commission to the European Parliament, the European Council, the Council, the European Economic and Social Committee and the Committee of the Regions, COM (2020) 380 Final; EC: Bruxelles, Belgium, 2020; Available online: https://ec.europa.eu/info/sites/info/files/communication-annex-eu-biodiversity-strategy-2030_en.pdf (accessed on 1 February 2021).
  31. EEA—European Environment Agency. Climate Change, Impacts and Vulnerability in Europe 2016. An Indicator Based Report; EEA Report No 1/2017; EEA: Copenhagen, Denmark, 2017; Available online: https://climate-adapt.eea.europa.eu/metadata/publications/climate-change-impacts-and-vulnerability-in-europe-2016/climate-change-impacts-and-vulnerabilities-2016-thal17001enn.pdf (accessed on 1 February 2021).
  32. Musco, F.; Fregolent, L.; Ferro, D.; Magni, F.; Maragno, D.; Martinucci, D.; Fornaciari, G. Mitigazione e adattamento ai fenomeni di UHI: Il caso studio di Padova. In Pianificazione Urbanistica e Clima Urbano. Manuale per la Riduzione dei Fenomeni di Isola di Calore Urbano; Musco, F., Fregolent, L., Eds.; Il Poligrafo: Padova, Italy, 2014; pp. 193–222. Available online: http://www.iuav.it/Ateneo1/chi-siamo/pubblicazi1/freschi-di/musco_UHI_poligrafo.pdf (accessed on 1 February 2021).
  33. Senatsverwaltung für Stadtentwicklung und Wohnen. Stadtentwicklungsplan Klima. KONKRET. Klimaanpassung in der Wachsenden Stadt; City of Berlin: Berlin, Germany, 2016; Available online: https://www.stadtentwicklung.berlin.de/planen/stadtentwicklungsplanung/download/klima/step_klima_konkret.pdf (accessed on 1 February 2021).
  34. Apreda, C.; Reder, A.; Mercogliano, P. Urban morphology parameterization for assessing the effects of housing blocks layouts on air temperature in the Euro-Mediterranean context. Energy Build. 2020, 223. [Google Scholar] [CrossRef]
  35. Amenta, L.; Attademo, A.; Remøy, H.; Berruti, G.; Cerreta, M.; Formato, E.; Palestino, M.F.; Russo, M. Managing the Transition towards Circular Metabolism: Living Labs as a Co-Creation Approach. Urban Plan. 2019, 4, 5–18. [Google Scholar] [CrossRef] [Green Version]
  36. Neset, T.S.; Andersson, L.; Uhrqvist, O.; Navarra, C. Serious Gaming for Climate Adaptation—Assessing the Potential and Challenges of a Digital Serious Game for Urban Climate Adaptation. Sustainability 2020, 12, 1789. [Google Scholar] [CrossRef] [Green Version]
  37. ENVI-met. Available online: https://www.envi-met.com/ (accessed on 1 February 2021).
  38. Grasshopper. Algorithmic Modeling for Rhino. Available online: https://www.grasshopper3d.com/ (accessed on 1 February 2021).
  39. Fink, T.; Koenig, R. Parametric Urban Design in Grasshopper/Rhinoceros 3D-Demonstrated on a Master Plan in Vienna. In Proceedings of the 37th eCAADe and 23rd SIGraDi Conference, Porto, Portugal, 11–13 September 2019; Sousa, J.P., Gonçal Castro, H.X., João Pedro, X., Eds.; Blucher: São Paulo, Brazil, 2019. [Google Scholar] [CrossRef]
  40. Xu, X.; Yin, C.; Wang, W.; Xu, N.; Hong, T.; Li, Q. Revealing Urban Morphology and Outdoor Comfort through Genetic Algorithm-Driven Urban Block Design in Dry and Hot Regions of China. Sustainability 2019, 11, 3683. [Google Scholar] [CrossRef] [Green Version]
  41. Delmas, A.; Donn, M.; Grosdemouge, V.; Musy, M.; Garde, F. Towards Context & Climate Sensitive Urban Design An integrated simulation and parametric design approach. In Proceedings of the 4th International Conference On Building Energy & Environment 2018, Melbourne, Australia, 5–9 February 2018; Available online: https://hal.archives-ouvertes.fr/hal-01706682 (accessed on 1 February 2021).
  42. ISTAT—Istituto Nazionale di Statistica. Available online: https://www.istat.it/it/archivio/104317 (accessed on 1 February 2021).
  43. Verde, S.; Bassolino, E. Processi di data analysis e data exchange tra strumenti GIS-based e tool di design parametrico per la definizione del comportamento microclimatico degli spazi aperti. Urban. Inf. 2020, 289 s.i., 11–15. Available online: http://www.urbanisticainformazioni.it/IMG/pdf/ui289si_sessione_15.pdf (accessed on 1 February 2021).
  44. Bassolino, E.; Palma Iannotti, F. Processi di parametric e computational design per la definizione di strategie di regenerative climate adaptive design per il distretto di Secondigliano. BDC Boll. Cent. Calza Bini 2020, 20, 393–415. Available online: http://www.serena.unina.it/index.php/bdc/article/view/7562/8428 (accessed on 1 February 2021).
  45. Martin, L.; March, L. Urban Spaces and Structures; Cambridge University Press: Cambridge, UK, 1972. [Google Scholar]
  46. Ratti, C.; Raydan, D.; Steemers, K. Building form and environmental performance: Archetypes, analysis and an arid climate. Energy Build. 2003, 35, 49–59. Available online: http://senseable.mit.edu/papers/pdf/20030115_Ratti_etal_BuildingForm_EnergyBuildings.pdf (accessed on 1 February 2021). [CrossRef]
  47. Watson, I.; Johnson, G. Graphical estimation of sky view-factors in urban environments. J. Climatol. 1987, 7, 193–197. [Google Scholar] [CrossRef]
  48. Oke, T.R. The Energetic Basis of the Urban Heat Island. Q. J. R. Meteorol. Soc. 1982, 108, 1–24. [Google Scholar] [CrossRef]
  49. D’Ambrosio, V.; Di Martino, F. The Metropolis research. experimental models and decision-making processes for the adaptive environmental design in climate change article history. UPLanD J. Urban Plan. Landsc. Environ. Des. 2016, 1, 187–217. [Google Scholar] [CrossRef]
  50. Di Martino, F.; Losasso, M.; Moccia, F.D.; Palestino, M.F.; Sgobbo, A.; Visconti, F.; Apreda, C.; Arena, A.; Bassolino, E.; D’Ambrosio, V.; et al. Determinazione delle altezze dell’edificato della Municipalità di Ponticelli (Na) e relativo hillshade in ambiente GIS. In GIS DAY 2015: Il GIS per il Governo e la Gestione del Territorio; Sessa, S., Di Martino, F., Cardone, B., Eds.; Aracne Editrice: Rome, Italy, 2016; pp. 145–158. [Google Scholar]
  51. D’Ambrosio, V.; Di Martino, F. Vulnerabilità e impatti climatici nei tessuti urbani: Processi sperimentali. In Progettazione Ambientale per L’adattamento al Climate Change. 2. Strumenti e Indirizzi per la Riduzione dei Rischi Climatici/Environmental Design for Climate Change Adaptation. 2. Tools and Guidelines for Climate Risk Reduction; D’Ambrosio, V., Leone, M.F., Eds.; Clean Edizioni: Naples, Italy, 2017; pp. 84–105. Available online: http://www.sitda.net/downloads/biblioteca/Environmental%20Design%20for%20Climate%20Change%20adaptation.%202.%20Tools%20and%20Guidelines%20for%20Climate%20Risk%20Reduction.pdf (accessed on 1 February 2021).
  52. Heynen, H.; Vanderburgh, D. Inside Density; Lettre Volée: Bruxelles, Belgium, 2003. [Google Scholar]
  53. Sgobbo, A.; Moccia, F.D. Synergetic Temporary Use for the Enhancement of Historic Centers: The Pilot Project for the Naples Waterfront. TECHNE J. Technol. Archit. Environ. 2016, 12, 253–260. [Google Scholar] [CrossRef]
  54. Niemelä, J.; Breuste, J.H.; Guntenspergen, G.; McIntyre, N.E.; Elmqvist, T.; James, P. Urban Ecology: Patterns, Processes, and Applications; Oxford University Press: Oxford, UK, 2011. [Google Scholar]
  55. Sgobbo, A. Resilienza e rigenerazione: L’approccio water sensitive urban planning come strategia di sostenibilità urbana. BDC Boll. Cent. Calza Bini 2018, 18, 105–126. [Google Scholar] [CrossRef]
  56. MATTM—Ministero dell’Ambiente e della Tutela del Territorio e del Mare. Strategia Nazionale di Adattamento ai Cambiamenti Climatici; MATTM: Rome, Italy, 2015; Available online: https://www.minambiente.it/sites/default/files/archivio/allegati/clima/strategia_adattamentoCC.pdf (accessed on 1 February 2021).
  57. CMCC—Centro EuroMediterraneo sui Cambiamenti Climatici. PNACC Piano Nazionale di Adattamento ai Cambiamenti Climatici; CMCC: Lecce, Italy, 2017; Available online: https://www.minambiente.it/sites/default/files/archivio_immagini/adattamenti_climatici/documento_pnacc_luglio_2017.pdf (accessed on 1 February 2021).
  58. EnergyPlus. Available online: https://energyplus.net/weather (accessed on 1 February 2021).
  59. CCWorldWeatherGen. Available online: https://energy.soton.ac.uk/climate-change-world-weather-file-generator-for-world-wide-weather-data-ccworldweathergen/ (accessed on 1 February 2021).
  60. IPCC—Data Distribution Center, HadCM3 Climate Scenario Data. Available online: https://www.ipcc-data.org/sim/gcm_clim/SRES_TAR/hadcm3_download.html (accessed on 1 February 2021).
  61. Troup, L.; Fannon, D. Morphing Climate Data to Simulate Building Energy Consumption. In Proceedings of the ASHRAE and IBPSA-USA SimBuild 2016: Building Performance Modeling Conference, Salt Lake City, UT, USA, 8–12 August 2016; ASHRAE and IBPSA-USA: Peachtree Corners, GA, USA, 2016. Available online: https://ibpsa-usa.org/index.php/ibpusa/article/view/390/376 (accessed on 1 February 2021).
  62. Oke, T.R. Boundary Layer Climates, 2nd ed.; Methuen & Co. Ltd.: London, UK, 1987. [Google Scholar]
  63. Brown, G.Z.; Dekay, M.W. Sun, Wind and Light: Architectural Design Strategies, 2nd ed.; John Wiley and Sons: New York, NY, USA, 2001; pp. 80–130. [Google Scholar]
  64. Caja, M.; Landsberger, M.; Malcovati, S. Tipologia Architettonica e Morfologia Urbana; Libraccio Editore: Saronno, Italy, 2012. [Google Scholar]
  65. Millennium Ecosystem Assessment. Ecosystems and Human Well-Being: Synthesis; Island Press: Washington, DC, USA, 2005; Available online: https://www.millenniumassessment.org/documents/document.356.aspx.pdf (accessed on 1 February 2021).
  66. Suriya, S.; Mudgal, B.V. Impact of urbanization on flooding: The Thirusoolam sub watershed—A case study. J. Hydrol. 2012, 412, 210–219. [Google Scholar] [CrossRef]
  67. Strecker, E.W.; Quigley, M.M.; Urbonas, B.R.; Jones, J.E.; Clary, J.K. Determining urban storm water BMP effectiveness. J. Water Resour. Plan. Manag. 2001, 127, 144–149. [Google Scholar] [CrossRef]
  68. Wheeler, S.M.; Beatley, T. Sustainable Urban Development Reader; Routledge: Abingdon, UK, 2014. [Google Scholar]
  69. Dircke, P.; Molenaar, A. Climate change adaptation; innovative tools and strategies in Delta City Rotterdam. Water Pr. Technol. 2015, 10, 674–680. [Google Scholar] [CrossRef]
  70. Levy, J.M. Contemporary Urban Planning; Routledge: Abingdon, UK, 2016. [Google Scholar]
  71. Mazzarella, L. Dati climatici G. De Giorgio. In Proceedings of Giornata di studio Giovanni De Giorgio; Politecnico di Milano: Milan, Italy, 1997; Available online: https://energyplus.net/sites/all/modules/custom/weather/weather_files/italia_dati_climatici_g_de_giorgio.pdf (accessed on 1 February 2021).
  72. Di Martino, F.; Sessa, S. Metodologia e modello gerarchico per la valutazione della vulnerabilità climatica del sistema urbano. In Progettazione Ambientale per L’adattamento al Climate Change. 2. Strumenti e Indirizzi per la Riduzione dei Rischi Climatici/Environmental Design for Climate Change Adaptation. 2. Tools and Guidelines for Climate Risk Reduction; D’Ambrosio, V., Leone, M.F., Eds.; Clean Edizioni: Naples, Italy, 2017; pp. 84–105. Available online: http://www.sitda.net/downloads/biblioteca/Environmental%20Design%20for%20Climate%20Change%20adaptation.%202.%20Tools%20and%20Guidelines%20for%20Climate%20Risk%20Reduction.pdf (accessed on 1 February 2021).
  73. ISO. ISO 7730:2005. Ergonomics of the Thermal Environment—Analytical Determination and Interpretation of Thermal Comfort Using Calculation of the PMV and PPD Indices and Local Thermal Comfort Criteria; ISO: Geneva, Switzerland, 2005. [Google Scholar]
  74. Fanger, P.O. Thermal Comfort—Analysis and Application in Environmental Engineering; McGraw-Hill Book Company: New York, NY, USA, 1972. [Google Scholar]
  75. Apreda, C. Modelli di vulnerabilità ai fenomeni di heat wave e pluvial flooding in ambito urbano. In Progettazione Ambientale per L’adattamento al Climate Change. 2. Strumenti e Indirizzi per la Riduzione dei Rischi Climatici/Environmental Design for Climate Change Adaptation. 2. Tools and Guidelines for Climate Risk Reduction; D’Ambrosio, V., Leone, M.F., Eds.; Clean Edizioni: Naples, Italy, 2017; pp. 84–105. Available online: http://www.sitda.net/downloads/biblioteca/Environmental%20Design%20for%20Climate%20Change%20adaptation.%202.%20Tools%20and%20Guidelines%20for%20Climate%20Risk%20Reduction.pdf (accessed on 1 February 2021).
  76. ENVI-met. Available online: https://www.envi-met.com/release-envi-met-4-4-1/ (accessed on 1 February 2021).
  77. Gibbins, J.; Chalmers, H. Chapter 2. Fossil Power Generation with Carbon Capture and Storage (CCS): Policy Development for Technology Deployment. In Carbon Capture. Royal Society of Chemistry; Hester, R.E., Harrison, R.M., Eds.; RSC Publishing: Cambridge, UK, 2010; pp. 41–64. [Google Scholar]
  78. IEA—International Energy Agency. CO2 Emissions from Fuel Combustion 2019 Highlights; IEA: Paris, France, 2019; Available online: https://webstore.iea.org/co2-emissions-from-fuel-combustion-2019-highlights (accessed on 1 February 2021).
  79. Moncaglieri, G. Sviluppo di Materiali Innovativi per la Cattura Della CO2. Master’s Thesis, Politecnico di Torino, Torino, Italy, July 2020. Available online: https://webthesis.biblio.polito.it/14812/1/tesi.pdf (accessed on 1 February 2021).
  80. GitHub df_envimet. Available online: https://github.com/AntonelloDN/df_envimet (accessed on 1 February 2021).
  81. Urban Adaptation Support Tool-UAST. Available online: https://climate-adapt.eea.europa.eu/knowledge/tools/urban-ast/step-0-0 (accessed on 1 February 2021).
  82. The European Climate Adaptation Platform Climate-ADAPT. Available online: https://climate-adapt.eea.europa.eu/ (accessed on 1 February 2021).
  83. Covenant of Mayors for Climate & Energy Europe. Available online: https://www.covenantofmayors.eu/ (accessed on 1 February 2021).
  84. Nouri, A.S. A Framework of Thermal Sensitive Urban Design Benchmarks: Potentiating the Longevity of Auckland’s Public Realm. Buildings 2015, 5, 252–281. [Google Scholar] [CrossRef] [Green Version]
  85. U.S. Environmental Protection Agency. Reducing Urban Heat Islands: Compendium of Strategies. Urban Heat Island Basics; U.S. EPA: Washington, DC, USA, 2008. Available online: https://www.epa.gov/sites/production/files/2017-05/documents/reducing_urban_heat_islands_ch_1.pdf (accessed on 1 February 2021).
  86. U.S. Environmental Protection Agency. Reducing Urban Heat Islands: Compendium of Strategies. Trees and Vegetation; U.S. EPA: Washington, DC, USA, 2008. Available online: https://www.epa.gov/sites/production/files/2017-05/documents/reducing_urban_heat_islands_ch_2.pdf (accessed on 1 February 2021).
  87. Bouyer, J.; Musy, M.; Huang, Y.; Athamena, K. Mitigating Urban Heat Island Effect by Urban Design: Forms and Materials. In Cities and Climate Change: Responding to an Urgent Agenda; Hoornweg, D., Freire, M., Lee, M.J., Bhada-Tata, P., Yuen, B., Eds.; The World Bank: Washington, DC, USA, 2009; Volume 2, Available online: http://documents1.worldbank.org/curated/en/321111468182335037/pdf/626960PUB0v20B0iesClimateChangeVol2.pdf (accessed on 1 February 2021).
  88. Reven, J. Cooling the Public Realm: Climate-Resilient Urban Design. In Resilient Cities. Local Sustainability; Otto-Zimmermann, K., Ed.; Springer: Dordrecht, The Netherlands, 2011; Volume 1, pp. 451–463. [Google Scholar] [CrossRef]
  89. Doick, K.; Hutchings, T. Air Temperature Regulation by Urban Trees and Green Infrastructure; Forestry Commission: Farnham, UK, 2013. Available online: https://www.forestresearch.gov.uk/documents/1708/FCRN012.pdf (accessed on 1 February 2021).
  90. U.S. Environmental Protection Agency. Reducing Urban Heat Islands: Compendium of Strategies. Cool Pavements; U.S. EPA: Washington, DC, USA, 2008. Available online: https://www.epa.gov/sites/production/files/2017-05/documents/reducing_urban_heat_islands_ch_5.pdf (accessed on 1 February 2021).
  91. Global Cool Cities Alliance. A Practical Guide to Cool Roofs and Cool Pavements; Global Cool Cities Alliance: Washington, DC, USA, 2012; Available online: https://coolrooftoolkit.org/wp-content/pdfs/CoolRoofToolkit_Full.pdf (accessed on 1 February 2021).
  92. Li, H. A comparison of thermal performance of different pavement materials. In Eco-efficient Materials for Mitigating Building Cooling Needs: Design, Properties and Applications; Pacheco-Torgal, F., Labrincha, J., Cabeza, L., Granqvist, C., Eds.; Woodhead Publishing-Elsevier: Sawston, Cambridge, UK, 2015; pp. 63–123. [Google Scholar] [CrossRef]
  93. Zinzi, M.; Carnielo, E.; Fasano, G. Determinazione delle Proprietà Termofisiche di Materiali ad Elevata Riflettanza Solare per Applicazioni a Scala Urbana: Limiti e Potenzialità; Report RdS/2012/227; ENEA: Rome, Italy, 2012; Available online: https://www.enea.it/it/Ricerca_sviluppo/documenti/ricerca-di-sistema-elettrico/risparmio-energia-settore-civile/2011/227-rds-pdf (accessed on 1 February 2021).
  94. Li, H.; Harvey, J.T.; Holland, T.J.; Kayhanian, M. The use of reflective and permeable pavements as a potential practice for heat island mitigation and stormwater management. Environ. Res. Lett. 2013, 8. [Google Scholar] [CrossRef]
  95. Dessì, V. Urban Material for Comfortable Open Spaces. In Proceedings of the World Renewable Energy Congress, Linköping, Sweden, 8–13 May 2011; LiU Electronic Press: Linköping, Sweeden, 2011. [Google Scholar] [CrossRef] [Green Version]
  96. Centre for Renewable Energy Sources. Progettare gli Spazi Aperti Nell’ambiente Urbano: Un Approccio Bioclimatico; C.R.E.S.: Athens, Greece, 2004. [Google Scholar]
  97. Dessì, V. La progettazione bioclimatica degli spazi urbani. 4.1 Diespensa. In REBUS—Renovation of Public Buildings and Urban Spaces; Regione Emilia Romagna, Ed.; Regione Emilia Romagna: Bologna, Italy, 2015; 241p, Available online: https://territorio.regione.emilia-romagna.it/paesaggio/formazione-lab-app-1/REBUS241progettazionebioclimatica_13115.pdf (accessed on 1 February 2021).
  98. Bassolino, E. The impact of climate change on local water management strategies. Learning from Rotterdam and Copenhagen. UPLanD J. Urban Plan. Landsc. Environ. Des. 2019, 4, 21–40. [Google Scholar] [CrossRef]
  99. Zinzi, M.; Carnielo, E.; Fasano, G. Caratterizzazione e Valutazione di Pavimentazioni Riflettenti per Applicazioni Urbane; Report RdS/2013/166; ENEA: Rome, Italy, 2013; Available online: http://cesta.casaccia.enea.it/bimdb/upload/78_RdS-2013-166.pdf (accessed on 1 February 2021).
  100. Santamouris, M. Using cool pavements as a mitigation strategy to fight urban heat island—A review of the actual developments. Renew. Sustain. Energy Rev. 2013, 26, 224–240. [Google Scholar] [CrossRef]
  101. Fanchiotti, A.; Carnielo, E. Impatto di Cool Material Sulla Mitigazione Dell’isola di Calore Urbana e sui Livelli di Comfort Termico Negli Edifici; Report RdS/2011/145; ENEA: Rome, Italy, 2012; Available online: https://www.enea.it/it/Ricerca_sviluppo/documenti/ricerca-di-sistema-elettrico/risparmio-energia-settore-civile/rds-145.pdf (accessed on 1 February 2021).
  102. U.S. Environmental Protection Agency. Reducing Urban Heat Islands: Compendium of Strategies. Heat Island Reduction Activities; U.S. EPA: Washington, DC, USA, 2008. Available online: https://www.epa.gov/sites/production/files/2017-05/documents/reducing_urban_heat_islands_ch_6.pdf (accessed on 1 February 2021).
  103. Vittoria, E. Le «Tecnologie Devianti» per la Progettazione Ambientale. In IL Governo del Progetto; Gangemi, V., Ranzo, P., Eds.; Edizioni Luigi Parma: Bologna, Italy, 1978; pp. 62–71. [Google Scholar]
  104. Sgobbo, A. Sustainable Planning: The Carrying Capacity Approach. In New Metropolitan Perspectives. NMP 2020. Smart Innovation, Systems and Technologies; Bevilacqua, C., Calabrò, F., Della Spina, L., Eds.; Springer: Cham, Switzerland, 2021; Volume 178, pp. 633–642. [Google Scholar]
Figure 1. Heatwave impact scenario assessment model.
Sustainability 13 05694 g001
Figure 2. Synthesis of the developed methodological approach to evaluate the climatic resilience of the open spaces physical subsystem due to rising urban temperatures.
Sustainability 13 05694 g002
Figure 3. ICT simulation and analysis workflow for the definition of the microclimatic and performance behavior of urban open spaces.
Sustainability 13 05694 g003
Figure 4. Generic urban patterns: (a) from right to left: pavilions, slabs, terraces, terrace-courts, pavilion-courts and courts. [46]; (b) deduced generic urban patterns for Italian cities [45,46].
Sustainability 13 05694 g004
Figure 5. Classification of urban patterns: (a) high-density urban patterns; (b) medium and low-density urban patterns; (c) squares and open spaces; (d) medium green areas and green areas.
Sustainability 13 05694 g005aSustainability 13 05694 g005b
Figure 6. Comparison between the values of descriptive indicators of urban morphology accuracy between the different input model of data and simulation tools. Test on the urban patterns of the city of Naples.
Sustainability 13 05694 g006
Figure 7. Map of the building density by census section (cum/sqm).
Sustainability 13 05694 g007
Figure 8. Map of building density and green areas by census section (cum/sqm).
Sustainability 13 05694 g008
Figure 9. Percentages of building density and green areas for census sections of open spaces.
Sustainability 13 05694 g009
Figure 10. “Outdoor comfort” map of the city of Naples (2000s).
Sustainability 13 05694 g010
Figure 11. “Mid-term outdoor comfort” map of the city of Naples (2050s).
Sustainability 13 05694 g011
Figure 12. Extract from the database of the open spaces referred to the Climatic Macro-region 2-Reference city Naples: indicator values of current conditions (2000s) and medium-term scenarios (2050s).
Sustainability 13 05694 g012
Figure 13. Percentages of total and partial application of the climate-proof intervention categories within the recurring urban patterns.
Sustainability 13 05694 g013
Figure 14. Diagram of the percentages of application of the categories of climate-proof intervention.
Sustainability 13 05694 g014
Figure 15. “Forecast outdoor comfort” map of the city of Naples (2000s).
Sustainability 13 05694 g015
Figure 16. “Forecast mid-term outdoor comfort” map of the city of Naples (2050s).
Sustainability 13 05694 g016
Figure 17. Classification model of climatic resilience to heatwaves of the urban open spaces subsystem.
Sustainability 13 05694 g017
Table 1. Classification by density of buildings by census section.
ClassificationBuilt Density
High-density patternsD ≥ 17 cum/sqm
Medium density patterns7 ≤ D < 17 cum/mq
Low-density patternsD < 7 cum/mq
Square and open spacesD = 0 cum/sqm
Table 2. Correspondence between the PMV index and thermal sensation.
PMV IndexThermal Sensation
0Neutral
+1Slightly warm
+2Warm
+3Hot
+4Very Hot
>4Extremely hot
Table 3. Averages of PMV values, air temperatures and CO2 concentrations (ppm) by urban patterns and category of user groups and climate conditions, 2000s and 2050s of the city of Naples.
ClassificationUrban PatternsPMV
Child
2000s
PMV
Child
2050s
PMV
Adult
2000s
PMV
Adult
2050s
PMV
Old p.
2000s
PMV
Old p.
2050s
Air
Temp.
2000s
Air
Temp.
2050s
CO2
Conc.
2000s
CO2
Conc.
2050s
High-density
pattern
Terrace-courts3.494.432.933.663.093.9825.41 °C27.18 °C410.86411.74
Pavillion-courts3.574.223.023.533.193.8125.29 °C26.76 °C410.97410.77
Terraces3.624.283.043.563.223.8625.75 °C27.34 °C410.98410.77
Medium density
pattern
Terraces3.714.393.093.633.293.9426.14 °C27.72 °C411.03410.87
Pavillion/
towers
3.824.483.183.723.404.0626.53 °C28.33 °C410.86410.91
Low-density
pattern
Sprawl-
pavillions
3.554.263.023.603.193.9027.87 °C30.13 °C409.99409.93
Squares and open spacesSquares3.594.203.073.553.253.8326.24 °C28.01 °C410.75410.61
Open spaces3.694.333.133.643.333.9426.23 °C27.97 °C410.97410.83
Medium and greenareasGreen areas4.145.023.344.043.624.4928.02 °C30.48 °C409.71410.00
Green areas2.643.392.362.962.373.0927.99 °C27.99 °C403.67403.12
Table 4. Averages of forecast PMV values, air temperatures, and CO2 concentrations (ppm) by urban patterns and category of user groups and climate conditions, 2000s and 2050s of the city of Naples.
ClassificationUrban PatternsPMV
Child
2000s
PMV
Child
2050s
PMV
Adult
2000s
PMV
Adult
2050s
PMV
Old p.
2000s
PMV
Old p.
2050s
Air
Temp.
2000s
Air
Temp.
2050s
CO2
Conc.
2000s
CO2
Conc.
2050s
High-density
pattern
Terrace-courts3.224.022.753.362.853.6125.13 °C26.67 °C410.62410.41
Pavillion-courts2.943.652.573.142.633.3225.03 °C26.53 °C409.57408.92
Terraces2.933.942.483.332.513.5725.44 °C27.05 °C408.06410.20
Medium
density
pattern
Terraces2.803.532.473.042.503.2025.97 °C27.50 °C408.83408.60
Pavillion/
towers
3.003.722.623.192.693.3926.04 °C27.87 °C409.47409.22
Low-density
pattern
Sprawl-
pavillions
2.383.042.172.702.132.7727.49 °C29.70 °C405.23405.09
Squares and open spacesSquares2.153.842.013.301.923.5125.79 °C27.89 °C402.34409.38
Open spaces2.092.401.431.881.862.1325.64 °C27.30 °C403.03400.17
Medium green
areas and green
areas
Green areas2.643.392.362.962.373.0927.99 °C27.99 °C403.67403.12
Green areas2.643.392.362.962.373.0927.92 °C27.99 °C403.67403.12
Table 5. Percentage difference of PMV values, air temperatures and CO2 concentrations (ppm) between current and forecast condition by urban patterns and category of user groups and climate conditions, 2000s and 2050s of the city of Naples.
ClassificationUrban PatternsΔ %
PMV
Child
2000s
Δ %
PMV
Child
2050s
Δ %
PMV
Adult
2000s
Δ %
PMV
Adult
2050s
Δ %
PMV
Old p.
2000s
Δ %
PMV
Old p.
2050s
Δ %
Air
Temp.
2000s
Δ %
Air
Temp.
2050s
Δ %
CO2
Conc.
2000s
Δ %
CO2
Conc.
2050s
High-density
pattern
Terrace-courts−7.93−9.22−6.26−8.11−7.67−9.28−1.07−1.88−0.06−0.32
Pavillion-courts−17.66−13.51−14.63−11.03−17.58−12.89−1.05−0.87−0.34−0.45
Terraces−19.11−7.89−18.46−6.52−22.18−7.59−1.20−1.04−0.71−0.14
Medium
density
pattern
Terraces−24.67−19.68−20.19−16.14−24.18−18.84−0.64−0.78−0.54−0.55
Pavillion/
towers
−21.47−17.01−17.49−14.17−20.91−16.55−1.82−1.63−0.34−0.41
Low-density
pattern
Sprawl-
pavillions
−33.08−28.61−28.03−25.08−33.36−28.94−1.35−1.42−1.16−1.18
Squares and open spacesSquares−40.08−8.66−34.65−7.13−40.81−8.27−1.73−0.43−2.05−0.30
Open spaces−43.47−44.63−54.26−48.30−44.09−45.98−2.23−2.40−1.93−2.59
Medium green
areas and green
areas
Green
areas
−36.18−32.48−29.44−26.79−34.53−31.23−0.12−8.18−1.47−1.68
Green
areas
−0.090.04−0.190.080.120,00−0.230.000,000.00
Publisher’s Note: MDPI stays neutral with regard to jurisdictional claims in published maps and institutional affiliations.

