1. Introduction
“A developed country is not a place where the poor have cars; it is where the rich use public transport”, Gustavo Petro, Mayor of Bogota, Colombia [
1]. Traffic jams and road rage is one of the eminent problems faced by most of the population around the world. The issue of traffic jams in the main urban centers around the world, such as Karachi, is a common occurrence [
2]. Traffic congestion tends to draw out, impede, and worsen non-productive monetary activities in urban communities. Different studies on traffic-related problems are underway in different clusters, including economic and financial problems [
3]. Economical loss because of traffic congestion was observed in different cities of the world. It has been revealed that, in 2018, Karachi’s traffic jam cost surpassed 1 billion USD per year, which equals a 2% share of the total gross domestic production (GDP) of Karachi [
2,
4]. That cost is ascertained based on value of time, fuel cost, and consumption of fuel.
Karachi is the capital of Pakistan’s province of Sindh. Situated on the Arabian Sea, Karachi serves as a transport hub and is home to Pakistan’s two largest seaports, the Port of Karachi and Port Bin Qasim, as well as the busiest airport in Pakistan [
5]. Karachi is one of the busiest and most influential cities in the region of South Asia. The rapid expansion of the city in recent decades increased the demand for city transit infrastructure. Currently, 15 million residents with a density of 24,000 people per square kilometer are living in the city [
6]. Overall, 60% of the population of Karachi is relying excessively on private transport creating enormous traffic congestion and painful air pollution [
7,
8]. Karachi is Pakistan’s only port and the country’s major industries and businesses are located there. The head offices of all major Pakistani banks are in Karachi and the Karachi Stock Exchange is the country’s largest having an annual turnover of Rs 436 million (US
$7.2 million); 70% of income tax and 62% of sales tax collected by the Government of Pakistan comes from Sindh province and, of this, 94% is generated in Karachi. However, Sindh’s share in revenue transfers from the federal government is only 23.3% [
9].
The inadequate and inefficient transportation infrastructure is one of the major sources of traffic jams [
2,
10]. Therefore, accessibility, quality of life, and financial products suffer [
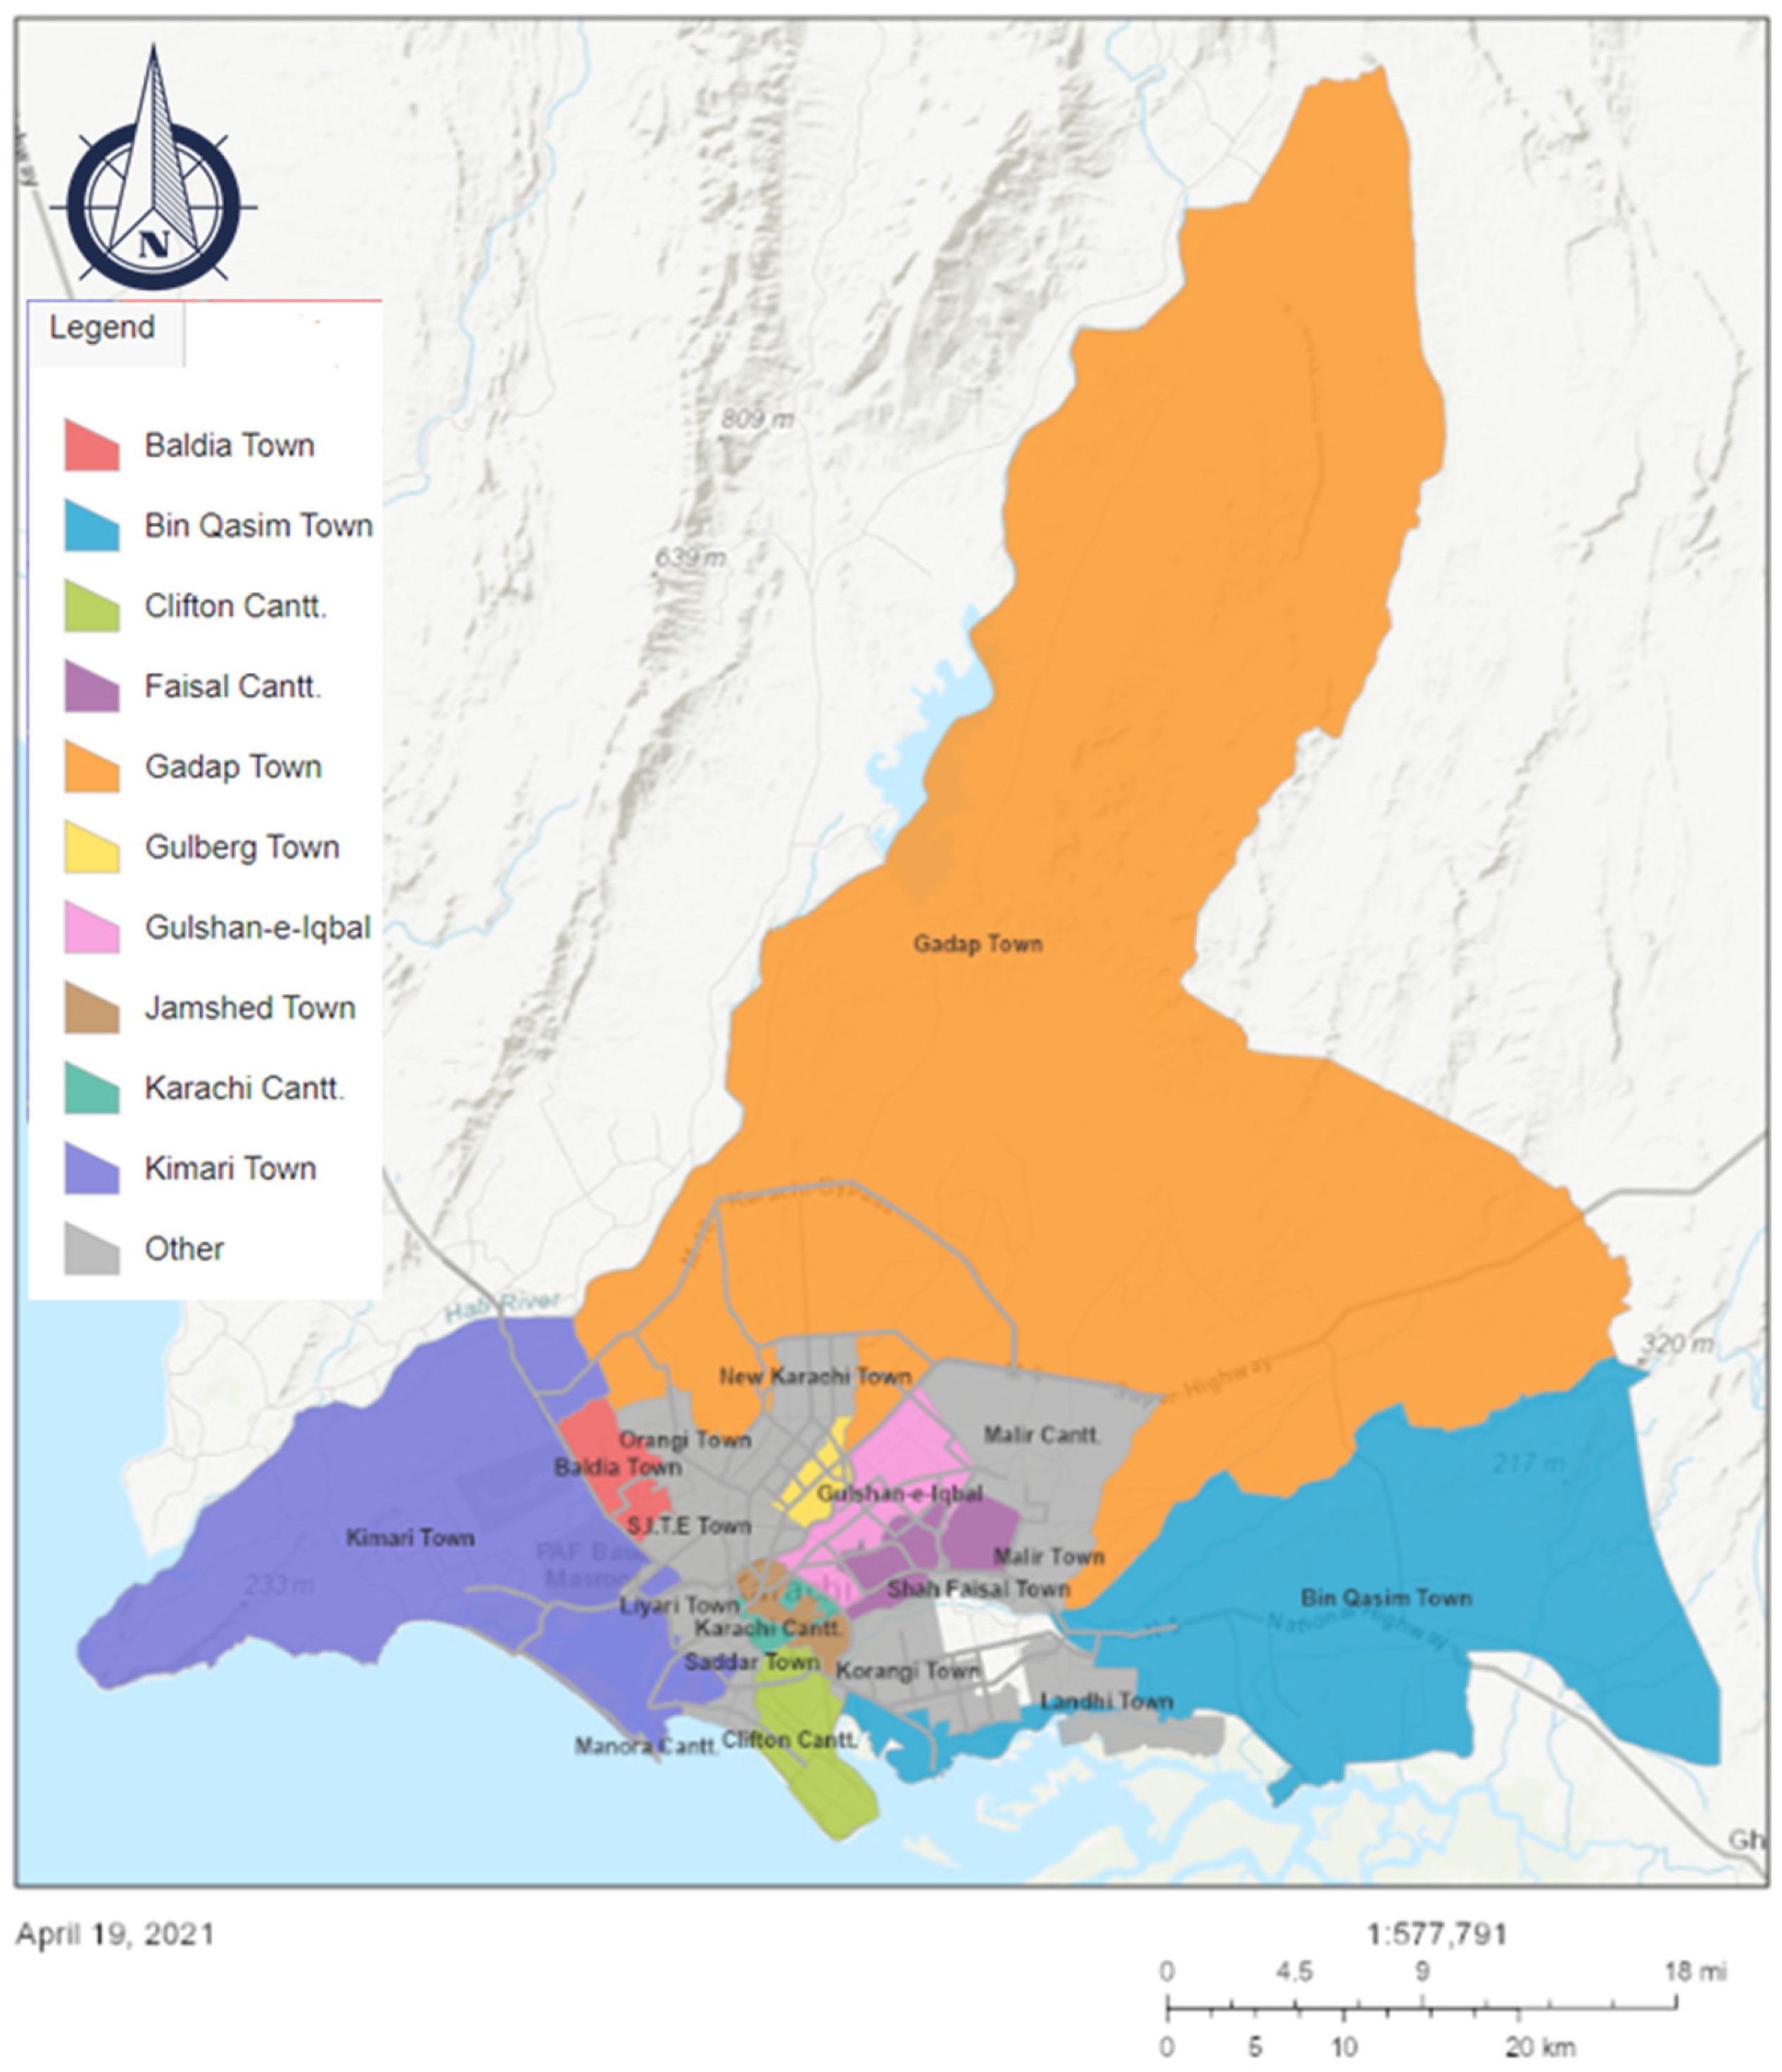
7]. Karachi’s southern district, specifically Saddar Town as shown in
Figure 1, is the administrative hub of Karachi and is known as the economic backbone of the country. The expanded urbanization and monetary development in the city have put a huge weight on travel demands [
11]. Private transport ownership dominates the existing roadway infrastructure by around 33%, which creates enormous pressure on roads and expressways [
12].
The provision of public transportation cannot help to reduce the long-term traffic jams. Travel demand management (TDM) strategies executed efficiently with a light rail or bus service integrated with park-and-ride (P&R) can reduce traffic intensity in the long term [
14,
15,
16]. Different factors impact the usage of P&R infrastructure, such as public transport service, parking lot circumstances, and parking area accessibility [
10,
17]. Other considerations include choice, time, and cost savings for the whole journey in comparison with travel by car. It is consistent with previous findings that car passengers are likely to use P&R if the travel time of the P&R is minimum [
10,
18]. Provision of dedicated bus routes in the city centre and complex changes can help to reduce travel time by the P&R service. Furthermore, Hamid et al. [
19] described that in comparison with other transport modes, it is important to save money and also time to use the P&R service.
The case study area comprises a gridded urban street pattern with low density and mixed land use. Inhabitants perceive the boundaries of their neighborhood according to the bus stops in the vicinity, although the locality has street numbers and road names [
20]. In Karachi, traffic congestion costs US
$2.5 billion per year and will exceed US
$7.85 billion in the coming decade [
8]. The government undertakes customary practices that promote motorists instead of sustainable solutions such as P&R service [
6]. Hence, there is a great imbalance between the usage of public transportation and single-occupant vehicle (SOV) users [
11,
14,
21].
This research is intended to investigate private transport users’ readiness to use the P&R service in the city entre of Karachi. Usually, individuals commute through a private vehicle which causes traffic congestion in the central business district (CBD) of Karachi [
2,
8,
11]. Without knowing their travel patterns people cannot be persuaded to switch to public transport [
19,
21,
22,
23]. The disparity between public and private transport has now risen. Therefore, it is essential to understand the commuting habits of SOV users to switch them towards alternative mode choices such as P&R service [
24]. P&R systems have been used widely in many regions and have been active in eliminating traffic jams and establishing parking spaces in urban centers in the context of travel demand management [
25].
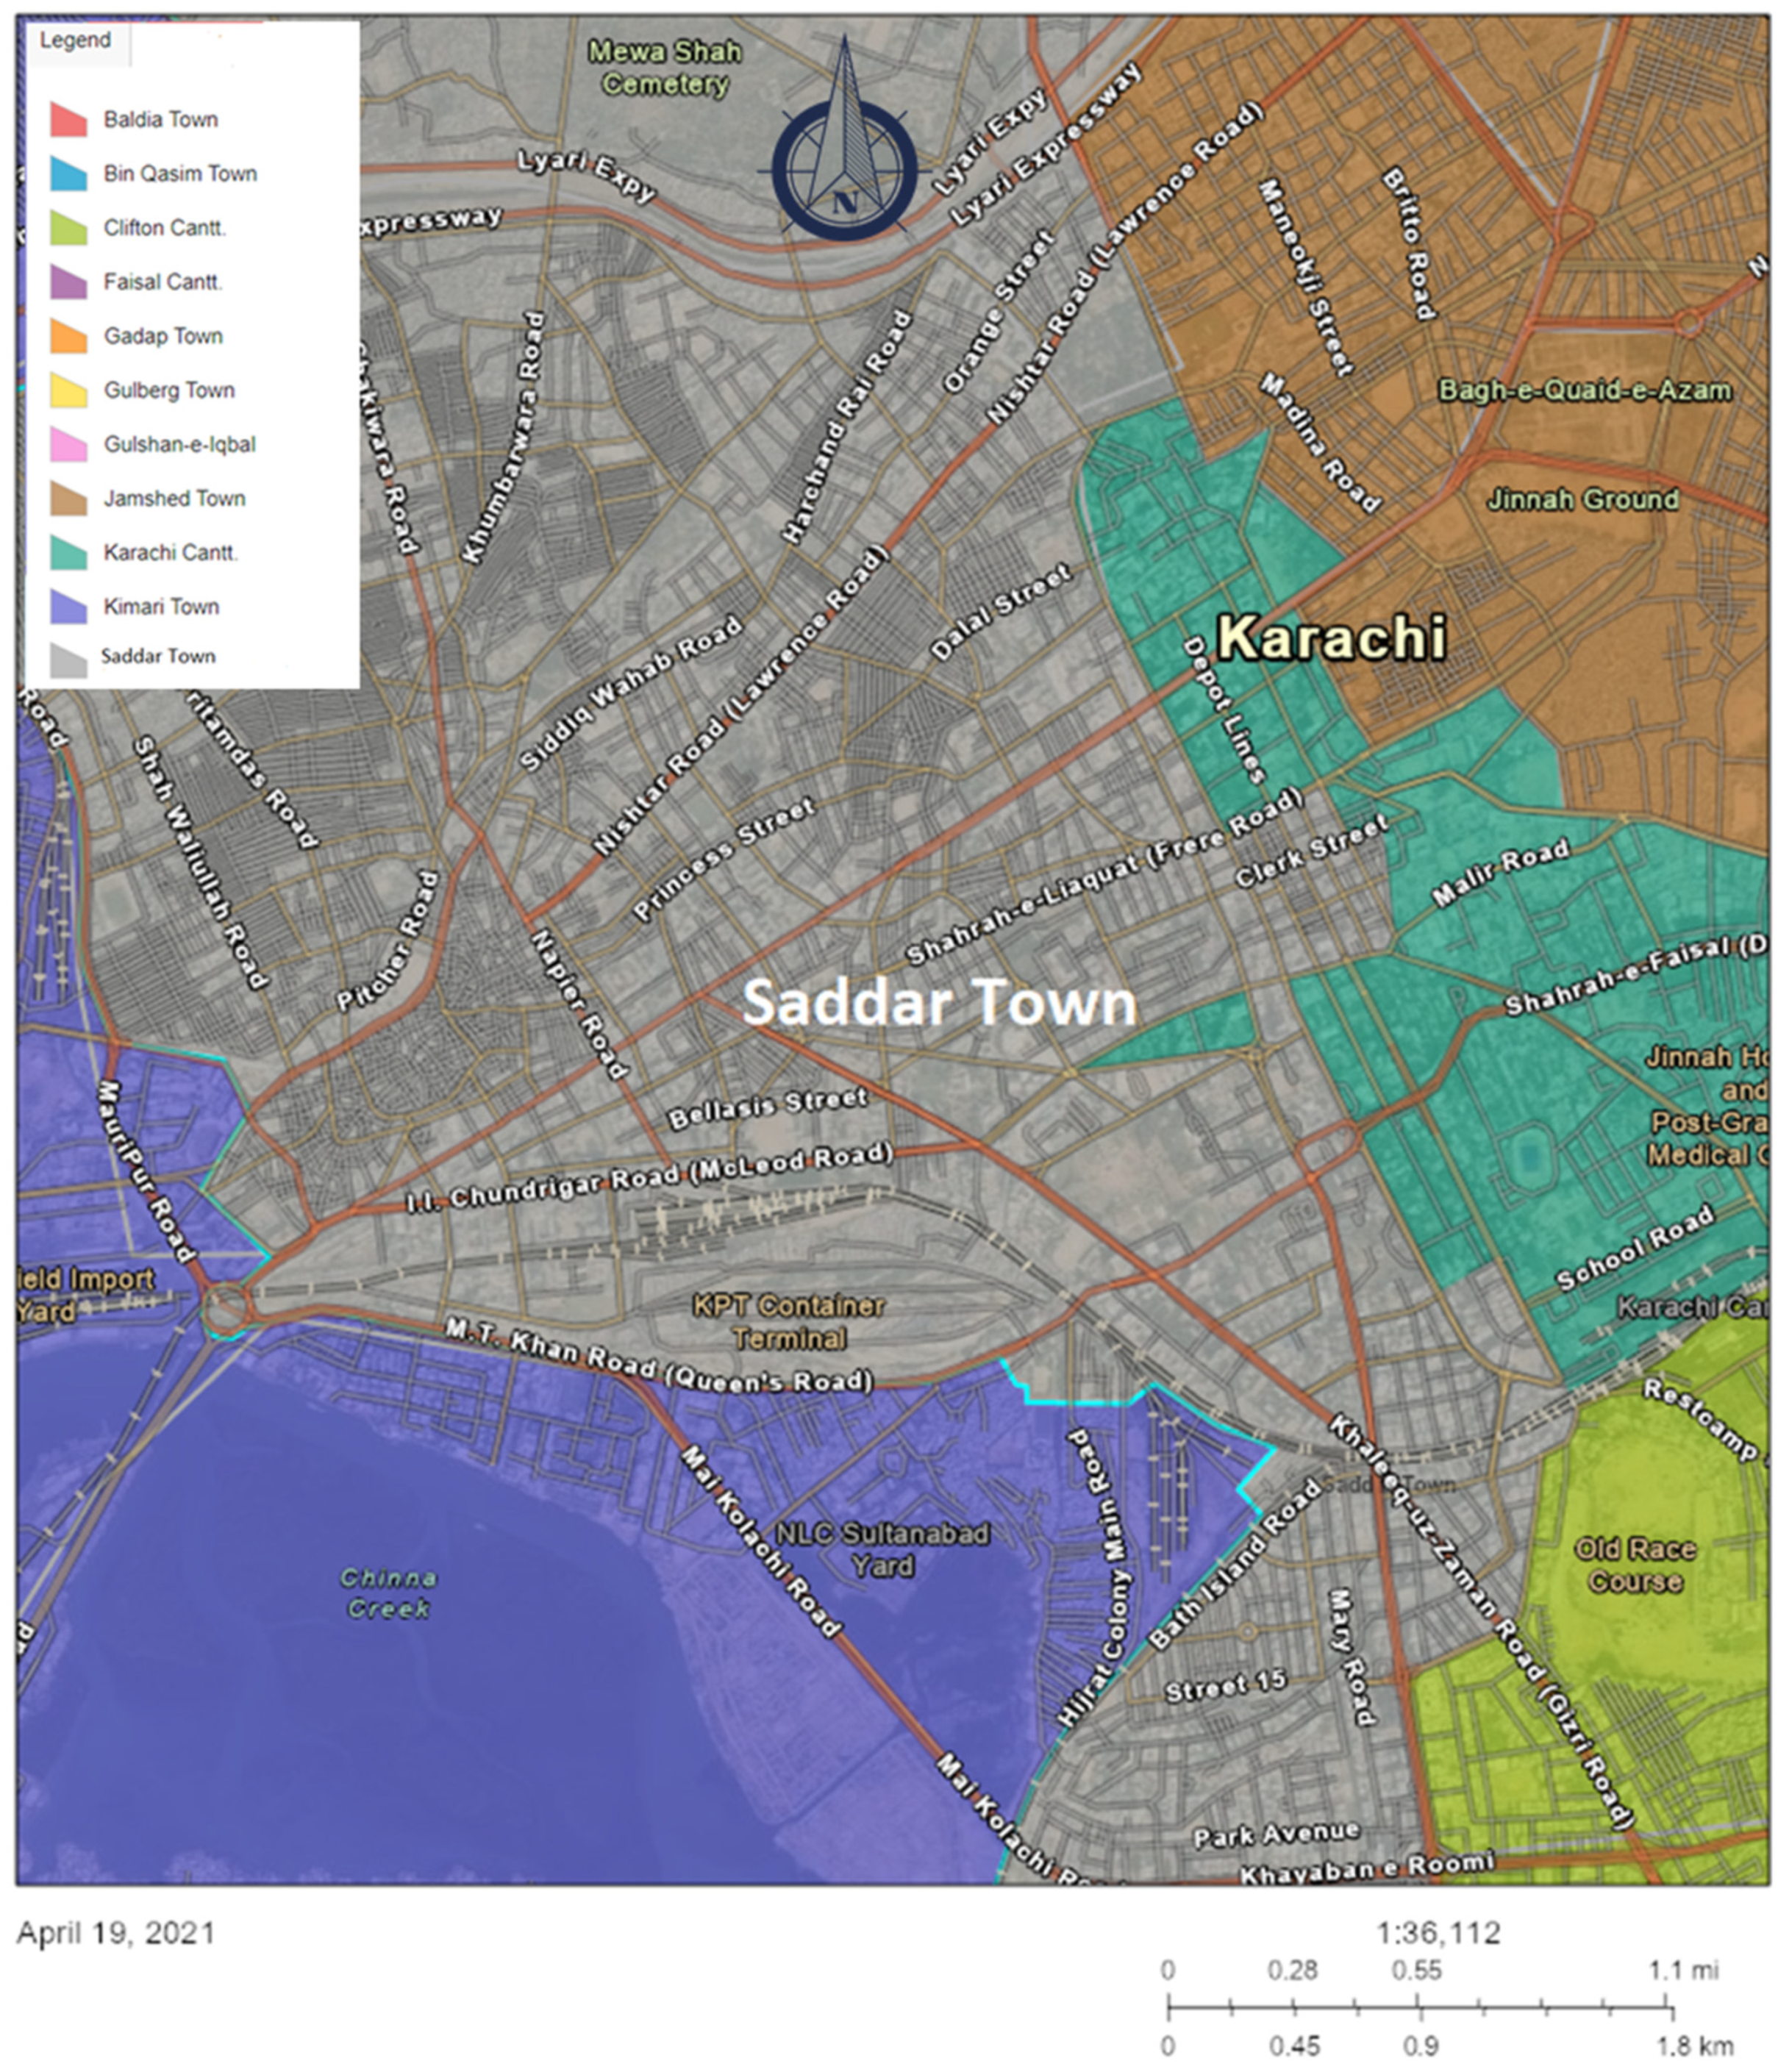
Karachi’s main CBD area Saddar Town is a conventional urban area with old infrastructure as shown in
Figure 2. This case study can provide a complete picture of individual behavior to adopt P&R service in a developing city. Furthermore, this study aims to determine the factors that influence SOV users to adopt P&R service at Karachi City center. This case study can provide a complete picture of individual behavior to adopt a P&R service in a developing city. This study can provide a useful guideline to the policymakers with road transportation for future promotion and planning of P&R facilities [
4,
23].
Thus, to achieve the aim, there is a need to conduct a travel behavior survey and develop a mode choice model to shift car travelers towards a P&R service in Karachi. Therefore, this includes two objectives such as:
This research specifically is focusing on the willingness to adopt P&R service and attempting to find variables that can encourage private transport users towards the P&R service and know influencing factors of captive users. Hence, a comprehensive Mode choice model has been developed which can accommodate the CBD of Karachi and feasible for the developing world, because it has both new and old crowded areas. Karachi CBD is selected because it is a densely populated old city. This study focuses on a broad range of variables that are divided into seven different categories.
2. Literature Review
The growth of private cars and their usability creates traffic congestion and environmental pollution. Additional important factors to be measured in decision making of mode choice regarding existing and changing lifestyles which create a variety of travel needs. Travelers are now extremely reliant on the car [
26]. Nevertheless, the car is an important mode of transportation [
27]. A car plays an important role; that is, feelings of influence, independence, reputation, supremacy, and power [
27]. Moreover, the productive use of cars relies on the travelers’ lifestyle, social and spatial engagements [
28]. Certain car travelers cannot often drive without need but in addition to their preference [
29,
30,
31]. Such strategies may involve advancement in the public transportation system and attract them to sustainable modes, for instance, cycling or walking. Furthermore, it is necessary to promote measures that deter automobile usage [
32].
As indicated by a study, around 20% of the automobile trips are self-evident; 60% could be impacted and reliant on the quality of public transportation, office timing, and the premises of services; and 20% of the journeys can be alternated by other choices, for example, walking [
33]. In a journey from home to work it is seen as easier to change from a private vehicle to a sustainable mode choice whereas a trip to drop and pick up kids is hard to switch [
34].
2.1. Travel Demand Management
TDM is a term of procedures that intensify overall system competency through encouraging SOV to change to alternative sustainable modes of transport [
32]. Presently, the TDM strategy has 80 different approaches that encourage more efficient and sustainable transportation strategies, which are extensively actualized [
35]. TDM approaches are majorly divided into two spectrums as pull and push measures. TDM strategy is distributed into two approaches; pull and push measures, which are explained in various studies [
36,
37,
38]. Pull measures encourage SOV users into the sustainable alternative modes of transportation. Traffic management, improvement of alternative modes, integration of a multi-modal transportation system, and adoption of new technologies are examples of pull measures. Consequently, push measures to discourage the dependency on private transport such as influencing time, need for travel, discouragement by imposing parking charges, route restrictions, land-use design, and urban planning [
39]. Pull measures aim to attract private mode users to alternative modes, whereas push measures try to demoralize car users [
40].
2.2. Park and Ride Service
Qin in 2013 said a P&R service is a “traffic management approach to the increasing traffic problems in urban areas” [
24]. P&R is considered a new mode of choice that invites additional SOV travelers to adopt transit services [
24]. This method is encouraging SOV travelers to park their cars and take public transport to downtown areas by offering low or free transit parking rates for SOVs. It can release the traffic intensity in downtown areas of cities. Cities, for instance Washington, DC, Saint Louis in the United States, Oxford in the United Kingdom, Vancouver in Canada, and Singapore, have implemented P&R services successfully [
24,
41,
42]. Additionally, Whitfield and Cooper in 1998–99 [
43] focused on their findings that to increase attraction, P&R services are as efficient as private car travel (with switching times). Therefore, standard service and bus precedence approaches need to be considered. Similarly, studies in the UK showed that 81% of prospective bus passengers felt that regularity (at least once every 10 min) was sufficient to enable them to use the service [
44]. Personal lifestyle and activities have a huge effect on the travel pattern [
45]. Consequently, potential clarifications on low usage of public transport include not only changes in efficiency, but also the consideration of the travel behavior of SOV users.
2.3. Mode Choice Modeling
Modeling is an essential portion of almost basic choice-making methods. It is apprehensive about the techniques such as those that are quantitative or subjective, which permits it to concentrate on the connections that help to make the best choice [
46].
Transportation has a vital role in economic growth. Significant actions are being made in transportation planning and policymaking to predict and meet future requirements for trips. This foresight needs to merge the planning of transportation frameworks, by using the current services and the trips conducted by the people of the certain region. These are outlining and determining systems for the main transportation arrangements that can be scientifically identified and gathered as transportation modeling. Transportation modeling plays a substantial part in the sophisticated arrangement of transportation planning and decision making [
47].
The essentials of transportation modeling were created in the U.S. during the 1950s and were then adopted in the United Kingdom in the 1960s. From that point, the taking after 20 years saw important hypothetical advancements in transport modeling prompting additional work, especially in sub-zones. A modern measurement was the improvement in mode choice models presenting the travel pattern of the commuters in the research zone. From that point forward, the enthusiasm for this field, and additionally developing many-sided quality has prompted further advancement of different travel demand models. Consequently, a significant portion of these models follows their starting point back to the traditional travel demand model, the four-stage model (FSM), its general structure, rational application, and coherent interest [
48].
2.4. Discrete Choice Models
Discrete/qualitative choice mode decision models have been established to explore the factors affecting travel patterns. The hypothetical base is a random utility theory [
49,
50], where individuals often want to substitute the maximum utility. Thus, there is also a random part that the predictor cannot perceive. These models estimate the possibility that an individual will use different variables to convey alternatives. These models are involved in the sophisticated study of numerous factors that affect modal split and trade-offs. The current model (Revealed Preferences) or the hypothesizer (Stated Preference) may be used to create discrete choice models. It is a vital explanation for modern models of discreet choices to recognize the results of strategic measures. Characteristics must be understood and included, and their principles can vary from realistic policy decisions. In the simulation of mode choice, models include operation metrics such as frequency, travel time, travel cost and efficiency, etc.
This model has been used in several studies by many researchers, like Irfan 2018 [
4], Memon et al. [
23] Ceder et al., 2013 [
51], Elias et al., 2013 [
52], Duncan et al., 2013 [
53], Ettema et al., 2012 [
54], Baohong et al., 2012 [
25], Hui, He, 2009 [
55], Bajracharya, 2008 [
56], Hamid et al., 2008 [
19], Liu, 2007 [
57], Ghani et al., 2006 [
58], D. M. Bos et al., 2004 [
59,
60], R. Hole, 2004 [
57], Lindstrom Olsson, 2003 [
34] and Himanen and Kulmala, 1988 [
61,
62].
The utility is commonly referred to by coefficients as attributes of a trip, subjective aims to express their comparative significance as experienced by the commuter. A probable numerical demonstration of a utility function of a mode m is presented in Equation (1) as,
where
Umi is the total utility function of mode m for individual i;
Xmi1, … Xmik are k number of attributes of mode m for individual i; and
θ1,…… θk are k number of coefficients which needs to conclude from data collection.
The mode choice model depends on the truth that all travelers chose the substitute mode choice with the maximum utility. However, the utility depends on the qualities of the mode choice and the travelers’ deliberate variables. The utility of an alternative
i to travelers’
n can be depicted as in Equation (2):
Ui represents the total utility for alternative
i. ε is an unobserved factor. The unobservable factor is due to the missing factors, unobservable factors in the preference of commuters’ assumed errors, and use of alternate factors. The observed utility part
Vin is a cumulative sum of observable attributes of the available alternatives, for instance, travel cost components
Xk as described in Equation (3) [
63].
The parameter
reflects each influence’s relative weight factors
Xk [
63]. It incorporates measures such as travel time, travel cost, transit time, availability of seats, and others. For example, it adds up travel time, transit time, travel cost, the number of exchanges (mode choice), walking time, and the quality of on-time [
64]. These variables are described as below in Equation (4);
The hidden part should be stochastic and similarly appropriated with institutionalized distinction. Assume that the undetectable part is easily indistinguishable Gumbel-distributed. The likelihood of choosing a specific substitute mode choice
i (logistic model) is given below, and the proof of this equation can be reviewed in the book “Discrete choice analysis: theory and application to predict travel demand” [
65].
2.5. Binary Logit Model
Mode choice modeling frequently used logit models in the field of transportation planning and engineering. However, the logit model can predict the sophisticated travel behavior of any group of people with simply calculated systems. The numerical system of logit models relies on the theory of utility maximization and is examined in detail in Ben-Akiva and Lerman 1985 [
65].
Equation (5) can be explained as
Pin is the probability of choosing individual
i choosing mode
n,
Vin represents the observable part of the utility of mode
n for traveler
i.
Vim is equal to all the alternative mode choices
m. The scale parameter cannot be estimated separately.
M is the aggregate number of accessible traveling modes in the decision set for traveler
i.
All logistic models are indicated on the foundation of Equation (2) and are connected concurring to Equation (5). The theoretical system of logistic models depends on three basic rules concerning the error term εin, as appearing in Equation (2). The rules are mentioned as follows,
εin is Gumbel-distributed.
εin independently distributed.
εin identically distributed
The principal formulations of algorithms for logistic models include all these perceptions. The first understanding that the arbitrary component is sufficient indicates that all functions relevant to travel modes can be treated as a linear aggregate of attributes that have identical parameters [
65]. The last two perceptions are commonly designed to be described as an Independence Association of Irrelevant Alternatives (IIA property), which effectively means that any mode choice used to illustrate travel behavior is independent.
There are two distinct types of model of choice: aggregate and disaggregate. The disaggregated (microscopic) model is used for independent travelers to determine the factors that affect the individual journey. Thus, this model allows the evaluation of parameter values correlated with factors that can influence the relative significance of these factors, respectively. Eventually, in what-if predictions, this model can be used. A sample of travelers is chosen for alternatives and their attitude is high. The odds are calculated for each traveler to select its alternative modes. This conclusion gives the percentage of users who use such an alternative. In comparison, the behavior of the large number of users who are meant to be similar is modelled. Aggregate models work with these classes with the usual expectations. These are versatile in use; however, they are less conscious and less precise about the actions of travel choices. Logit models are mainly distributed into two groups: binary and multinomial logistic models. Binary logit models have been fitted for a demonstration with two distinct/consistency choices; individual passengers have only two possible determination alternatives. However, a multinomial logistic model infers a broader variety of options.
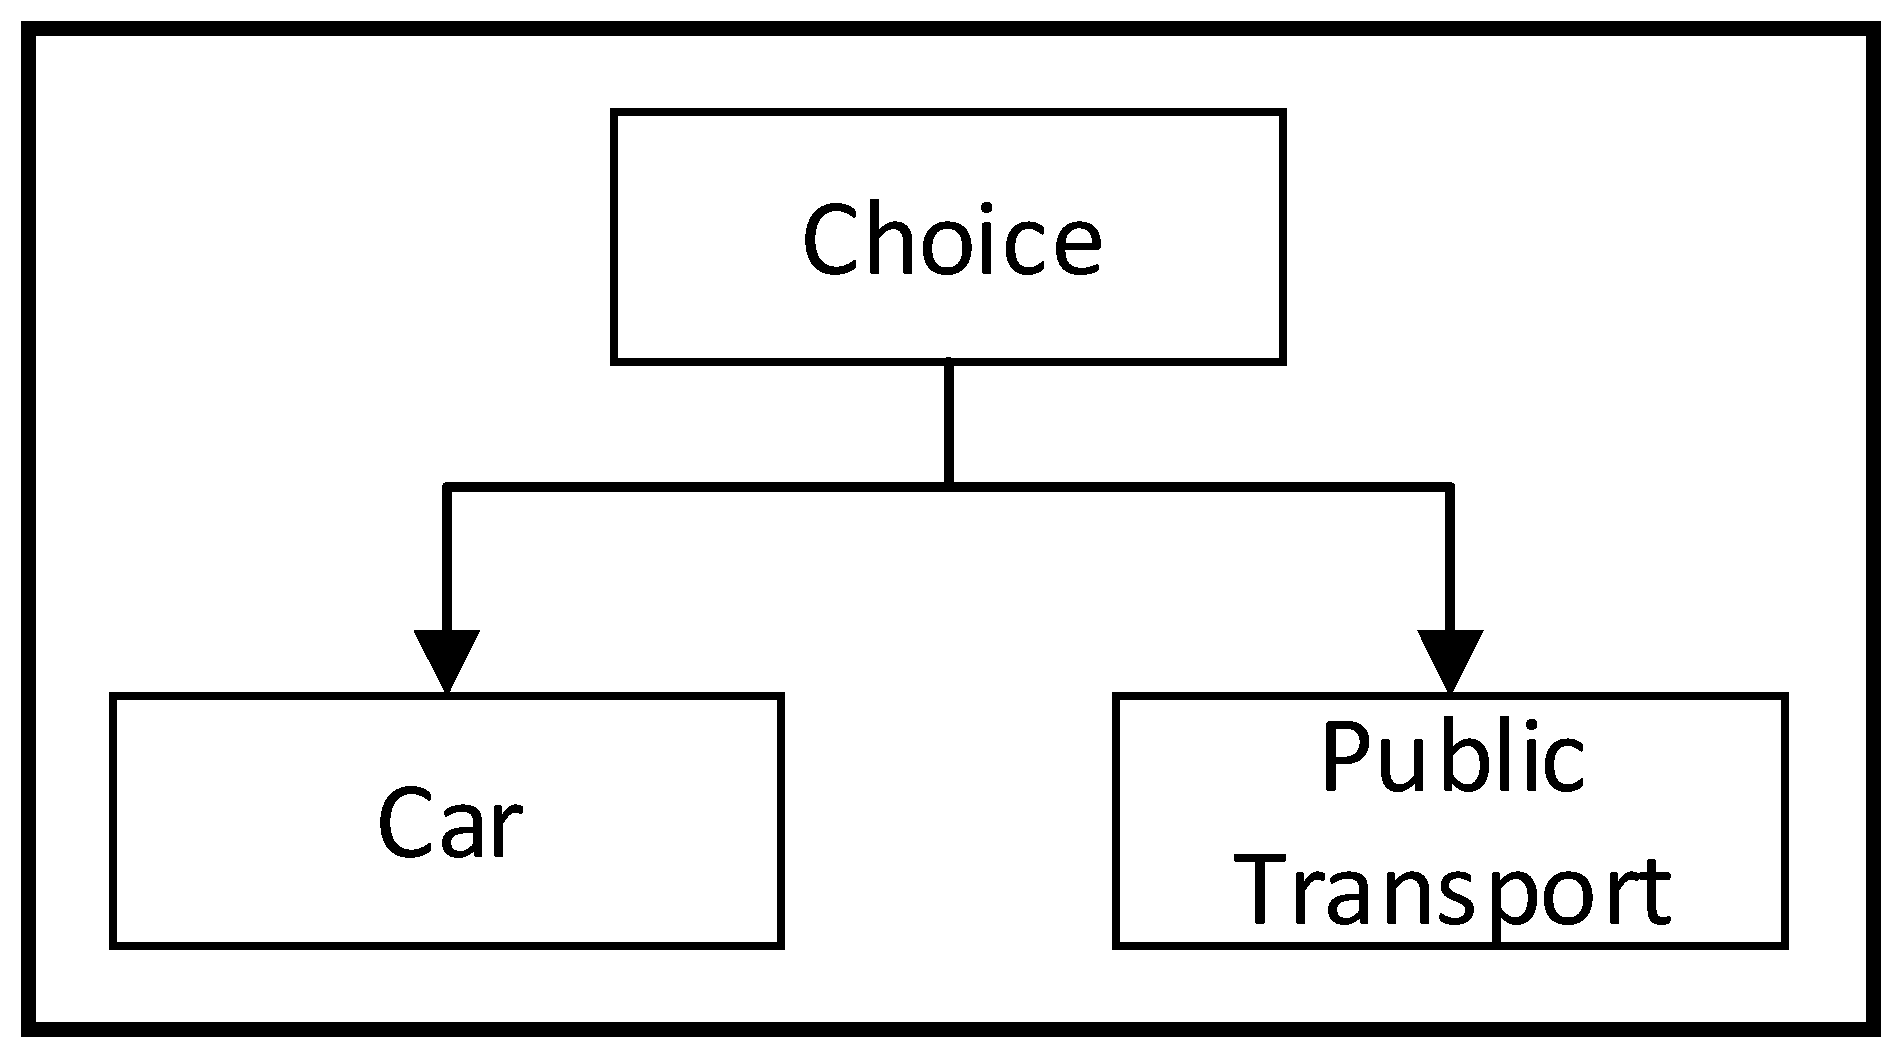
The algorithmic structure of a binary logistic model is a basic demonstration of Equation (6) with the aggregate sum of existing choices constrained to two, i.e.,
M = 2. A case of a binary logistic model appears in
Figure 3 [
66], where the decision set comprises a private vehicle and public transportation as two contending options.
Improving Equation (5), the likelihood of individual traveler
i choosing the mode
m out of two accessible mode choices
m and
n is shown as in Equations (6)–(8);
or,
and,
where,
Vim is the utility function related to choosing
m for individual
i;
Vin is the alternative according to their utility function allied to choose
n for discrete
i;
Pim is the possibility that substitute
m will be chosen by discrete
i, and
Pin is the likelihood that substitute
n will be chosen by individual
i.
The fundamental constraint of the aforementioned binary logistics regression is assumed to be practicable only if the mode of choice is free from one and the other. However, there are collections of more identical or matched modes, the doubt of having a free and vague error term over each one of the modes does not remain legitimate.
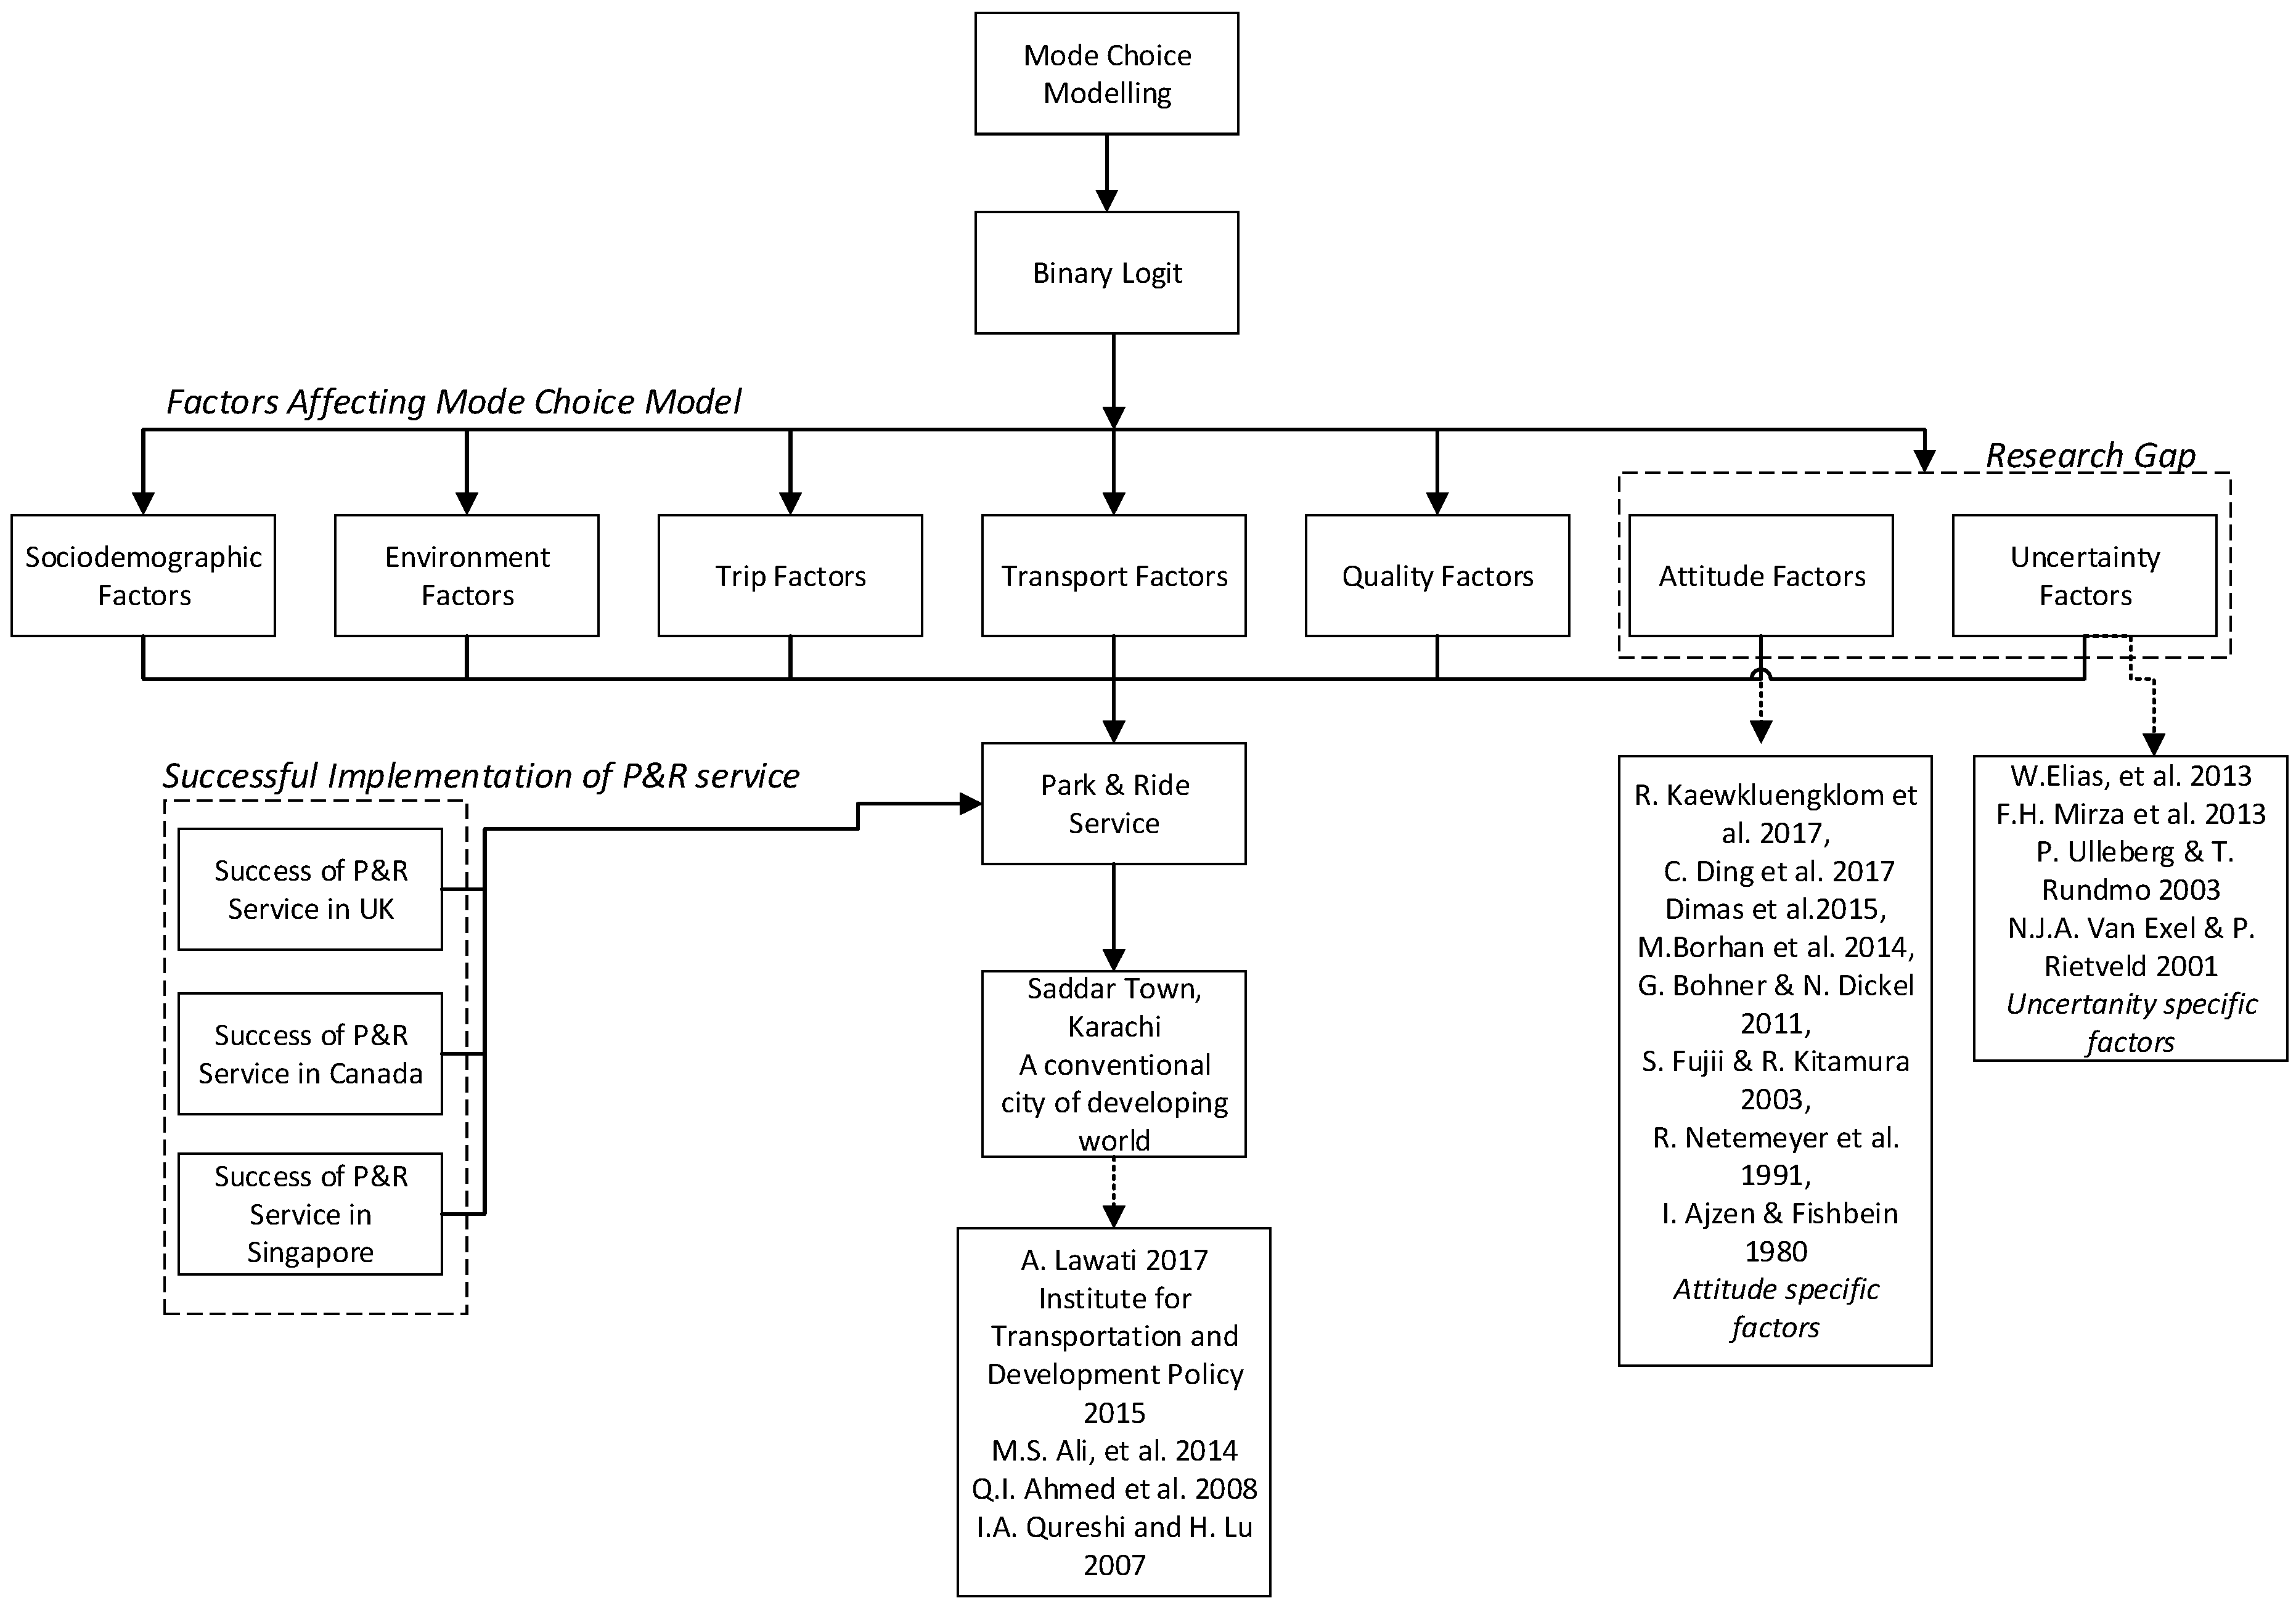
Literature expresses an intensive and critical literature review as it is shown in
Figure 4, the literature tree diagram. Different factors have been discussed by different researchers [
34,
67,
68]. In this research, few modest factors are introduced such as attitude and uncertainty. Attitude is tested through personal status, privacy, and car convenience factors in this study. The different researchers discussed the attitude factor in travel behavior research. Furthermore, Borhan et al., in 2014 recommend that the effect of attributes concerned with hindrance needs to be discovered in the future [
69]. Uncertainty-specific factors such as: protests and strikes by different groups, the threat of terrorism, and violence. Terrorism factors concerning road and public transport have been discussed by different researchers and few studies have looked at these [
52,
70,
71]. Similarly, terrorism and security threats have been signified as modern factors [
52]. Therefore, these uncertainty factors are included in the study. In Karachi, there is much uncertainty due to terrorism [
72], travellers suffer due to violence, snatching, and robbery on public transport. However, in the present evolving reality, which needs to deal with progressing terrorism dangers, fear of violence has turned into a reality for public transportation. Hence, security has turned into a fundamental problem that requires genuine attention, and it can impact the existing and proposed public transportation services.
3. Methodology
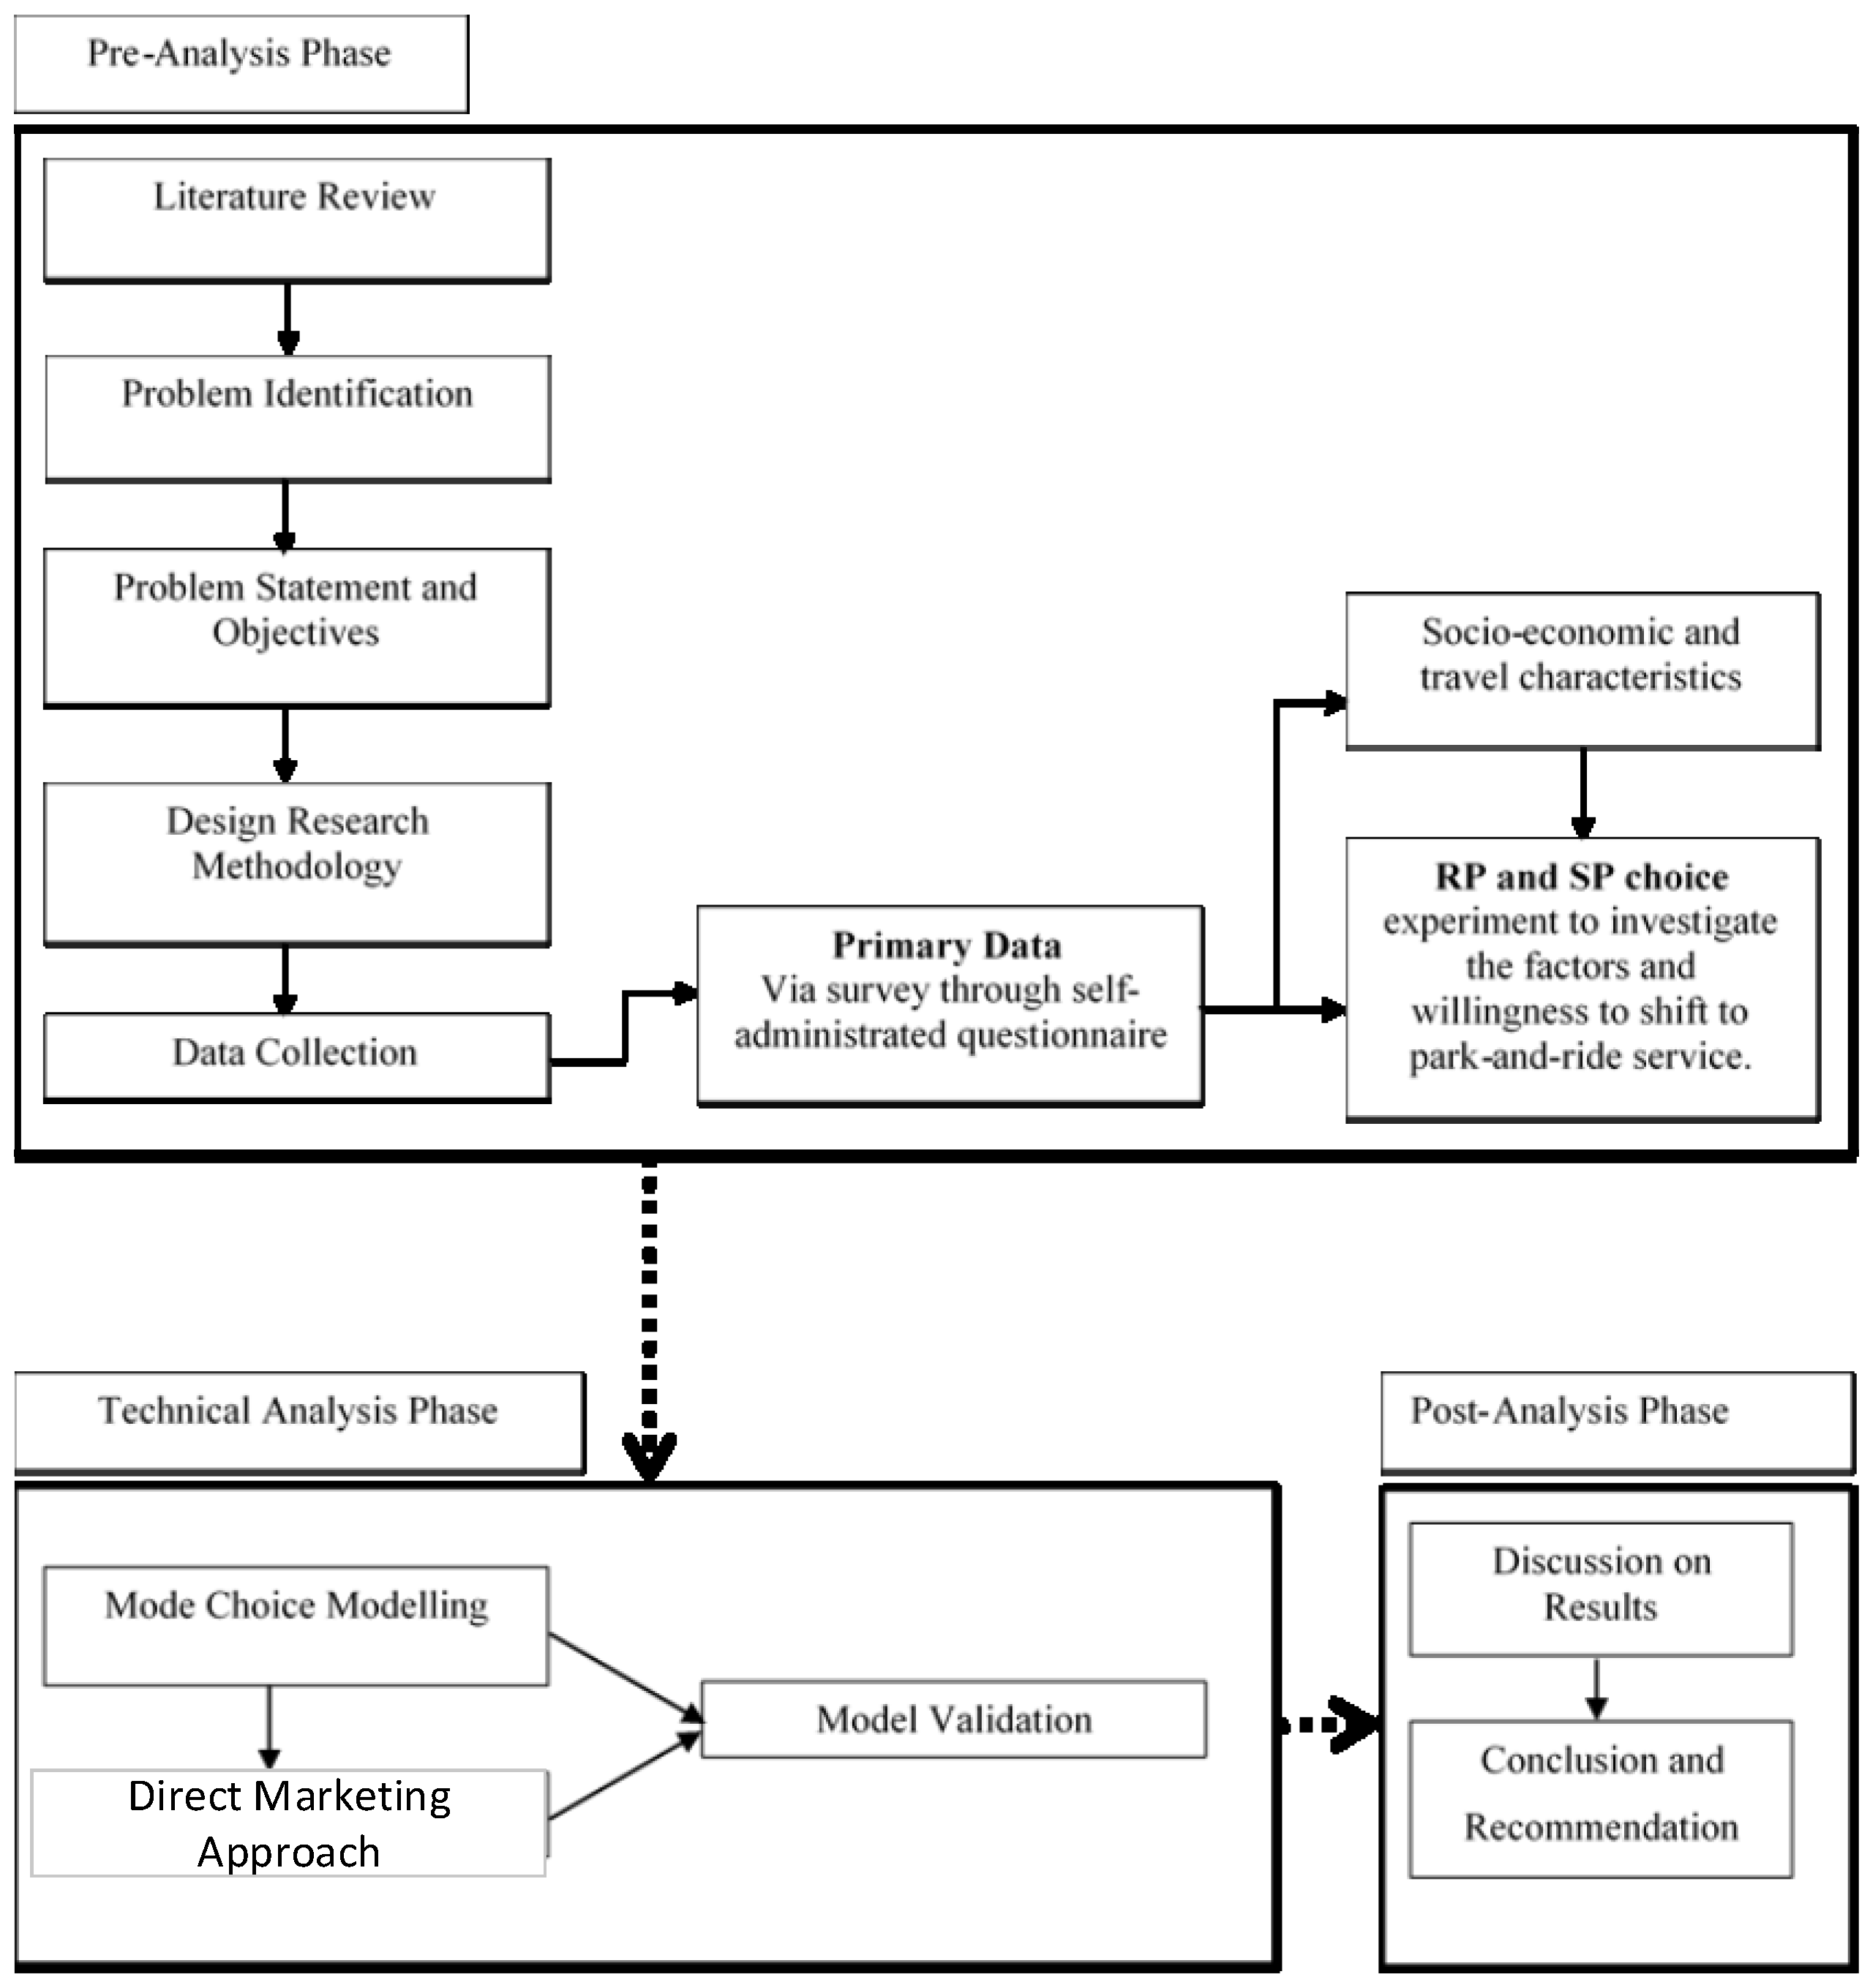
This research is based on mode choice modeling which follows research flow. This methodological flow is distributed in three phases, according to their nature of research methodology as shown in
Figure 5. The study begins with the actual urban transport situation in the area of study. Step one is a pre-analysis phase, phase two is technical analysis, and phase three is a post-analysis stage. This research depends on primary information. Primary data are collected through a self-administered questionnaire.
The primary data was taken from non-users of the P&R service. Specifically, private transport users were the main focused group of study to filled-up a self-administered survey questionnaire. The questionnaires were filled in physically at the workplace and through a Google form approach to meet the demand. The research survey had both revealed and stated preference approaches.
The technical analysis phase discussed the modeling of data. The binary logistic modeling approach was applied to develop a mode choice model. After developing the model, it was validated through the direct marketing approach of SPSS data analyzing software.
3.1. Study Variables
Travel behavior addresses the factors which are influencing the users and non-users of a P&R service. According to the literature, as discussed in the literature review section, this study comprises the socio-demographic, environment, trip, transport, quality, attitude, and uncertainty-specific factors. In particular, these specific factors such as socio-demographics consist of, age, gender, income, educational level, household size, and transport ownership. Environment-specific factors consist of environmental protection and harsh weather. Similarly, trip contains; travel time per trip, vehicle sharing, drop kids/family members, shopping, travel directly, travel expenses, trip distance, the effect of travel time, and trips per day. Furthermore, transport-specific factor focuses on, mode of traveling, the parking problem, traffic congestion, fare rates cheaper than a car, the frequency of a bus, and improper location of a P&R station. In contrast, quality-specific factors include: avoid mental stress, comfort preferences, and expensive parking at the workplace. Attitude as a modest factor contains; personal status, privacy, and car are convenient specific variables. Lastly, uncertainty is also a modest factor comprised of safety at parking lots, safety and security on public transportation, the threat of terrorism/violence, and the threat of robbery/snatching factors. The list of all variables is shown in
Table 1. All the factors are considered and tested as explanatory variables and their direct impact on the outcome variable is tested.
3.2. Choice of Data Source
The process of mode choice modeling and estimating the influencing factors and willingness to choose the P&R service is a complex procedure and requires the utilization of a variety of data collections. This research includes published articles, primary data, revealed preferences (RP), and stated preferences (SP) information from focused clusters which are discussed below in this subsection.
Published data are used to give contextual data on previously influenced factors on travel patterns of the travelers. They can be utilized to contextualize and scale a model based on a limited information set. Census reports, demographic and traffic departments can provide information about specific populations, the number of different modes of vehicle, and users of various mode choices in study areas. Data from the above sources will be used in this research. Internet sources are a priority for obtaining information from concerned departments’ websites.
RP data acquired by a self-administered questionnaire. It is beneficial to reveal the travel pattern of travelers under current situations and use of mode choice. A comprehensive summary of a trip can be revealed by asking various questions about the preceding travel behavior choices including the number of the trip, the reason for the trip, and modal split. To organize the appropriate choice set, queries can be asked concerning travelers’ perception of preferences of a collection of mode choices accessible to them when they were deciding their trip. Furthermore, RP questions, are based on previous travel behavior and answerable to avoid prejudicing characteristic in the SP facts. RP information, the collection method is included in the self-administered questionnaire in this research.
Consequently, the SP method is used because of hypothetical questions asked from the targeted group. SP methods are extensively used to study the travelers’ choices and attributes. Usually, SP techniques offer travelers some hypothetical situations in which several choices are described regarding preferences with different preference levels. The researcher is then frequently asked to select the substitute which they wish for. The attributes expressed specify the comparative importance of the preferences that identify every choice. The most important benefit of the SP experiment over the RP experiment is that it enables the analyst to investigate the impacts of key factors in a productive manner.
Herein, the SP approach was adopted to measure variables that affect travelers’ mode choice. The participant selected between the hypothetical situations or described their priority by selecting one choice from several choices. The SP method is chosen when it is hard to gather answers for a particular modal that is not in practice currently and cannot be considered in reality or where optional factors are difficult to differentiate from the essential ones [
50]. Essential or hard factors, for example, travel expenses and trip time, are frequently used in transportation models. Socioeconomic variables and the quality of modes are instances of optional or soft factors [
34]. The SP method also requires less effort than RPs, as each respondent is asked to choose more than one option.
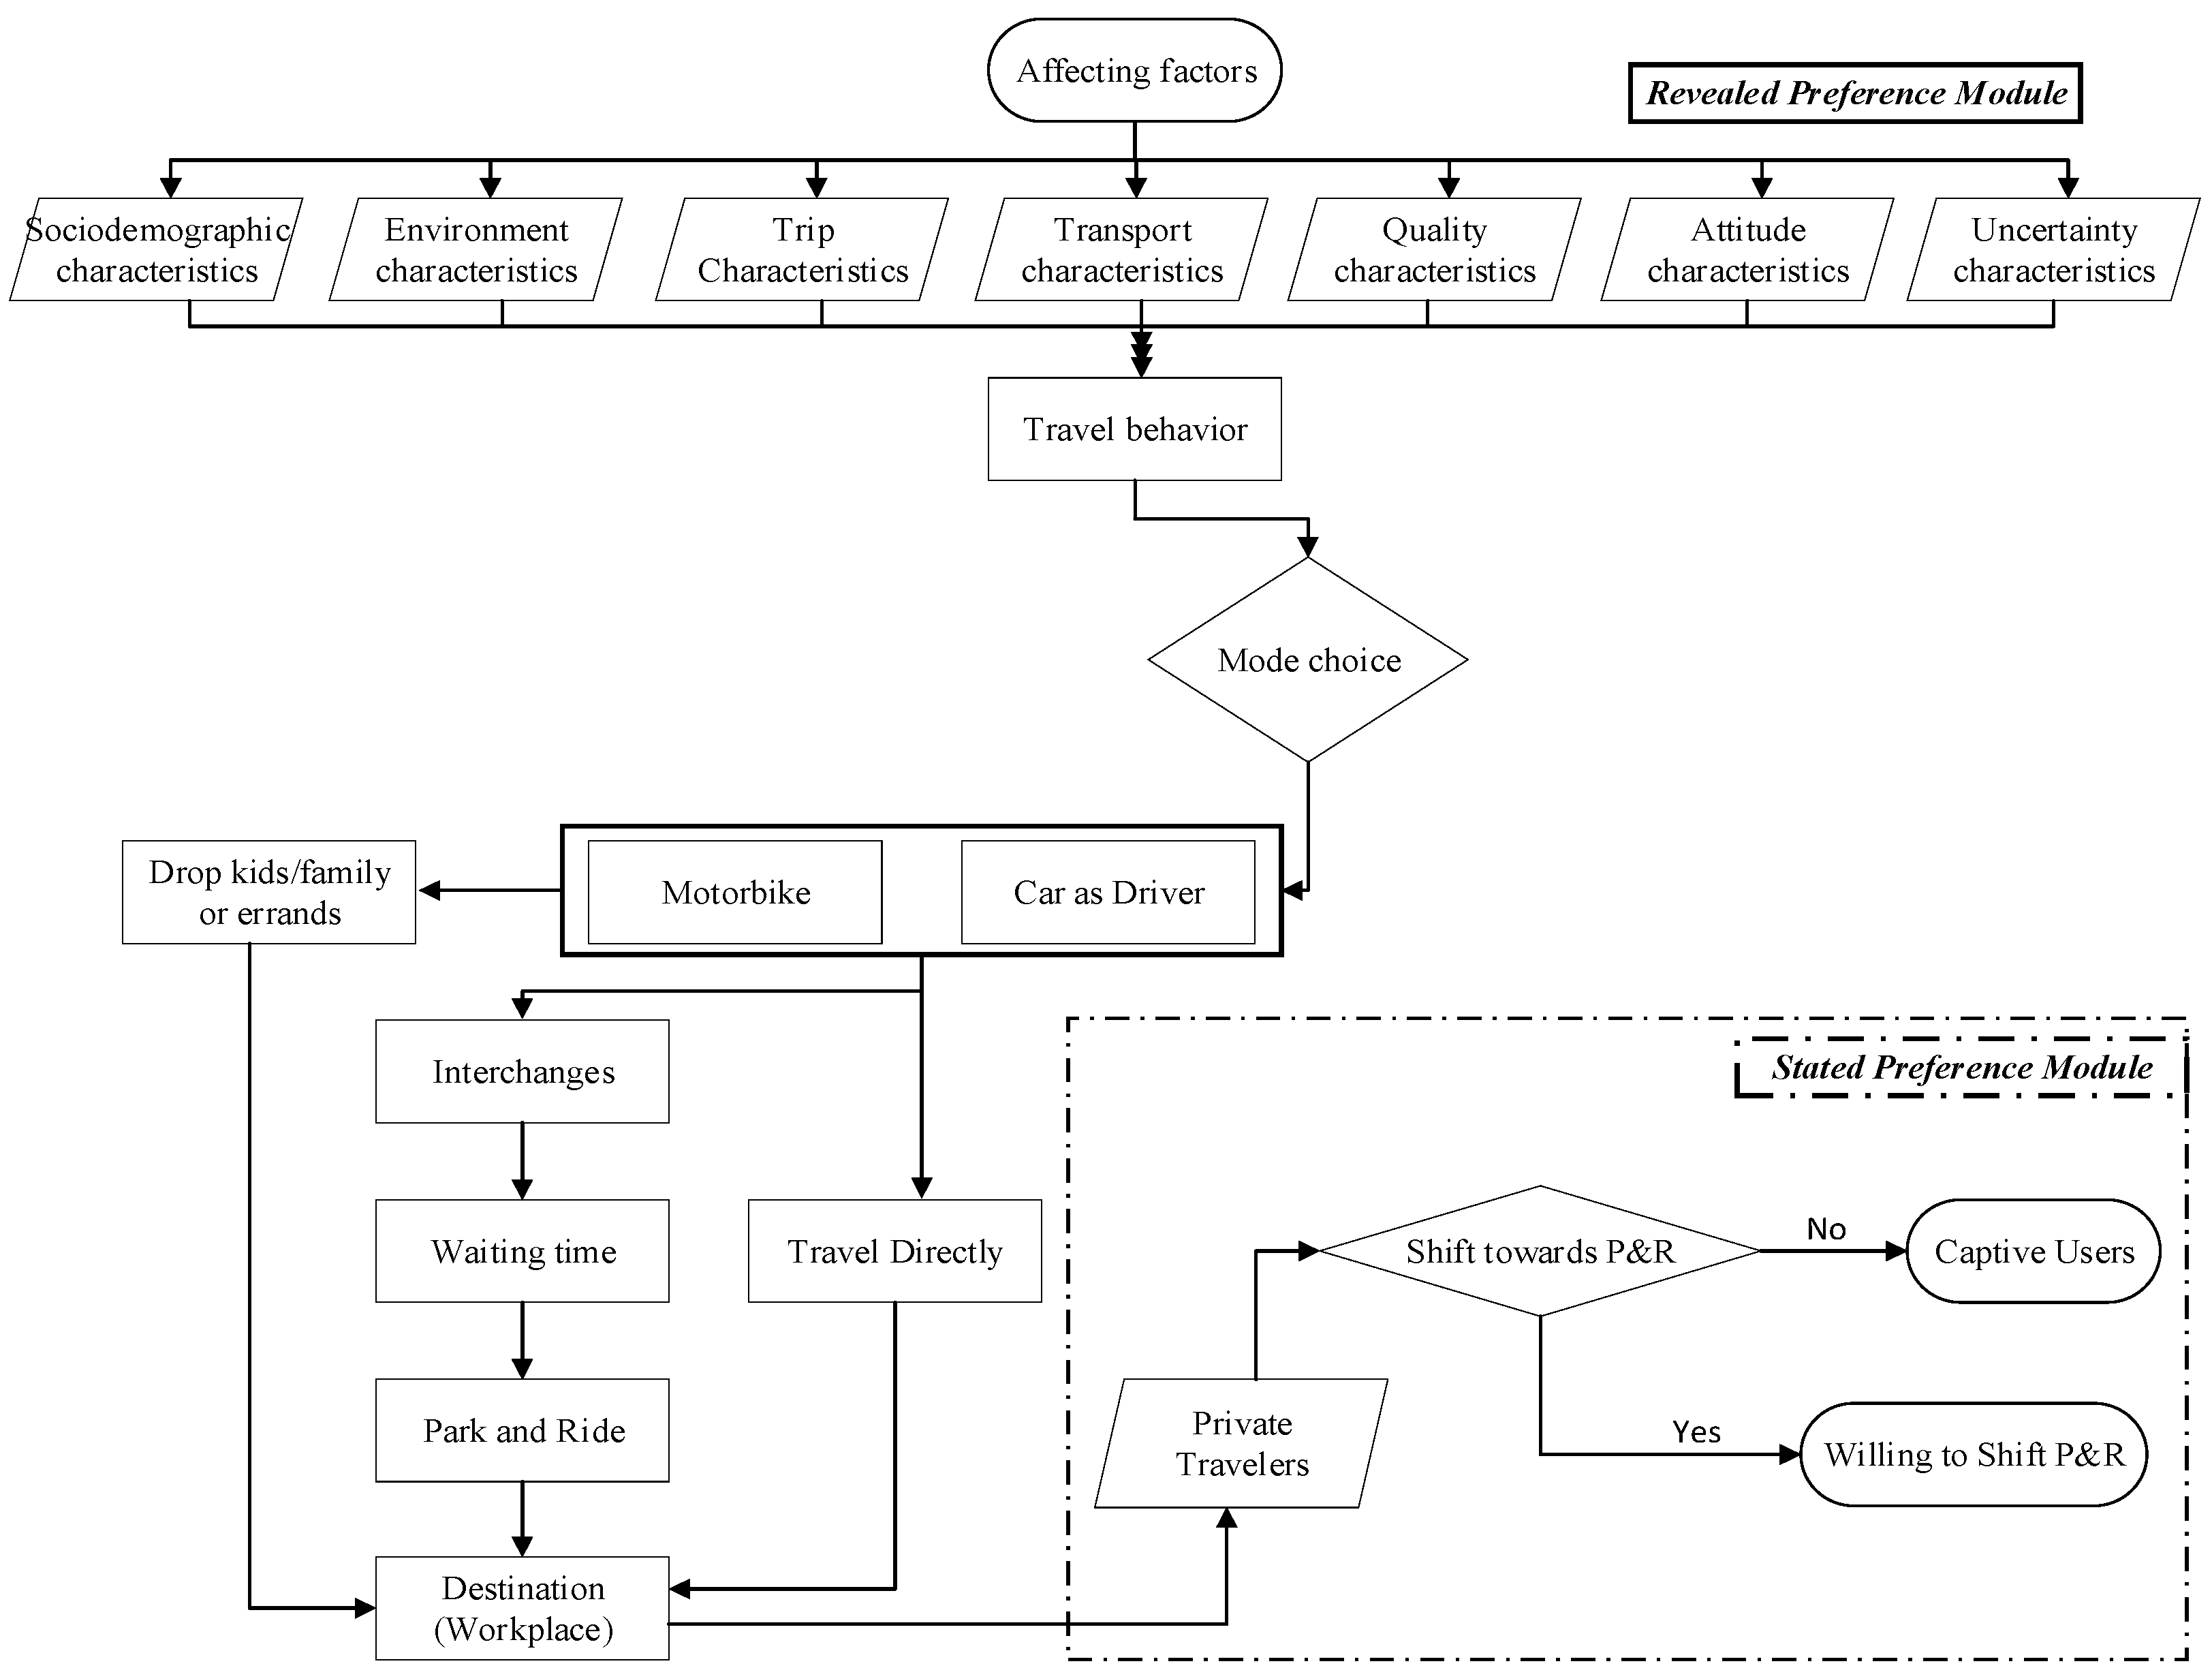
Furthermore, the influence of the factors and their inputs in the model and research framework is shown in
Figure 6. The SP survey has advantages as well as disadvantages. The benefits and drawbacks of relying upon the outline and the way the variables are presented in the questionnaire according to the level of understanding [
71]. The researcher cannot be sure that respondents behave as they mentioned in the questionnaire. Therefore, the design of the questionnaire is essential if results are near to respondents’ behavior. In this research, an experimental design is utilized for decision experiments. Fractional factorial research allows scenarios to be considered. The major effects expect that all the insignificant factors are considered.
3.3. Questionnaire Content
This questionnaire can provide unprecedented information about the long-term social and economic well-being of the study area. Questionnaire variables are the main ingredient of the questionnaire contents. There are three types of questionnaire variable: attributes, behavioral, and opinion [
73]. The attribute variable contains data regarding the characteristics of respondents as shown in
Table 2. The behavioral variable is already expressive from its name. This group contains data on what respondents did in the past and are doing now or will do in the future. The behavioral variable is known as an RP in mode choice modeling research. Finally, the opinion variable records how the defendants express something or what they think to be certain and true or false or willing to adopt or not. This type of variable is known as the SP variable in mode choice modeling research.
The survey questionnaire also includes questions regarding the factors which affecting SOV users from the adoption of P&R service. Also, distances between P&R lot to workplace and parking charges at the workplace. The travelers were also asked about their fuel cost going to work by SOV and the distance from home to work. Socioeconomic questions were also considered, such as age, gender, income, and household size and qualification. Finally, a hypothetical question was asked about the willingness to adopt P&R service in the future.
3.4. Sample Size and Strategy
The sample size is defined according to the selection of sample consistent with the required precision of the assessed population that is an important contemplation for any study. From the number of the sample frame, the sample size was analyzed to choose the number of respondents required to be studied. The sample size for this study was 1000 according to Krejcie and Morgan’s defined and calculating sampling method [
74]. Ortuzar and Willumsen in 1996 [
75] mentioned that the sample size must not be less than 250 respondents. According to studies carried out in England, the study could satisfy having at least a sample size of 100 if it is divided into clusters [
76].
A non-probability purposive sampling technique was adopted to present the targeted population. Purposive sampling is named subjective, judgmental, or selective sampling procedure [
77]. It contains a specific purpose and the approach which usually are selected to comprise the people relevant to the targeted area and leaving the unmatched with the sample of research. This method of sampling was chosen because the population of study areas is known, but the sample frame or probability of sample selection is unknown. In other words, it was hard to know the population of buildings, departments, or offices, particularly in study areas. Furthermore, there were different purposive sampling approaches in which a homogeneous sampling approach was suitable for this study. The homogeneous sampling technique used to focus on a sample shares the same characteristics or traits to achieve a homogenous sample.
This approach was popular in several fields of research focusing on a particular point. This sampling approach also promotes studies related to the transportation sector [
4]. Generally, the researcher focuses on the respondents from the selected targeted people for research to gain proper feedback.
3.5. Analysis Technique
Binary logit modeling is also known as binary logistic regression (BLR). It is used to investigate the association between one or more independent variables (predictor) and one dichotomous variable (result). This simulation aims to predict the probability of predictors that a case is part of a cluster versus the other (e.g., whether a patient has cancer or not). The binary logistic regression creates an indigenous mixture of all independent variables (IVs) to forecast the dependent variable log-odds. In this computation, the overall significance of the regression model is tested by analyzing the
χ2 statistic, which is used with the degree of freedom (
df) to calculate the p-value (i.e., significance level). An overall significant model requires the significant prediction of the outcomes vector by the predictors. If the aggregate model is significant, each predictor variable’s value is evaluated. An odds ratio (
OR) is analyzed for every predictor variable and demonstrates the degree that every predictor variable influences the likelihood that a case is an individual from one outcome cluster versus the other. The outcome variable must be dichotomous to run a binary logistic regression test (i.e., only two outcomes are permissible). Observations shall be mutually independent and the relationship between predictor variables and the consequence variable logit-transformed must be linear. In economics and transportation binary logit modeling is also known as discrete choice modeling, which means predicting the choice between two alternatives [
78].
4. Results and Discussion
An approach combining RP and SP is adopted in this study to model the determining factors that influence the traveler’s mode choice. Firstly, this section develops a series of models to find the best fitting model for the collected results from Karachi. Several models were prepared based on the variables and travelers’ choice to use and not to use a P&R service by adopting a different combination of variables. From these models, the best model was selected for the willingness to use P&R service and revealed the best mode for captive users. Secondly, the chosen model was analyzed and discussed in detail. The discrete choice model approach was adopted in which the binary logit model is selected on the nature of the data of travel behavior.
4.1. Sociodemographic Model
The sociodemographic model of Karachi is coded as Model 1. BLR was conducted to examine whether IVs such as gender, age, educational level, household size, income, and ownership of transport significantly affected the odds of observing cluster willingness to switch towards a P&R service as shown in Equation (9).
The overall model was statistically significant, χ
2(8) = 34.99
p < 0.001, suggesting that; gender, age, educational level, household size, income, and ownership of transport significantly affected the odds of observing one group’s willingness to switch. The McFadden R-squared value measured for this model was 0.251 as shown in
Table 3.
The classification results before including predictive variables revealed that 74.8% of the cases could be accurately categorized merely if all cases were grouped as a willingness to switch. However, after the inclusion of IVs, the model now correctly classifies 79.2% of overall cases. The sensitivity was 31.3%, specifically 95.3%, the model’s positive estimated value was 81.47%, and the negative estimated value was 69.29%.
There were six predictive variables, and five of them were categorical and had different choices. All the said variables; gender (Male), age (31–40), educational level (secondary and post-secondary), household size (2–4), income (RM1000–6000), and ownership of Bike + Car they were found to be positively significant towards a willingness to adopt a P&R service, as shown in
Table 3.
4.2. Environment Model
The environment model was numbered Model 2, as shown in Equation (10). BLR was conducted to examine whether IVs significantly affected the odds of observing the cluster coded as 1 of willingness to switch towards the P&R service.
The inclusive model was statistically significant, χ2(3) = 1.142, p < 0.001, suggesting that these variables significantly affected the odds of observing one cluster of willingness to switch. The McFadden R-squared value measured for this model was 0.955. The classification results before including predictive variables presented that 76% of the cases could be accurately categorized simply if all cases were categorized as a willingness to switch. However, after the inclusion of IVs, the model now correctly classified 97.7% of overall cases. The sensitivity was 95.8%, specifically 98.3%, the model’s positive estimated value was 98.67%, and the negative estimated value was 94.65%.
There were two predictive variables, and both were categorical and have different choices. Protect the environment (Yes) was positively significant with the willingness to adopt P&R service, as shown in
Table 4. In contrast, harsh weather (Yes) was negatively significant
β = −6.7,
p = 0.00 with odds of 0.001. It predicts that harsh weather has a negative influence on the adoption of a P&R service, or another way around due to harsh weather travelers prefer their own mode choice.
4.3. Trip Model
The trip model is coded as Model 3. BLR was conducted to examine whether dependent variables’ IVs significantly affected the odds of observing cluster willingness to switch towards a P&R service as shown in Equation (11).
The overall model was statistically significant, χ2(8) = 0.465, p < 0.001, suggesting that transport share, dropping kids to school, and going shopping significantly affected the odds of observing one cluster of willingness to switch. The McFadden R-squared value measured for this model was 0.976. The classification results before including predictive variables showed that 76% of the cases could be accurately categorized simply if all cases were categorized as a willingness to switch. However, after the inclusion of IVs, the model now correctly classified 98.8% of overall cases. The sensitivity was 97.5%, specifically 99.2%, the model’s positive estimated value was 99.2%, and the negative estimated value was 97.5%.
There were nine predictive variables, and eight of them were categorical and had different choices. From all the nine variables, only three variables such as transport share (Yes), dropping kids to school (Neutral), and going shopping (Neutral) were found positive statistically significant as shown in
Table 5. The regression coefficient found that dropping kids to school and going shopping did not influence the adoption of a P&R service. Furthermore, travelers who share transport are willing to adopt a P&R service.
4.4. Transport Model
The transport model contains modes of traveling, parking problems, traffic congestion, and cheaper fare rates as shown in Equation (12). This model is coded as Model 4.
The overall model was statistically significant, χ2(8) = 162.57, p < 0.001, suggesting that; parking problem, fare rate cheaper, and traffic congestion significantly affected the odds of observing one cluster of willingness to switch. The McFadden R-squared value measured for this model was 0.982. The classification table before including predictive variables reflected that 76% of the cases could be accurately categorized essentially if all cases were categorized as a willingness to switch. However, after the inclusion of IVs, the model now correctly classified 99.6% of overall cases. The sensitivity was 99.2%, specifically 99.7%, the model’s positive estimated value was 99.7%, and the negative estimated value was 99.1%.
There were four predictive variables, and all of them were categorical and had different choices. From them, only parking problem (Yes), fare rate cheaper (Yes), and traffic congestion (Yes) were found to be positively significant as shown in
Table 6.
The regression coefficient predicted that parking problems, fare rate cheaper, and traffic congestion factors influenced travelers to shift towards a sustainable mode of transport such as a P&R service.
4.5. Quality Model
The quality model was coded as Model 5 and consists of IVs such as; avoid mental stress as shown in Equation (13).
The overall model was statistically significant, χ
2(6) = 5.747
p < 0.001, suggesting that only avoid mental stress significantly affected the odds of observing one cluster of willingness to switch. The McFadden R-squared value measured for this model was 0.898. The classification result before including predictive variables reflected the fact that 76% of the cases could be accurately categorized essentially if all cases were categorized as a willingness to switch. However, after the inclusion of IVs, the model now correctly classified 97.9% of overall cases. The sensitivity was 94.2%, specifically 96.7%, the model’s positive estimated value was 98.17%, and the negative estimated value was 96.99%. There was only one predictive variable, and it was categorical and had different choices. From the above variables only avoiding mental stress (Yes) was found to be positively significant as shown in
Table 7. It reflected the fact that travelers are willing to adopt a P&R service to avoid mental stress.
4.6. Attitude Model
The attitude model was coded as Model 6 and had IVs such as personal status, privacy, and the car as convenient as shown in Equation (14).
The overall model was statistically significant, χ
2(2) = 0.175,
p < 0.001, suggesting that; personal status (Yes), privacy (Yes), and the car was convenient (Yes) significantly affected the odds of observing one cluster of willingness to switch as shown in
Table 8. The McFadden R-squared value measured for this model was 0.977. The classification output before including predictive variables reflected the fact that 76% of the cases could be accurately categorized merely if all cases were categorized as a willingness to switch. However, after the inclusion of IVs, the model now correctly classified 99.2% of overall cases. The sensitivity was 99.2%, specifically 99.2%, the model’s positive estimated value was 99.73%, and the negative estimated value was 97.54%.
There were three predictive variables, and all of them were categorical and had different choices. All the variables such as personal status (Yes), privacy (Yes) and the car was convenient (Yes) were found to be negatively significant as shown in
Table 8. It predicted that these all variables have an influence on private transport users to stick with their current mode of transport instead of the switch towards a P&R service.
4.7. Uncertainty Model
The uncertainty model was coded as Model 7. It consisted of IVs such as the threat of robbery and snatching and the threat of terrorism/violence factors as presented in Equation (15).
The overall model was statistically significant, χ
2(4) = 2.152
p < 0.001, suggesting that; the threat of robbery and snatching and the threat of terrorism/violence significantly affected the odds of observing 1 cluster of willingness to switch. The McFadden R-squared value measured for this model was 0.966. The classification result before including predictive variables expressed that 76% of the cases could be accurately categorized simply if all cases were categorized as a willingness to switch. However, after the inclusion of IVs, the model now correctly classified 98.7% of overall cases. The sensitivity was 95.4%, specifically 99.7%, the model’s positive estimated value was 98.5%, and the negative estimated value was 99.13%. There were three predictive variables, and all of them were categorical and had different choices. From them, “threat of terrorism and snatching” and “threat of terrorism and violence” variables had a positive significant effect on willingness to adopt a P&R service as shown in
Table 9.
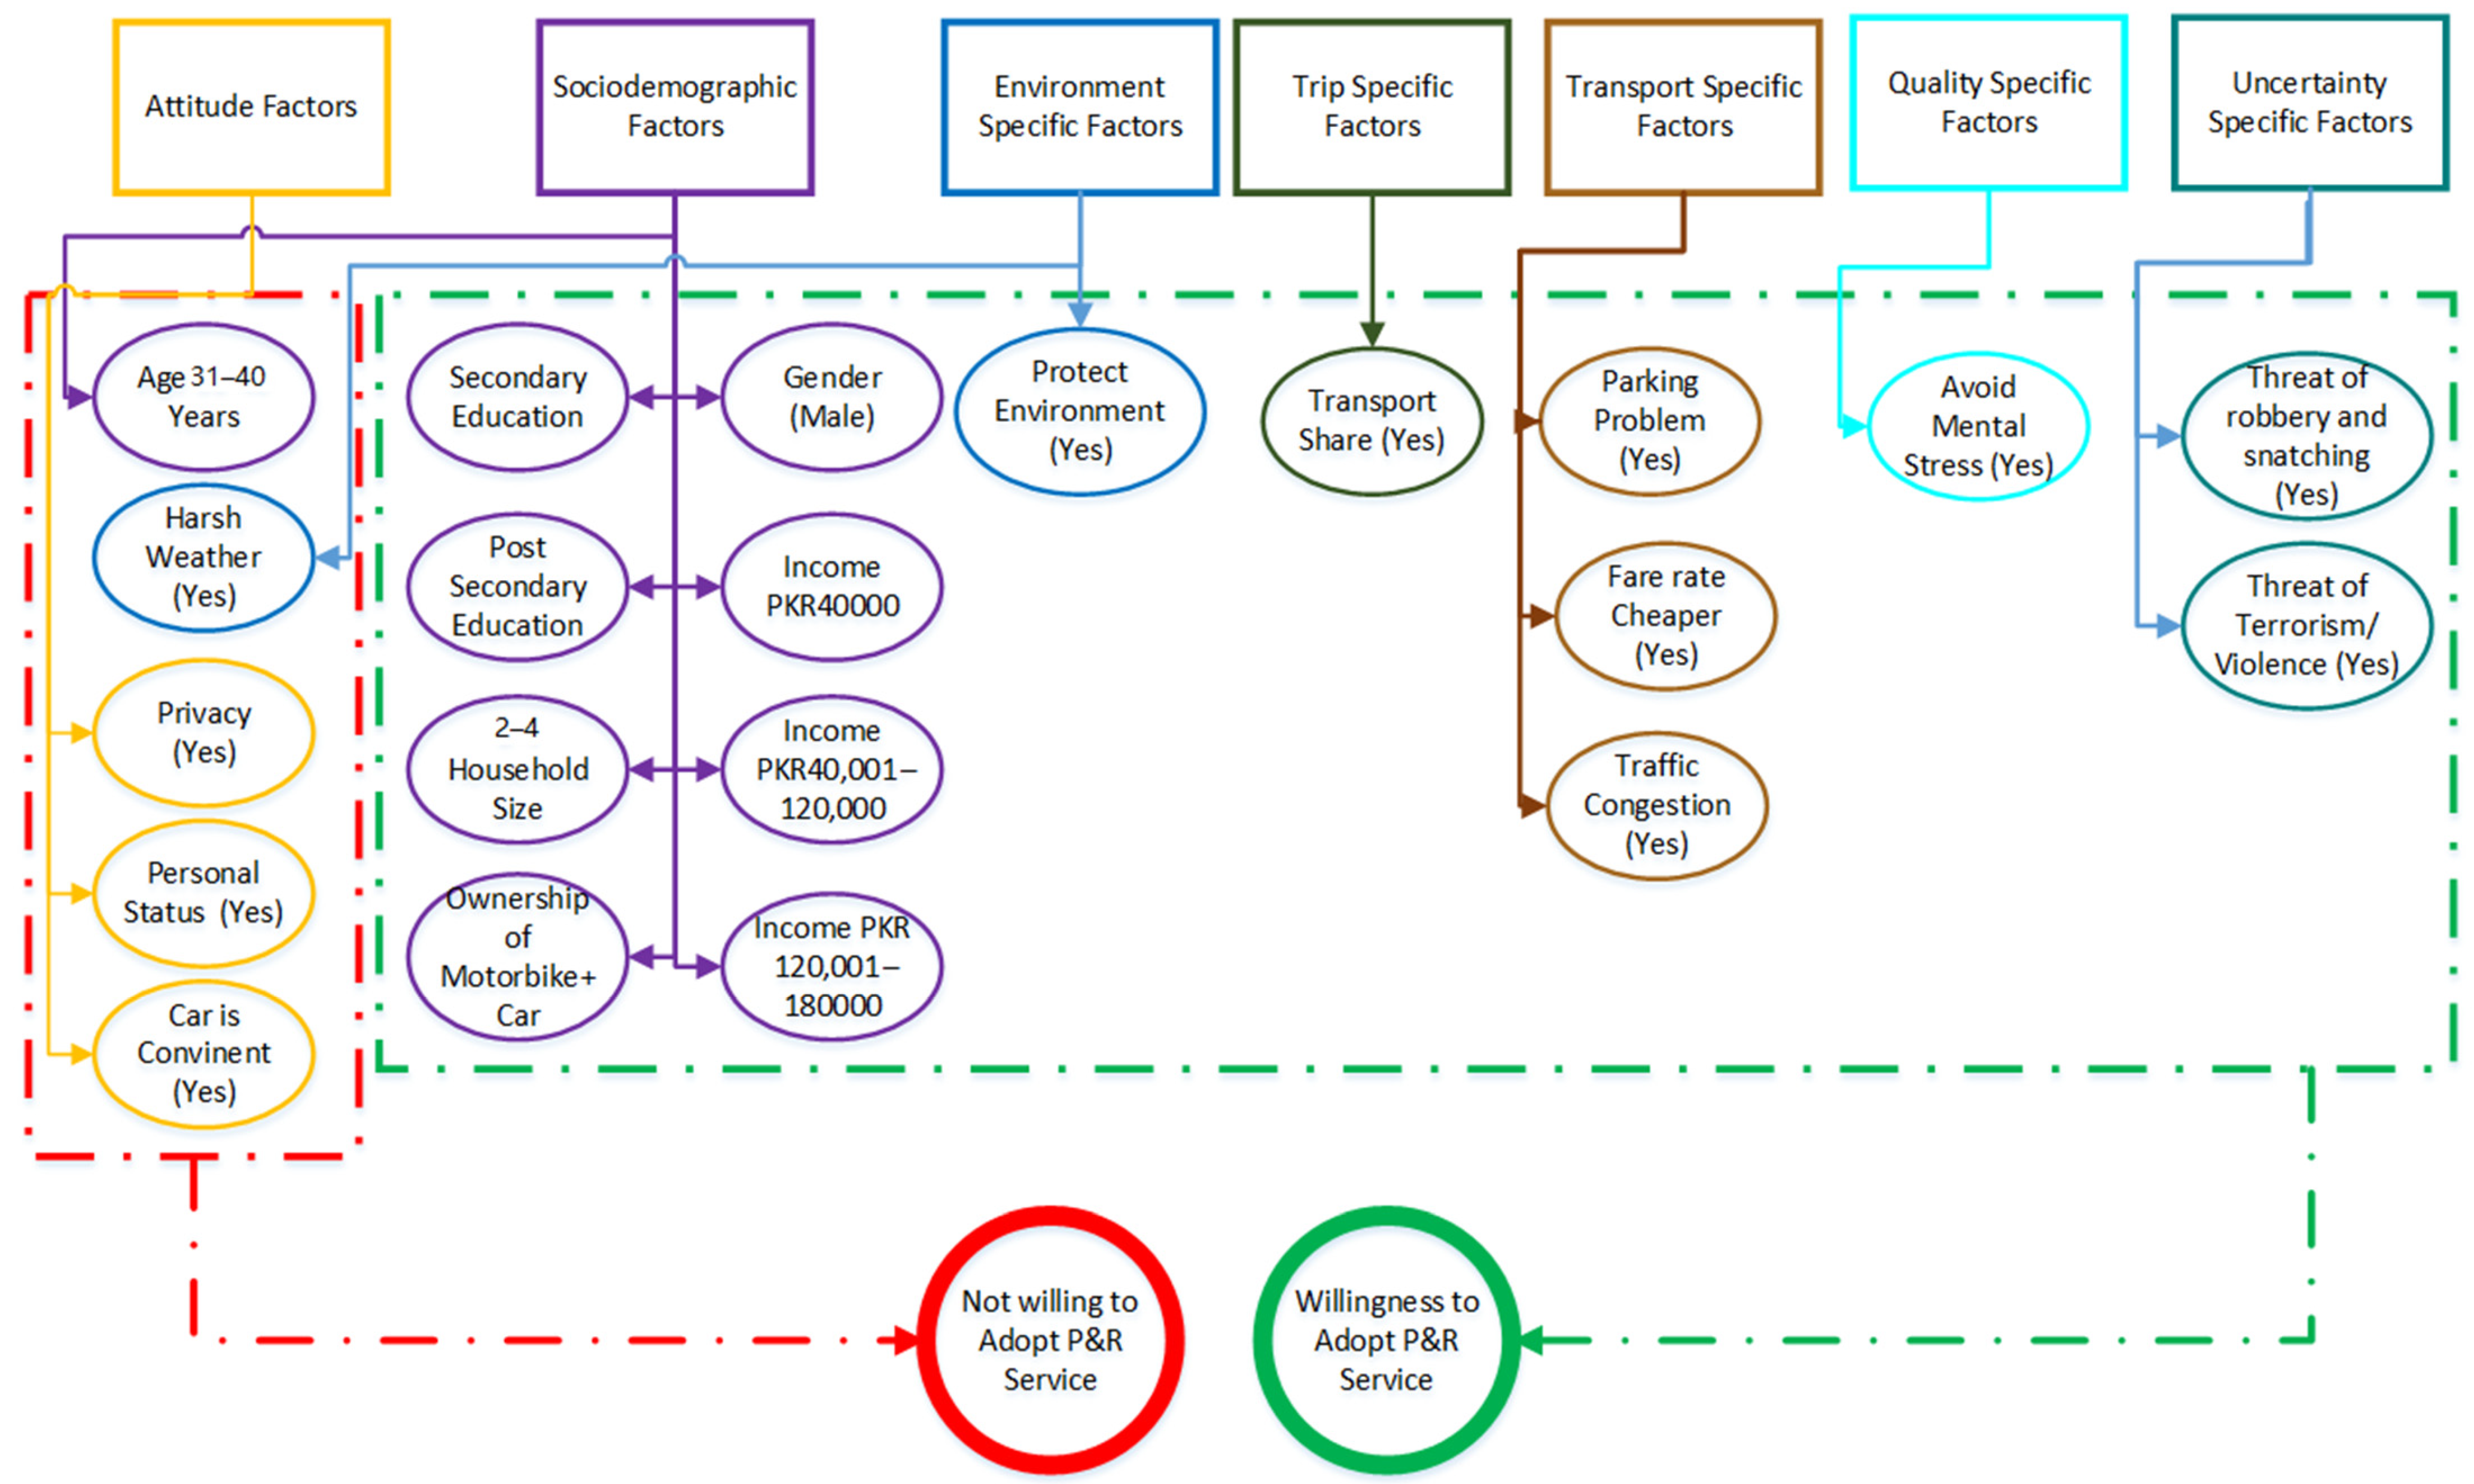
As a result, the threat of terrorism, violence, robbery and snatching are the major concerns of private transport users about shifting to a P&R service. Therefore, it is mandatory to overcome these factors to give confidence in safe and secure P&R services to private transport users. The significant factors of model 1 to model 7 of Karachi are presented in
Figure 7. In this figure, the positive and negative influencing factors towards P&R service are presented. Especially, negative significant factors such as age 31–40 years of sociodemographic, harsh weather and privacy, car convenience and personal status of attitude-specific factors must influence people not willing to adopt a P&R service. Furthermore, all the other positive significant variables are shown in
Figure 7.
4.8. Final Model
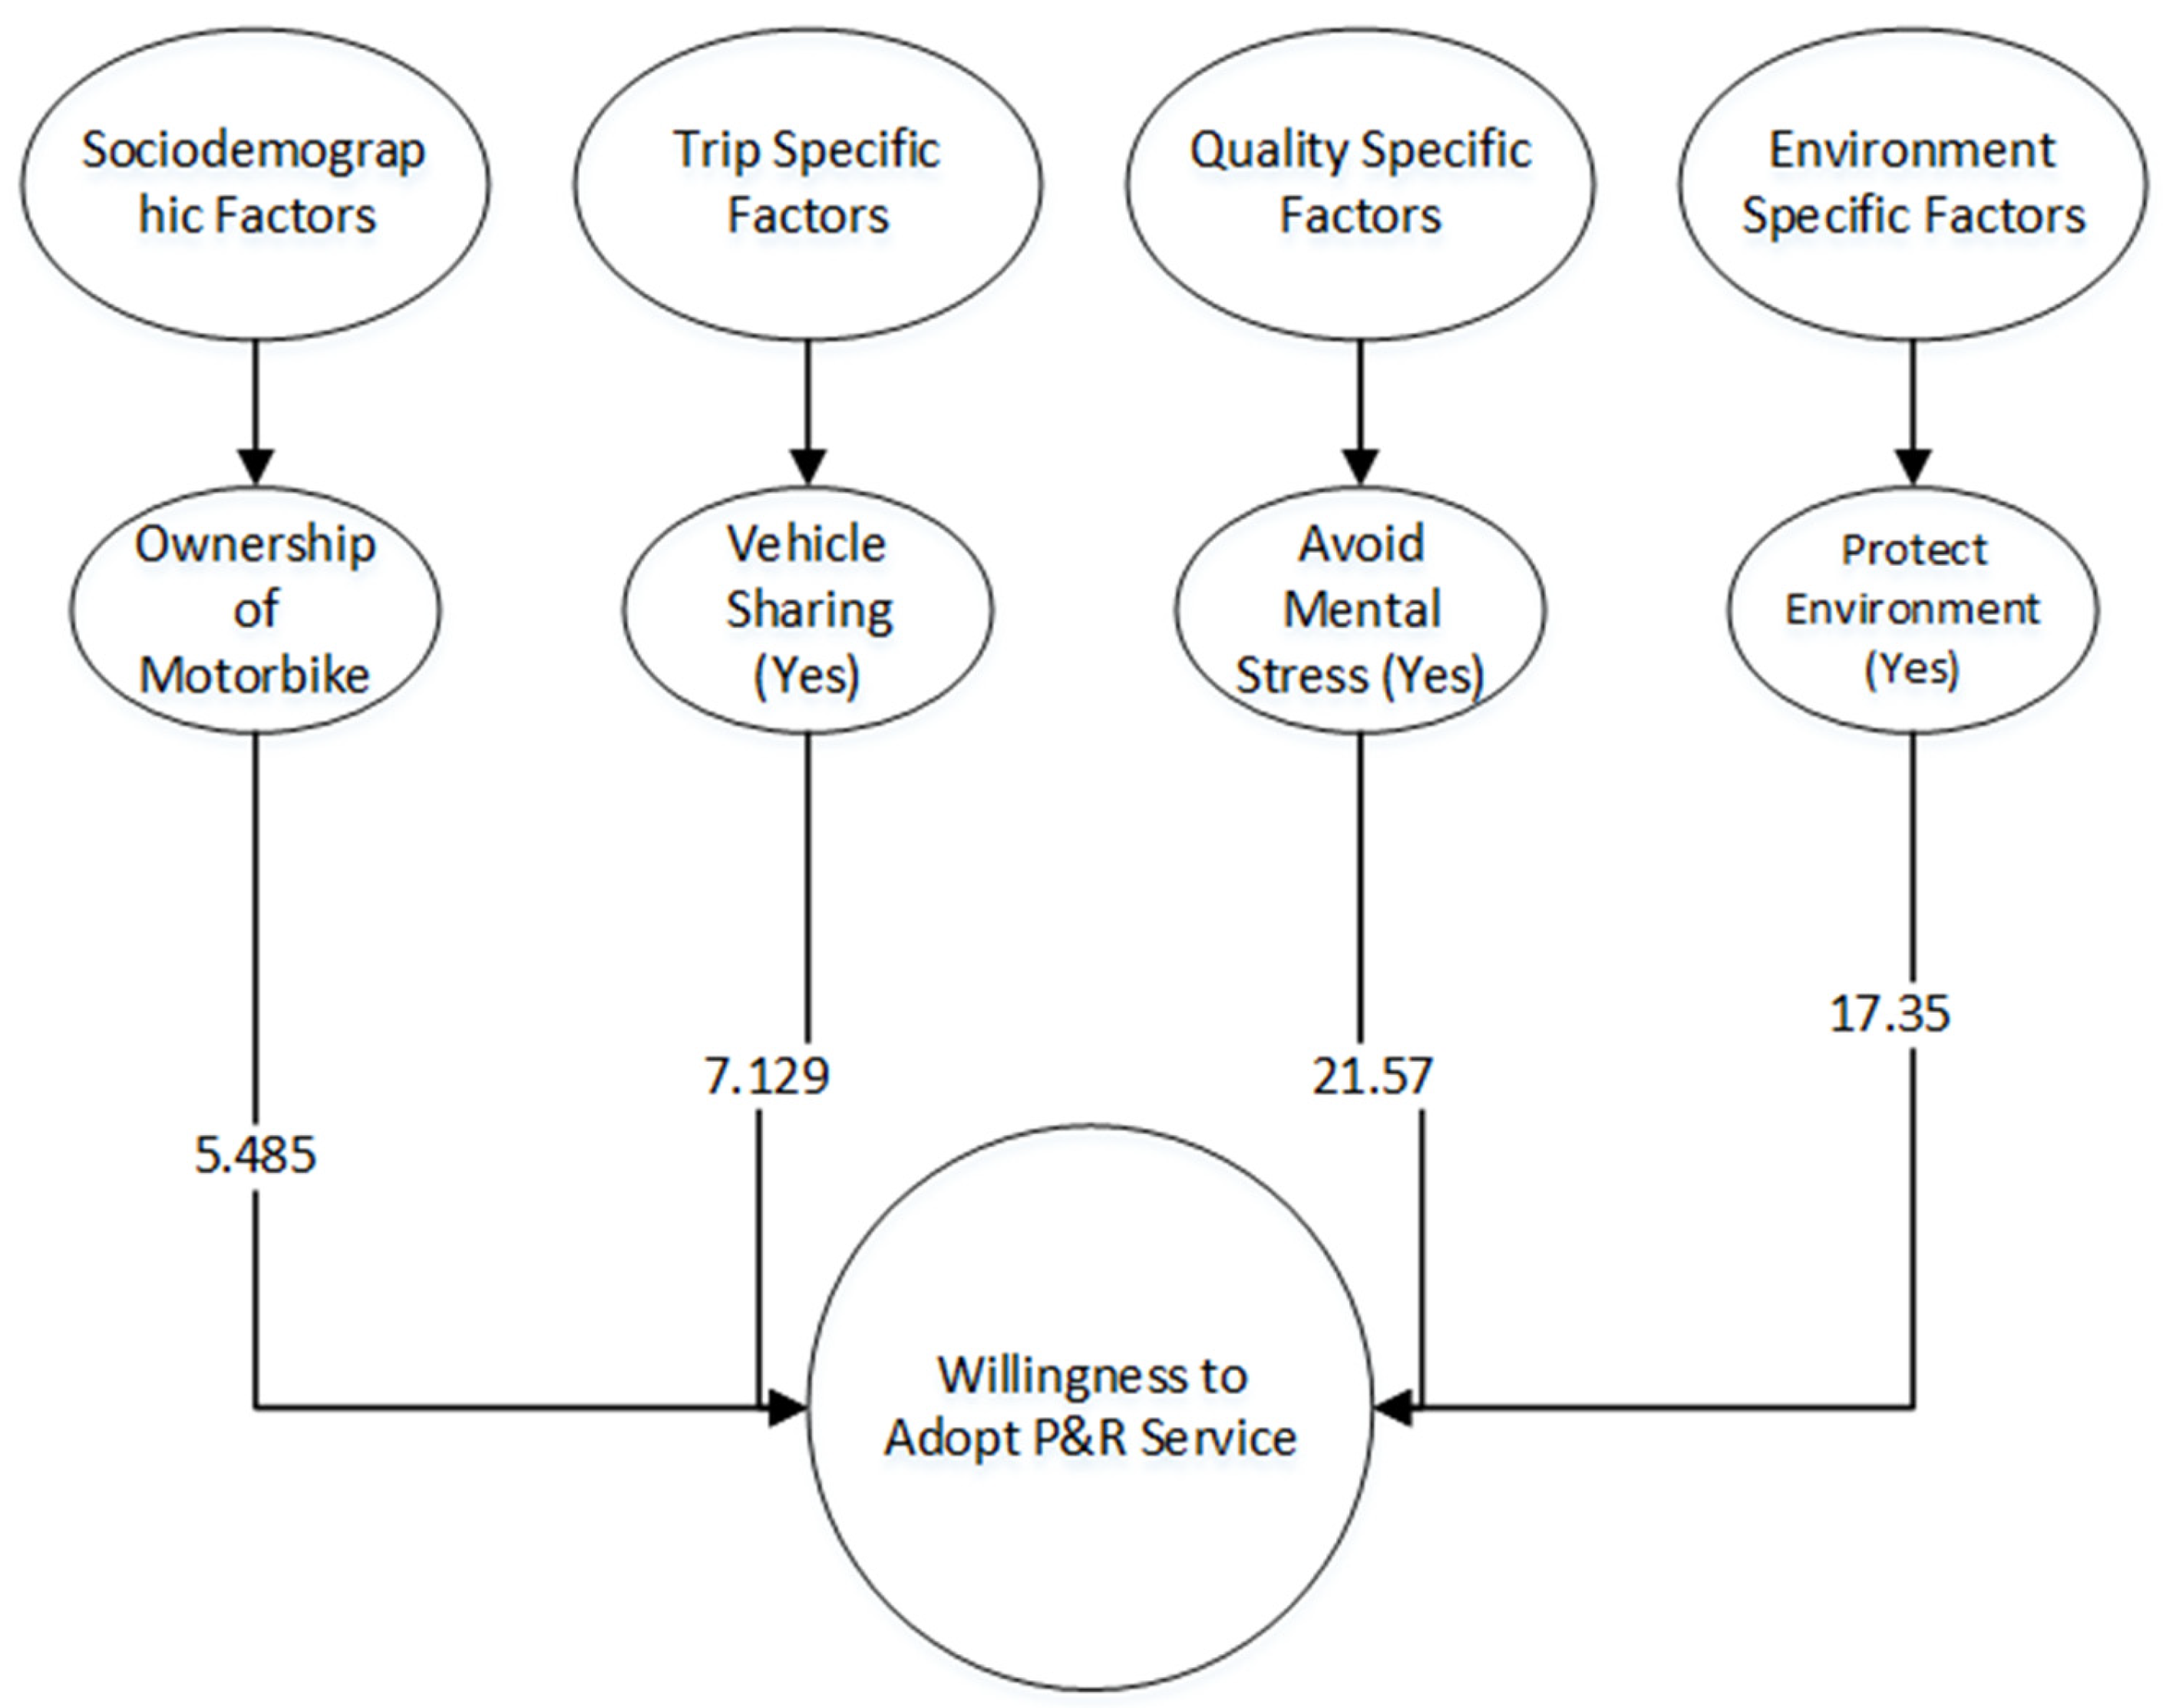
The final model was numbered Model 8. In this model, all the IVs which were significant in Model 1 to 7 were included. Therefore, the variables that were fitted in the model are gender, monthly income, household size, ownership of transport, protect the environment, vehicle sharing, and avoid mental stress as shown in Equation (16).
There were seven predictive variables in the final model, and all of them were categorical and had different choices. As a result, ownership (motorbike), protect the environment (Yes), vehicle sharing (Yes), and avoid mental stress (Yes), were found to be positively significant variables as shown in
Table 10 and
Figure 8. Therefore, it is predicted that motorbike users, to avoid mental stress, and to protect the environment are willing to adopt a P&R service.
4.9. Final Model Validation
Validation of final models such as Model 8 was done through training and testing of the logistic regression approach. All the variables that were significant in Models 1, 2, 3, 4, 5, 6 and 7, were selected for the final model. Additionally, variables that were fitted in Model 8 were included in the report. Similarly, the final model was selected for validation.
Training and Testing for Final Model
There was a 1000 sample size; for training purposes, the sample size was 489 respondents. Similarly, for testing purposes, 511 samples were selected. The details of the validation model such as the classification table and SPSS result output are shown in
Table 11.
Training sample: For those predicted to have a positive response, the correct classification rate for actual positive responses is 100.00%.
Testing sample: For those predicted to have a positive response, the correct classification rate for actual positive responses is 99.74%.
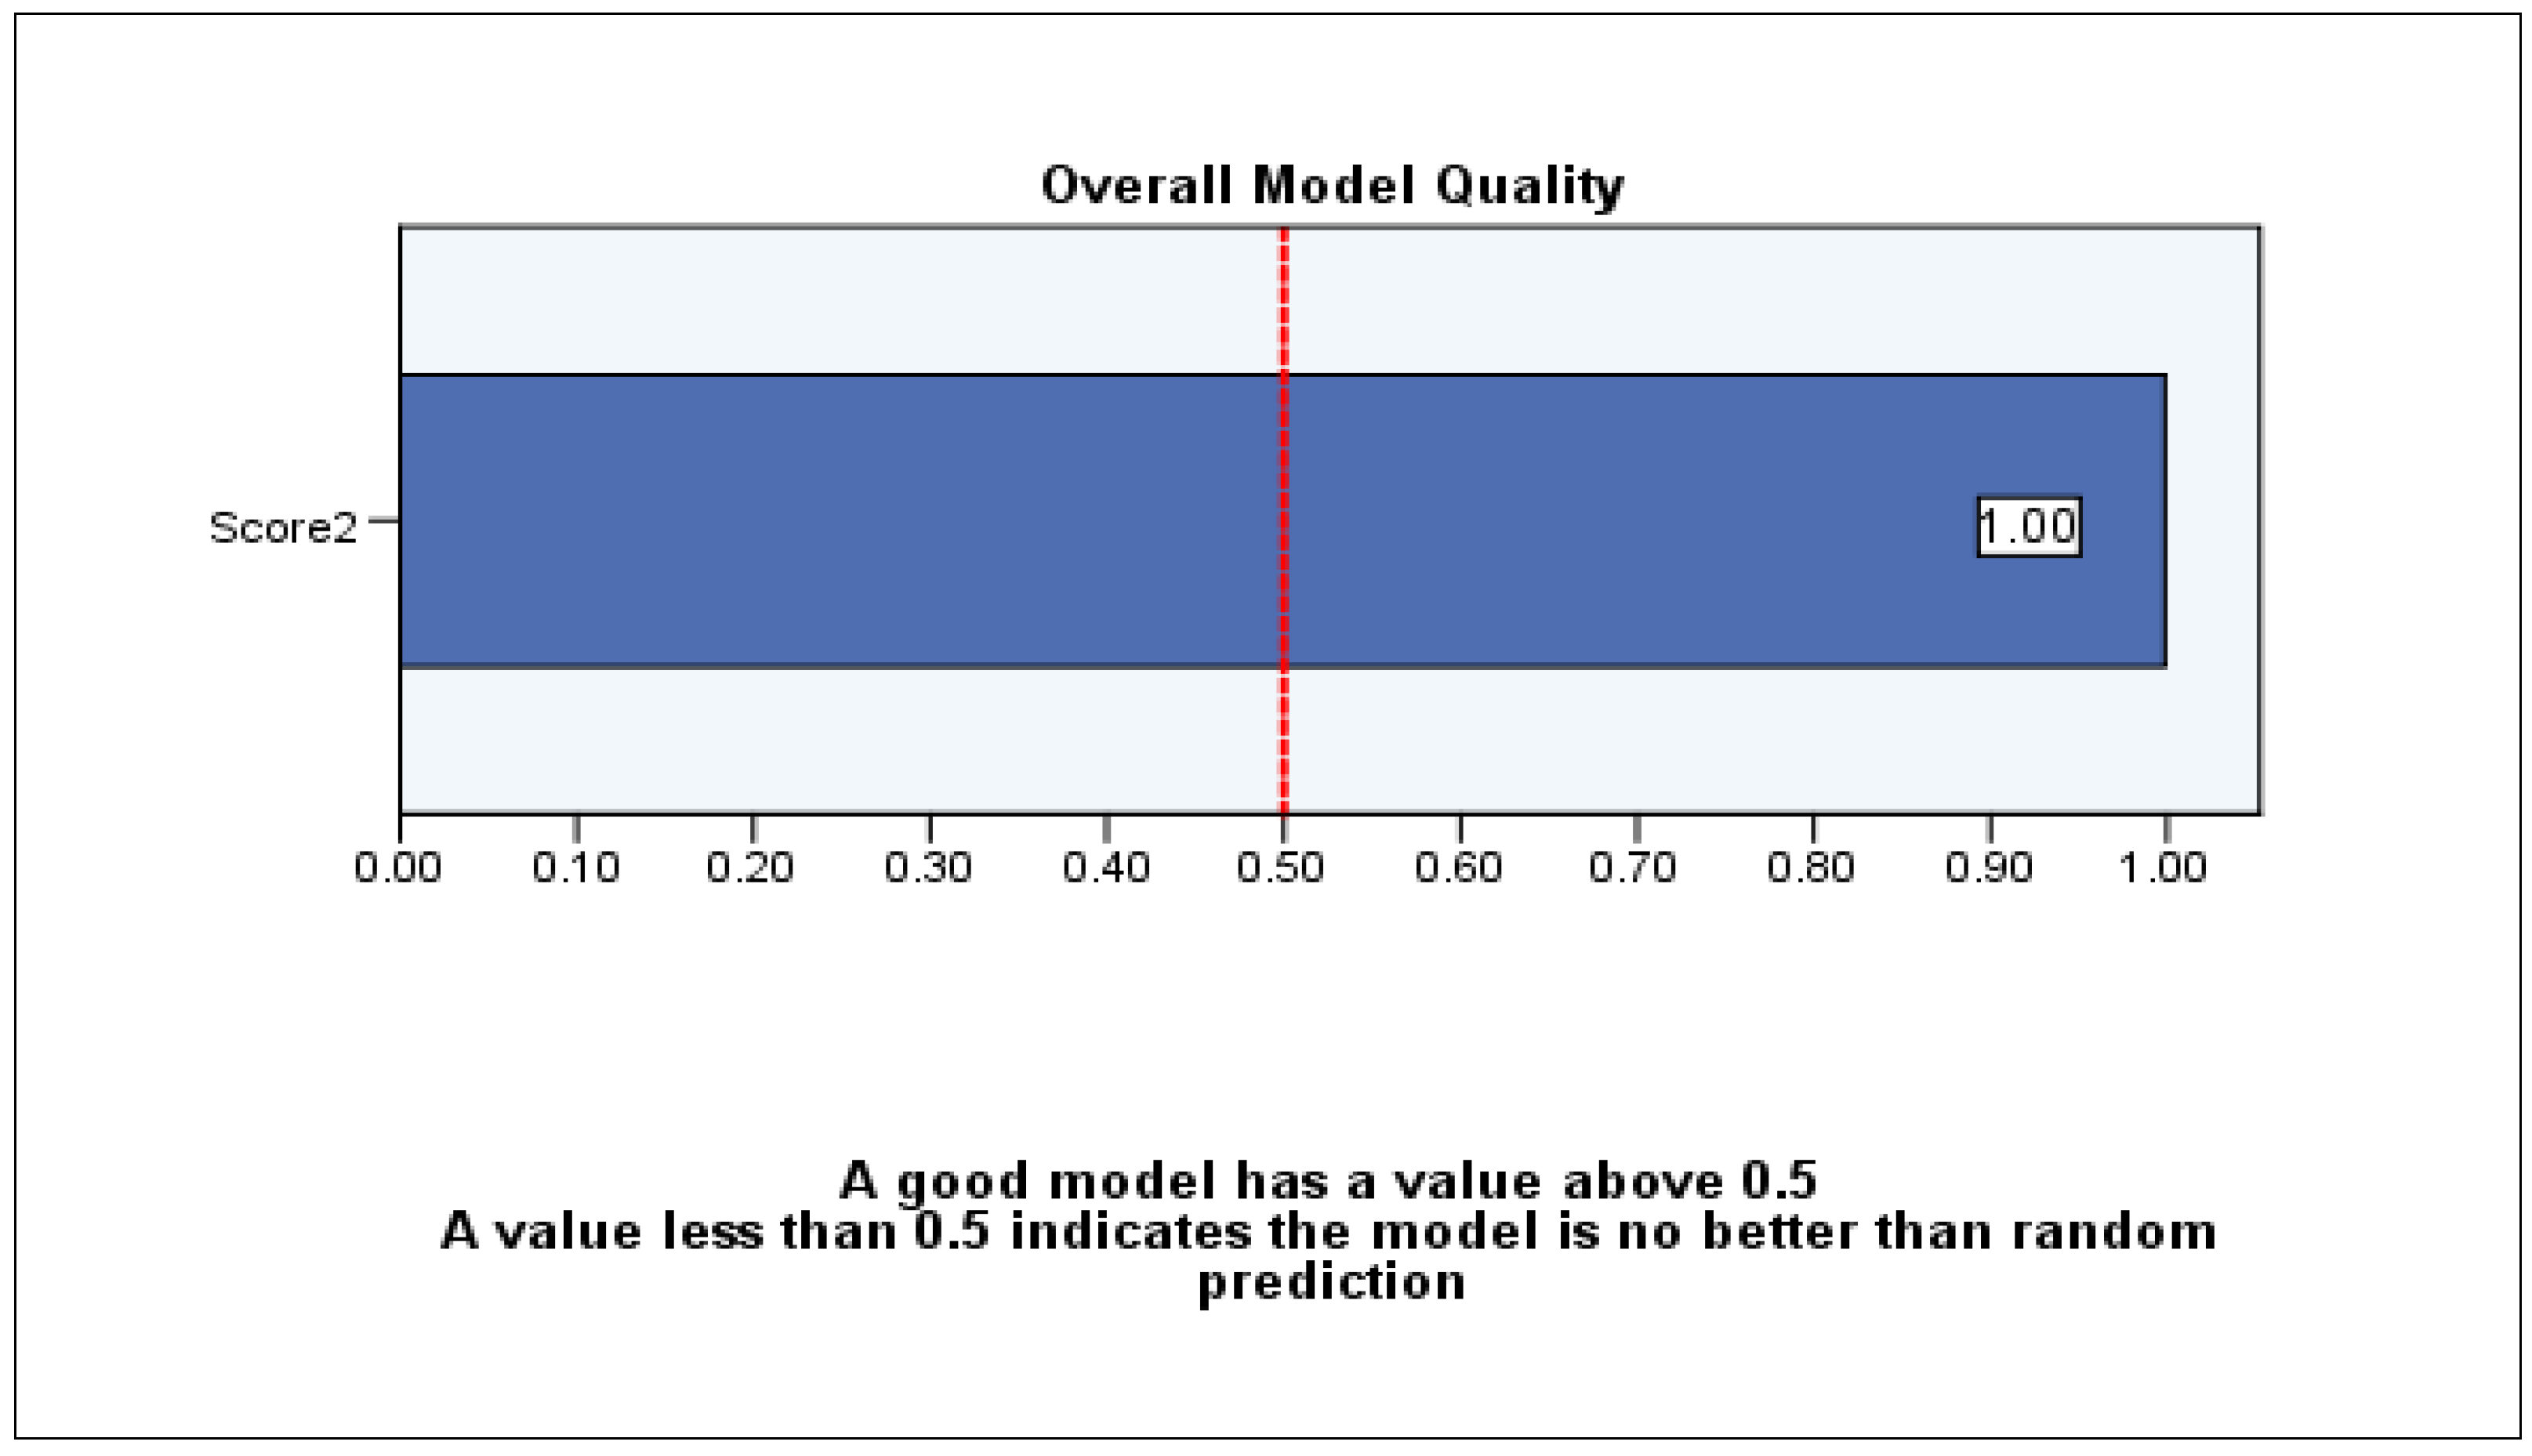
This is greater than or equal to the specified minimum probability of 0.050 or 5.00%. This implies that a set of contacts that will equal or go beyond the minimum likelihood value stated in this model should be used. Note, however, that the correct classification rate for actual positive responses for the testing sample is lower than the correct rate for the training sample. This is not unusual, but if there is a large difference, caution should be used when interpreting these results. The model’s overall quality is presented in
Figure 9.
5. Conclusions
Karachi’s final model comprises significant predictive variables: gender, household size, income per month, private transport ownership, protecting the environment, transport share, and avoiding mental stress. In conclusion, the mode choice model predicts that the people of Karachi are willing to adopt a P&R service if stakeholders are going to provide it. It is predicted that motorbike owners are willing to adopt a P&R service to reduce their mental stress and to protect the environment.
This research consisted of two objectives to achieve the aim of the study “to determine how the socio-demographic, environment, transport, trip, quality, attitude and uncertainty-specific factors influence SOV users towards P&R service”.
There were positive and negative influencing variables. The negative influencing variables were age group (31–40 years), harsh weather, and privacy. Consequently, the positive influencing variables were gender (male), educational level (secondary, post-secondary), household size (2–4 person), Income per month (PKR < 40,000/-, 40,001–80,000, 80,001–120,000 and 120,001–160,000). Furthermore, protecting the environment (Yes), transport share (Yes), the frequency of the bus (15 min), the parking problem (Yes), fare rate cheaper (Yes), traffic congestion (Yes). Furthermore, avoid mental stress (Yes), privacy (Yes), time spent per day traveling (61–120 min), and the threat of robbery, snatching, terrorism, and violence all were the positive influencing factors that encourage private transport users towards a P&R service.
These research findings contribute to the literature and methodology in the field of mode choice modeling, specifically for the developing world. This study was focused on employees, who travel by private mode of transport from home to office, specifically in the CBD of Karachi. However, the current coronavirus disease 2019 (COVID-19) pandemic restricts urban mobility. Public transportation is being avoided by travelers. Travelers are preferring their vehicles, which undoubtedly creates traffic congestion and increases road rage. Therefore, in this pandemic P&R services can be a suitable mode choice, as it is a hybrid mode choice; private vehicle, walk, and public transportation. A P&R service can increase the physical activity of private travelers in this lockdown situation and reduce traffic congestion and road rage from the city center.
Furthermore, this mode choice modeling of SOV users, this research is the only study of its nature in Karachi city. Previously, there have been few studies conducted on mobility, traffic congestion, and road accidents, but there was only one mode choice modeling study, which was conducted in 1995 [
79]. Simultaneously, different studies were conducted on the travel behavior of private transport users. In contrast, this study focuses on a wide range of variables with two modest variables such as attitude and uncertainty. These variables were tested as modest variables such as attitude variables measured through: privacy, personal status, and the car are convenient factors. These three factors were found significant in private transport users. Similarly, uncertainty was measured through safety and security at a P&R service, the threat of snatching and robbery, and the threat of terrorism/violence factors. The threat of snatching and robbery and the threat of terrorism/violence factors were found to be significant in Karachi. These findings contribute to the new information regarding the factors which were influencing SOV users in Karachi.
Therefore, this study attempts to give a holistic mode choice model with almost all possible factors influencing SOV users. Consequently, all the significant factors of models were gathered in one model. However, the fitted variables produced the essence of the swift influencing factors known as the final model of Karachi.


 ,
, 


