
Lifetime Climate Impacts of Diet Transitions: A Novel Climate Change Accounting Perspective

 , ,
, ,  and
and
Abstract
1. Introduction
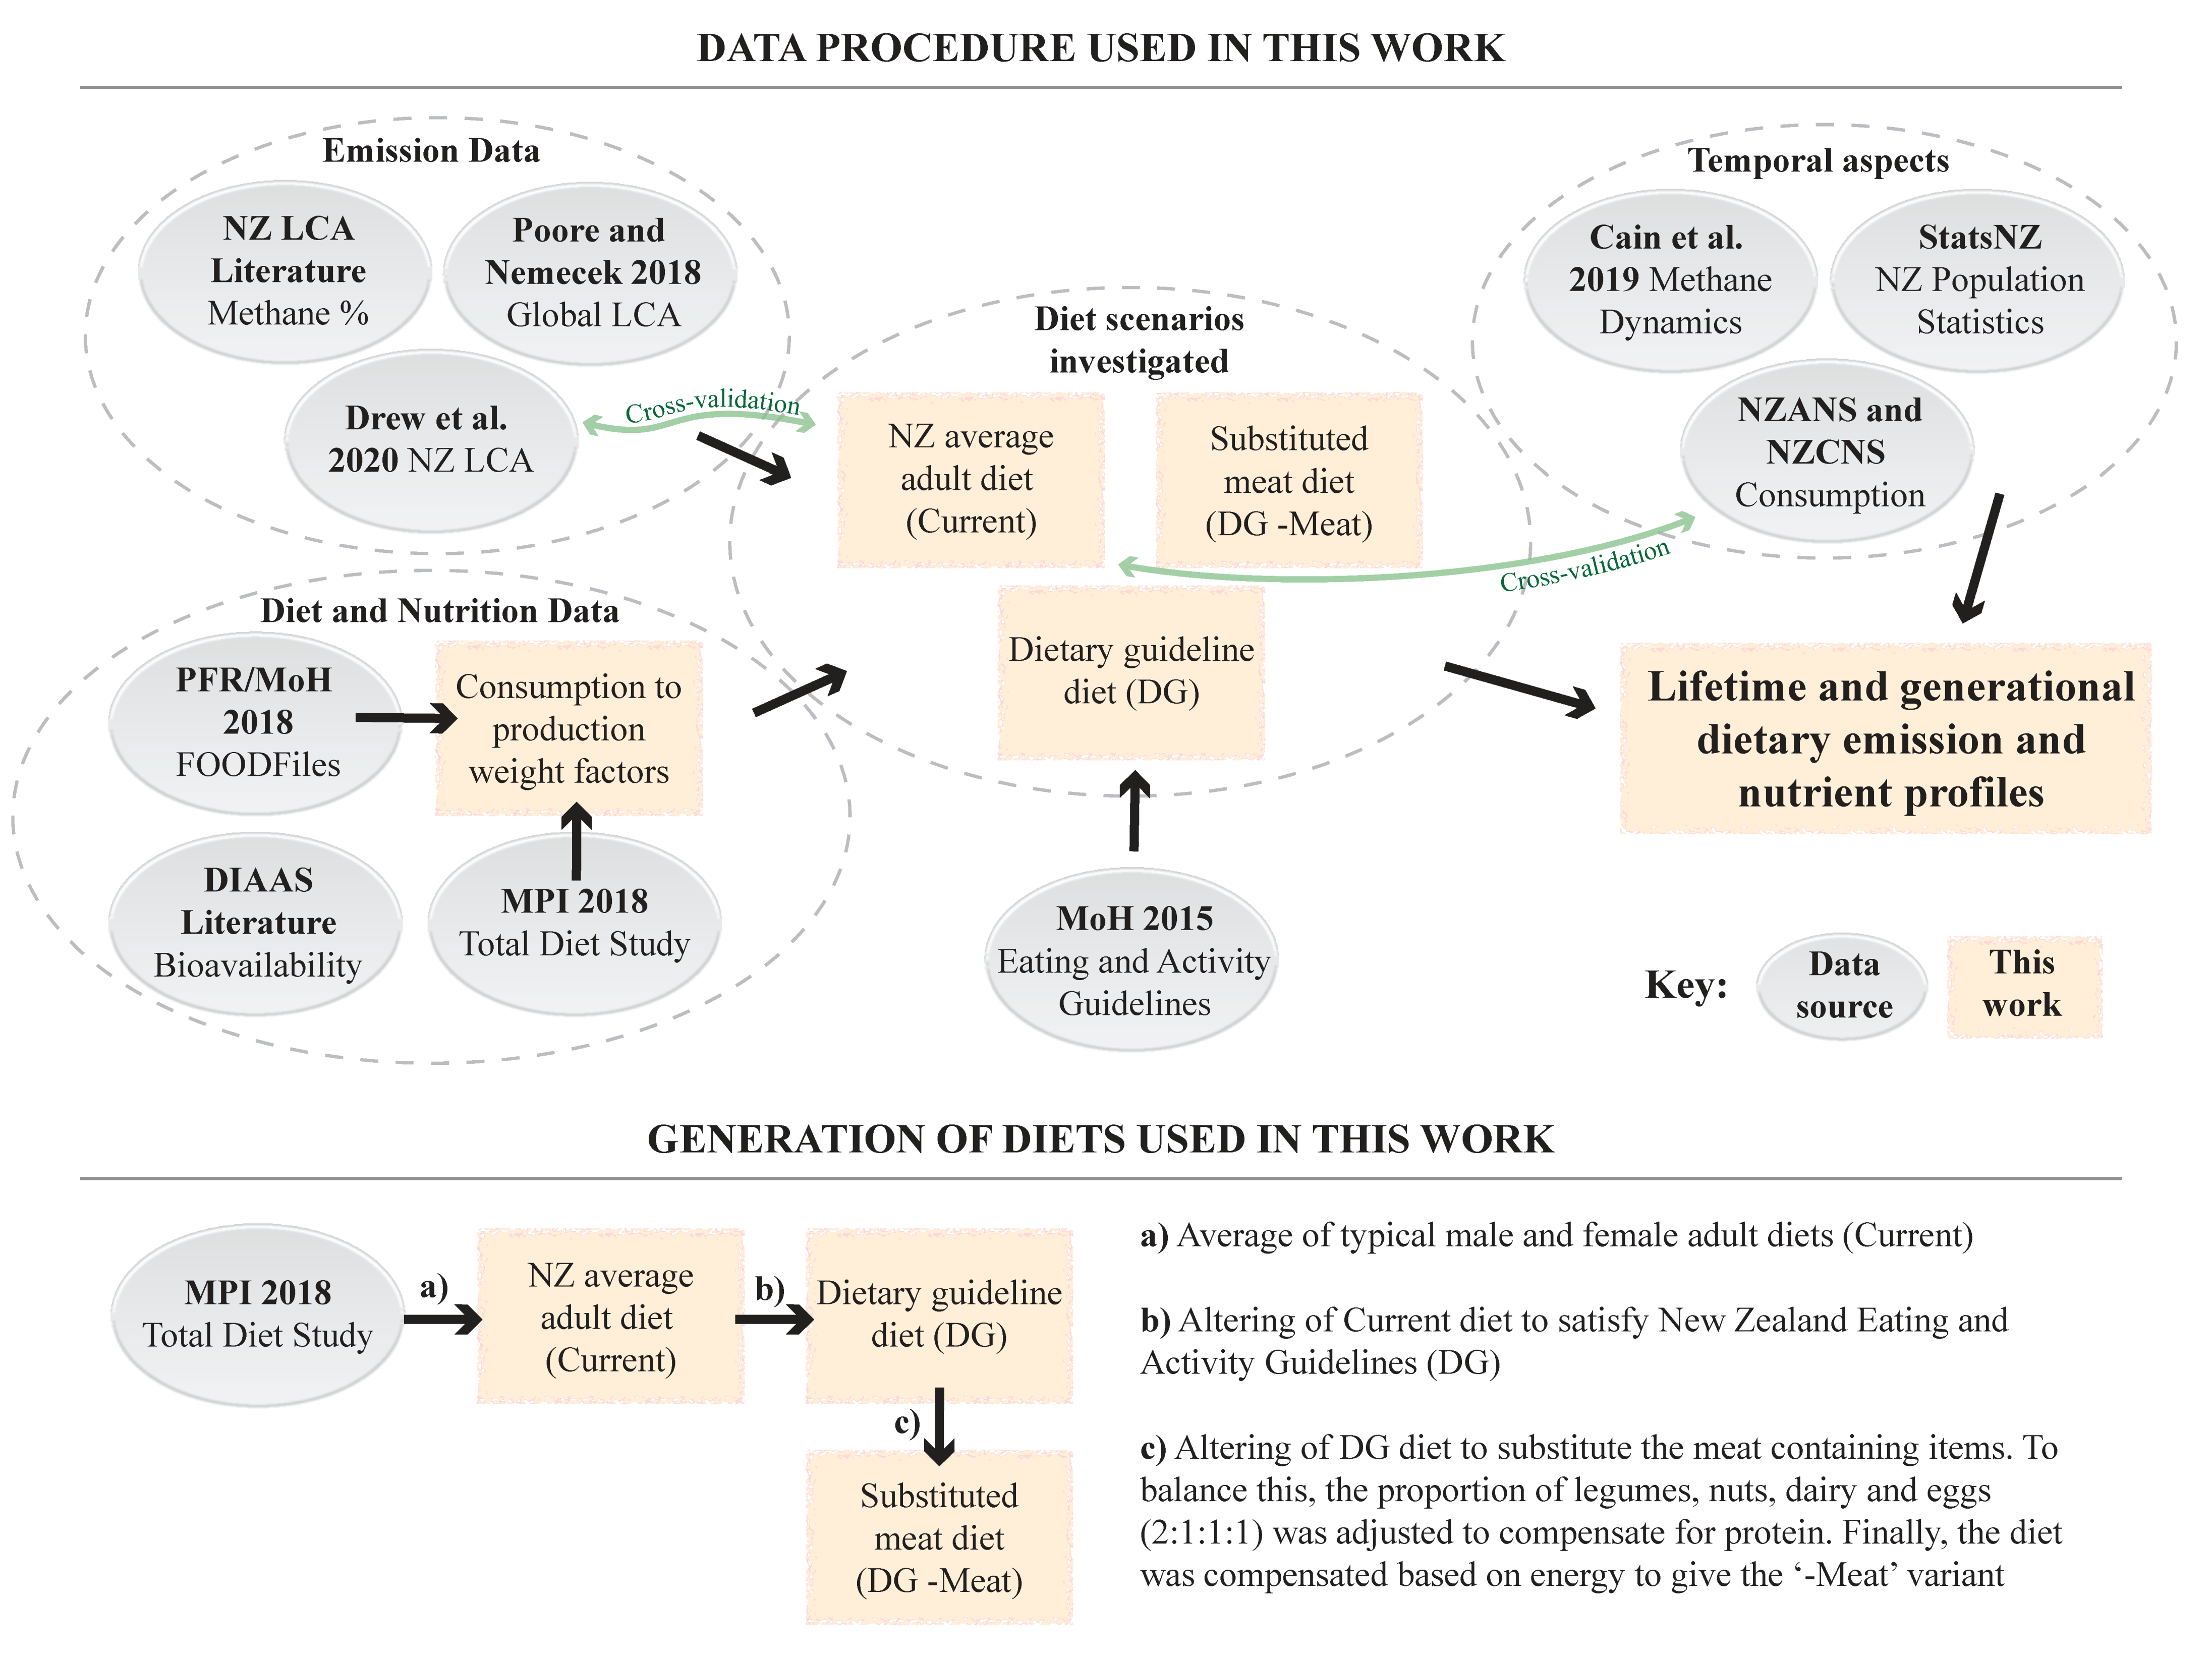
2. Methods
3. Results
3.1. Sensitvity Analysis
3.1.1. Compensation Based on Nutrients: Protein
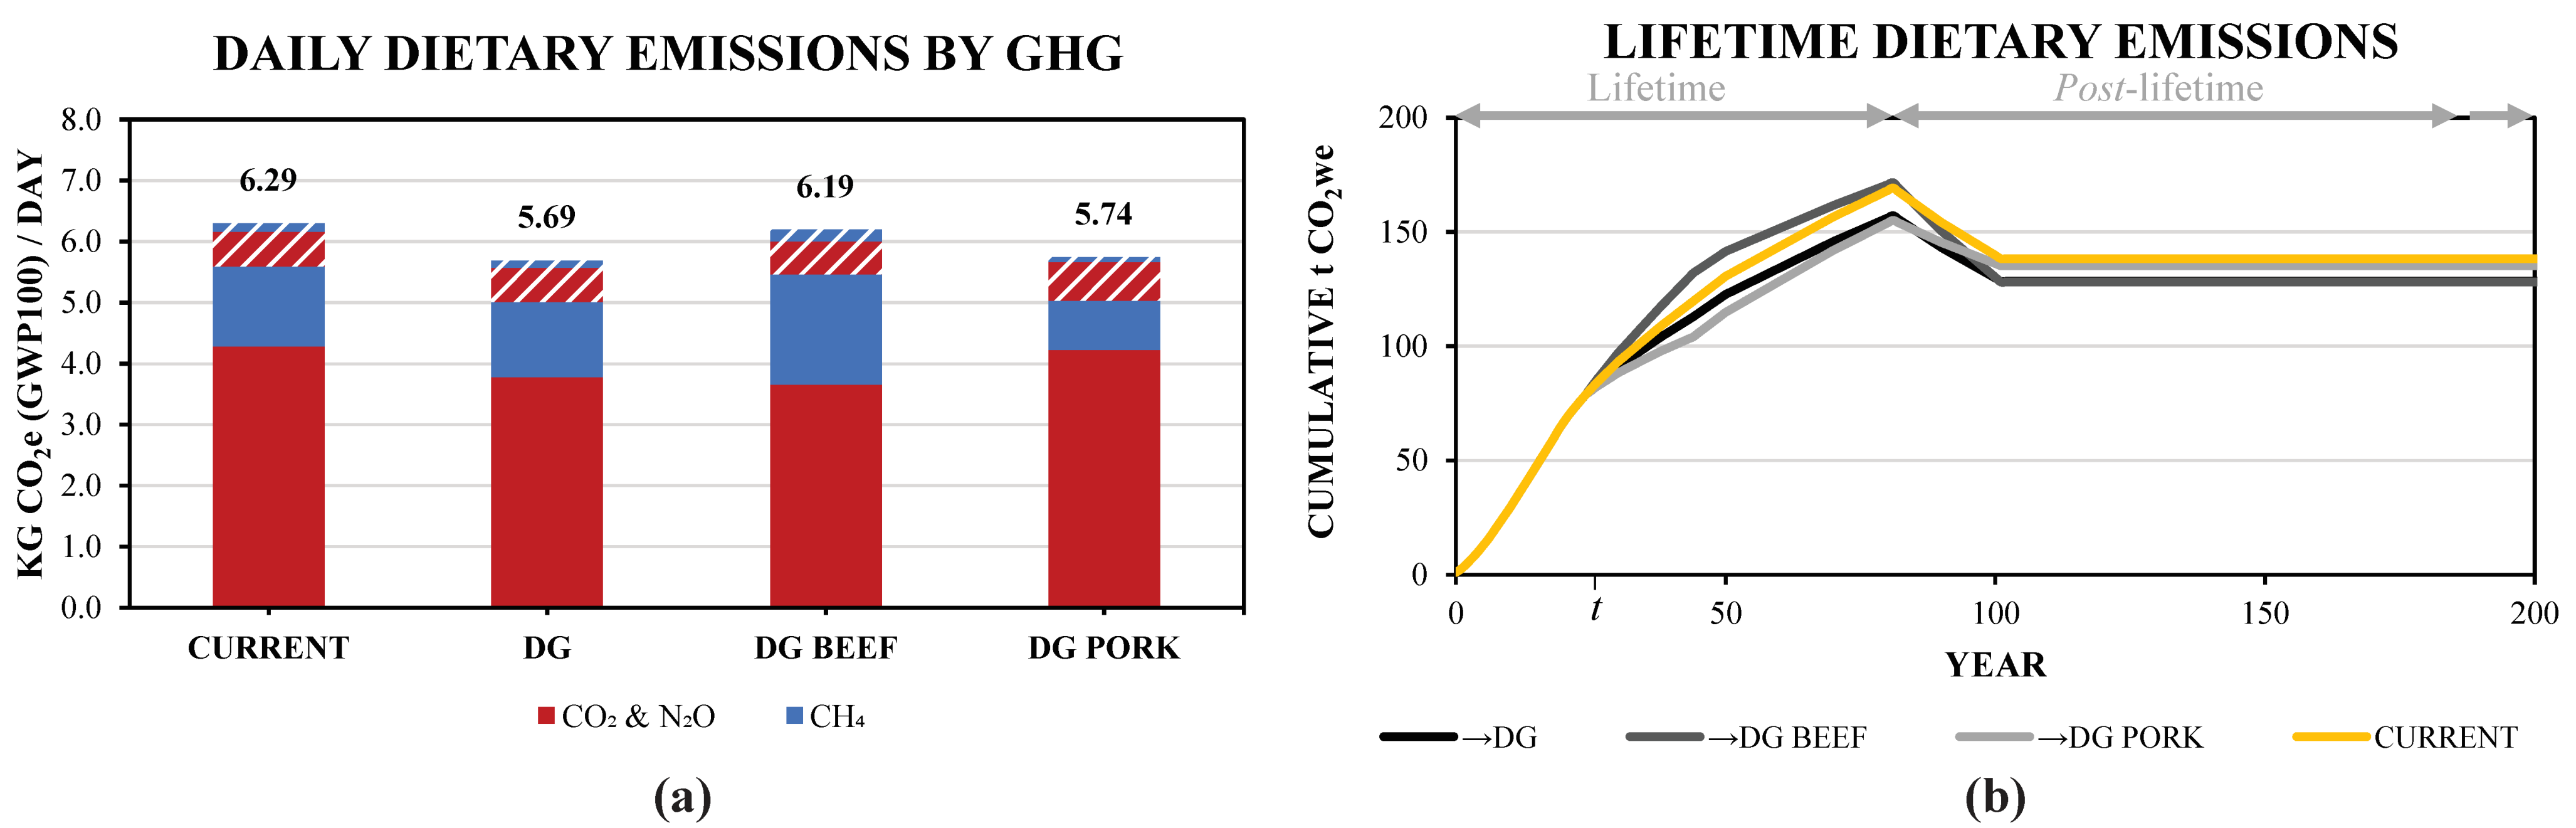
3.1.2. The Potential for Long-Term Warming Legacies: Different Meat Choices
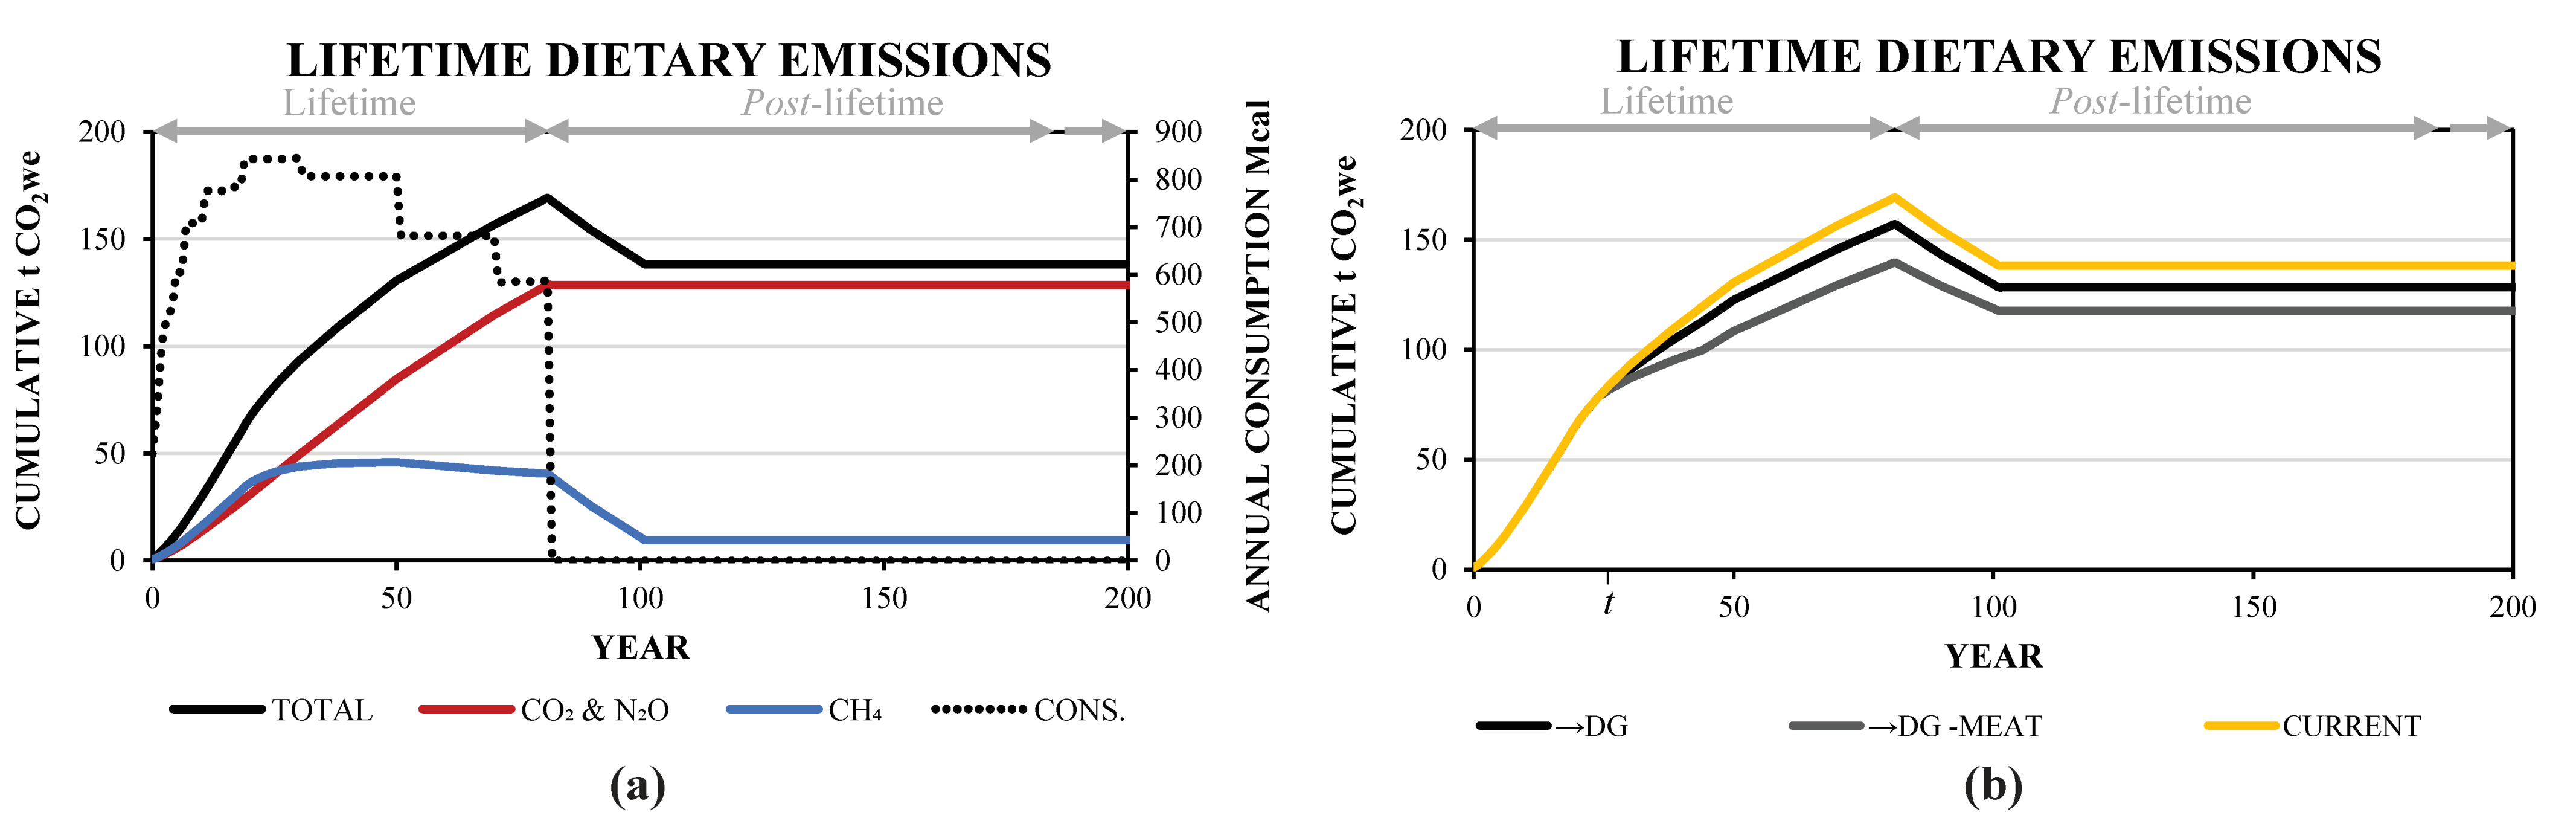
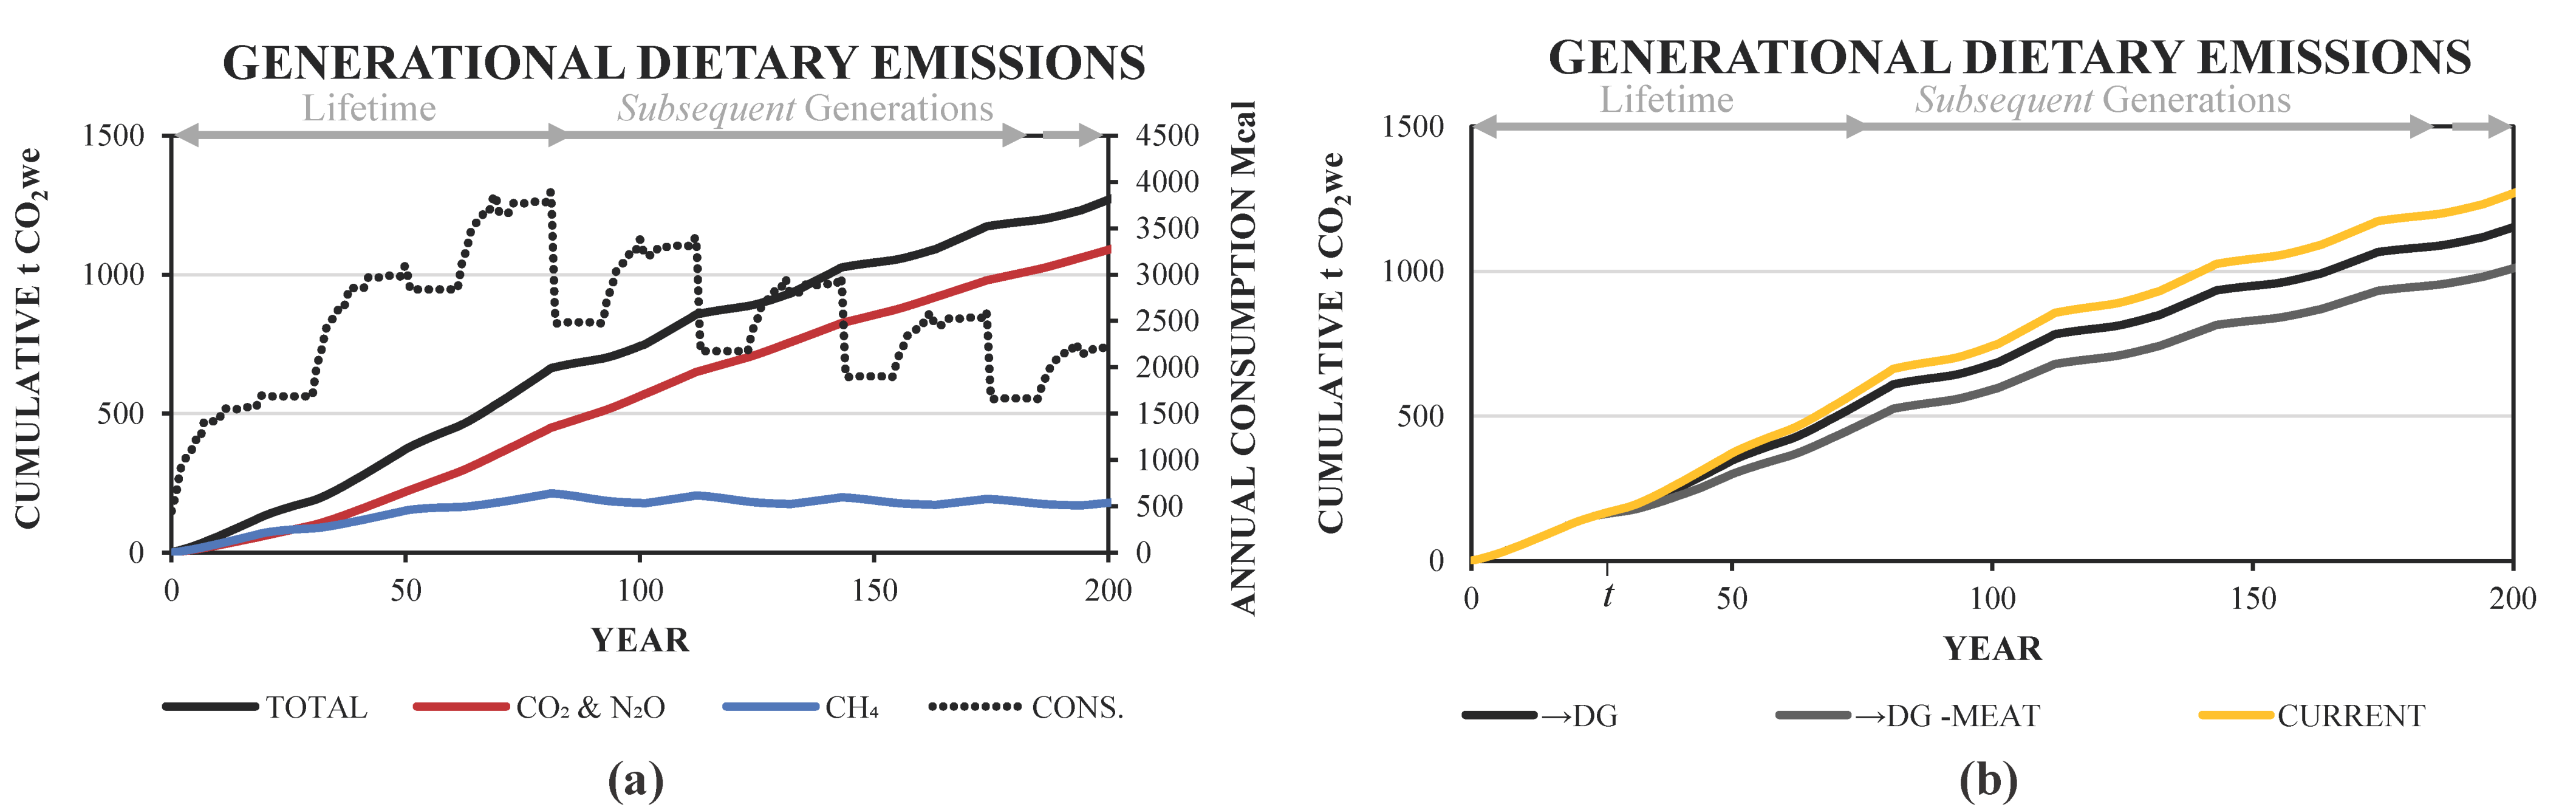
3.1.3. Considering a Collective Perspective: The Role of Descendants
4. Discussion
4.1. Acknowledging Dietary Emissions in Context
4.2. Clarity over the Dynamics of GHGs
4.3. Limitations and Considerations
5. Conclusions
Supplementary Materials
Author Contributions
Funding
Institutional Review Board Statement
Informed Consent Statement
Data Availability Statement
Acknowledgments
Conflicts of Interest
Disclaimer
References
- Scott, P. Global panel on agriculture and food systems for nutrition: Food systems and diets: Facing the challenges of the 21st century. Food Secur. 2017, 9, 653–654. [Google Scholar] [CrossRef]
- FAO; IFAD; UNICEF; WFP; WHO. The State of Food Security and Nutrition in the World 2020. In Transforming Food Systems for Affordable Healthy Diets; Food and Agriculture Organisation, International Fund for Agricultural Development, UNICEF, World Food Programme, and World Health Organisation: Rome, Italy, 2020. [Google Scholar]
- OECD; FAO. OECD-FAO Agricultural Outlook 2020–2029; Organisation for Economic Cooperation and Development and Food and Agriculture Organisation: Rome, Italy; Paris, France, 2020. [Google Scholar]
- Mottet, A.; de Haan, C.; Falcucci, A.; Tempio, G.; Opio, C.; Gerber, P. Livestock: On our plates or eating at our table? A new analysis of the feed/food debate. Glob. Food Secur. 2017, 14, 1–8. [Google Scholar] [CrossRef]
- IPCC. Special Report on Climate Change, Desertification, Land Degradation, Sustainable Land Management, Food Security, And Greenhouse Gas Fluxes in Terrestrial Ecosystems: Summary for Policymakers; Intergovernmental Panel on Climate Change: Geneva, Switzerland, 2019.
- Hoogeveen, J.; Faurès, J.-M.; Peiser, L.; Burke, J.; Van De Giesen, N. GlobWat—A global water balance model to assess water use in irrigated agriculture. Hydrol. Earth Syst. Sci. 2015, 19, 3829–3844. [Google Scholar] [CrossRef]
- Clark, M.A.; Domingo, N.G.; Colgan, K.; Thakrar, S.K.; Tilman, D.; Lynch, J.; Azevedo, I.L.; Hill, J.D. Global food system emissions could preclude achieving the 1.5° and 2 °C climate change targets. Science 2020, 370, 705–708. [Google Scholar] [CrossRef] [PubMed]
- Garnett, T.; Mathewson, S.; Angelides, P.; Borthwick, F. Policies and actions to shift eating patterns: What works. Foresight 2015, 515, 518–522. [Google Scholar]
- Aleksandrowicz, L.; Green, R.; Joy, E.J.M.; Smith, P.; Haines, A. The Impacts of Dietary Change on Greenhouse Gas Emissions, Land Use, Water Use, and Health: A Systematic Review. PLoS ONE 2016, 11, e0165797. [Google Scholar] [CrossRef] [PubMed]
- Sonesson, U.; Davis, J.; Flysjö, A.; Gustavsson, J.; Witthöft, C. Protein quality as functional unit—A methodological framework for inclusion in life cycle assessment of food. J. Clean. Prod. 2017, 140, 470–478. [Google Scholar] [CrossRef]
- Clark, M.A.; Springmann, M.; Hill, J.; Tilman, D. Multiple health and environmental impacts of foods. Proc. Natl. Acad. Sci. USA 2019, 116, 23357–23362. [Google Scholar] [CrossRef] [PubMed]
- Chaudhary, A.; Krishna, V. Country-Specific Sustainable Diets Using Optimization Algorithm. Environ. Sci. Technol. 2019, 53, 7694–7703. [Google Scholar] [CrossRef] [PubMed]
- Drew, J.; Cleghorn, C.; Macmillan, A.; Mizdrak, A. Healthy and Climate-Friendly Eating Patterns in the New Zealand Context. Environ. Health Perspect. 2020, 128, 017007. [Google Scholar] [CrossRef]
- Willett, W.; Rockström, J.; Loken, B.; Springmann, M.; Lang, T.; Vermeulen, S.; Garnett, T.; Tilman, D.; DeClerck, F.; Wood, A. Food in the Anthropocene: The EAT–Lancet Commission on healthy diets from sustainable food systems. Lancet 2019, 393, 447–492. [Google Scholar] [CrossRef]
- Poore, J.; Nemecek, T. Reducing food’s environmental impacts through producers and consumers. Science 2018, 360, 987–992. [Google Scholar] [CrossRef] [PubMed]
- Payne, C.L.; Scarborough, P.; Cobiac, L. Do low-carbon-emission diets lead to higher nutritional quality and positive health outcomes? A systematic review of the literature. Public Health Nutr. 2016, 19, 2654–2661. [Google Scholar] [CrossRef] [PubMed]
- White, R.R.; Hall, M.B. Nutritional and greenhouse gas impacts of removing animals from US agriculture. Proc. Natl. Acad. Sci. USA 2017, 114, E10301–E10308. [Google Scholar] [CrossRef]
- Chaudhary, A.; Gustafson, D.; Mathys, A. Multi-indicator sustainability assessment of global food systems. Nat. Commun. 2018, 9, 1–13. [Google Scholar] [CrossRef]
- Liebe, D.L.; Hall, M.B.; White, R.R. Contributions of dairy products to environmental impacts and nutritional supplies from United States agriculture. J. Dairy Sci. 2020, 103, 10867–10881. [Google Scholar] [CrossRef]
- Hirvonen, K.; Bai, Y.; Headey, D.; Masters, W.A. Affordability of the EAT–Lancet reference diet: A global analysis. Lancet Glob. Health 2020, 8, e59–e66. [Google Scholar] [CrossRef]
- Drewnowski, A. Measures and metrics of sustainable diets with a focus on milk, yogurt, and dairy products. Nutr. Rev. 2018, 76, 21–28. [Google Scholar] [CrossRef]
- Drewnowski, A.; Dwyer, J.; King, J.C.; Weaver, C.M. A proposed nutrient density score that includes food groups and nutrients to better align with dietary guidance. Nutr. Rev. 2019, 77, 404–416. [Google Scholar] [CrossRef]
- Levasseur, A.; Cavalett, O.; Fuglestvedt, J.S.; Gasser, T.; Johansson, D.J.; Jørgensen, S.V.; Raugei, M.; Reisinger, A.; Schivley, G.; Strømman, A.; et al. Enhancing life cycle impact assessment from climate science: Review of recent findings and recommendations for application to LCA. Ecol. Indic. 2016, 71, 163–174. [Google Scholar] [CrossRef]
- Mallapragada, D.; Mignone, B.K. A consistent conceptual framework for applying climate metrics in technology life cycle assessment. Environ. Res. Lett. 2017, 12, 074022. [Google Scholar] [CrossRef]
- Balcombe, P.; Speirs, J.F.; Brandon, N.P.; Hawkes, A.D. Methane emissions: Choosing the right climate metric and time horizon. Environ. Sci. Process. Impacts 2018, 20, 1323–1339. [Google Scholar] [CrossRef] [PubMed]
- Collins, W.J.; Frame, D.J.; Fuglestvedt, J.S.; Shine, K.P. Stable climate metrics for emissions of short and long-lived species—combining steps and pulses. Environ. Res. Lett. 2020, 15, 024018. [Google Scholar] [CrossRef]
- IPCC. Intergovernmental Panel on Climate Change; First Assessment Report; World Meteorological Organization: Geneva, Switzerland, 1990. [Google Scholar]
- Heller, M.C.; Keoleian, G.A.; Willett, W.C. Toward a Life Cycle-Based, Diet-level Framework for Food Environmental Impact and Nutritional Quality Assessment: A Critical Review. Environ. Sci. Technol. 2013, 47, 12632–12647. [Google Scholar] [CrossRef] [PubMed]
- Hallström, E.; Davis, J.; Woodhouse, A.; Sonesson, U. Using dietary quality scores to assess sustainability of food products and human diets: A systematic review. Ecol. Indic. 2018, 93, 219–230. [Google Scholar] [CrossRef]
- IPCC. Climate Change 2013: The Physical Science Basis. Contribution of Working Group I to the Fifth Assessment Report of the Intergovernmental Panel on Climate Change; Intergovernmental Panel on Climate Change: Geneva, Switzerland; Cambridge University Press: Cambridge, UK; New York, NY, USA, 2013; p. 1535. [Google Scholar]
- Frischknecht, R.; Jolliet, O. Global Guidance for Life Cycle Impact Assessment Indicators; United Nations Environment Programme: Nairobi, Kenya, 2016; pp. 1–167. [Google Scholar]
- Allen, M.R.; Shine, K.P.; Fuglestvedt, J.S.; Millar, R.J.; Cain, M.; Frame, D.J.; Macey, A.H. A solution to the misrepresentations of CO2-equivalent emissions of short-lived climate pollutants under ambitious mitigation. NPJ Clim. Atmos. Sci. 2018, 1, 16. [Google Scholar] [CrossRef]
- Cain, M.; Lynch, J.; Allen, M.R.; Fuglestvedt, J.S.; Frame, D.J.; Macey, A.H. Improved calculation of warming-equivalent emissions for short-lived climate pollutants. NPJ Clim. Atmos. Sci. 2019, 2, 1–7. [Google Scholar] [CrossRef]
- Lynch, J.; Cain, M.; Pierrehumbert, R.; Allen, M. Demonstrating GWP*: A means of reporting warming-equivalent emissions that captures the contrasting impacts of short- and long-lived climate pollutants. Environ. Res. Lett. 2020, 15, 044023. [Google Scholar] [CrossRef]
- Ridoutt, B. Short communication: Climate impact of Australian livestock production assessed using the GWP* climate metric. Livest. Sci. 2021, 246, 104459. [Google Scholar] [CrossRef]
- Ridoutt, B.; Baird, D.; Hendrie, G.A. Diets within Environmental Limits: The Climate Impact of Current and Recommended Australian Diets. Nutrients 2021, 13, 1122. [Google Scholar] [CrossRef]
- Kerr, S. Agricultural Emissions Mitigation in New Zealand: Answers to Questions from the Parliamentary Commisioner for the Environment. SSRN Electron. J. 2016. [Google Scholar] [CrossRef]
- FAO. New Food Balances; FAO: Rome, Italy, 2020. [Google Scholar]
- MfE (Ministry for the Environment). New Zealand’s Greenhouse Gas Inventory 1990–2018; Ministry for the Environment: Wellinton, New Zealand, 2020.
- MoH (Ministry of Health). Eating and Activity Guidelines for New Zealand Adults; Ministry of Health: Wellington, New Zeland, 2015.
- Smith, C.; Parnell, W.; Blakey, C. Simulated Typical Diets for Use in the 2016 New Zealand Total Diet Study; Report Prepared for Ministry for Primary Industries; University of Otago: Dunedin, New Zealand, 2017. [Google Scholar]
- Pearson, A.; Gibbs, M.; Lau, K.; Edmonds, J.; Alexander, D.; Nicolas, J. 2016 New Zealand Total Diet Study; Ministry for Primary Industries: Wellington, New Zealand, 2018. [Google Scholar]
- Sivakumaran, S.; Huffman, L.; Sivakumaran, S. The New Zealand food composition database: A useful tool for assessing New Zealanders’ nutrient intake. Food Chem. 2018, 238, 101–110. [Google Scholar] [CrossRef] [PubMed]
- PFR; MoH. New Zealand Food Composition Database—New Zealand FOODfiles; MoH: Singapore, 2018. [Google Scholar]
- Fletcher, A.; Hill, J.; Hunter, S.; McNabb, W.; Smith, N.; Ghezzi, J.; Pearce, C.; Acharya, L.; Russell, N.; Gunn, C. Delta Model. 2020. Available online: https://sustainablenutritioninitiative.com/sustainable-nutrition-initiative/ (accessed on 8 August 2020).
- FSANZ (Food Standards Australia New Zealand). AUSNUT 2011–13 Food Recipe File; Food Standards Australia New Zealand: Canberra, Australia, 2013. [Google Scholar]
- USDA. USDA Table of Cooking Yields for Meat and Poultry; United States Department of Agriculture: Baltimore, MD, USA, 2012. [Google Scholar]
- Quested, T.; Murphy, L. Household Food and Drink Waste: A Product Focus; Waste and Resources Action Programme: Banbury, UK, 2014. [Google Scholar]
- Statistics New Zealand. Population Statistics Summary Figures; Statistics New Zealand: Wellington, New Zealand, 2020. [Google Scholar]
- MoH (Ministry of Health). NZ Food NZ Children: Key Results of the 2002 National Children’s Nutrition Survey; Ministry of Health: Wellington, New Zealand, 2003.
- UoO; MoH. A Focus on Nutrition: Key Findings of the 2008/09 New Zealand Adult Nutrition Survey; University of Otago and Ministry of Health: Wellington, New Zealand, 2011. [Google Scholar]
- NHMRC (National Health and Medical Research Council); MoH (Ministry of Health). Nutrient Reference Values for Australia and New Zealand; National Health and Medical Research Council: Canberra, Australia, 2006. [Google Scholar]
- Drewnowski, A. The contribution of milk and milk products to micronutrient density and affordability of the U.S. diet. J. Am. Coll. Nutr. 2011, 30, 422S–428S. [Google Scholar] [CrossRef] [PubMed]
- Drewnowski, A. Healthy diets for a healthy planet. Am. J. Clin. Nutr. 2014, 99, 1284–1285. [Google Scholar] [CrossRef] [PubMed]
- Drewnowski, A. Analysing the affordability of the EAT–Lancet diet. Lancet Glob. Health 2020, 8, e6–e7. [Google Scholar] [CrossRef]
- Loveday, S.M. Food Proteins: Technological, Nutritional, and Sustainability Attributes of Traditional and Emerging Proteins. Annu. Rev. Food Sci. Technol. 2019, 10, 311–339. [Google Scholar] [CrossRef]
- Melse-Boonstra, A. Bioavailability of Micronutrients from Nutrient-Dense Whole Foods: Zooming in on Dairy, Vegetables, and Fruits. Front. Nutr. 2020, 7, 101. [Google Scholar] [CrossRef]
- Chungchunlam, S.M.S.; Moughan, P.J.; Garrick, D.P.; Drewnowski, A. Animal-sourced foods are required for minimum-cost nutritionally adequate food patterns for the United States. Nat. Food 2020, 1, 376–381. [Google Scholar] [CrossRef]
- Statistics New Zealand. Media Release: Birth Rate down to Record Low; Statistics New Zealand: Wellington, New Zealand, 2018. [Google Scholar]
- Statistics New Zealand. Media Release: Greenhouse Gas Emissions (Consumption-Based): Year Ended 2017; Statistics New Zealand: Wellington, New Zealand, 2020. [Google Scholar]
- Falduto, C.; Rocha, M. Aligning Short-Term Climate Action with Long-Term Climate Goals: Opportunities and Options for Enhancing Alignment between NDCs and Long-Term Strategies; OECD Publishing: Paris, France, 2020. [Google Scholar]
- FAO. Food Balances (Old Methodology and Population); FAO: Rome, Italy, 2020. [Google Scholar]
- OECD. Meat Consumption (Indicator); OECD: Paris, France, 2020. [Google Scholar]
- Winson, A.; Choi, J.Y. Dietary regimes and the nutrition transition: Bridging disciplinary domains. Agric. Hum. Values 2016, 34, 559–572. [Google Scholar] [CrossRef]
- Loboguerrero, A.M.; Campbell, B.M.; Cooper, P.J.; Hansen, J.W.; Rosenstock, T.; Wollenberg, E. Food and Earth Systems: Priorities for Climate Change Adaptation and Mitigation for Agriculture and Food Systems. Sustainability 2019, 11, 1372. [Google Scholar] [CrossRef]
- Frischknecht, R.; Jolliet, O. Global Guidance for Life Cycle Impact Assessment Indicators Volume 2; United Nations Environment Programme: Nairobi, Kenya, 2019; pp. 1–203. [Google Scholar]
- Bessou, C.; Tailleur, A.; Godard, C.; Gac, A.; De La Cour, J.L.; Boissy, J.; Mischler, P.; Caldeira-Pires, A.; Benoist, A. Accounting for soil organic carbon role in land use contribution to climate change in agricultural LCA: Which methods? Which impacts? Int. J. Life Cycle Assess. 2020, 25, 1217–1230. [Google Scholar] [CrossRef]
- Case, B.; Ryan, C. An Analysis of Carbon Stocks and Net Carbon Position for New Zealand Sheep and Beef Farmland; Auckland University of Technology: Auckland, New Zealand, 2020. [Google Scholar]
- Searchinger, T.D.; Wirsenius, S.; Beringer, T.; Dumas, P. Assessing the efficiency of changes in land use for mitigating climate change. Nature 2018, 564, 249–253. [Google Scholar] [CrossRef] [PubMed]
- Finkbeiner, M.; Inaba, A.; Tan, R.; Christiansen, K.; Klüppel, H.-J. The New International Standards for Life Cycle Assessment: ISO 14040 and ISO 14044. Int. J. Life Cycle Assess. 2006, 11, 80–85. [Google Scholar] [CrossRef]
- OECD. Food Systems and the Challenge of Coherent Policies, Chapter 1: The Performance of the Global Food System; Organisation for Economic Cooperation and Development: Paris, France, 2020. [Google Scholar]


| Current | DG | DG-Meat | |
|---|---|---|---|
| Energy/kcal | 2211 | 2211 | 2211 |
| Bioa. protein/g | 83.0 | 85.3 | 77.8 |
| Fat/g | 91.2 | 93.5 | 99.4 |
| Carbohydrate/g | 267 | 270 | 264 |
| GWP100 | 6.29 | 5.69 | 4.88 |
| CH4% | 23 | 24 | 21 |
| Lifetime GWP100 | Lifetime GWP* | Δ% * | Δ% * | ||||||||||
|---|---|---|---|---|---|---|---|---|---|---|---|---|---|
| Daily GWP100 | Cumulative t CO2e | Cumulative t CO2we | Year | Year | |||||||||
| Diet | Kg CO2e/day | CH4% | Δ% | Year 50 | Δ% | Year 100 | Δ% * | Year 50 | Δ% | Year 100 | Δ% | 50 | 100 |
| →DG | 5.69 | 24% | −10% | 104 | −3% | 156 | −7% | 123 | −6% | 130 | −7% | −14% | 20% |
| →DG -Meat | 4.88 | 21% | −23% | 96 | −11% | 141 | −16% | 108 | −17% | 119 | −15% | −10% | 18% |
| Current | 6.29 | 23% | - | 108 | - | 167 | - | 131 | - | 140 | - | −16% | 20% |
| Lifetime GWP100 | Lifetime GWP* | Δ% * | Δ% * | ||||||||||
|---|---|---|---|---|---|---|---|---|---|---|---|---|---|
| Daily GWP100 | Cumulative t CO2e | Cumulative t CO2we | Year | Year | |||||||||
| Diet | Kg CO2e/day | CH4% | Δ% | Year 50 | Δ% | Year 100 | Δ% * | Year 50 | Δ% | Year 100 | Δ% | 50 | 100 |
| →DG | 5.54 | 24% | –12% | 93 | –5% | 143 | –9% | 112 | –8% | 119 | –9% | –16% | 20% |
| →DG -Meat | 5.20 | 21% | –17% | 90 | –8% | 137 | –13% | 105 | –14% | 116 | –12% | –13% | 18% |
| Current | 6.30 | 23% | - | 98 | - | 157 | - | 122 | - | 132 | - | –19% | 20% |
| Lifetime GWP100 | Lifetime GWP* | Δ% * | ||||||||||
|---|---|---|---|---|---|---|---|---|---|---|---|---|
| Daily GWP100 | Cumulative t CO2e | Cumulative t CO2we | Year | |||||||||
| Diet | Kg CO2e/day | CH4% | Δ% | Year 50 | Δ% | Year 100 | Δ% * | Year 50 | Δ% | Year 100 | Δ% | 100 |
| →DG | 5.69 | 24% | - | 104 | - | 156 | - | 123 | - | 130 | - | 20% |
| →DG Beef | 6.19 | 33% | 9% | 109 | 5% | 165 | 6% | 141 | 15% | 130 | 0% | 27% |
| →DG Pork | 5.75 | 16% | 1% | 105 | 1% | 157 | 1% | 115 | –6% | 136 | 5% | 15% |
| Current | 6.29 | 23% | 11% | 108 | 4% | 167 | 7% | 131 | 7% | 140 | 8% | 20% |
| Lifetime GWP* (TFR = 1.75) | Lifetime GWP* (TFR = 2.25) | Δ% * | Δ% * | ||||||||||
|---|---|---|---|---|---|---|---|---|---|---|---|---|---|
| Daily GWP100 | Cumulative t CO2e | Cumulative t CO2we | Year | Year | |||||||||
| Diet | Kg CO2e/day | CH4% | Δ% | Year 50 | Δ% | Year 100 | Δ% * | Year 50 | Δ% | Year 100 | Δ% | 100 | 200 |
| →DG | 5.69 | 24% | –10% | 680 | –8% | 1152 | –9% | 876 | 9% | 2237 | –9% | 29% | 94% |
| →DG -Meat | 4.88 | 21% | –23% | 592 | –20% | 1010 | –20% | 756 | –21% | 1937 | –22% | 28% | 92% |
| Current | 6.29 | 23% | - | 743 | - | 1269 | - | 958 | - | 2468 | - | 29% | 94% |
Publisher’s Note: MDPI stays neutral with regard to jurisdictional claims in published maps and institutional affiliations. |
© 2021 by the authors. Licensee MDPI, Basel, Switzerland. This article is an open access article distributed under the terms and conditions of the Creative Commons Attribution (CC BY) license (https://creativecommons.org/licenses/by/4.0/).
Share and Cite
Barnsley, J.E.; Chandrakumar, C.; Gonzalez-Fischer, C.; Eme, P.E.; Bourke, B.E.P.; Smith, N.W.; Dave, L.A.; McNabb, W.C.; Clark, H.; Frame, D.J.; et al. Lifetime Climate Impacts of Diet Transitions: A Novel Climate Change Accounting Perspective. Sustainability 2021, 13, 5568. https://doi.org/10.3390/su13105568
Barnsley JE, Chandrakumar C, Gonzalez-Fischer C, Eme PE, Bourke BEP, Smith NW, Dave LA, McNabb WC, Clark H, Frame DJ, et al. Lifetime Climate Impacts of Diet Transitions: A Novel Climate Change Accounting Perspective. Sustainability. 2021; 13(10):5568. https://doi.org/10.3390/su13105568
Chicago/Turabian StyleBarnsley, Jonathan E., Chanjief Chandrakumar, Carlos Gonzalez-Fischer, Paul E. Eme, Bridget E. P. Bourke, Nick W. Smith, Lakshmi A. Dave, Warren C. McNabb, Harry Clark, David J. Frame, and et al. 2021. "Lifetime Climate Impacts of Diet Transitions: A Novel Climate Change Accounting Perspective" Sustainability 13, no. 10: 5568. https://doi.org/10.3390/su13105568
APA StyleBarnsley, J. E., Chandrakumar, C., Gonzalez-Fischer, C., Eme, P. E., Bourke, B. E. P., Smith, N. W., Dave, L. A., McNabb, W. C., Clark, H., Frame, D. J., Lynch, J., & Roche, J. R. (2021). Lifetime Climate Impacts of Diet Transitions: A Novel Climate Change Accounting Perspective. Sustainability, 13(10), 5568. https://doi.org/10.3390/su13105568