1. Introduction
University campuses can be viewed as small cities since they are defined by their own community with a specific set of behaviors and internal circulation networks, which are then connected to a corresponding city network and are key traffic attractors and generators [
1,
2]. Therefore, university campuses present as good case studies for evaluating sustainable mobility solutions that can potentially reduce road traffic negative impacts [
1]. In fact, previous research works have identified the main issues in the transportation system in a university campus, which helped afterwards to understand how the level of sustainability could be improved, and what were the most important aspects that traffic planners should consider when designing a sustainable transportation system for a university campus [
1].
The evaluation and analysis of vehicular exhaust emissions and road traffic performance have been extensively addressed by the research community through field measurement campaigns and the application of estimation frameworks, namely, the overall network emission impacts and road traffic performance in different network sizes and with different fleet compositions [
3,
4]. Carpooling is defined as the action of sharing a car journey, therefore making the car carry more than one occupant and reducing the use of private vehicles [
1]. Furthermore, carpooling has gained interest during the last years and has evolved from a fairly unfamiliar concept to a widely discussed trending topic, as one of the present and future mobility solutions to help the transportation system reduce its own negative outcomes, that is, pollutants and noise emissions, traffic congestion and road crashes, and ultimately increase human quality of life [
1,
5]. In fact, carpooling is a cost-effective measure to moderate road congestion and vehicular pollutants emissions [
1,
5]. Olsson et al. [
6] assembled 18 research studies regarding carpooling published between 2014 and 2018 and developed a meta-analysis. Results indicated that psychological factors are becoming more important (money, time, reducing congestion, and environmental concerns) and that policymakers can increase carpooling by providing cheaper parking spaces and introducing high-occupancy vehicle lanes (HOVL) [
6]. Molina et al. [
7] presented empirical evidence that carpooling is not common when commuting to/from work. Moreover, Molina et al. [
7] stated that carpooling has been used by people trying to avoid crowded modes of transportation, and also indicated that HOVL can facilitate and increase carpooling, namely during pandemic circumstances.
The scientific community has been evaluating carpooling impacts on road transportation and since this commuting approach has shown positive results, the assessment of the reasons that make people carpool and methodologies to control carpooling platforms have been explored [
1,
8,
9,
10,
11,
12,
13,
14]. Results suggest that the process should be as simple as possible so that more people consider themselves to be able to start carpooling [
8]. Furthermore, the creation of trust by allowing people to travel with other known carpoolers is important and can also be achieved through a carpooling company program [
8]. Other effective ways to promote carpooling are to show that more and more people are carpooling, which encourages people to follow, and to emphasize the environmental benefits of carpooling [
8]. The main reasons for people to choose carpooling are more frequently related to leisure trips, followed by shopping and then by work [
9]. When carpooling for work, trips usually present the longest distances traveled [
9]. Carpoolers have acknowledged that society needs to reduce environmental impacts, and one of the main reasons for carpooling is strategic, that is, by sharing the trip, carpoolers are able to save money [
9].
Adopting a lazy user theory, Pinto et al. [
10] developed a theoretical model that was used to understand the motivations that make people choose carpooling over public transportation when commuting from/to a university campus [
10]. Results presented two main reasons to choose carpooling: (1) carpooling drops commuters closer to their destination; and (2) the waiting time for carpooling is considerably lower [
10].
The analysis of the impacts of different mobility scenarios on a university campus regarding pollutants emissions, road traffic performance and safety, was previously developed using a simulation-based framework. The research allowed for the evaluation of the impacts of alternative road infrastructure solutions, such as roundabouts and speed humps, in key network locations. The application of VISSIM (“Verkehr In Städten-SIMulationsmodell”) is common in simulation-based research, and the integration of pollutant emissions and road safety estimation methodologies, for example, vehicle specific power (VSP) and the Surrogate Safety Assessment Model (SSAM), have been shown to return trustworthy results [
2].
Coronavirus disease 2019 (COVID-19) has impacted and is still disturbing all sectors across the world, including transportation [
15,
16,
17]. Due to the pandemic, people around the world were forced to quarantine and telework, and vehicle circulation only occurred when strictly necessary [
18,
19]. In fact, the analysis of road traffic data collected during the current pandemic crisis depicts striking effects of the pandemic on the transportation sector, that is, city movement registered record low values [
19]. The world’s most congested cities registered an average 5–7% city movement during their respective most critical month of the lockdown [
15]. However, such conditions allows to really perceive the extent of the benefits that can be obtained by having “cleaner” cities, for example, statistically significant nitrogen dioxide declines in the United States of America (US) were registered (~26%) when comparing data from January to April 2020 with historical data from 2017–2019 [
20].
The current global health disaster serves as an opportunity to evaluate which aspects of modern life are essential, and which are needed to change or improve so that we can look to achieve more sustainable societies and improve our quality of life [
19]. The pandemic showed how today the transportation sector faces several new challenges, namely: (1) public transportation needs to have a limit regarding the number of users in order to accomplish social distancing; (2) the use of private vehicles circulating daily tends to increase; and (3) teleworking decreases the need to commute and the use of public transportation and private vehicles. Active modes could be a solution, but they are not an option for many users and are not suitable for all trip distances. Thus, carpooling with one to two colleagues when commuting, for example to a university campus, can be a mobility solution that can help to make the road networks more sustainable while maintaining the necessary social distancing between car occupants.
Some universities have, in fact, adapted their carpooling/vanpooling platforms to the actual pandemic circumstances by setting some rules and recommendations to be followed by commuters interested in carpooling/vanpooling, namely: distance to other vehicle occupants, mouth and nose covering, hand disinfection, car ventilation, and regular washing and disinfection of the vehicle, but the impacts of implementing carpooling were not addressed [
21].
The main objective of this research is to evaluate the environmental impacts and road traffic performance of promoting the use of carpooling as a solution to improve university campus networks’ sustainability while achieving the necessary safety measures to prevent the spread of the virus. This evaluation was developed by applying a microscopic traffic simulation tool, which provides second-by-second vehicle activity data that are used to compute: (1) vehicular exhaust emissions using a microscopic emissions estimation methodology; and (2) road traffic performance parameters (travel time, average speed, and distance traveled).
The main contribution of this work is to provide an integrated environmental and road traffic performance evaluation of carpooling strategies adoption under pandemic or post-lockdown periods by considering the safety recommendations, which can provide added value to the scientific community and practitioners since the pandemic does not have an expected end date. Furthermore, the paper explores how an immediate strategic solution, such as carpooling, can be implemented and what impact it can have on road networks, which is an important contribution for the current crisis but also for possible future crises since the actual pandemic is not the first case in human history.
The paper is organized as follows:
Section 2 is devoted to the presentation of the applied methodology, the addressed case studies, data collection and models description;
Section 3 presents the discussion of the obtained results; and the final section presents the concluding remarks.
2. Materials and Methods
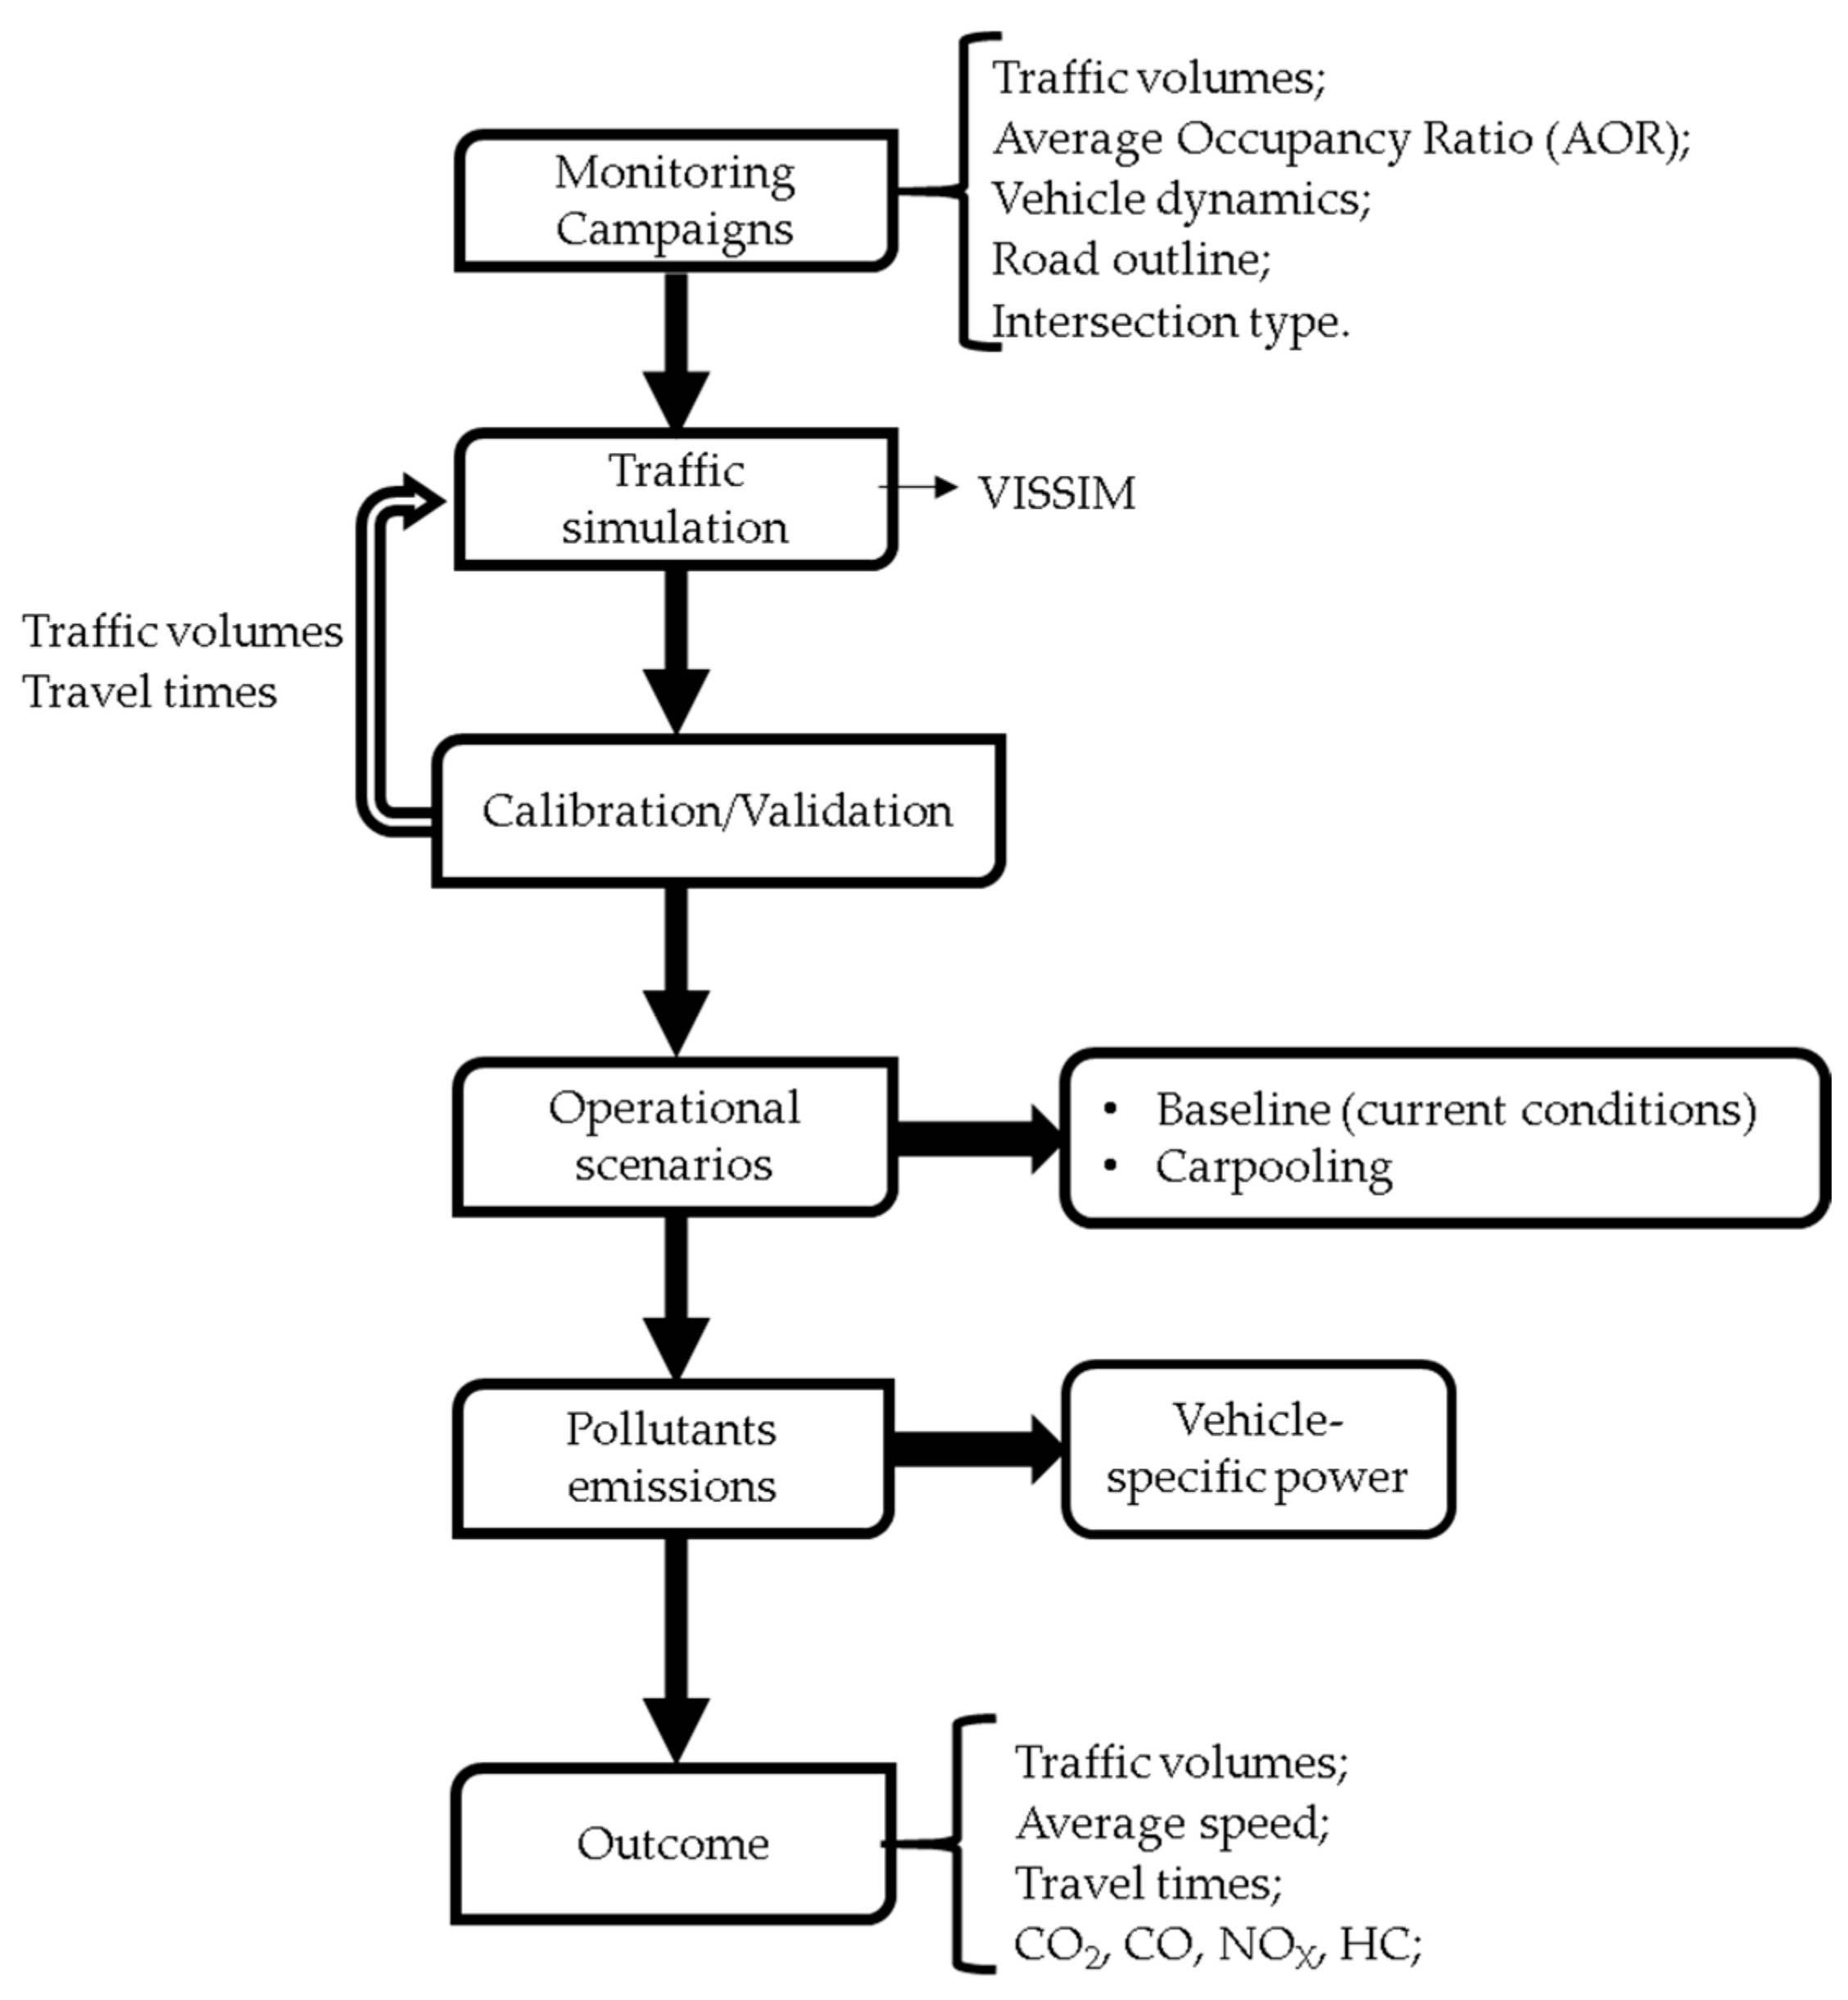
The framework concept is based on a microsimulation approach to evaluating vehicular pollutant emissions and traffic performance with high temporal precision. The framework started with a site-exploration to develop its characterization and identify the main issues within the networks. Afterwards, monitoring campaigns were completed to register traffic volumes, vehicle dynamics and site-specific characteristics. The next step was to code the networks and to perform the calibration and validation of the microscopic traffic simulation models. The initial site characterization and monitoring campaigns allowed the identification of the main issues within the networks, and the definition of the alternative scenario, which would have the potential to improve the sustainability of the networks. Finally, results regarding the baseline and the carpooling scenarios were analyzed and compared.
Figure 1 depicts the conceptual framework designed to fulfill the research objectives.
2.1. Case Study
The studied site locations correspond to the three campuses that compose the University of Aveiro (Portugal): (1) Campus Universitário de Santiago (CS); (2) Águeda School of Technology and Management (ESTGA); and (3) Aveiro North School (ESAN).
CS, which is located in the Aveiro City center, has around 15 thousand members. The main avenue near the campus is characterized by presenting around 10 thousand vehicles per day [
2]. The campus has around 1580 parking spaces divided by 13 parking lots owned by the university that are established all across the campus, and more parking spaces can be found in the campus surrounding areas.
The road traffic access to the campus network is achieved through three main roads: A25 which is a freeway with a posted speed limit of 120 km/h and connects Aveiro to other cities; and N109 and N235 which are national roads with posted speed limits ranging 50–90 km/h along their path. Besides the use of private car, several lines of public transit buses usually transport the population across the city, more specifically, two particular routes that go through the university campus and are the solution for academic community members commuting from the city’s train station to the university campus.
The second campus is the campus of the ESTGA with around 1500 members and around 188 parking spaces. ESTGA is located in the city center of Águeda and there is only one entrance to the campus, which connects the inside of the campus to an urban road with a posted speed limit of 50 km/h. This specific national road then connects to a national road where a high school is located which, during peak hours, is also responsible for attracting and generating road traffic. Additionally, near to the campus (10 min walk) there is a train station which many students use when travelling to the campus.
The smaller campus of the three, ESAN, is located in the vicinity of Oliveira de Azeméis and has around 500 members and 120 parking spaces. The campus has a single entrance point which is connected to a steep rural road (with a maximum gradient of 14%) with a posted speed limit of 50 km/h; however, due to the mentioned road grade and the usual state of traffic free flow, drivers tend to drive their vehicle well over the speed limit (speeds over 90 km/h were observed). There is also a public transit bus lane that connects the city center to the campus.
Further details regarding the case studies’ networks will be explored in the following sections.
2.2. Field Data Collection
A well-established data sample is needed to calibrate and validate a microsimulation traffic model. The monitoring campaigns were completed during two typical weekdays at each case study location to be applied as two different sets of data to calibrate and validate the developed models. The campaigns took place during the months of April and May 2019.
2.2.1. Campus Santiago
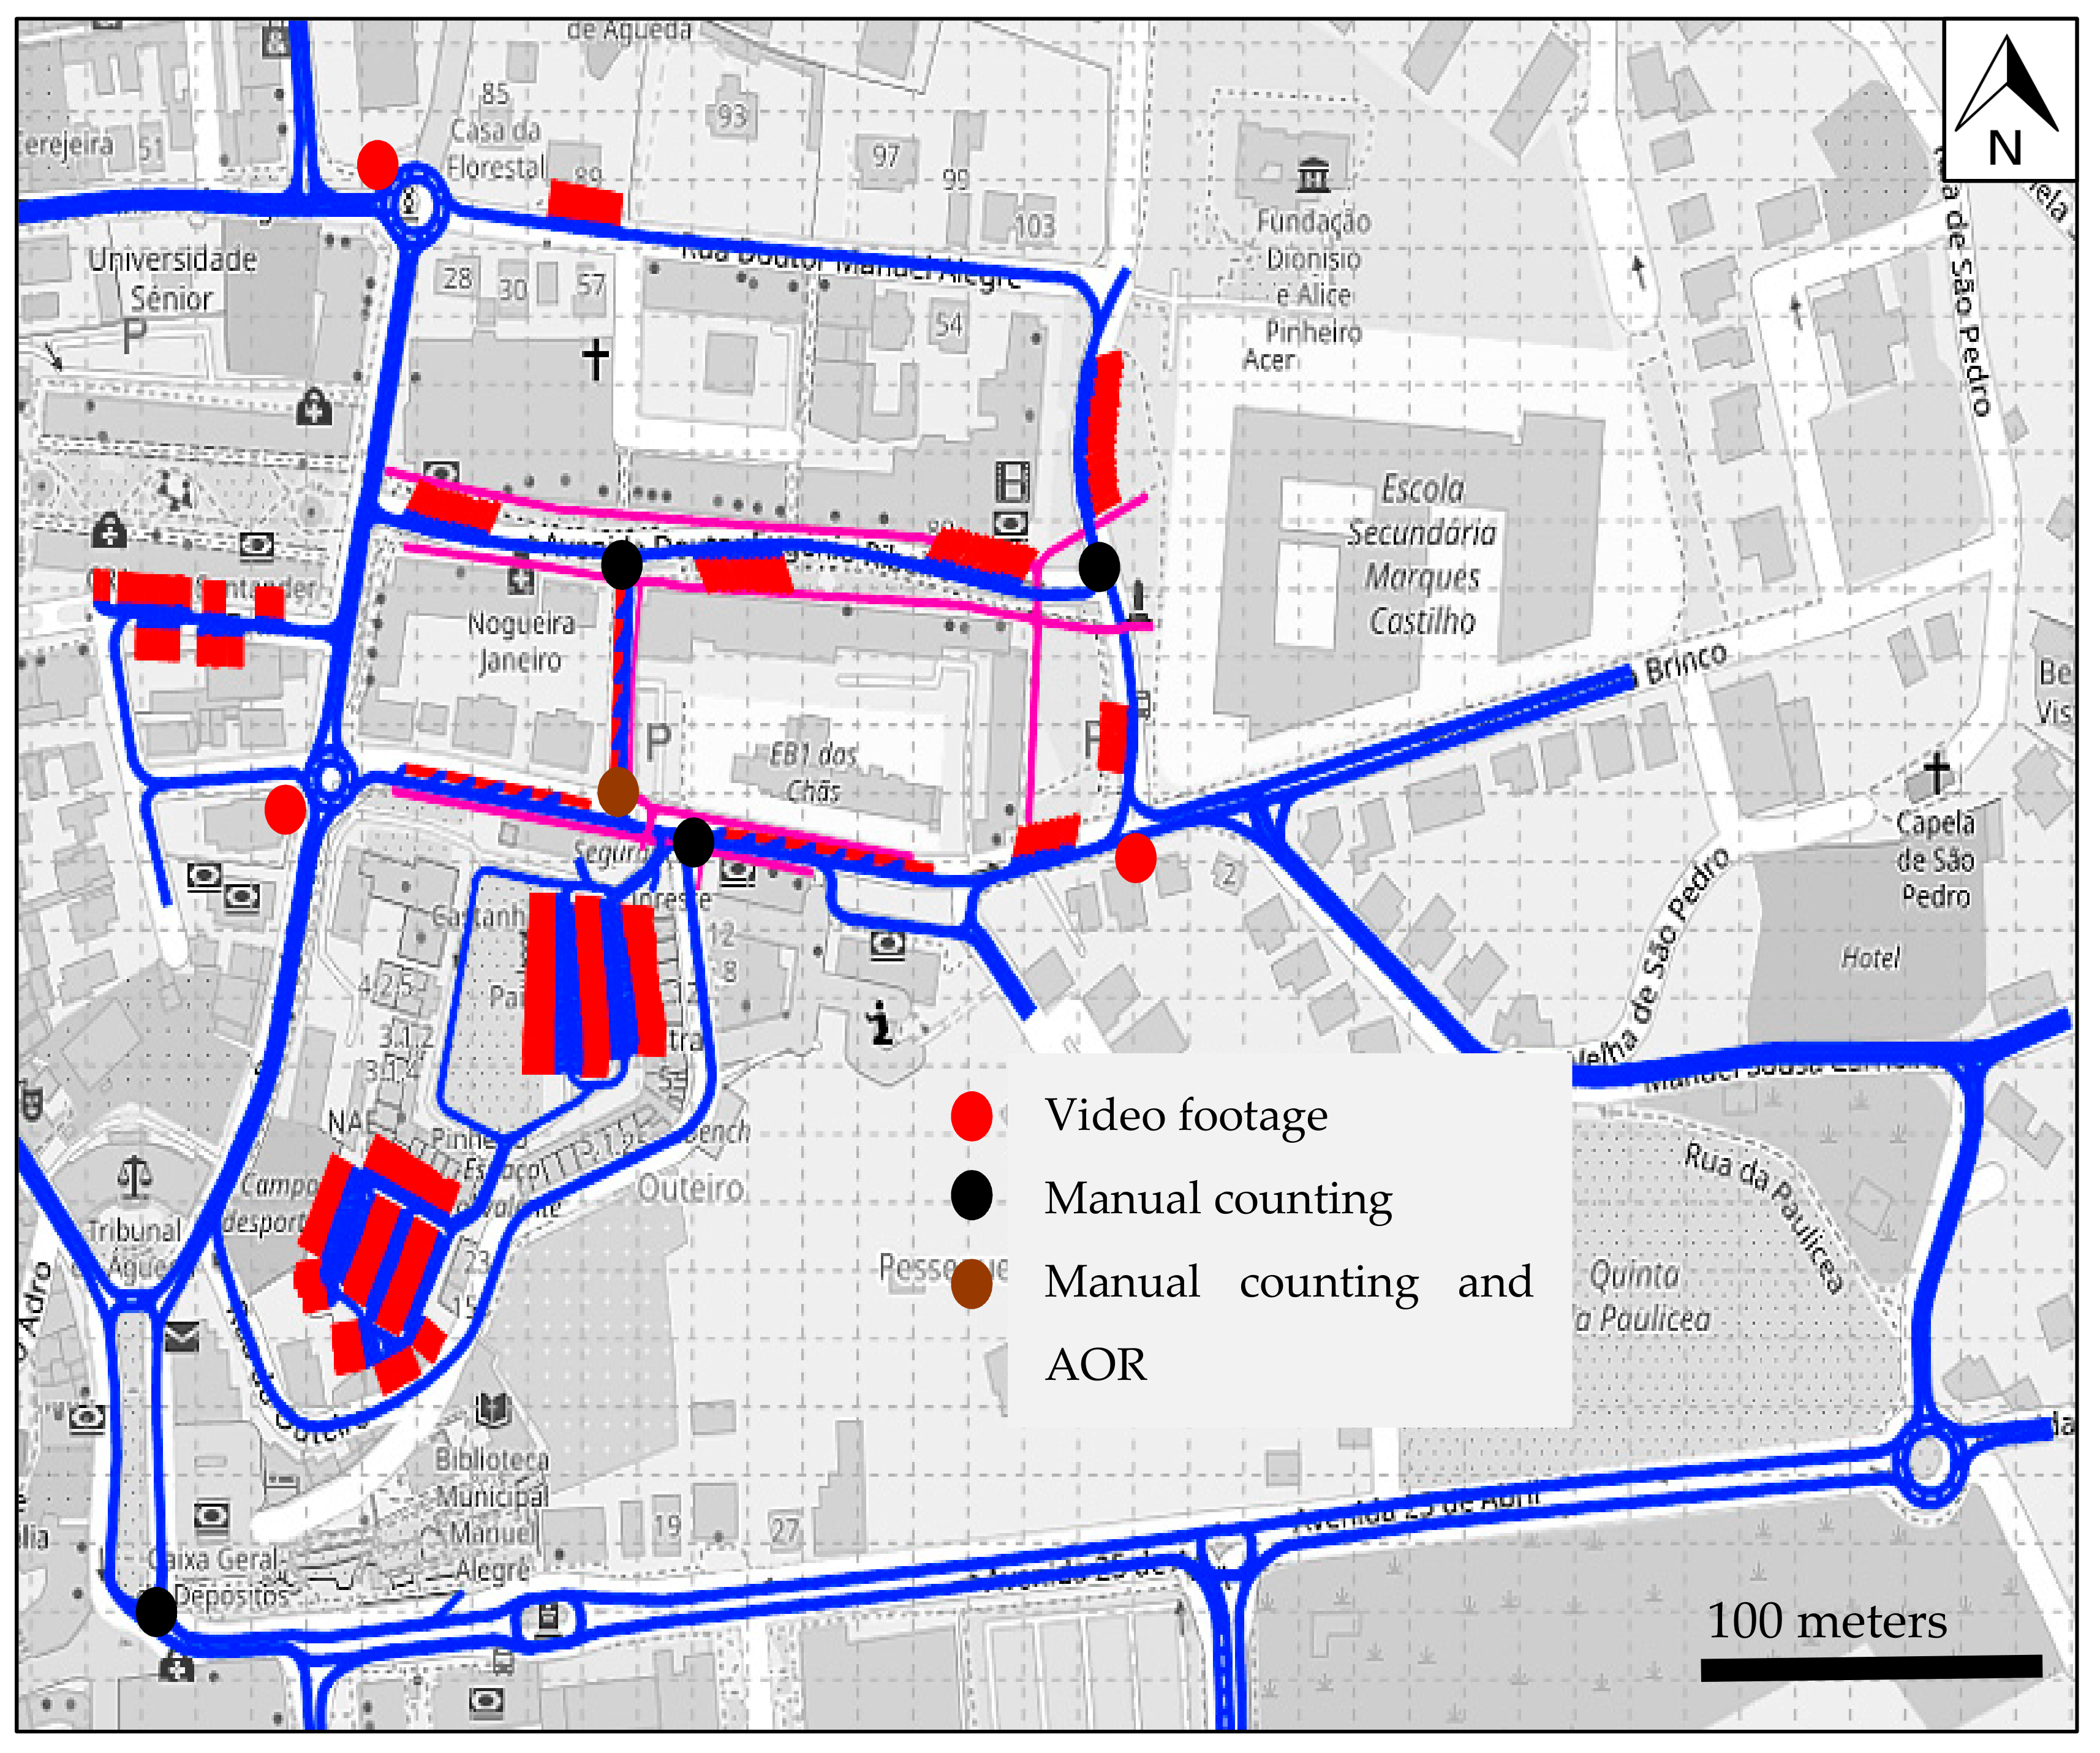
Figure 2 displays the 24 key locations defined to collect traffic volumes (pedestrians, cyclists, and motor vehicles) and vehicle AOR during the morning peak hour between 8:45 and 9:45 a.m. (most traffic congested period). These monitoring zones resulted in a total of 103 monitoring points. Traffic volumes were recorded through manual counting (5-min interval) or video recording, while AOR was assessed via manual counting in two of the main entrances to the campus. A total of over 50 h of video recordings were thoroughly analyzed.
Monitoring campaigns at CS to acquire vehicle dynamics data (speed and acceleration on a second-by-second basis) and assess site-specific characteristics were developed by completing 6 different routes. The established routes were covered by driving a typical midsized (D-segment) light duty passenger vehicle with the following characteristics: (1) 1.9 L diesel engine; (2) gross vehicle weight-1342 kg; and (3) transmission type–5 speed manual gearbox. The vehicle was equipped with a Global Positioning System (GPS) travel recorder (accuracy ~5 m) and an On-Board Diagnostics scan tool (OBD-II ELM327 Bluetooth). Vehicle dynamics monitoring campaigns encompassed a total traveled distance over 80 km throughout the 6 covered routes.
2.2.2. Campus ESTGA
Figure 3 shows 8 monitoring zones that resulted in 38 monitoring points that were defined to register traffic volumes (pedestrians, cyclists and motor vehicles) and vehicle AOR during the afternoon peak hour between 5:45 and 6:45 p.m. (most traffic congest period). In total, more than 15 h of video footage data were recorded. The vehicles’ AOR was measured at the entrance of the campus.
The experimental data collection developed at ESTGA to obtain vehicle dynamics data and evaluate site-specific characteristics was completed using the same experimental setup described for CS. Vehicle dynamics monitoring campaigns resulted in a total traveled distance of 50 km throughout the 6 covered routes.
2.2.3. Campus ESAN
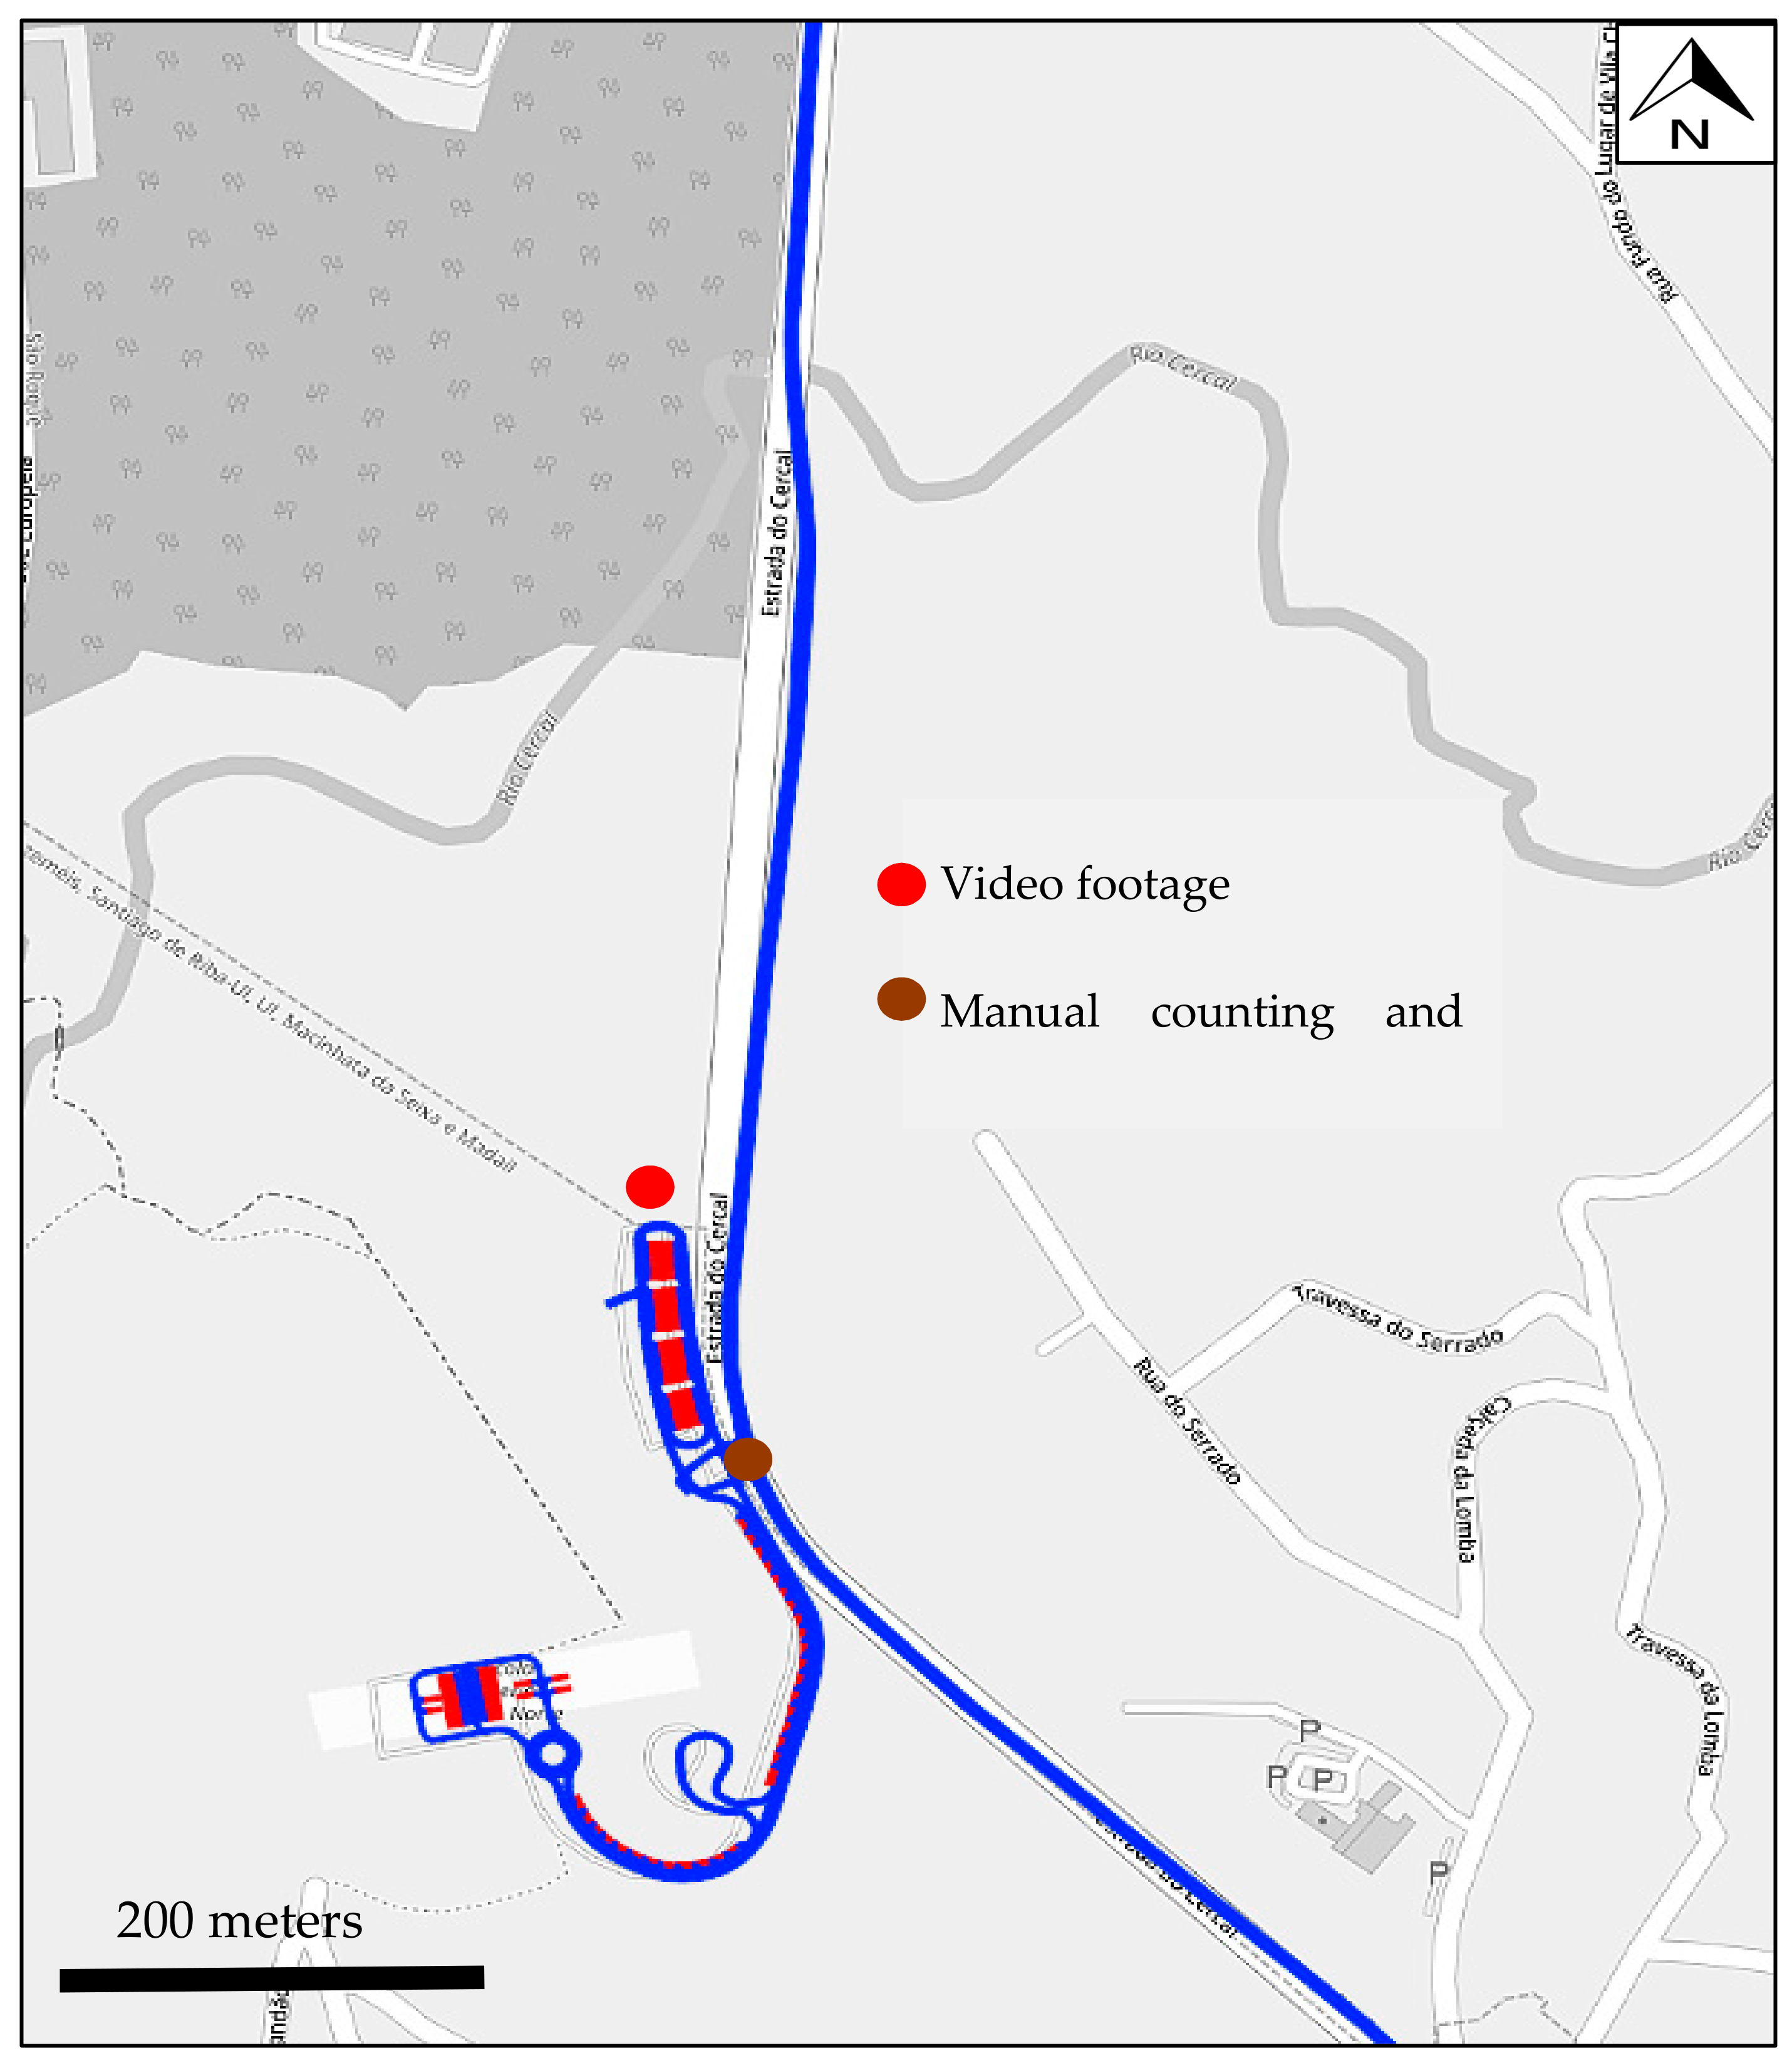
Figure 4 presents the 2 monitoring zones defined to collect traffic volumes (pedestrians, cyclists and motor vehicles) and vehicle AOR during the afternoon peak hour between 5:45 and 6:45 p.m. (most traffic congested period). These monitoring zones resulted in a total of 10 monitoring points. Traffic volumes (pedestrians, cyclists and motor vehicles) were recorded through video recordings, while AOR was assessed via manual counting at the entrance of the campus. In this campus, approximately 10 h of video recordings were gathered.
The routes completed during the experimental data collection developed at ESAN followed the same experimental setup described for the other campuses and resulted in a total traveled distance of 30 km throughout the 2 covered routes.
2.3. Microscopic Traffic Simulation Model
The microscopic traffic simulation tool VISSIM 2020 was used to code the network because it allows to: (1) retrieve fully disaggregated vehicle trajectory files that can be used to evaluate the network traffic performance and pollutant emissions impacts; (2) model a set of driving behavior parameters according to road and vehicle type, and ultimately are able to characterize site-specific drivers behaviors; (3) identify pollutant emissions hotspots with high spatial and temporal resolution; (4) test carpooling scenarios, and has shown to be a successful microsimulation for completing this task; and (5) simulate different vehicle AOR [
2,
4,
22,
23].
The Wiedemann 74 and 99 models were used to characterize the psychophysical dynamics of each entity of road traffic and each cyclist, respectively. Only a few links in the CS network are characterized as highway links, hence, the primary driving behavior model used in the 3 networks is the Wiedemann 74, which is, according to the literature review, the appropriate model to represent road traffic in urban areas [
4,
20]. The Wiedemann 99 model was applied using the default settings for vehicles to represent highway driving behavior as suggested by the literature review [
4,
22]. Furthermore, during the calibration and validation process, both models were shown to correctly represent site-specific driving behaviors.
The microscopic traffic models were calibrated and validated for a one-hour period, from 8:45 to 9:45 a.m., and a fitting warm-up period was used for each network (according to their size): (1) 30 min warm-up for CS (8:15–8:45 a.m.); (2) 15 min warm-up period for ESTGA (5:30–5:45 p.m.); and (3) 5 min warm-up period for ESAN (5:40–5:45 p.m.). The calibration and validation of microscopic traffic simulation models is an iterative trial and error process, which can be defined following the next steps: (1) traffic volumes calibration; (2) travel times calibration; and (3) traffic volumes and travel times validation. To pinpoint the vehicle dynamics at each link, initially vehicle speed distributions across the network were modeled according to the identified ranges at each specific zone of the network. Traffic volumes and vehicles travel times’ calibration and validation were completed by adjusting the simulation models’ vehicle inputs, vehicle types speed across all network links and driving behavior parameters [
2,
4]. The following Wiedemann 74 driving behavior parameters were adjusted: average standstill distance, additive part of safety distance and multiplicative part of safety distance, whilst for the rest of the parameters, the default values were maintained. Furthermore, two of the conflict areas’ parameters were adjusted in some key locations. These parameters were the front and rear gaps which change how the driver behaves in conflict areas. The methods to evaluate whether the calibration and validation was successful are described below.
VISSIM was set to run stochastically to obtain the most realistic model possible and, consequently, all results accomplished are the average of 10 simulation outputs, as suggested in the literature [
4,
24]. The initial simulation random seed value was 1 with an increment equal to 3, and both scenarios were compared using the same random seed simulations.
The criterion used to perform the calibration and validation of the traffic volumes was the Geoffrey E. Havers (GEH) statistic. GEH is an empirical formula which allows the evaluation of the goodness-of-fit between measured traffic volumes against the estimated traffic volumes obtained with the microscopic traffic model [
25]. For the model to be considered calibrated, at least 85% of the monitoring points need to have GEH value below 5 [
25].
The calibration of the model travel times was developed by creating the routes traveled during the field measurements into the model to be completed by a suitable number of floating vehicles [
4,
26]. Afterwards, estimated travel times were tested against observed travel times for each route and are deemed calibrated when a high level of statistical significance is found for a significance level of 5% [
4,
26]. The validation centered in comparing the estimated traffic demand and tested routes’ travel times of the calibrated model with different sets of data of real-world traffic demand and routes travel times [
4,
25,
26].
2.4. Exhaust Emissions Microscopic Evaluation
The evaluation of the vehicular pollutants emissions was performed through the application of the vehicle-specific power (VSP) methodology. The VSP approach has been widely applied and has been shown to be a suitable tool for estimating vehicle exhaust emissions for the following reasons: (1) it provides estimates with high resolution of time (second-by-second); (2) considers aerodynamic drag, speed, acceleration, road grade and rolling distance effects; and (3) has shown a high correlation with the variability of emissions on light passenger gasoline and diesel vehicles, light commercial diesel vehicles and diesel buses [
27,
28,
29]. The emissions of CO
2, CO, NO
x, and HC were estimated for light duty passenger vehicles (LDPV), light duty commercial vehicles (LDCV) and buses [
27,
28]. LDPV comprise all vehicles that are used to transport passengers and present a length lower than 6 m, while the considered LDCV consist of vehicles used to transport cargo, commonly known as vans, which present a gross vehicle weight rating (GVWR) lower than 3.5 metric tons [
30,
31]. The estimates for LDPV and LDCV are provided by the following mathematical expression [
32]:
where
v is the vehicle instantaneous speed m/s,
a is the vehicle instantaneous acceleration in m/s
2 and
grade is the topographic slope assessed as a decimal fraction [
32]. The VSP estimate is comprehended in one of the 14 VSP modes for LDPVs and LDCVs (ranging from −50 to +50 kW/ton) which correspond to the respective CO
2, CO, NO
x and HC emission rates [
27,
28]. The VSP estimate for buses is concurrently given by the following expression [
32]:
Distinctly, VSP modes are categorized in 8 modes for buses (ranging from −30 to +30 kW/ton) [
29].
A graphical user interface (GUI) developed via MATLAB was conceived to analyze second-by-second vehicle dynamic data provided by VISSIM output (approximately 10 million, 1 million and 2 thousand registers for the CS, ESTGA and ESAN networks, respectively) and perform the evaluation of the data sample to provide the estimates of exhaust pollutants emissions and traffic performance parameters by vehicle type and network link segment.
Monitoring campaigns allowed the determination of the fleet composition present in the network regarding LDPVs, LDCVs and transit buses. LDPVs were categorized as 51% being light duty diesel vehicles and 49% being light duty gasoline vehicles, according to the Portuguese fleet composition [
4].
3. Results
The present section provides a discussion concerning the results obtained during the calibration/validation of the microsimulation traffic models, pollutant emissions (CO2, CO, NOx, and HC) and traffic performance. Furthermore, results from the carpooling scenarios are analyzed and compared to the respective baseline scenario.
3.1. Traffic Models Calibration and Validation
The end-result of the calibration and validation of the estimated traffic volumes and travel times for the baseline scenario is presented in
Table 1, more specifically, the percentage of traffic volumes’ monitoring points that obtained a GEH value lower than 5 and a coefficient of determination (R
2) between estimated and observed traffic volumes datasets, and the average relative difference and average p-value (Student’s t-test) between observed and estimated travel times.
The calibration of traffic volumes in the CS network obtained a coefficient of determination (R2) of 94%, which shows the estimated traffic volumes to present a good fit compared to observed traffic volumes and are in accordance with suggested calibration criteria for traffic flows by presenting more than 93% of monitoring points with GEH values lower than 5, in fact, 88% of monitoring points achieved a GEH value lower than 4. The validation of traffic volumes applying a different set of data to be compared to the estimated traffic volumes also obtained a good coefficient of determination (87%), and 85% of the monitoring points attained a GEH value lower than 4.
The travel times of the six routes performed during the monitoring campaigns achieved simulated travel times, completed by each route respective floating vehicles, which were statistically significant compared to the observed travel times for both the calibration and validation datasets. The average relative difference (ARD) between the estimated and observed travel times was 11% and 13%, respectively, with a maximum value of 16% being observed when comparing to the validation dataset.
The estimated traffic volumes in ESTGA network achieved a good fit by accomplishing 98% and 80% coefficients of determination for the calibration and validation datasets, respectively. GEH value between estimated and observed traffic volumes fulfilled the requirements and 98% and 92% of monitoring points obtained a value below 5, respectively (94% and 88% of monitoring points obtained a value below 4). Estimated travel times of the six routes completed during the monitoring campaigns were statistically significant compared to the observed travel times for both the calibration and validation datasets. The maximum relative difference between estimated and observed travel times was 11% during the validation phase.
Traffic volumes estimated in the ESAN network had an almost perfect fit, that is, 99% and 97% coefficients of determination were obtained when compared to the observed traffic volumes of the calibration and validation datasets, respectively. Additionally, 100% of the monitoring points achieved a GEH value lower than 5 between estimated traffic volumes and the calibration and validation datasets. In fact, 100% of the monitoring points achieved a GEH value lower than 4 during the calibration and validation. The estimated travel times of the two routes during the vehicle dynamics data collection were statistically significant compared to the observed travel times, for both the calibration and validation sets of data. The average relative difference was 2% with a standard deviation of 1% for both the calibration and validation datasets.
3.2. Definition of the Operational Scenarios
Direct observations and walk-in audits performed across CS show a recurrent issue, the excessive volume of road traffic circulating across the campus, which results in the lack of parking spaces and is obviously a major opportunity to improve the network sustainability performance. Furthermore, previous surveys indicate a significant use of private cars to commute to the university campus and low carpooling levels [
33]. Observations in the other two campuses were also shown to be characterized by low carpooling levels, and although both do not suffer from the problems mentioned above, the implementation of carpooling under safety measures may result in a positive outcome.
The present research pursues the development of a comparison between three different networks’ current conditions scenarios with the implementation of carpooling in each one of the respective networks. Therefore, the baseline scenarios correspond to the current traffic conditions concerning each case study during their most traffic congested period, that is, the morning peak hour in CS, and the afternoon peak hour in ESTGA and ESAN campuses. Carpooling scenarios were designed following a set of assumptions, as follows: (1) vehicles commute with up to three occupants (including driver) to comply with COVID-19 recommendations; (2) 10% of campus parking spaces are reserved for carpoolers; (3) carpooling parking spaces are exclusive to the academic community; and (4) all reserved parking spaces were considered to be filled during the simulations by vehicles either with two or three occupants, more specifically, half of the parking spaces are filled with vehicles with two occupants and the other half with vehicles with three occupants. Additionally, it was also assumed that people will commute with people from the same household or those who usually spend the day together and where all vehicle occupants have the same destination, such as the respective campuses. Carpoolers would arrange the “rides” by simply communicating with each other since they live together or usually spend the day together, and no virtual platform would, therefore, be needed for the purpose of organizing the “rides” itself.
Network traffic volumes and vehicle AOR at campus entrances are based on field measurements developed before the start of the COVID-19 pandemic. Therefore, the baseline scenario vehicle AOR was adapted to meet the safety recommendations and have a maximum of three occupants per vehicle while maintaining the same total number of people travelling. The “surplus” of vehicle occupants (more than three occupants) were distributed into other vehicles while maintaining the ratio weight of vehicles with one, two or three occupants in the baseline vehicle AOR distribution matrix at each site location. The COVID-19 pandemic also impacted the use of public transit buses and, for the purpose of this research, during the baseline and carpooling scenarios it was assumed that public transit buses traveled with half occupation. Hence, considering these factors, the traffic volumes were adjusted to create the baseline scenarios, which were designed to represent pandemic scenarios with even more critical traffic conditions than the observed during the COVID-19 pandemic, that is, higher traffic volumes.
Table 2 presents the vehicle AOR used during the baseline (adapted from pre-pandemic circumstances) and carpooling scenarios in each network, and the respective reduction of vehicles being injected into the networks.
3.3. Comparison of Typical Conditions with the Implementation of Carpooling
The present research completed an analysis regarding exhaust pollutant emissions and traffic performance at a university campus on the following scenarios: (1) university campus under pandemic circumstances-baseline; and (2) implementation of carpooling.
3.3.1. Campus Santiago
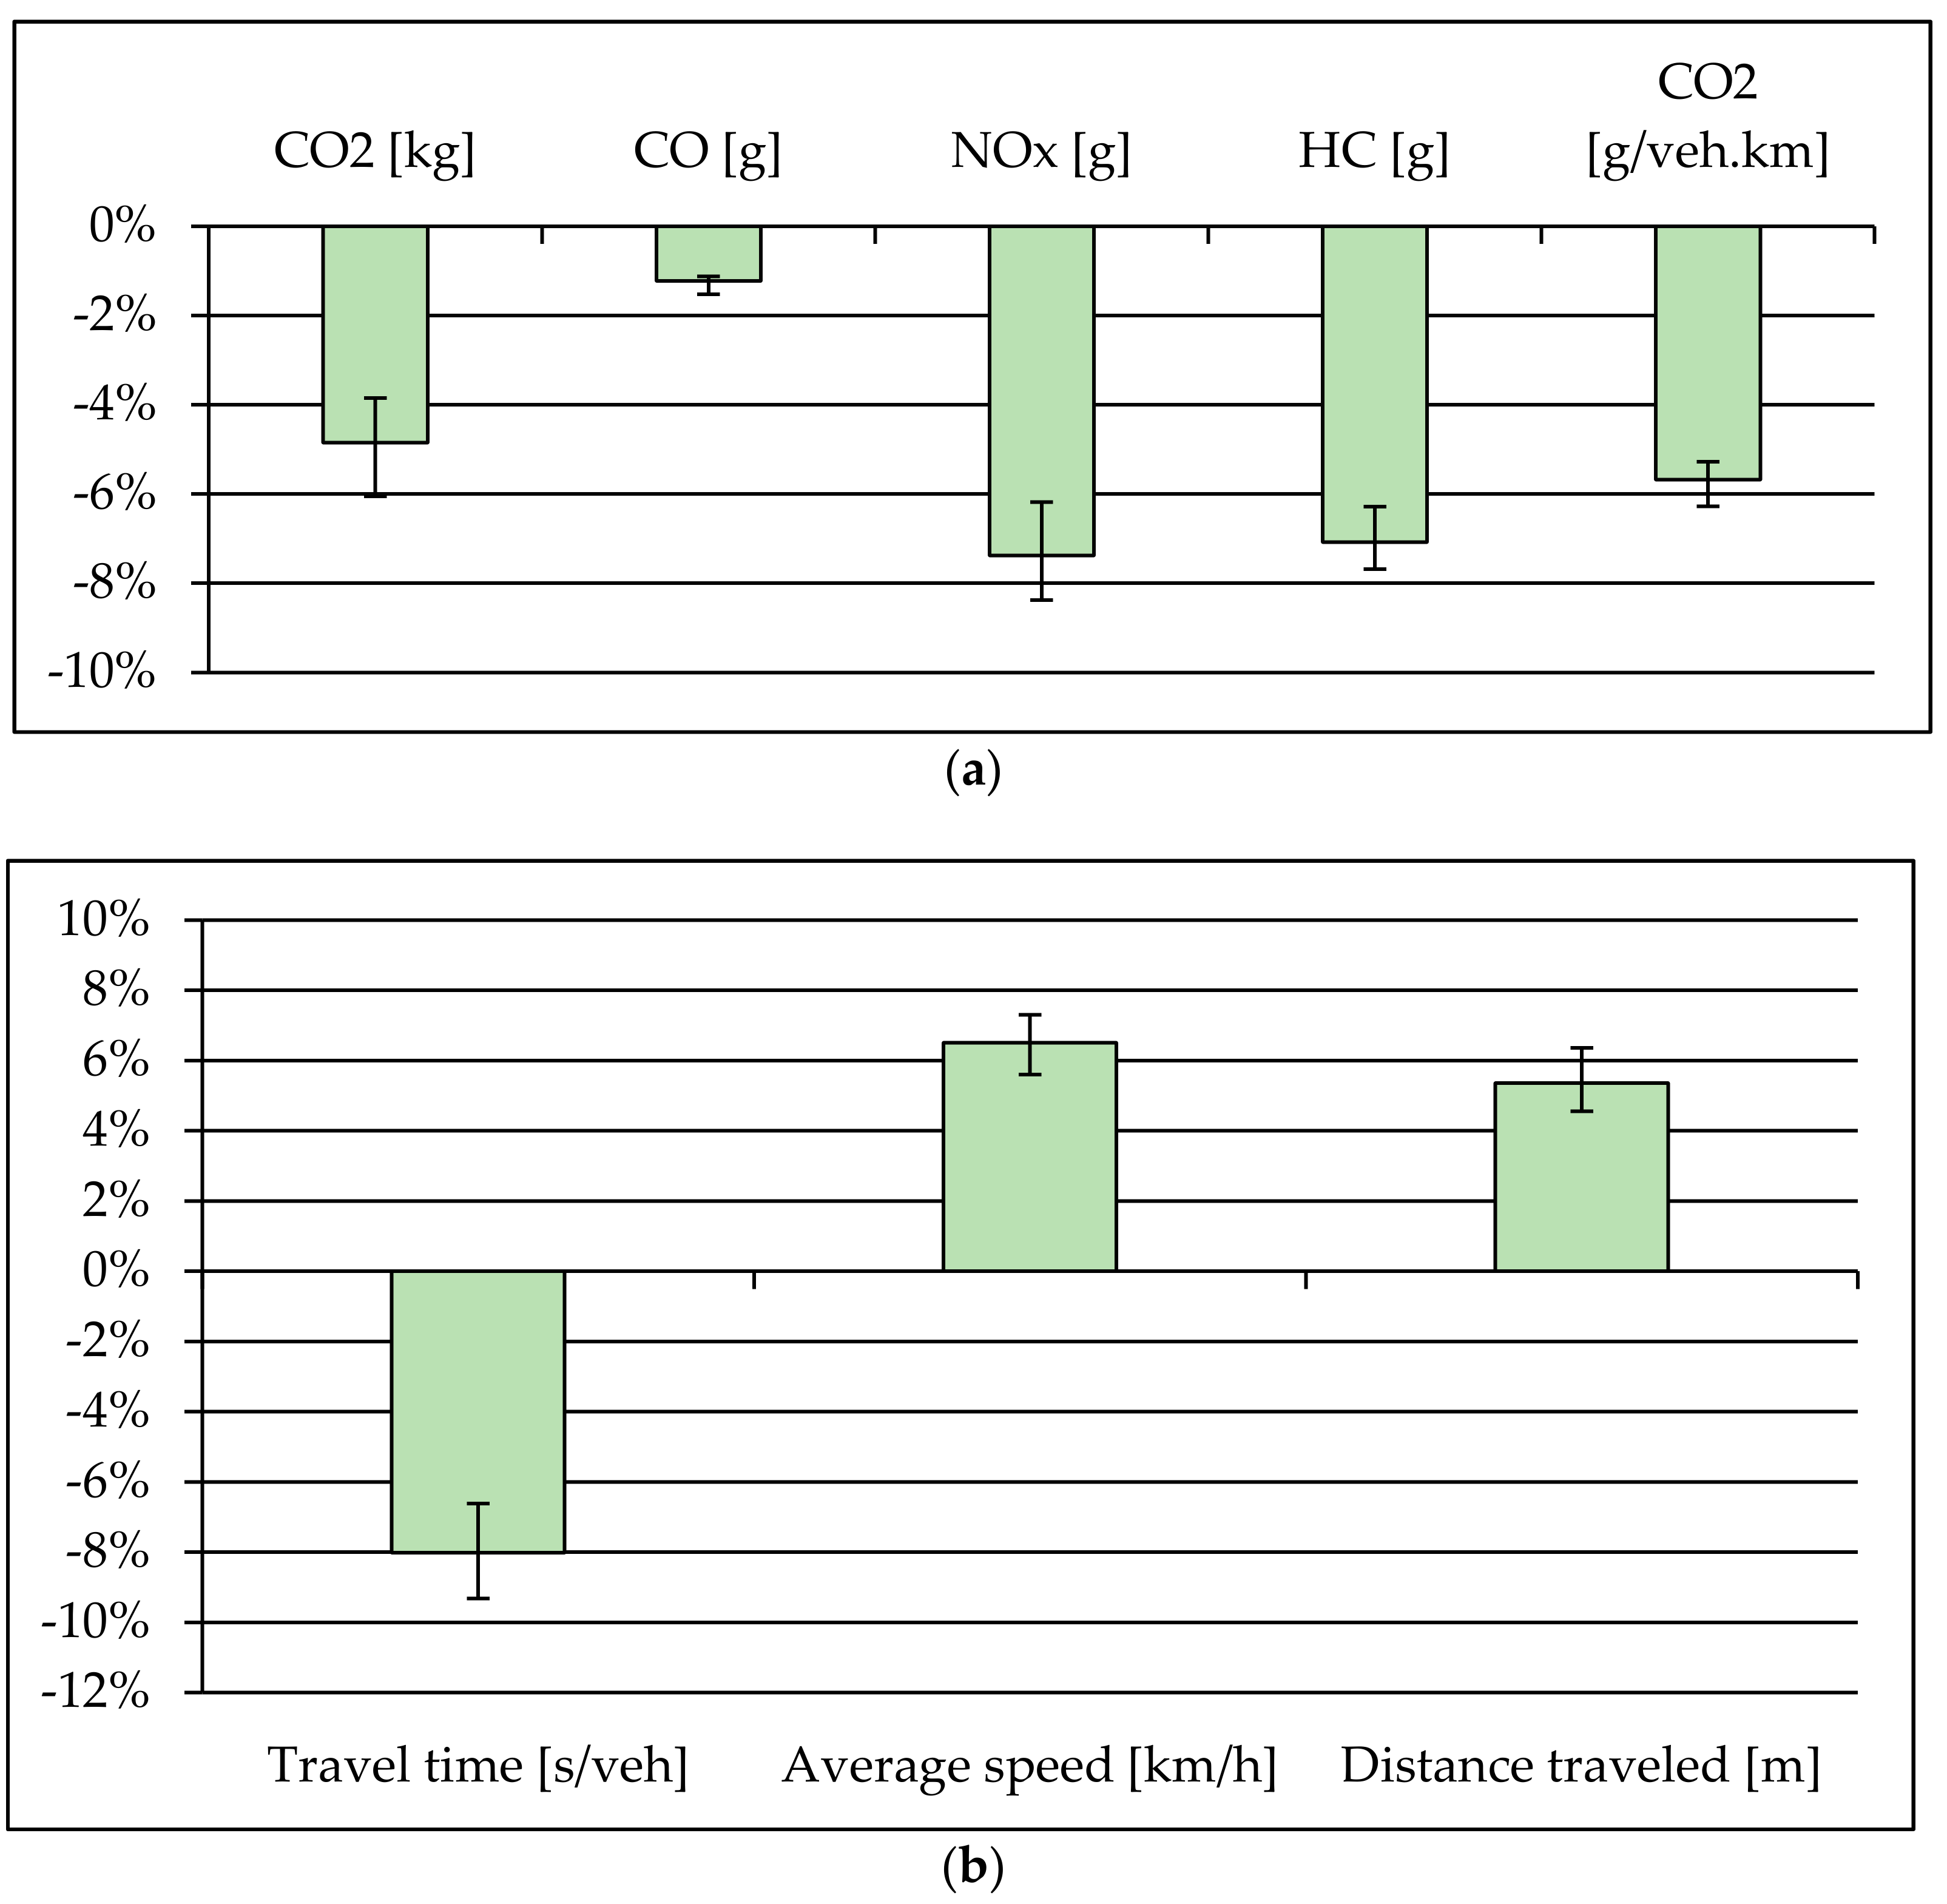
Figure 5a presents the percentual variation concerning vehicular pollutant emissions between the carpooling and the baseline scenarios in CS.
The carpooling scenario resulted in statistically significant variations of CO2, NOx and HC emissions compared to the baseline scenario with reductions of 5% for CO2 and 7% for NOx and HC. Moreover, CO2 emissions per unit distance (by coded link) were also statistically significant with an average reduction of almost 6%.
Inside campus road segments presented a reduction in associated pollutants emissions, that is, absolute emissions and emissions per unit distance of CO2 and absolute emissions of NOx decreased by 3%, 9% and 4%, respectively.
Figure 5b depicts the percentual variation regarding road traffic performance parameters, comparing the implementation of carpooling with the baseline scenario in CS. Results show that road traffic performance parameters experienced statistically significant variations with the implementation of the carpooling scenario. The reduction of circulating vehicles prompted lower congestion levels across the network and, consequently, the average speed increased (7%) and the remaining vehicles were able to circulate faster (8% lower travel time) and complete a higher percentage of the respective trips (5% more distance covered).
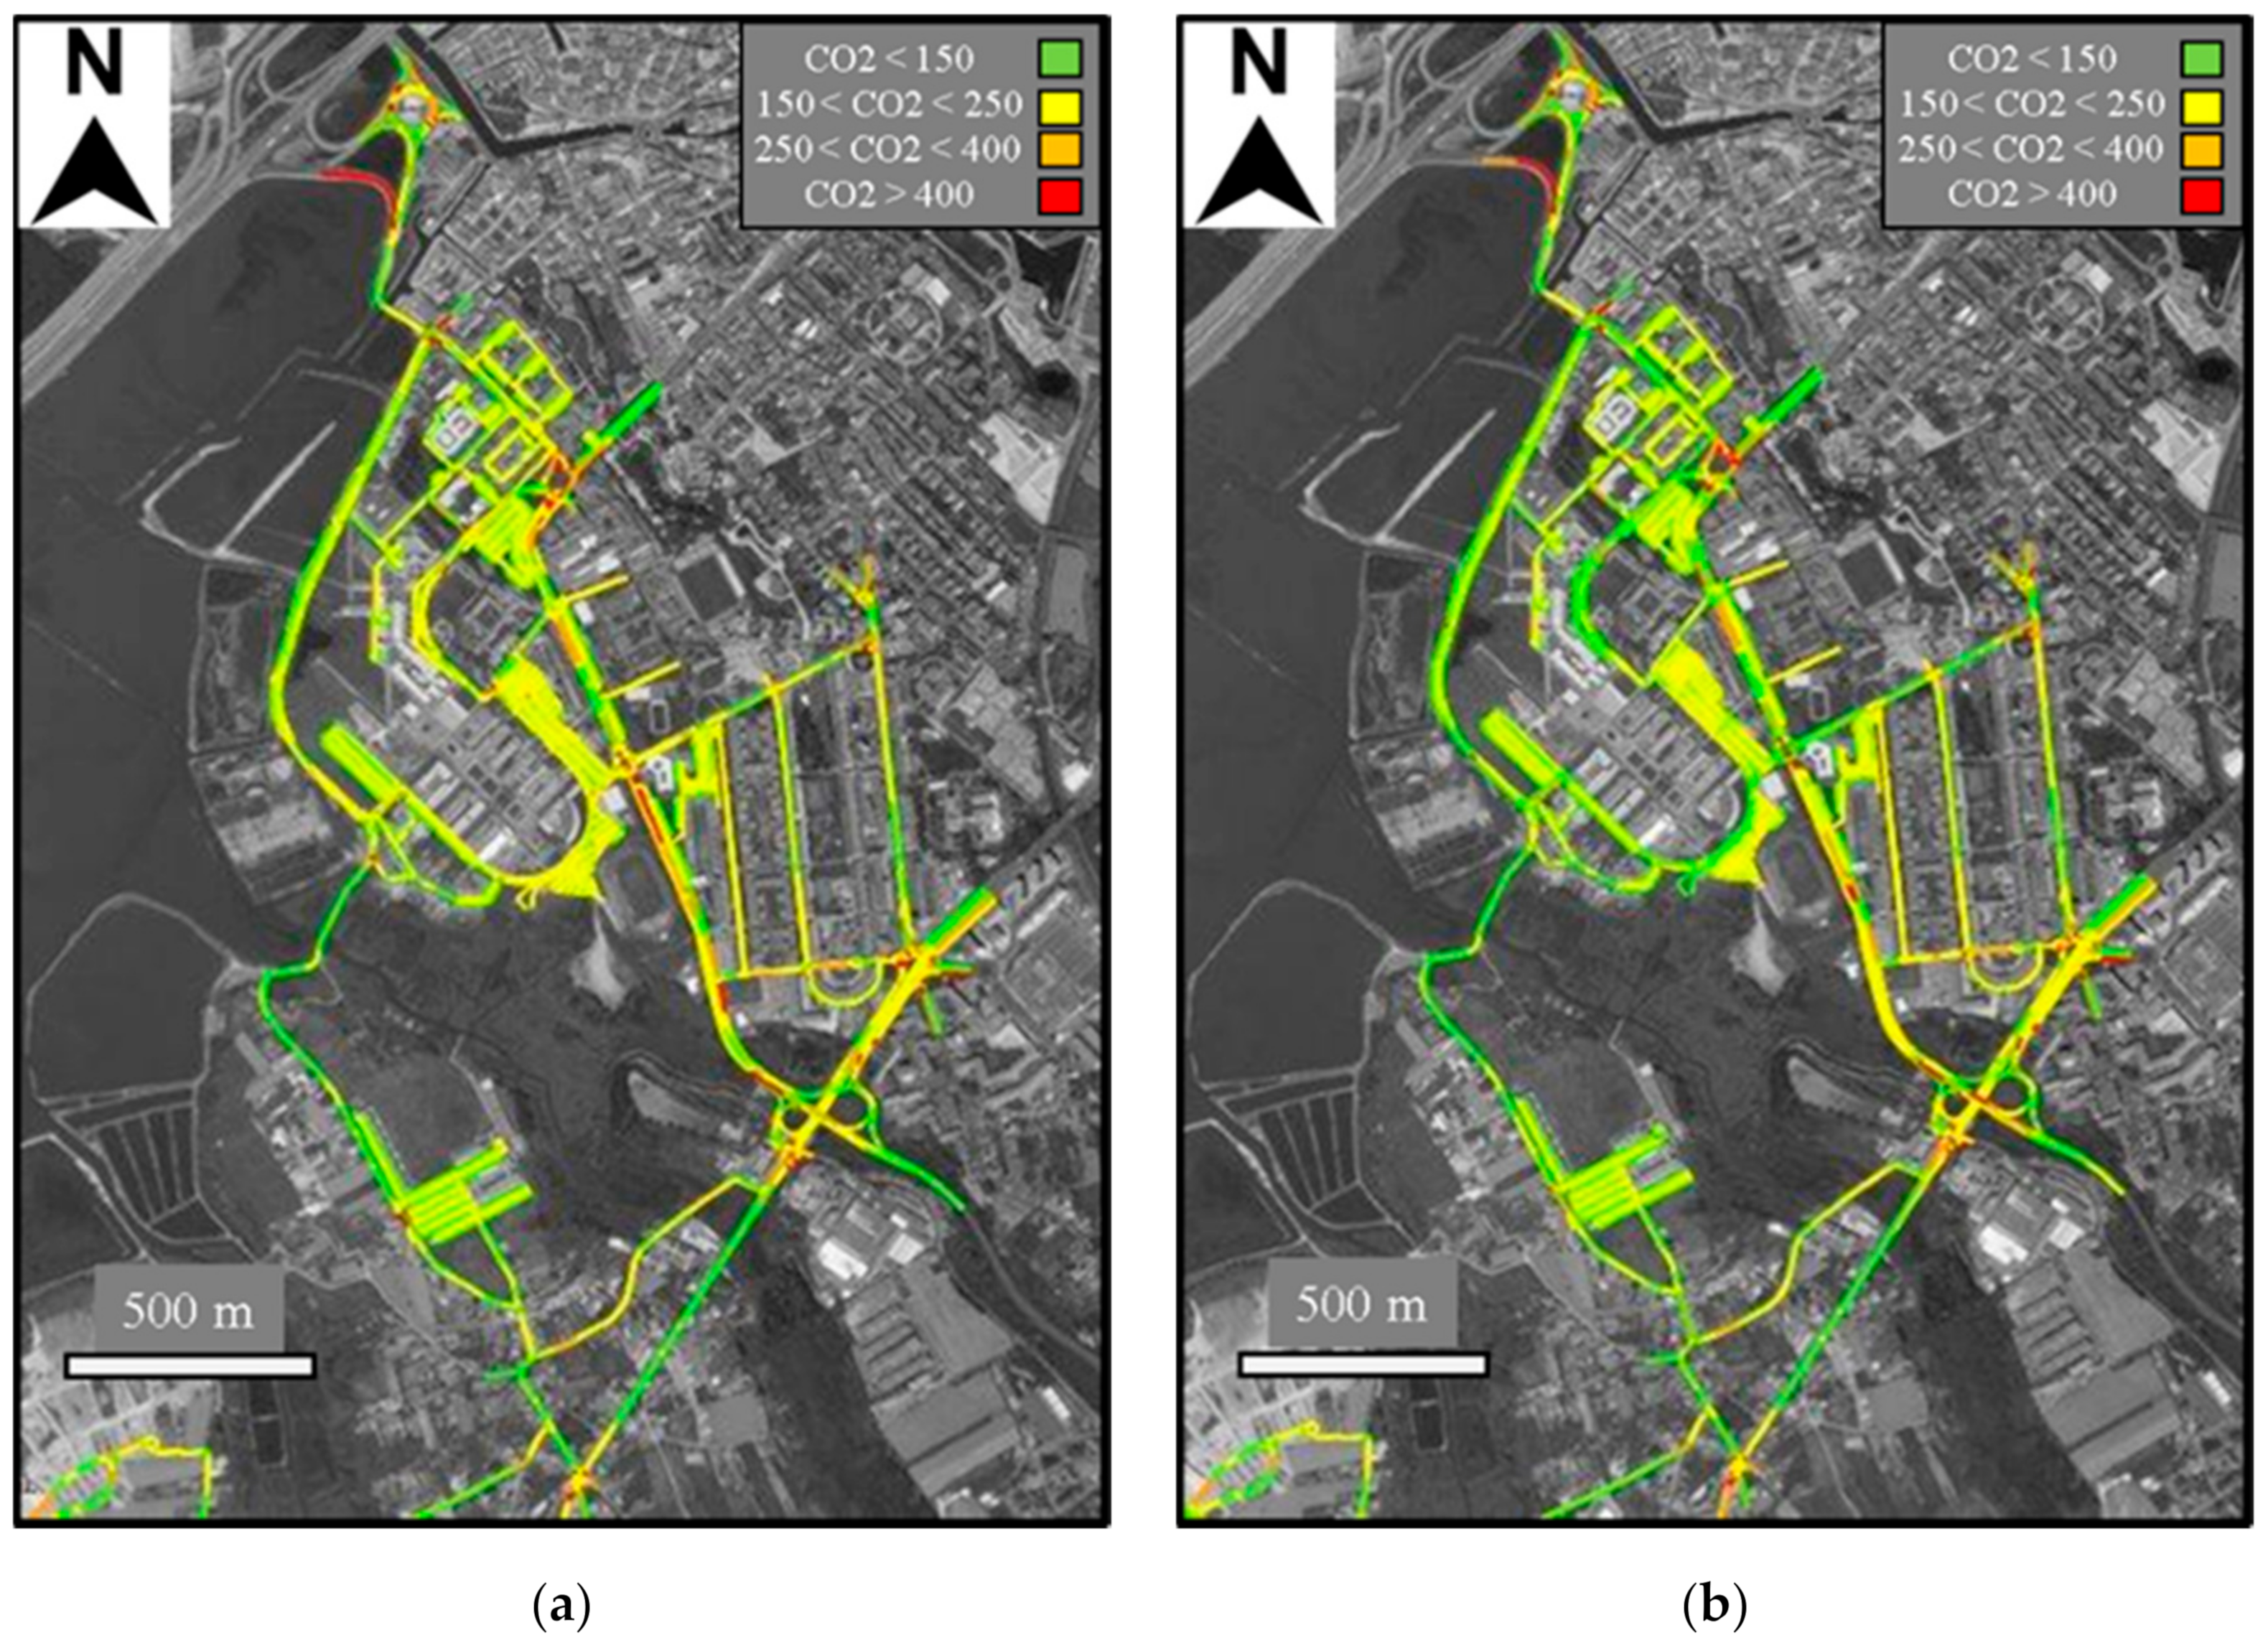
Figure 6a,b exhibits the CO
2 emissions hotspots of both the baseline and carpooling scenarios in CS. The carpooling scenario was able to reduce the network average CO
2 emissions per kilometer by around 6%, and it can be noticed that some road segments became “greener”, particularly in the main avenue that provides access to the campus and inside the campus.
Results show relatively high values of emissions of CO
2 per kilometer (per vehicle), that is, the average values were approximately 173 and 170 g.km
−1.veh
-1 for the baseline and carpooling scenarios, respectively. It must be noted that 10% of circulating vehicles are LDCV. Furthermore, the emission factors applied were based on the literature as stated in
Section 2.4 and are relative to older vehicles, which tended to emit higher quantities of pollutants, but since the same emission factors were applied for both scenarios, what must be considered is the impact of implementing a carpooling platform compared to the baseline scenario.
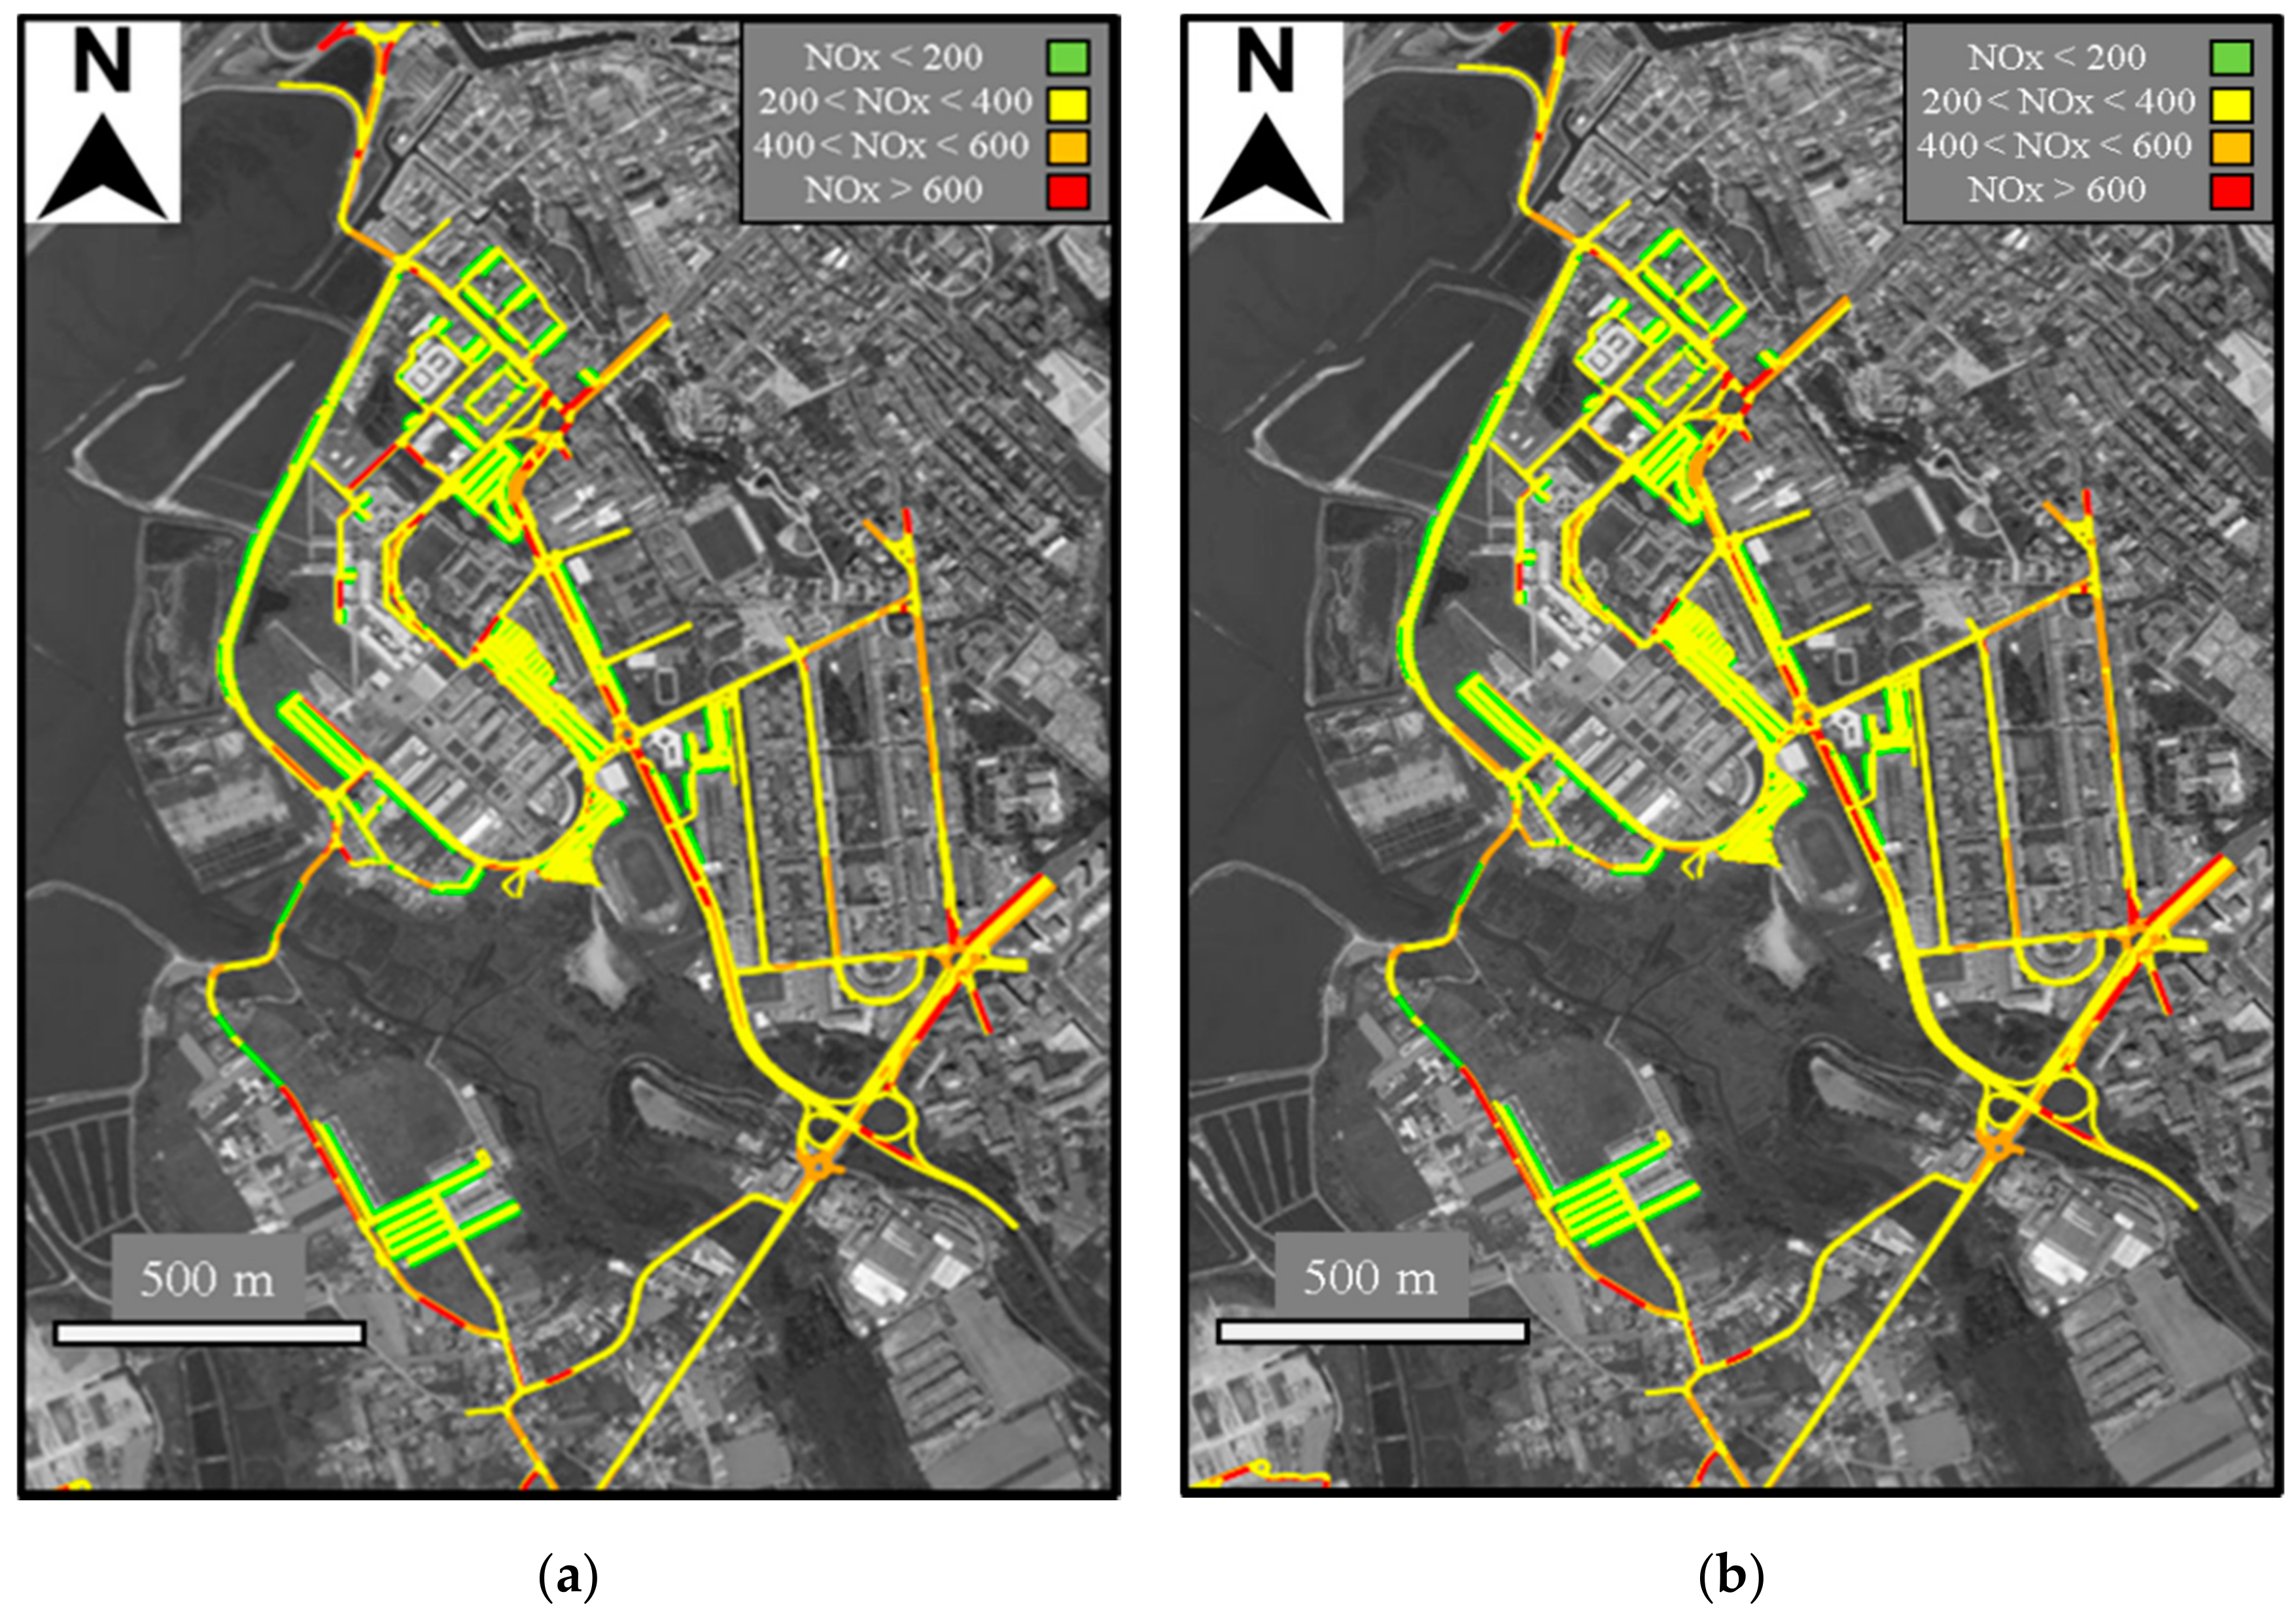
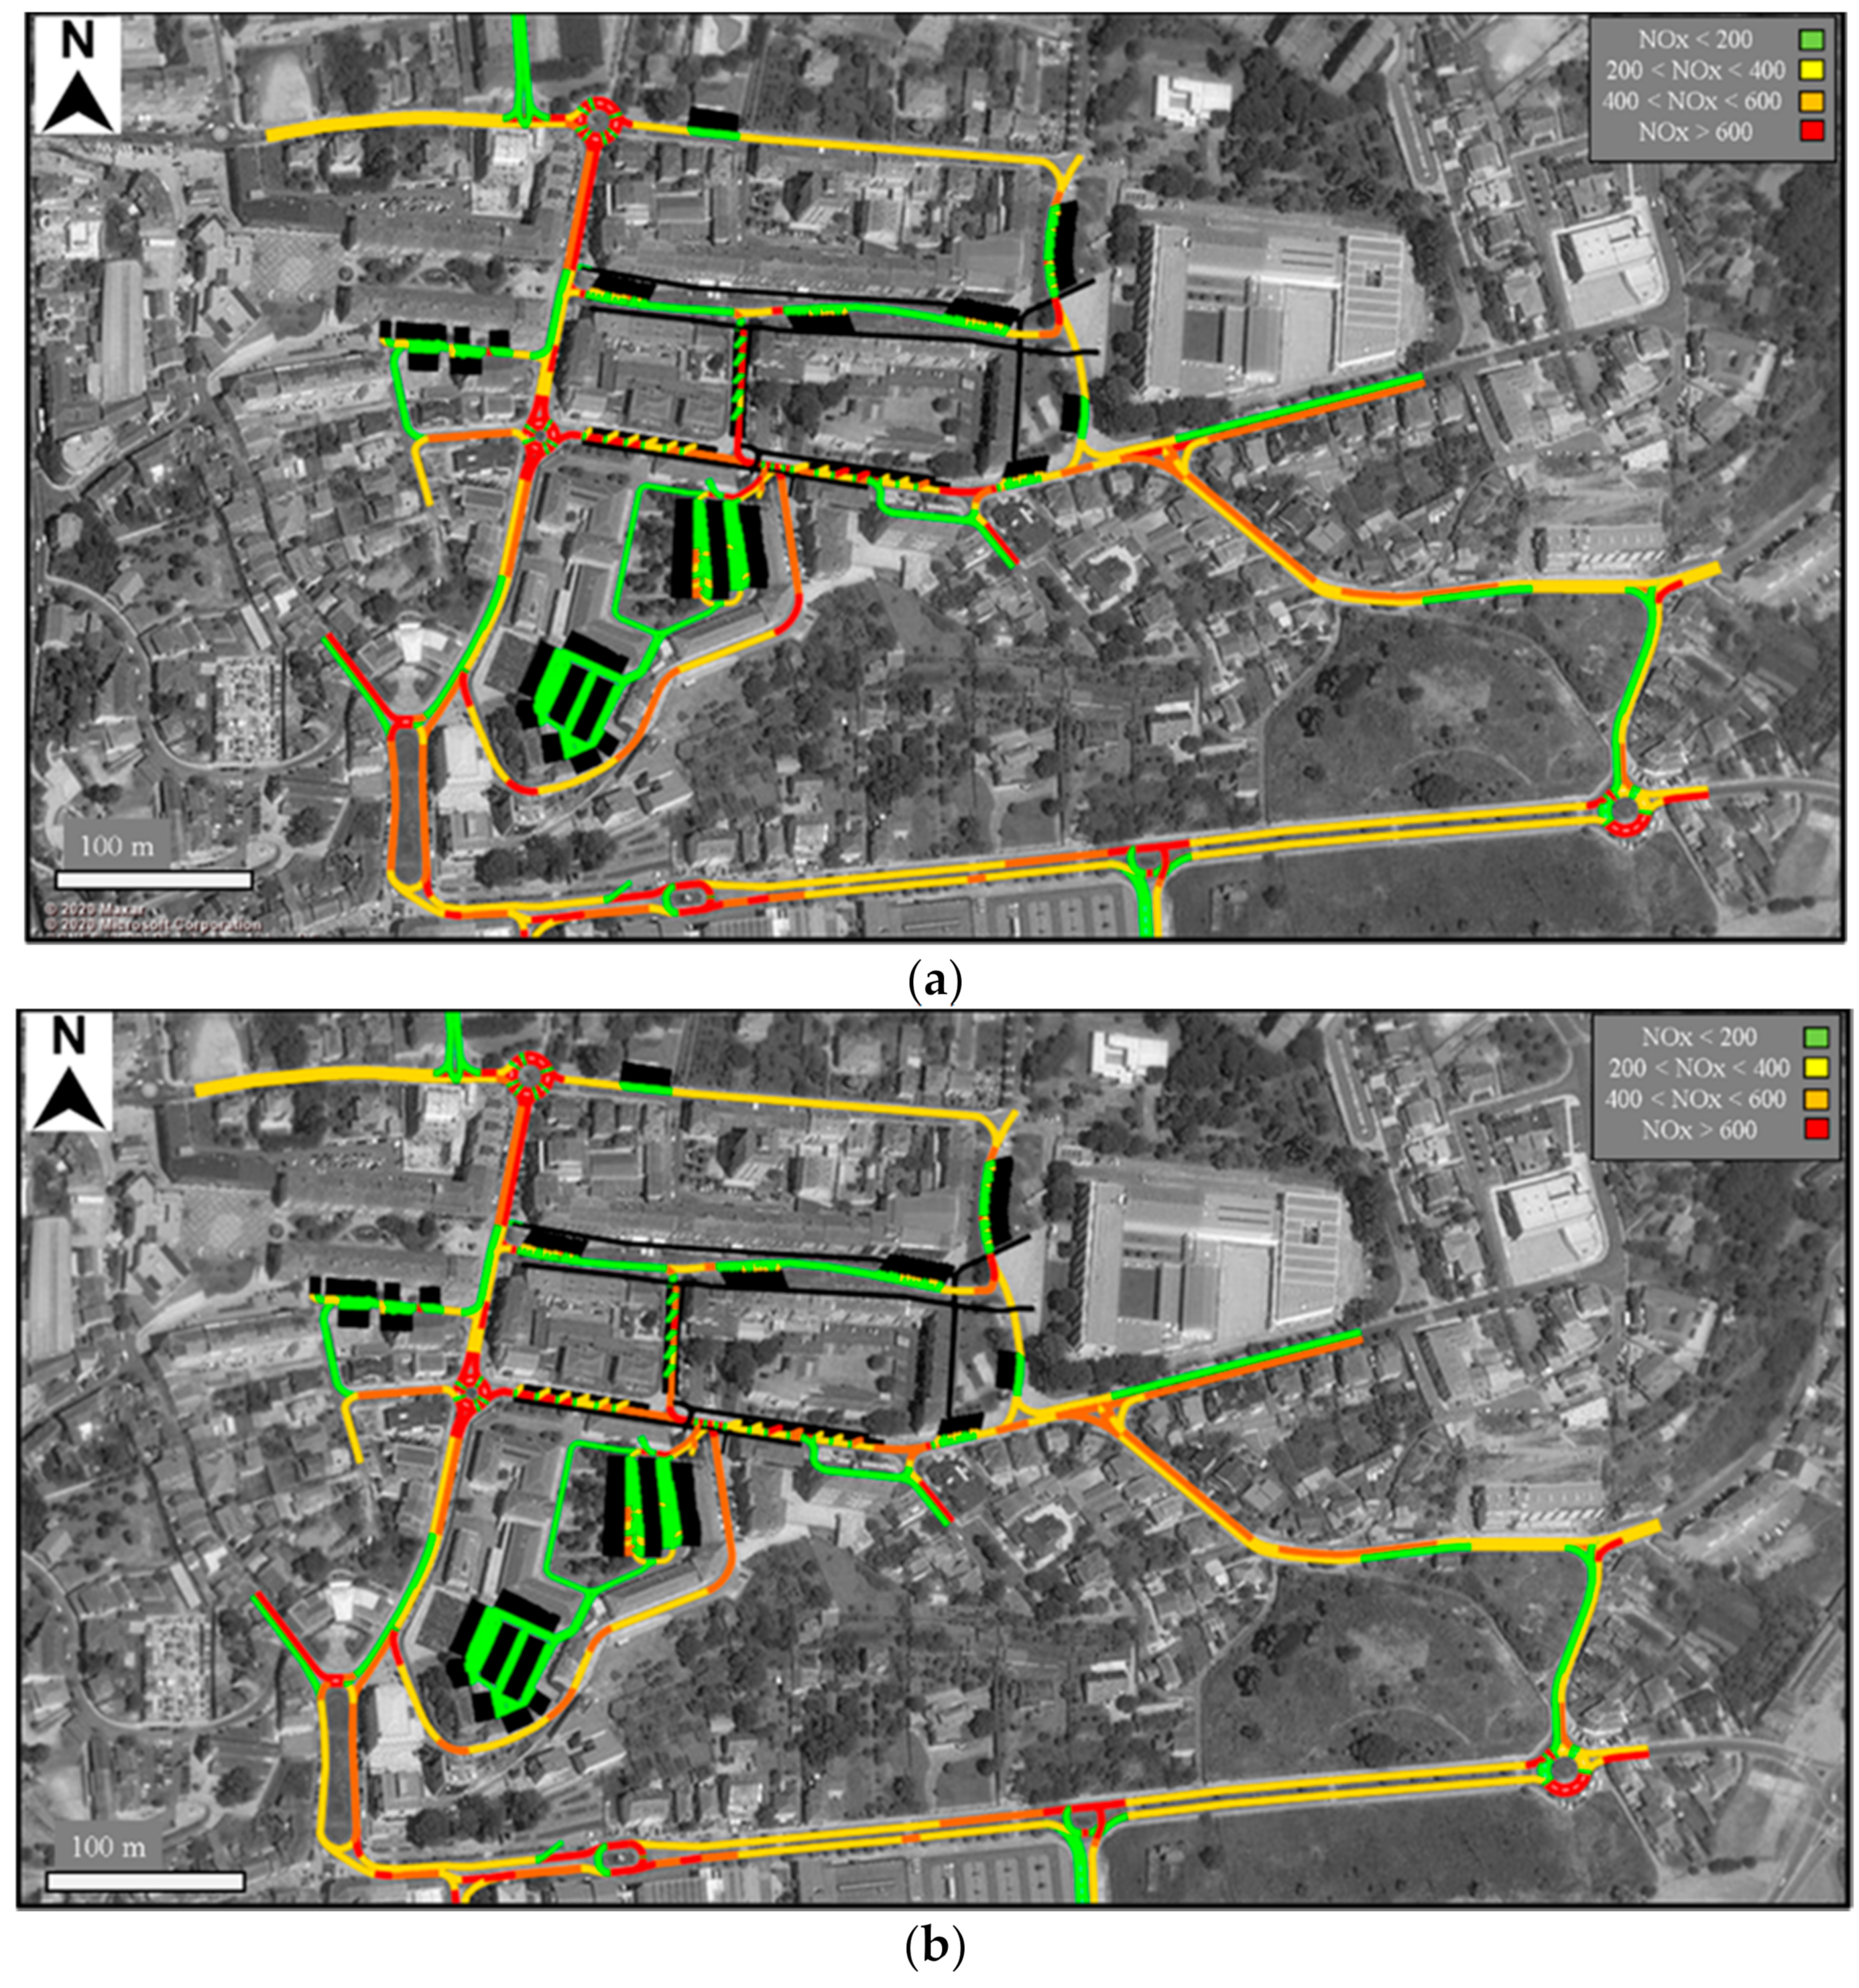
Figure 7a,b depicts the NO
x emissions hotspots of both the baseline and carpooling scenarios in CS. Carpooling achieved lower average NO
x emissions per kilometer (<7%); nevertheless, the carpooling hotspot map is characterized by fewer red road segments.
As would be expected, the most critical road segments regarding pollutant emissions are located near roundabouts, unsignalized and signalized intersections. In the baseline scenario, these road segments accounted for near 20% of CO2 and NOx total network emissions. The carpooling scenario was able to reduce the impact of these road segments on the overall network emissions regarding CO2 (<3%) and NOx (<4%).
3.3.2. Campus ESTGA
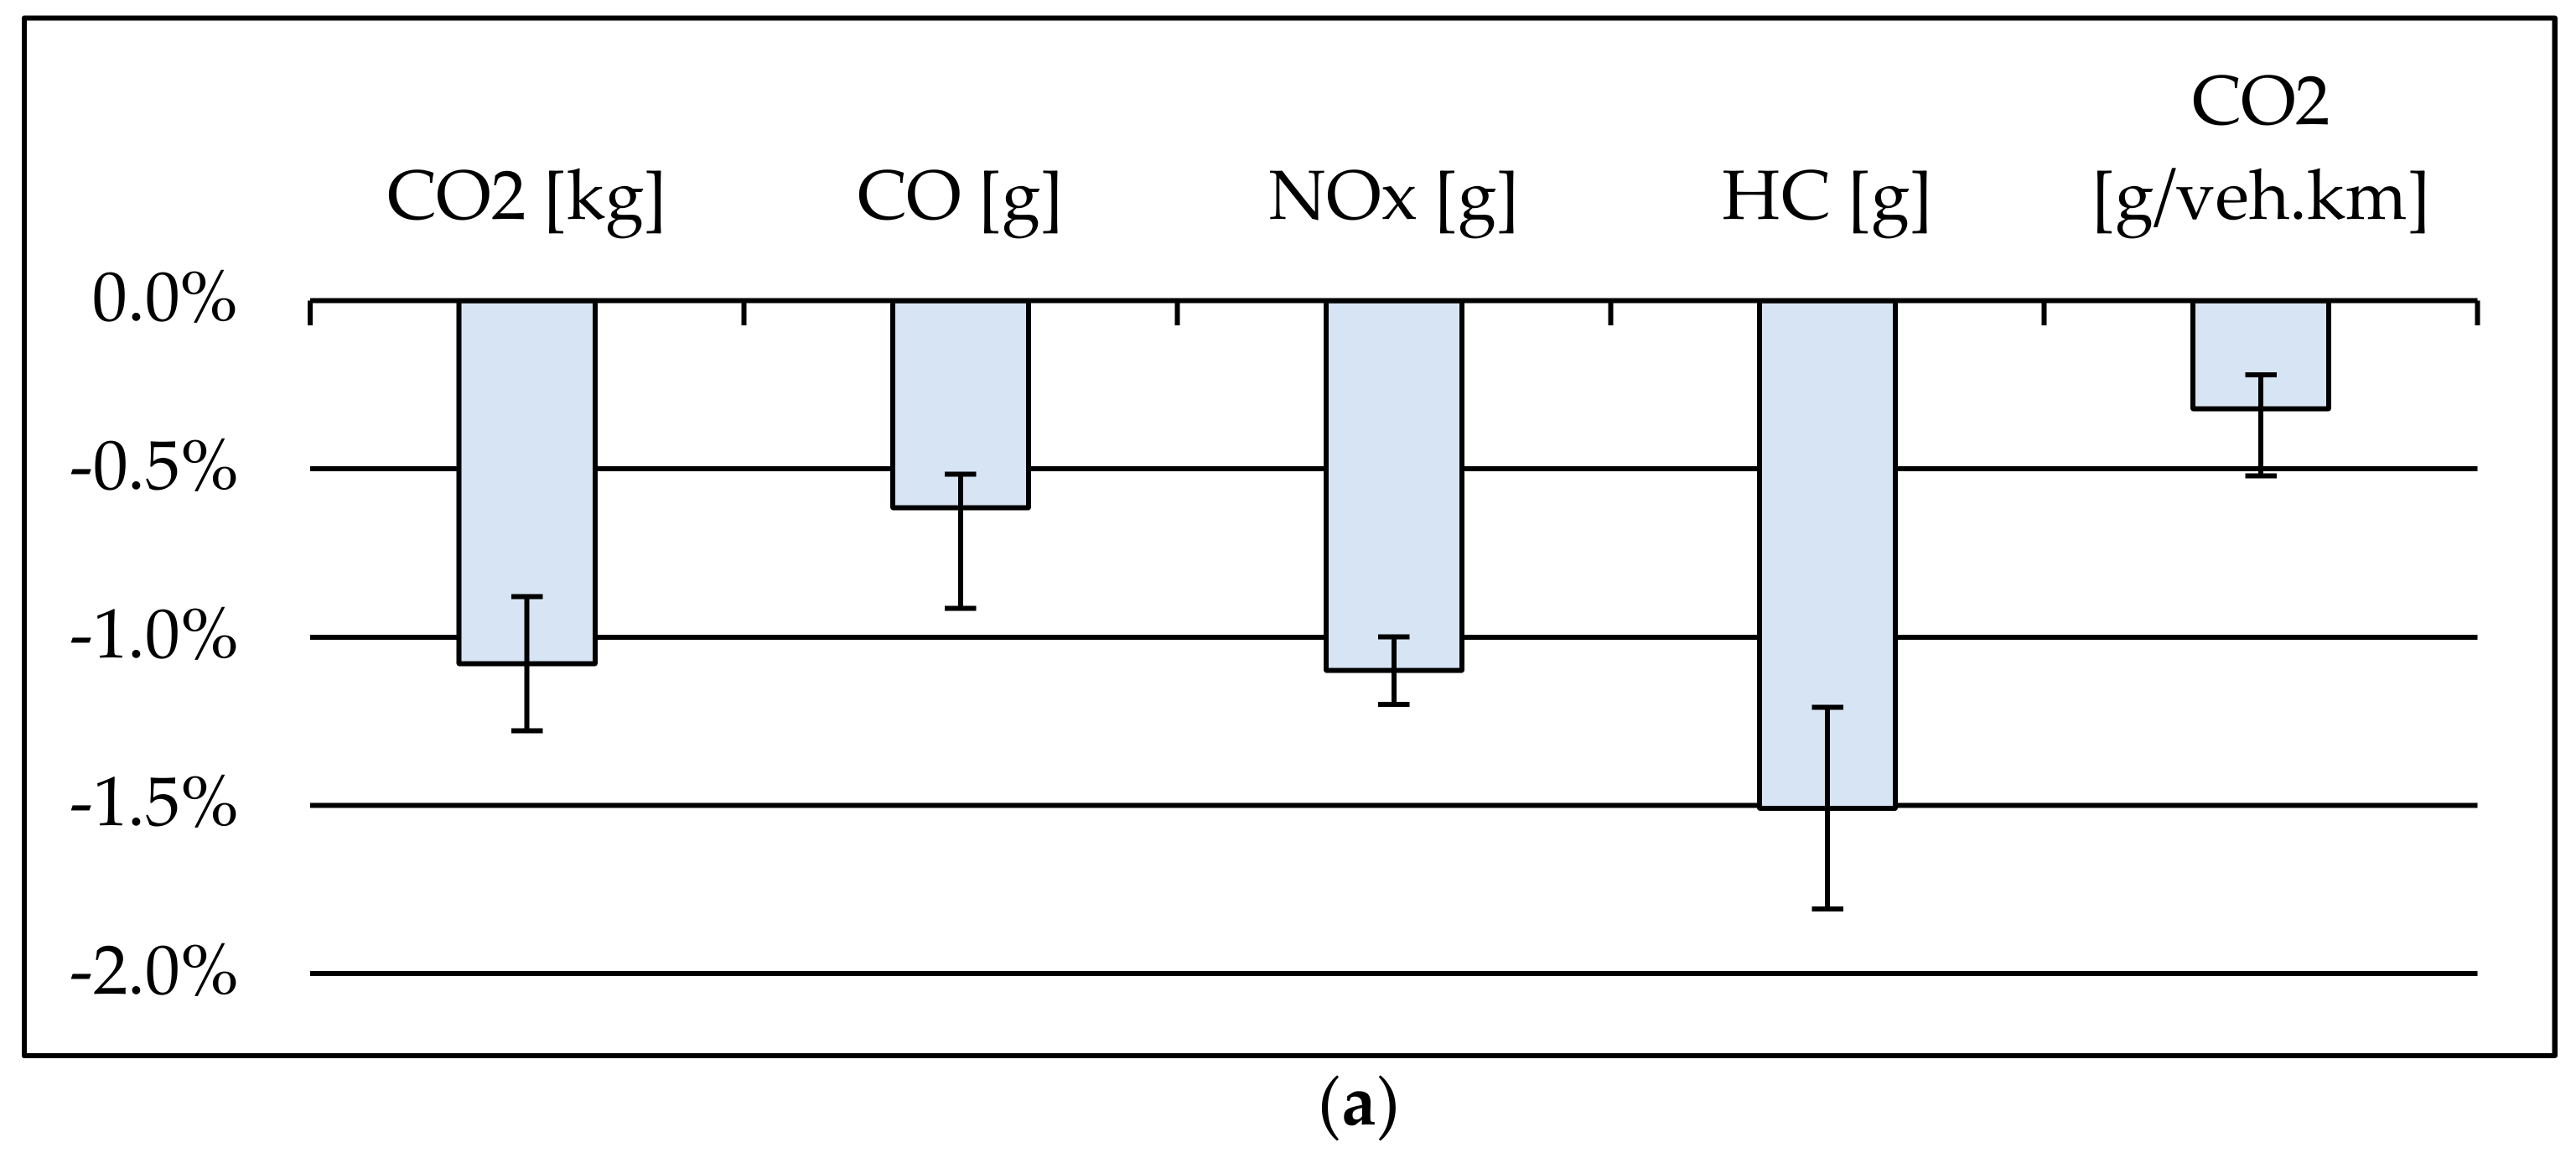
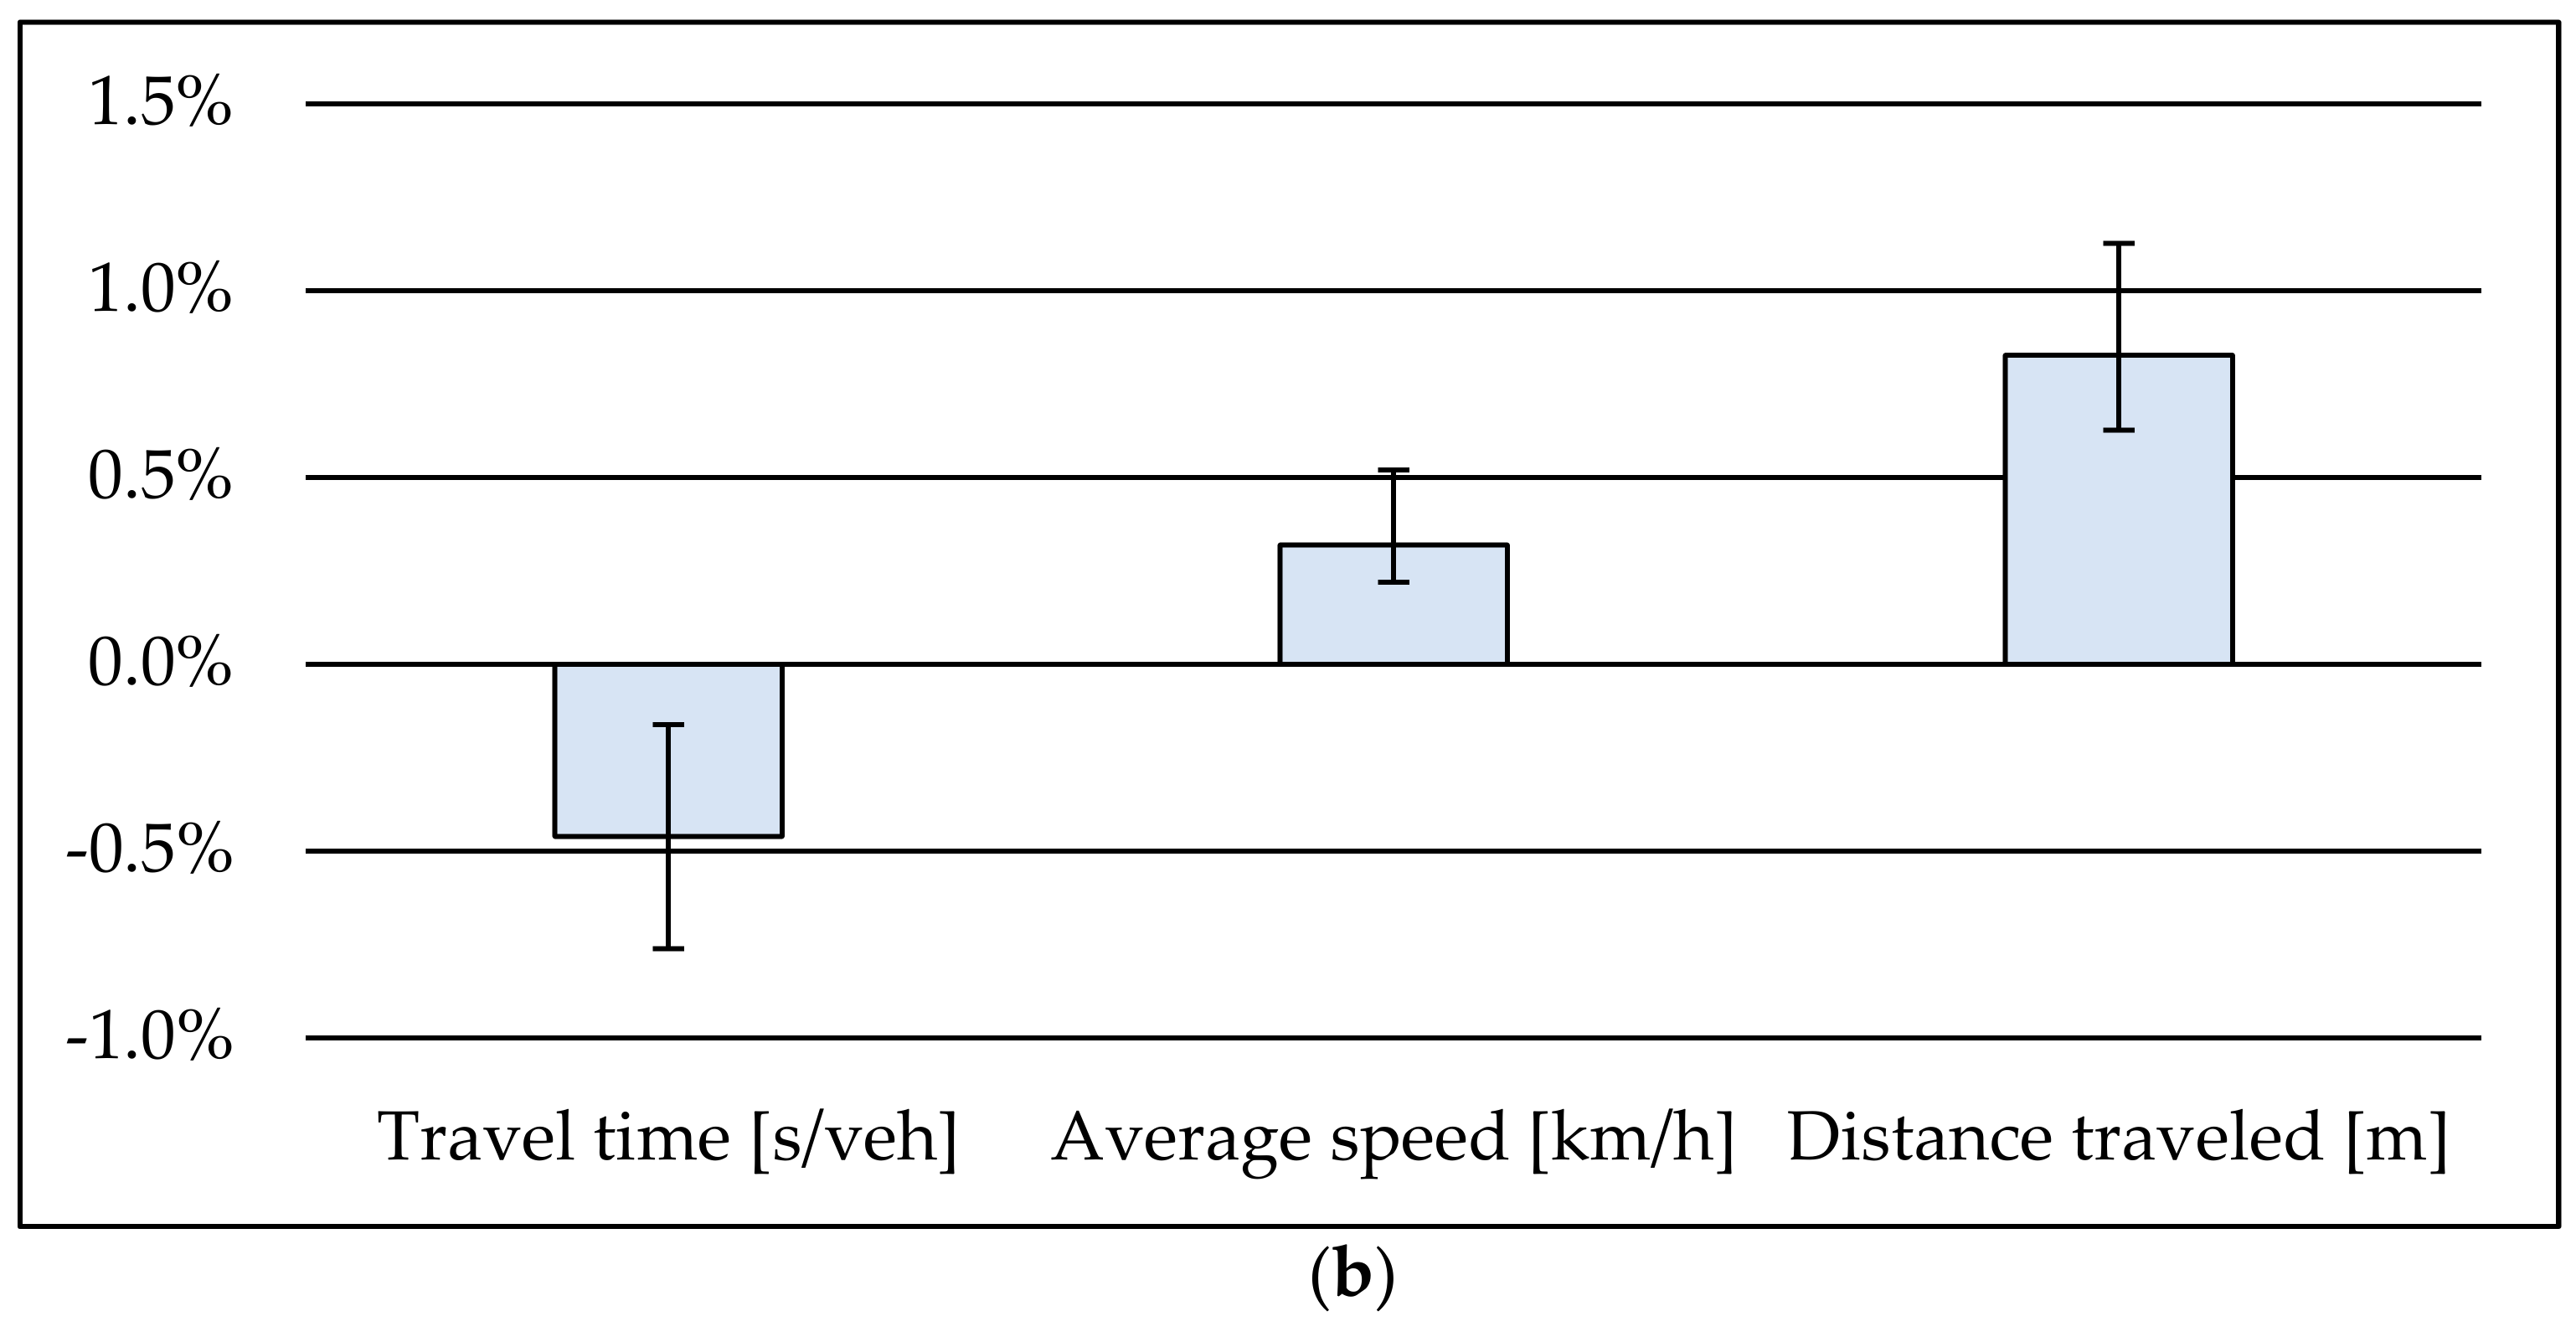
Figure 8a,b presents the percentual variation concerning vehicular pollutants emissions between the carpooling and the baseline scenarios and the percentual variation regarding road traffic performance parameters, comparing the implementation of carpooling with the baseline scenario in ESTGA, respectively.
Results suggest that a positive outcome is to be expected from the implementation of carpooling in the ESTGA campus, that is, reductions in pollutant emissions (−1% of CO2 and NOx) and the improvement of road traffic performance (−0.4% in travel time and 0.4% in average speed). However, during the period of simulation, the carpooling scenario was not able to have a statistically significant impact on the network regarding vehicle exhaust emissions and road traffic performance. This network is characterized by lower traffic volumes, which explains why no significant impacts were obtained; however, considering that the simulation period corresponds to one hour, the results indicate that interesting outcomes can be achieved with the implementation of carpooling in this network.
Figure 9a,b exhibits the CO
2 emissions hotspots of both the baseline and carpooling scenarios in ESTGA. Although impacts were not statistically significant during the simulation period, the carpooling scenario improved the network environmental impacts, more specifically, there were clear improvements at intersections.
Figure 10a,b depicts the NO
x emissions hotspots of both the baseline and carpooling scenarios in ESTGA. CO
2 carpooling also achieved lower average NO
X emissions per kilometer and, although not significant, the hotspot map is characterized by fewer red road segments.
Intersections accommodated the road segments with higher emissions (approximately 13% of total emissions), and the carpooling scenario was able to reduce such impacts by 1% regarding CO2 and NOx.
3.3.3. Campus ESAN
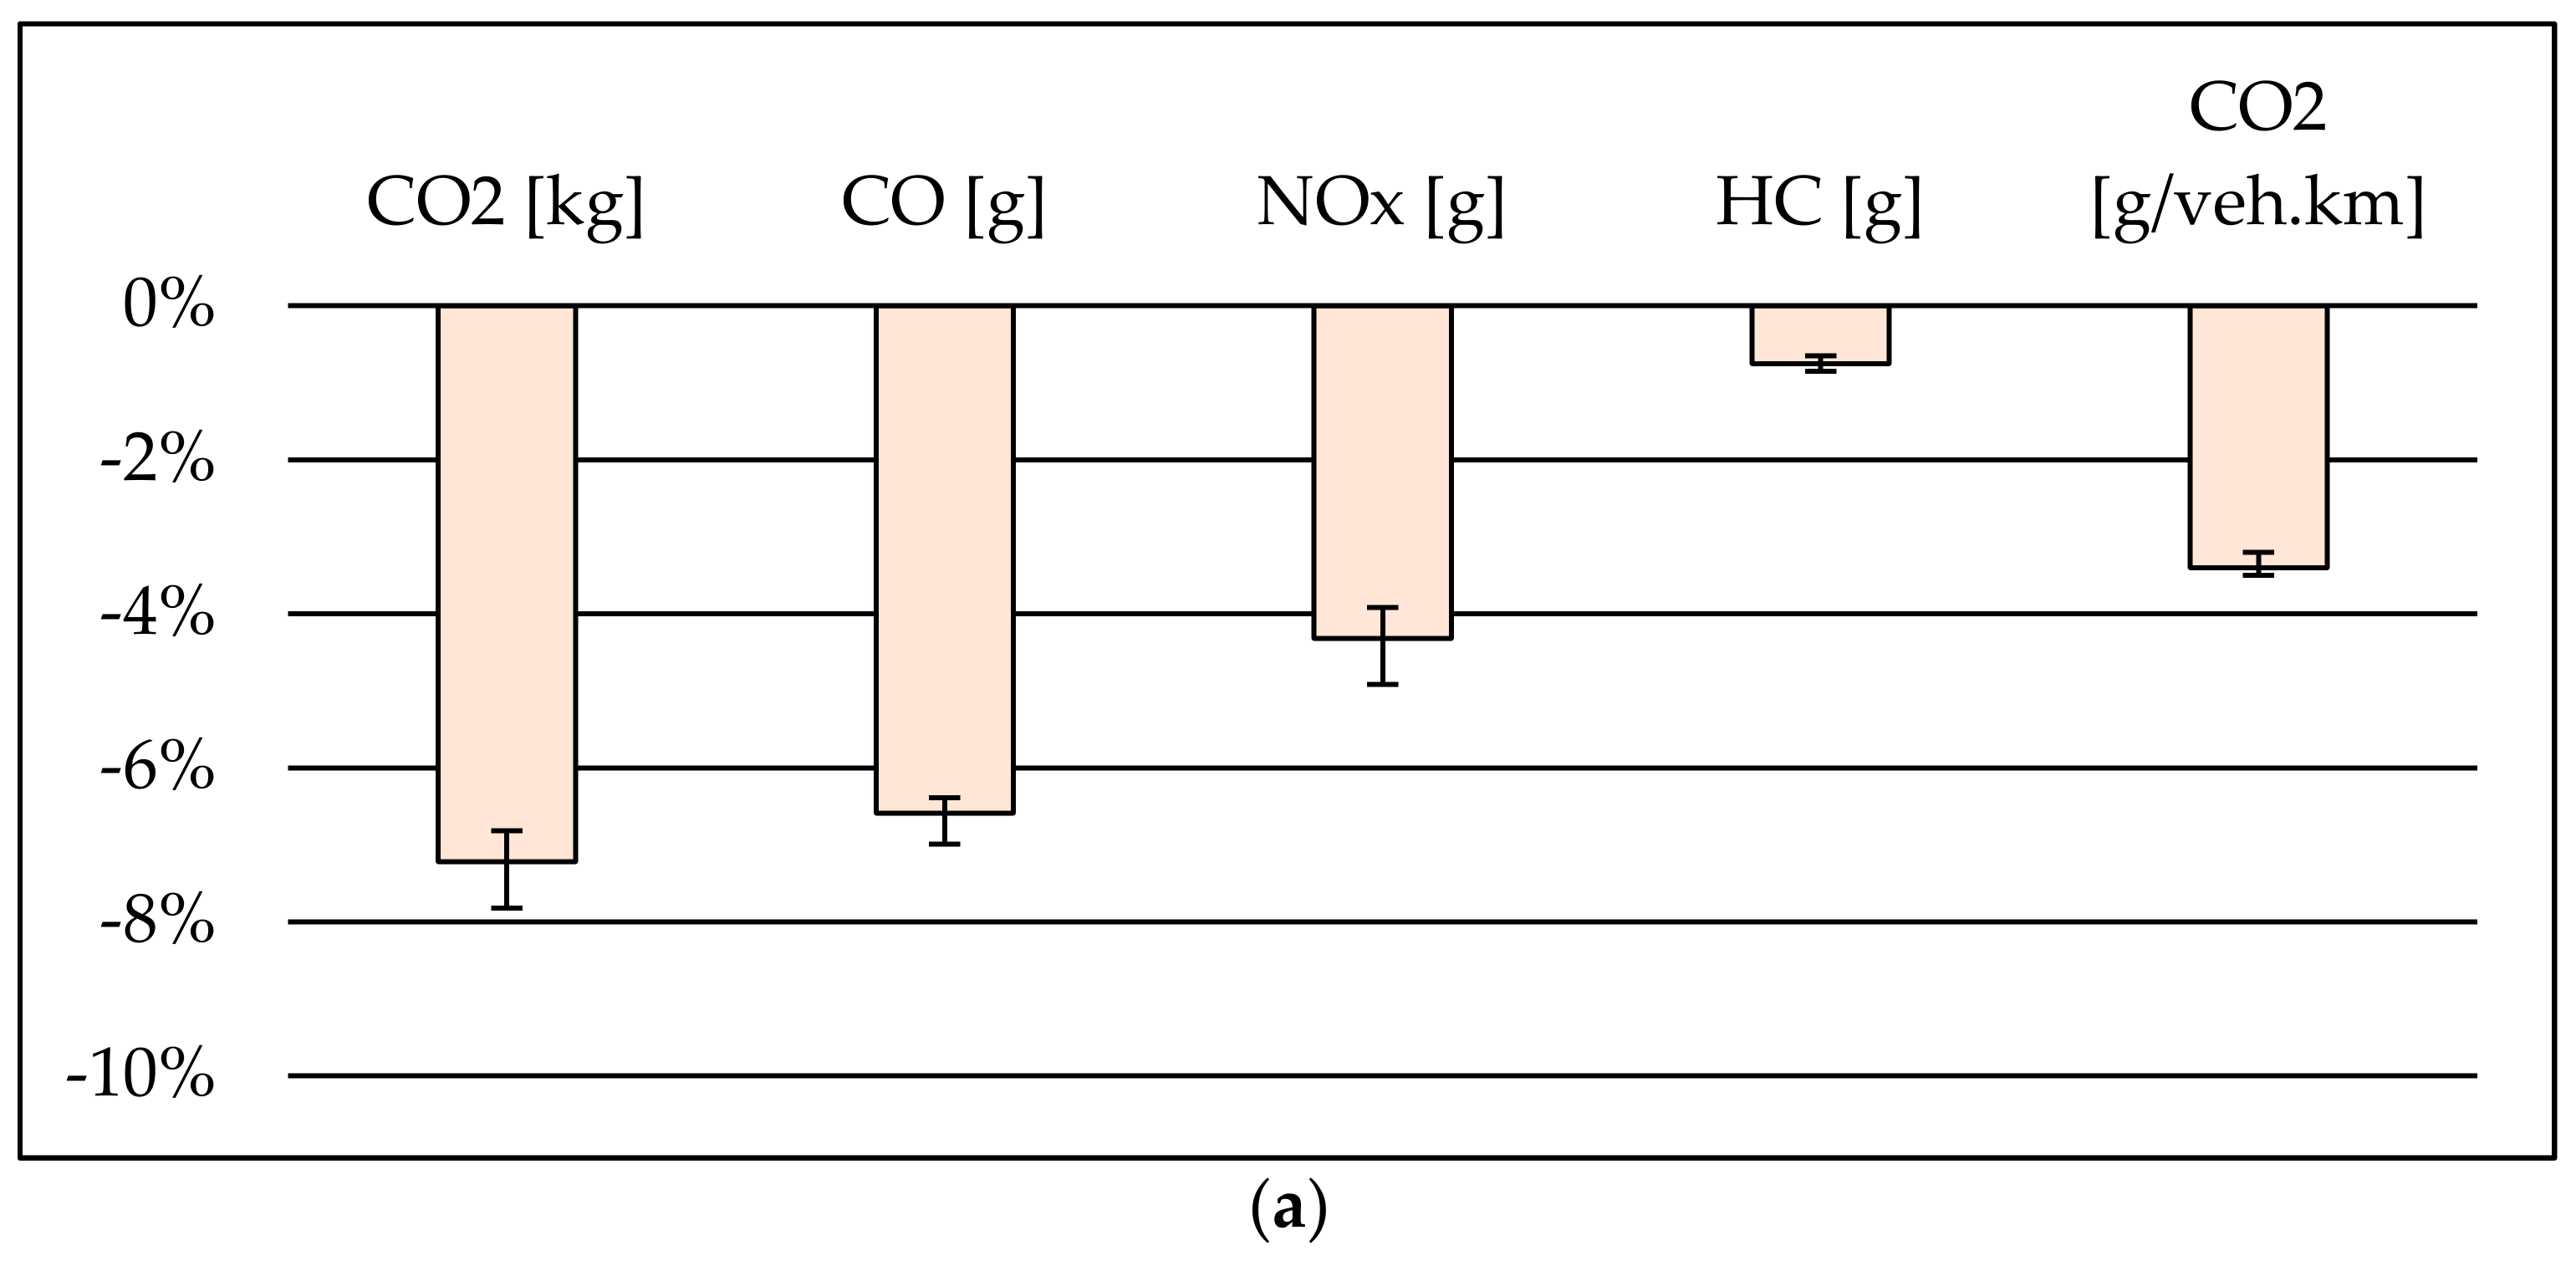
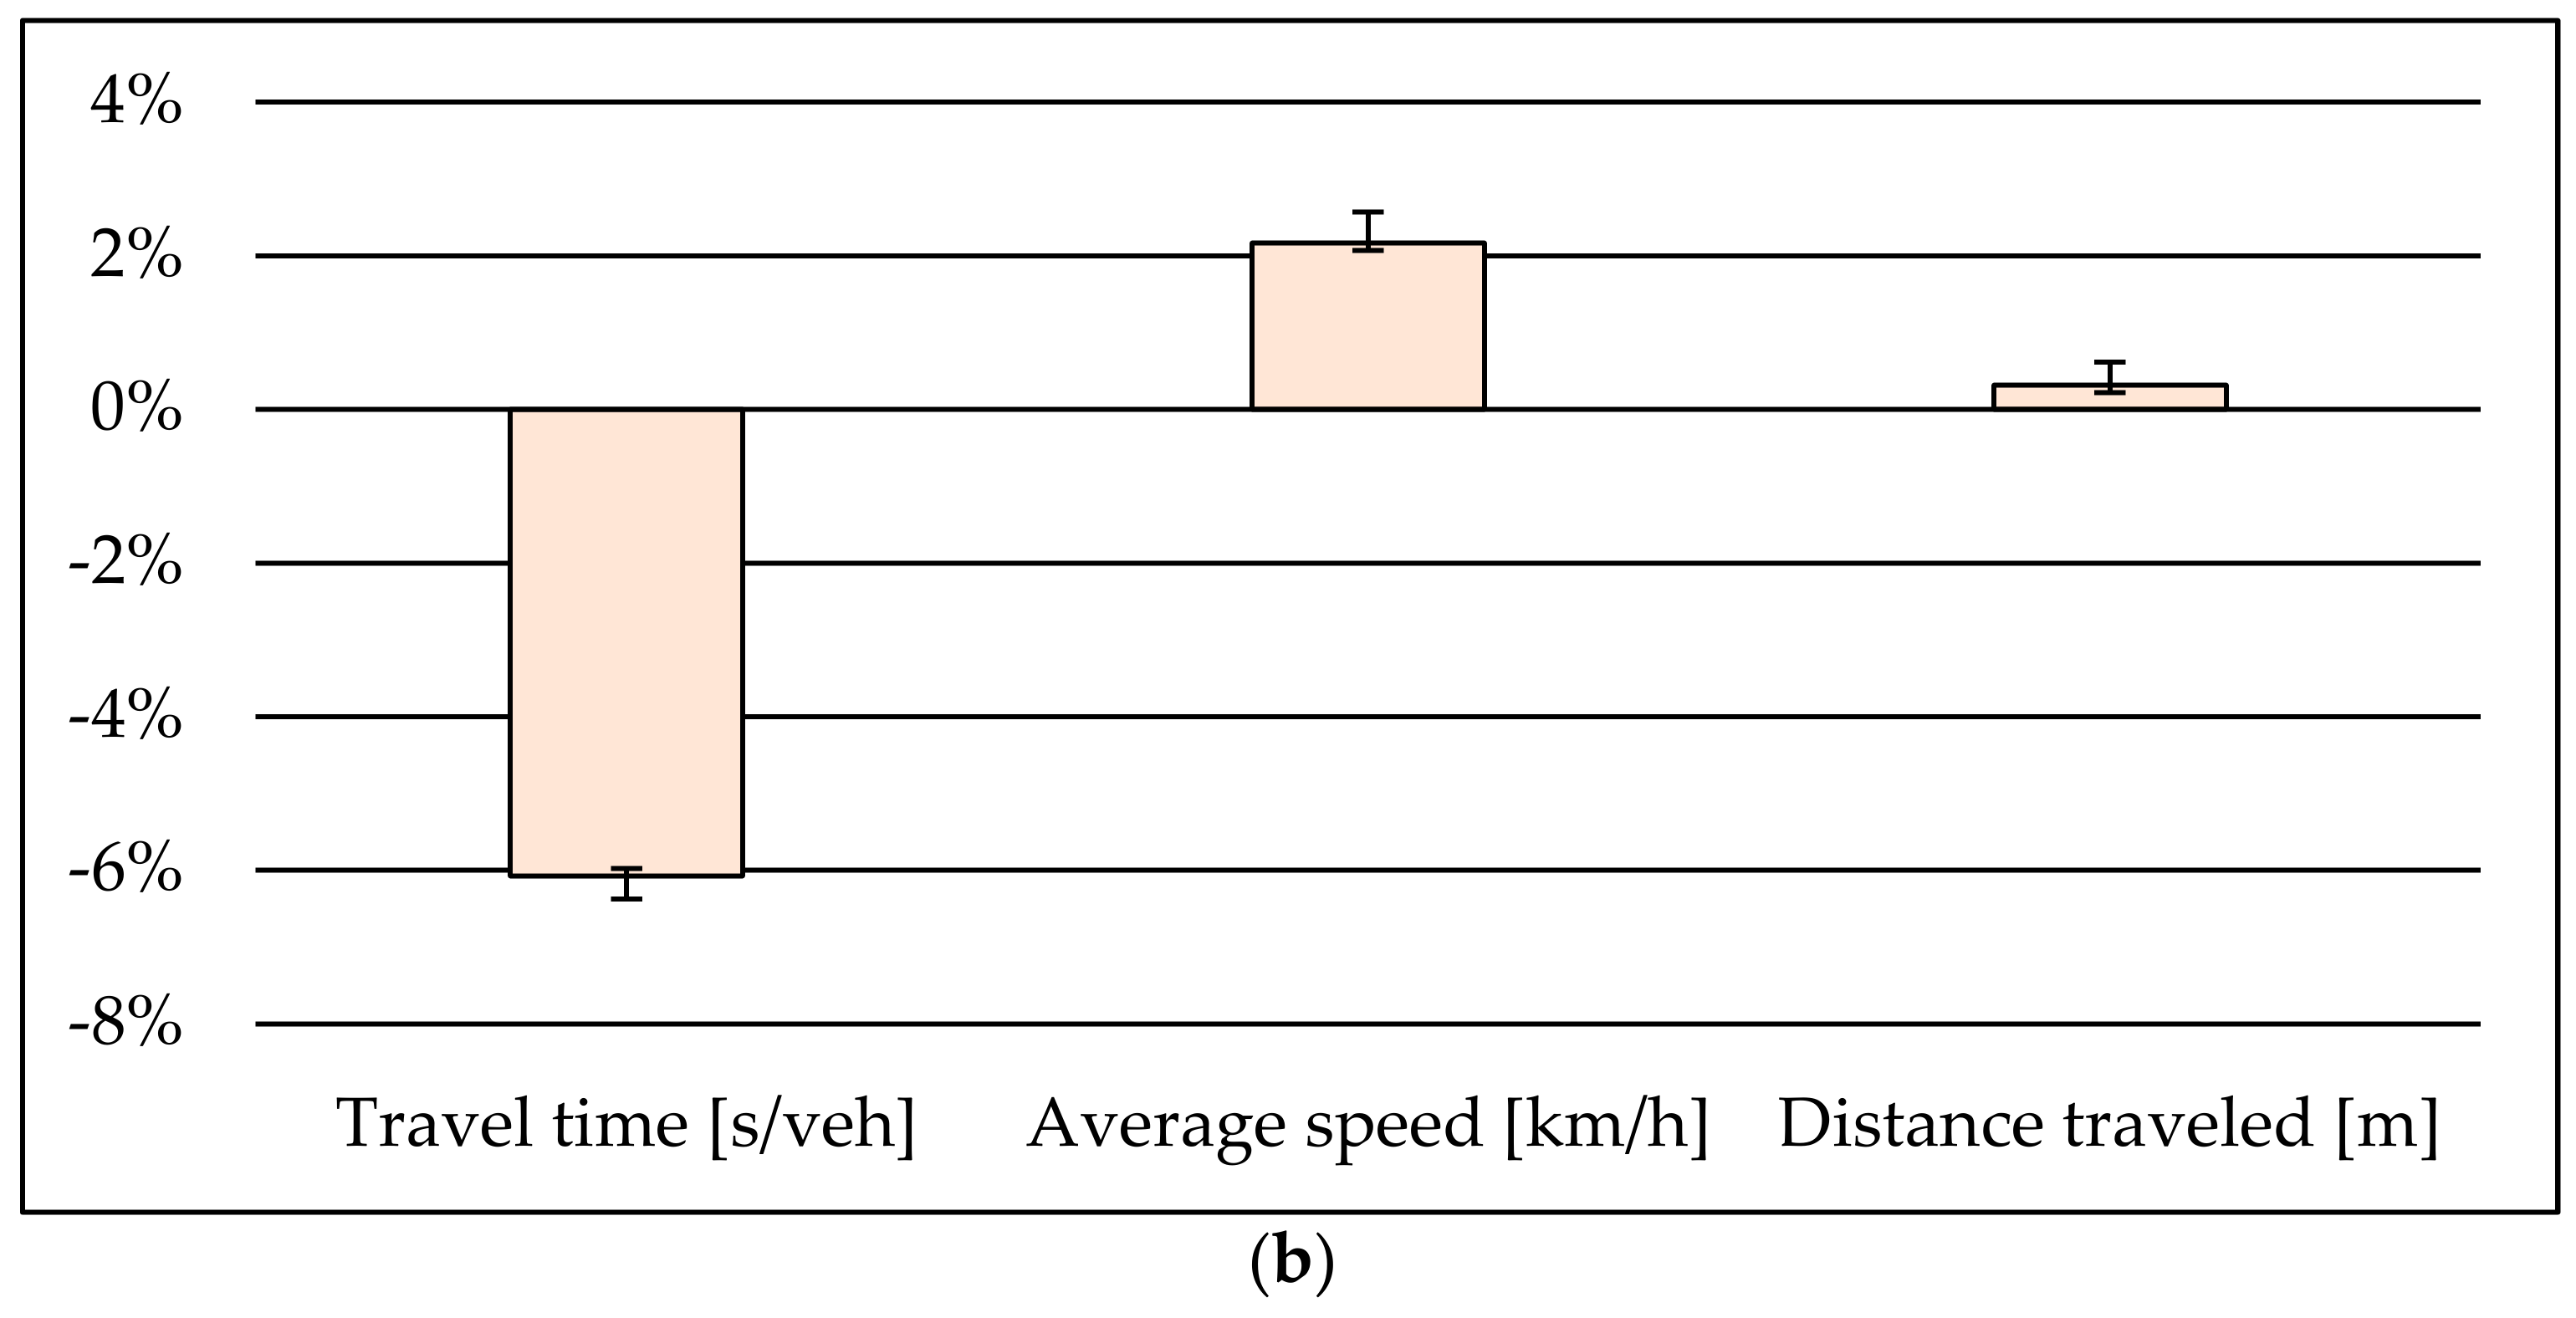
In the ESAN campus, results indicate that reductions in pollutant emissions (−7% and −4% for CO
2 and NO
x, respectively) and the improvement of road traffic performance (−6% in travel time and 2% in average speed) can be achieved by implementing carpooling with up to three people per vehicle in the network, as can be observed in
Figure 11a,b.
These results derive from the fact that the rural road, which provides access to the campus entrance, is characterized by permanent free flow conditions, and by promoting carpooling there are fewer vehicles entering the campus, resulting in fewer vehicles driving at lower speeds (vehicles that would enter the campus inside area), which increases the average speed and decreases the travel time. Moreover, the mentioned rural road was found to account for 70% and 40% of the CO2 and NOx total network emissions. The carpooling scenario was able to reduce the impacts of CO2 and NOx emissions on this road by around 4% since fewer vehicles need to cross it to enter the campus.
It can be noted that HC was the pollutant with lower variation from the baseline to the carpooling scenario, while in the ESTGA network CO was the pollutant with lower variation. For this research, the assumed fleet composition was based on the Portuguese vehicle fleet which, for these networks, translates to 51% of all light duty vehicles being fueled by diesel and the remaining 49% by gasoline, and all light commercial vehicles are fueled by diesel.
Diesel vehicles usually present lower emissions of CO and, in the case of ESTGA, the vehicle count developed during the field campaigns resulted in the simulation model presenting 54% of the vehicles being powered by diesel engines. Furthermore, CO emissions were generally very low across the network in the baseline scenario since speeds are generally low (20 to 50 km/h) and at these speeds CO tends to be emitted more or less at the same level but with a small rise as speed increases (at this speed range) since CO emissions usually result from engines operating under rich mixture and/or incomplete fuel combustion [
34]. With the reduction of circulating vehicles in the carpooling scenario, the emissions of CO did not present a significant reduction since the emissions were very low across the network and the small decrease in its emission from the reduction of total vehicles in the network was somewhat contradicted by the increase of the average speed in the network.
Regarding the ESAN campus, since this network is characterized by very low road traffic congestion, the two existing transit buses, which are the main vehicle type emitting HC (96% of total HC network emissions) in both the baseline and carpooling scenarios, suffer no change regarding their trip which results in a lower variation of HC. Furthermore, since light duty passenger and commercial vehicles travel with practically no stops along their route, the emissions of NO
x in the carpooling scenario suffer a lower variation compared to CO
2 and CO because vehicles are almost always travelling at cruise speed and so the occurrence of significant accelerations is very low. CO emissions present a higher variation between scenarios compared to the ESTGA network because in the ESAN network speeds are generally higher (~90 km/h) and for this speed range CO emissions are considerably higher [
34,
35]. At this speed range, CO emissions actually follow a declining trend as speed rises which helps, together with the small decrease in the number of circulating vehicles, to explain the variation in its emissions from the baseline to the carpooling scenario [
34,
35].
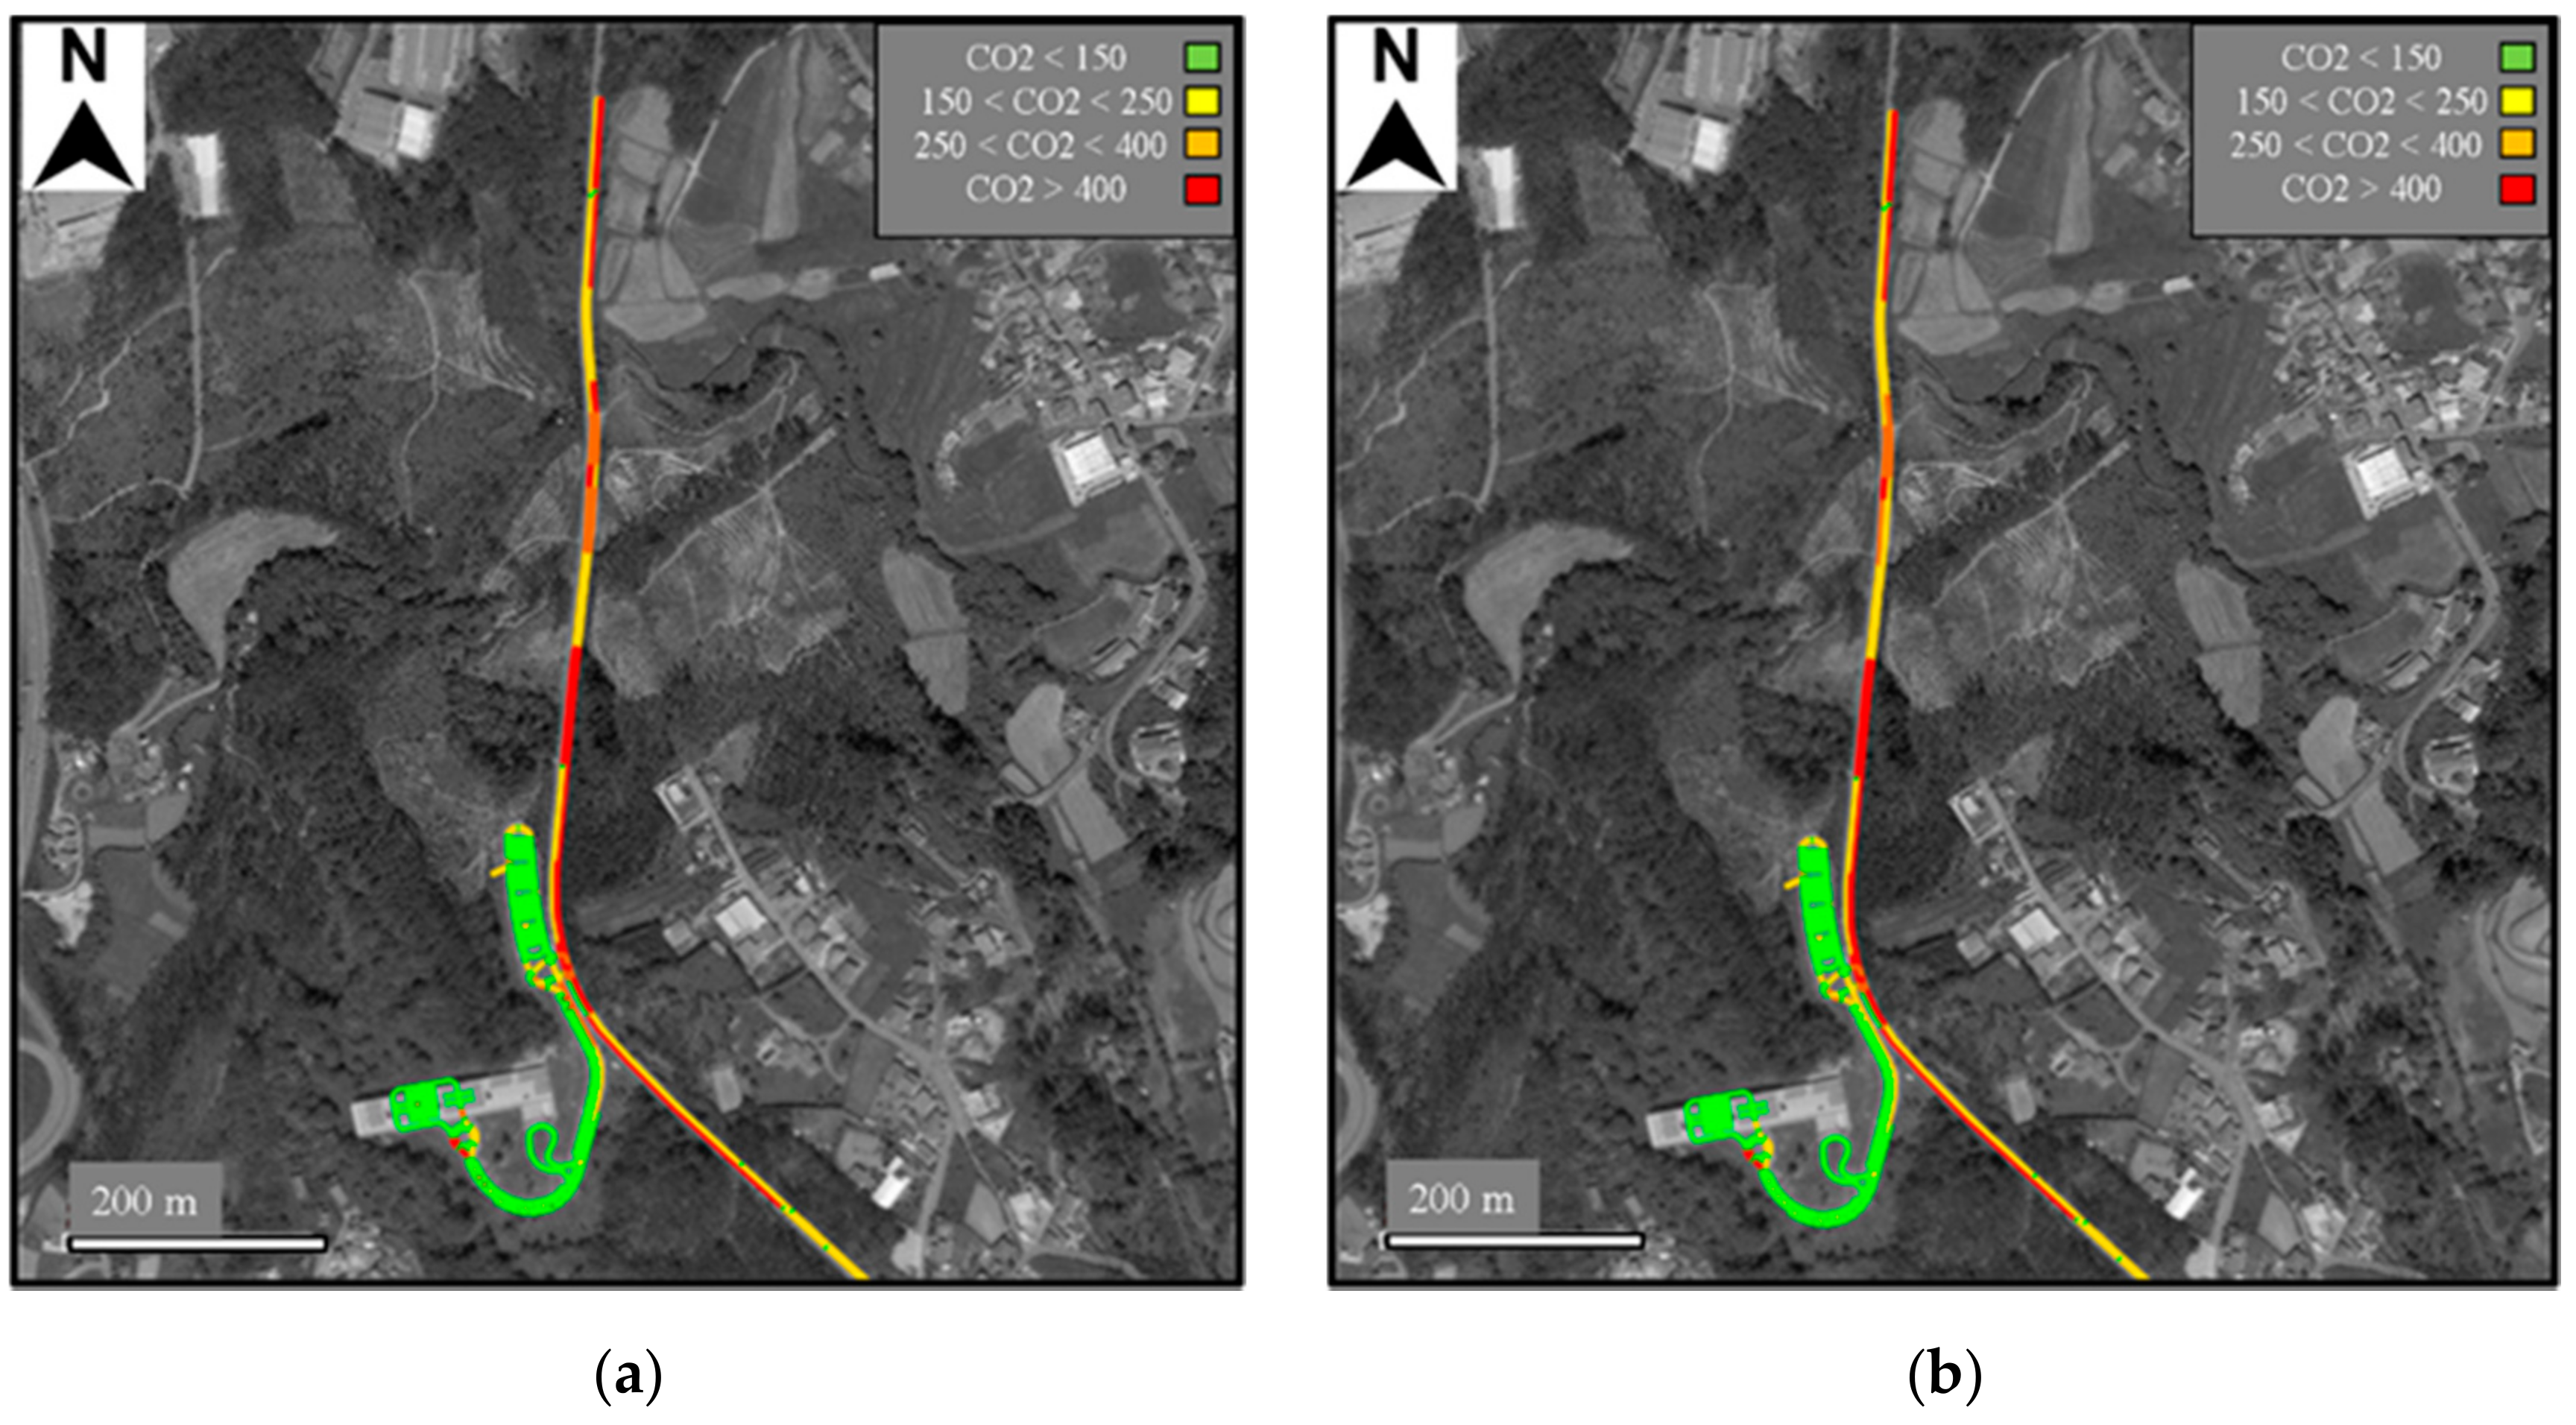
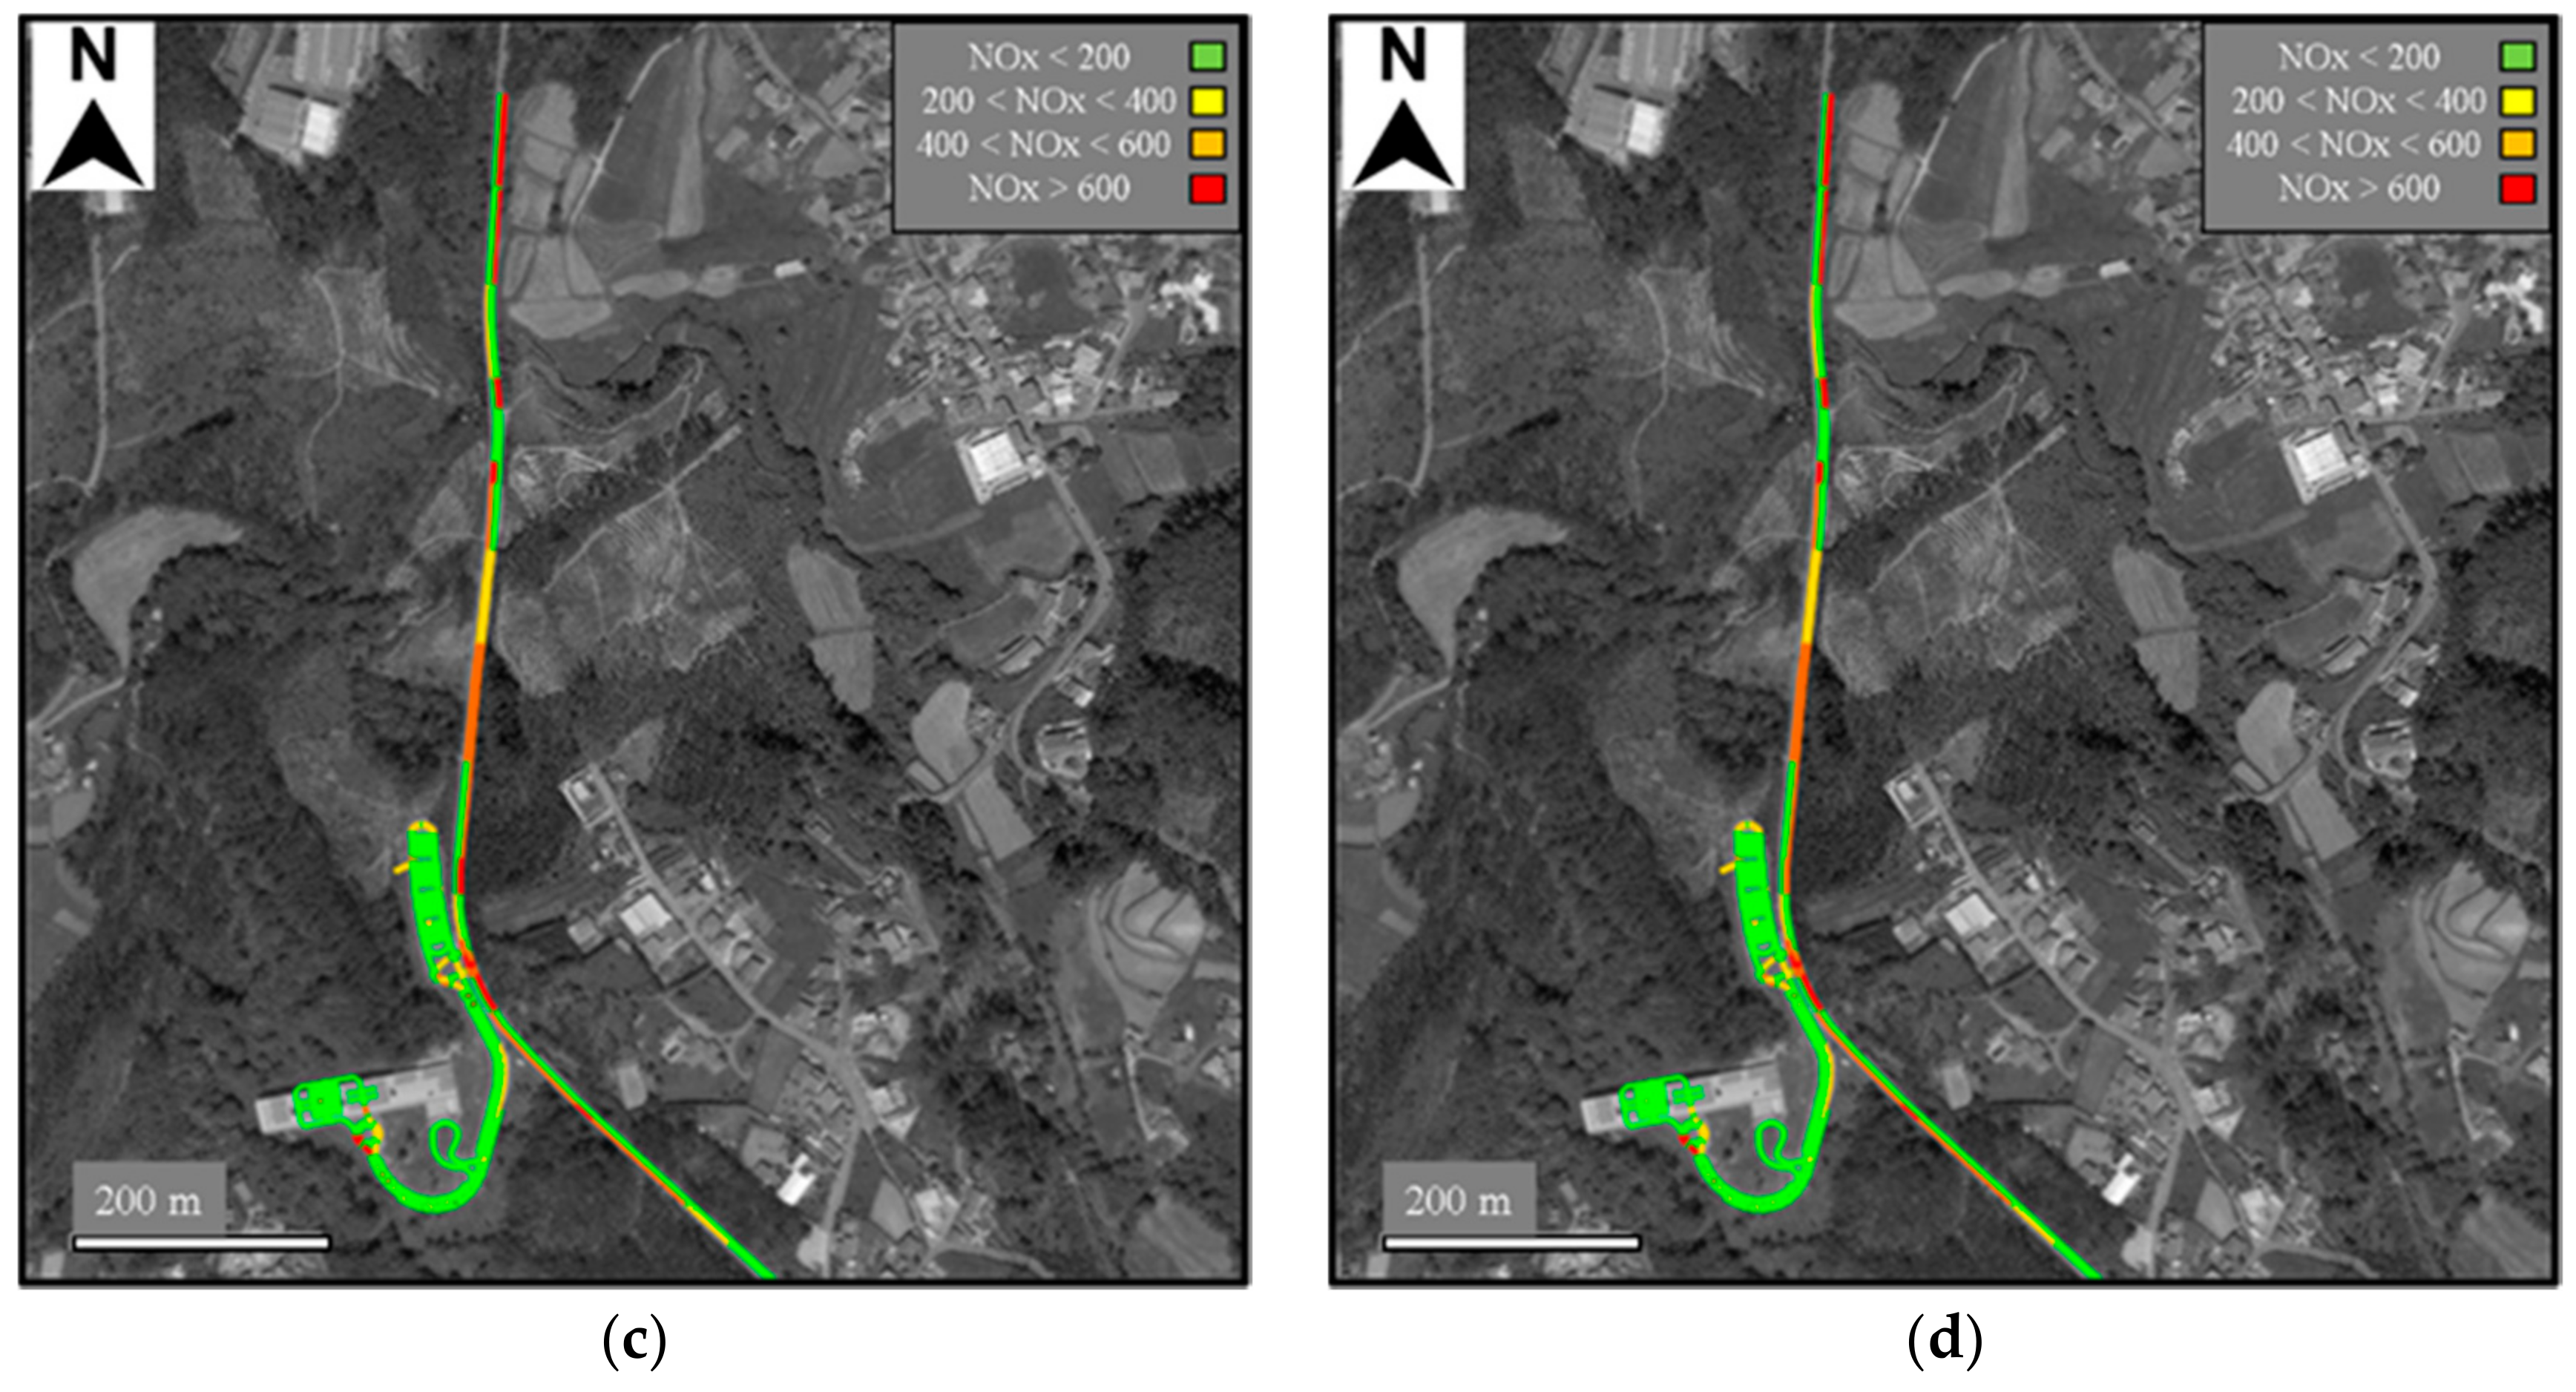
Figure 12a–d exhibits the CO
2 and NO
x emissions hotspots of both the baseline and carpooling scenarios in ESAN. Although carpooling did not have a statistically significant impact during the simulation period, improvements were found across the network. For example, the campus access rural road experienced improvements in some segments which reduced its impacts on the network pollutants emissions as mentioned previously.
4. Conclusions and Policy Recommendations
University campuses are similar to small cities and serve as perfect case studies for assessing sustainability measures to be implemented and have the execution details retouched to improve the adoption procedure for greater case studies. Currently, in a world living under pandemic conditions, the transportation sector needs to adapt to these circumstances and provide solutions that both give health safety and reliability while commuting without compromising the principle of sustainability. From this perspective, the developed research assessed the impacts on pollutant emissions and road traffic performance of implementing a carpooling platform under the pandemic safety norms, that is, considering some actions that university campuses should take to successfully provide a mobility system for the academic community to commute safely and improve their network sustainability at the same time.
Findings from the present research demonstrate that promoting the use of carpooling in university campuses (as well as in similarly organized institutions), while under public health threats, as an immediate transport strategy can provide a suitable and safe way to commute while helping the networks to become more sustainable. The promotion of carpooling achieved positive outcomes regarding vehicle pollutant emissions and road traffic performance. Furthermore, these positive results were observed in three different campuses with different network dimensions and road traffic volumes.
Public health threats can impact the use of public transportation which in turn increases the use of private vehicles and worsens transportation related externalities regarding traffic congestion, greenhouse gas and human health (NOx). Therefore, carpooling can be a promising solution to minimize the impacts of such externalities.
Strategies to implement carpooling under public health threats should contemplate the following points: (1) to set vehicle occupation limits for carpoolers (max. three people per vehicle, including driver); (2) vehicle occupants have to ensure that the distance to other occupants is maintained, use mouth and nose covering, hand disinfection and keep good vehicle ventilation; (3) vehicles need to follow a set of rules of regular washing and disinfection for the safety of all occupants; and (4) carpoolers have access to carpooling dedicated parking spaces. The implementation of carpooling under this set of constraints and propositions as an immediate transportation strategy can improve university campus networks’ overall traffic performance and reduce the associated environmental impacts.
The results from the present research evaluating the implementation of carpooling under pandemic circumstances were promising, however, the analysis of how carpooling parking spaces could be attributed was not considered, nor was the risk of some members pretending to be carpoolers to get a free parking space. Additionally, the present research was developed considering the COVID-19 pandemic circumstances, more specifically, the known COVID-19 variants up to March 2021 and, with that in mind, similar strategies may need improvements if developed under pandemics related to diseases with higher infection rates.
Future work will address the network and campus impacts regarding road safety and noise emissions. Furthermore, a wider analysis of traffic performance parameters should be considered, different percentages of vehicle AOR should be tested, and questionnaires can help to better understand how the networks evolved during the pandemic and how to better implement this type of strategy.
