
HoReCa Food Waste and Sustainable Development Goals—A Systemic View


Abstract
1. Introduction
- To develop a conceptual causal loop diagram for food waste in the HoReCa sector;
- To develop a conceptual causal loop diagram for SDGs’ support from HoReCa best practices on food waste.
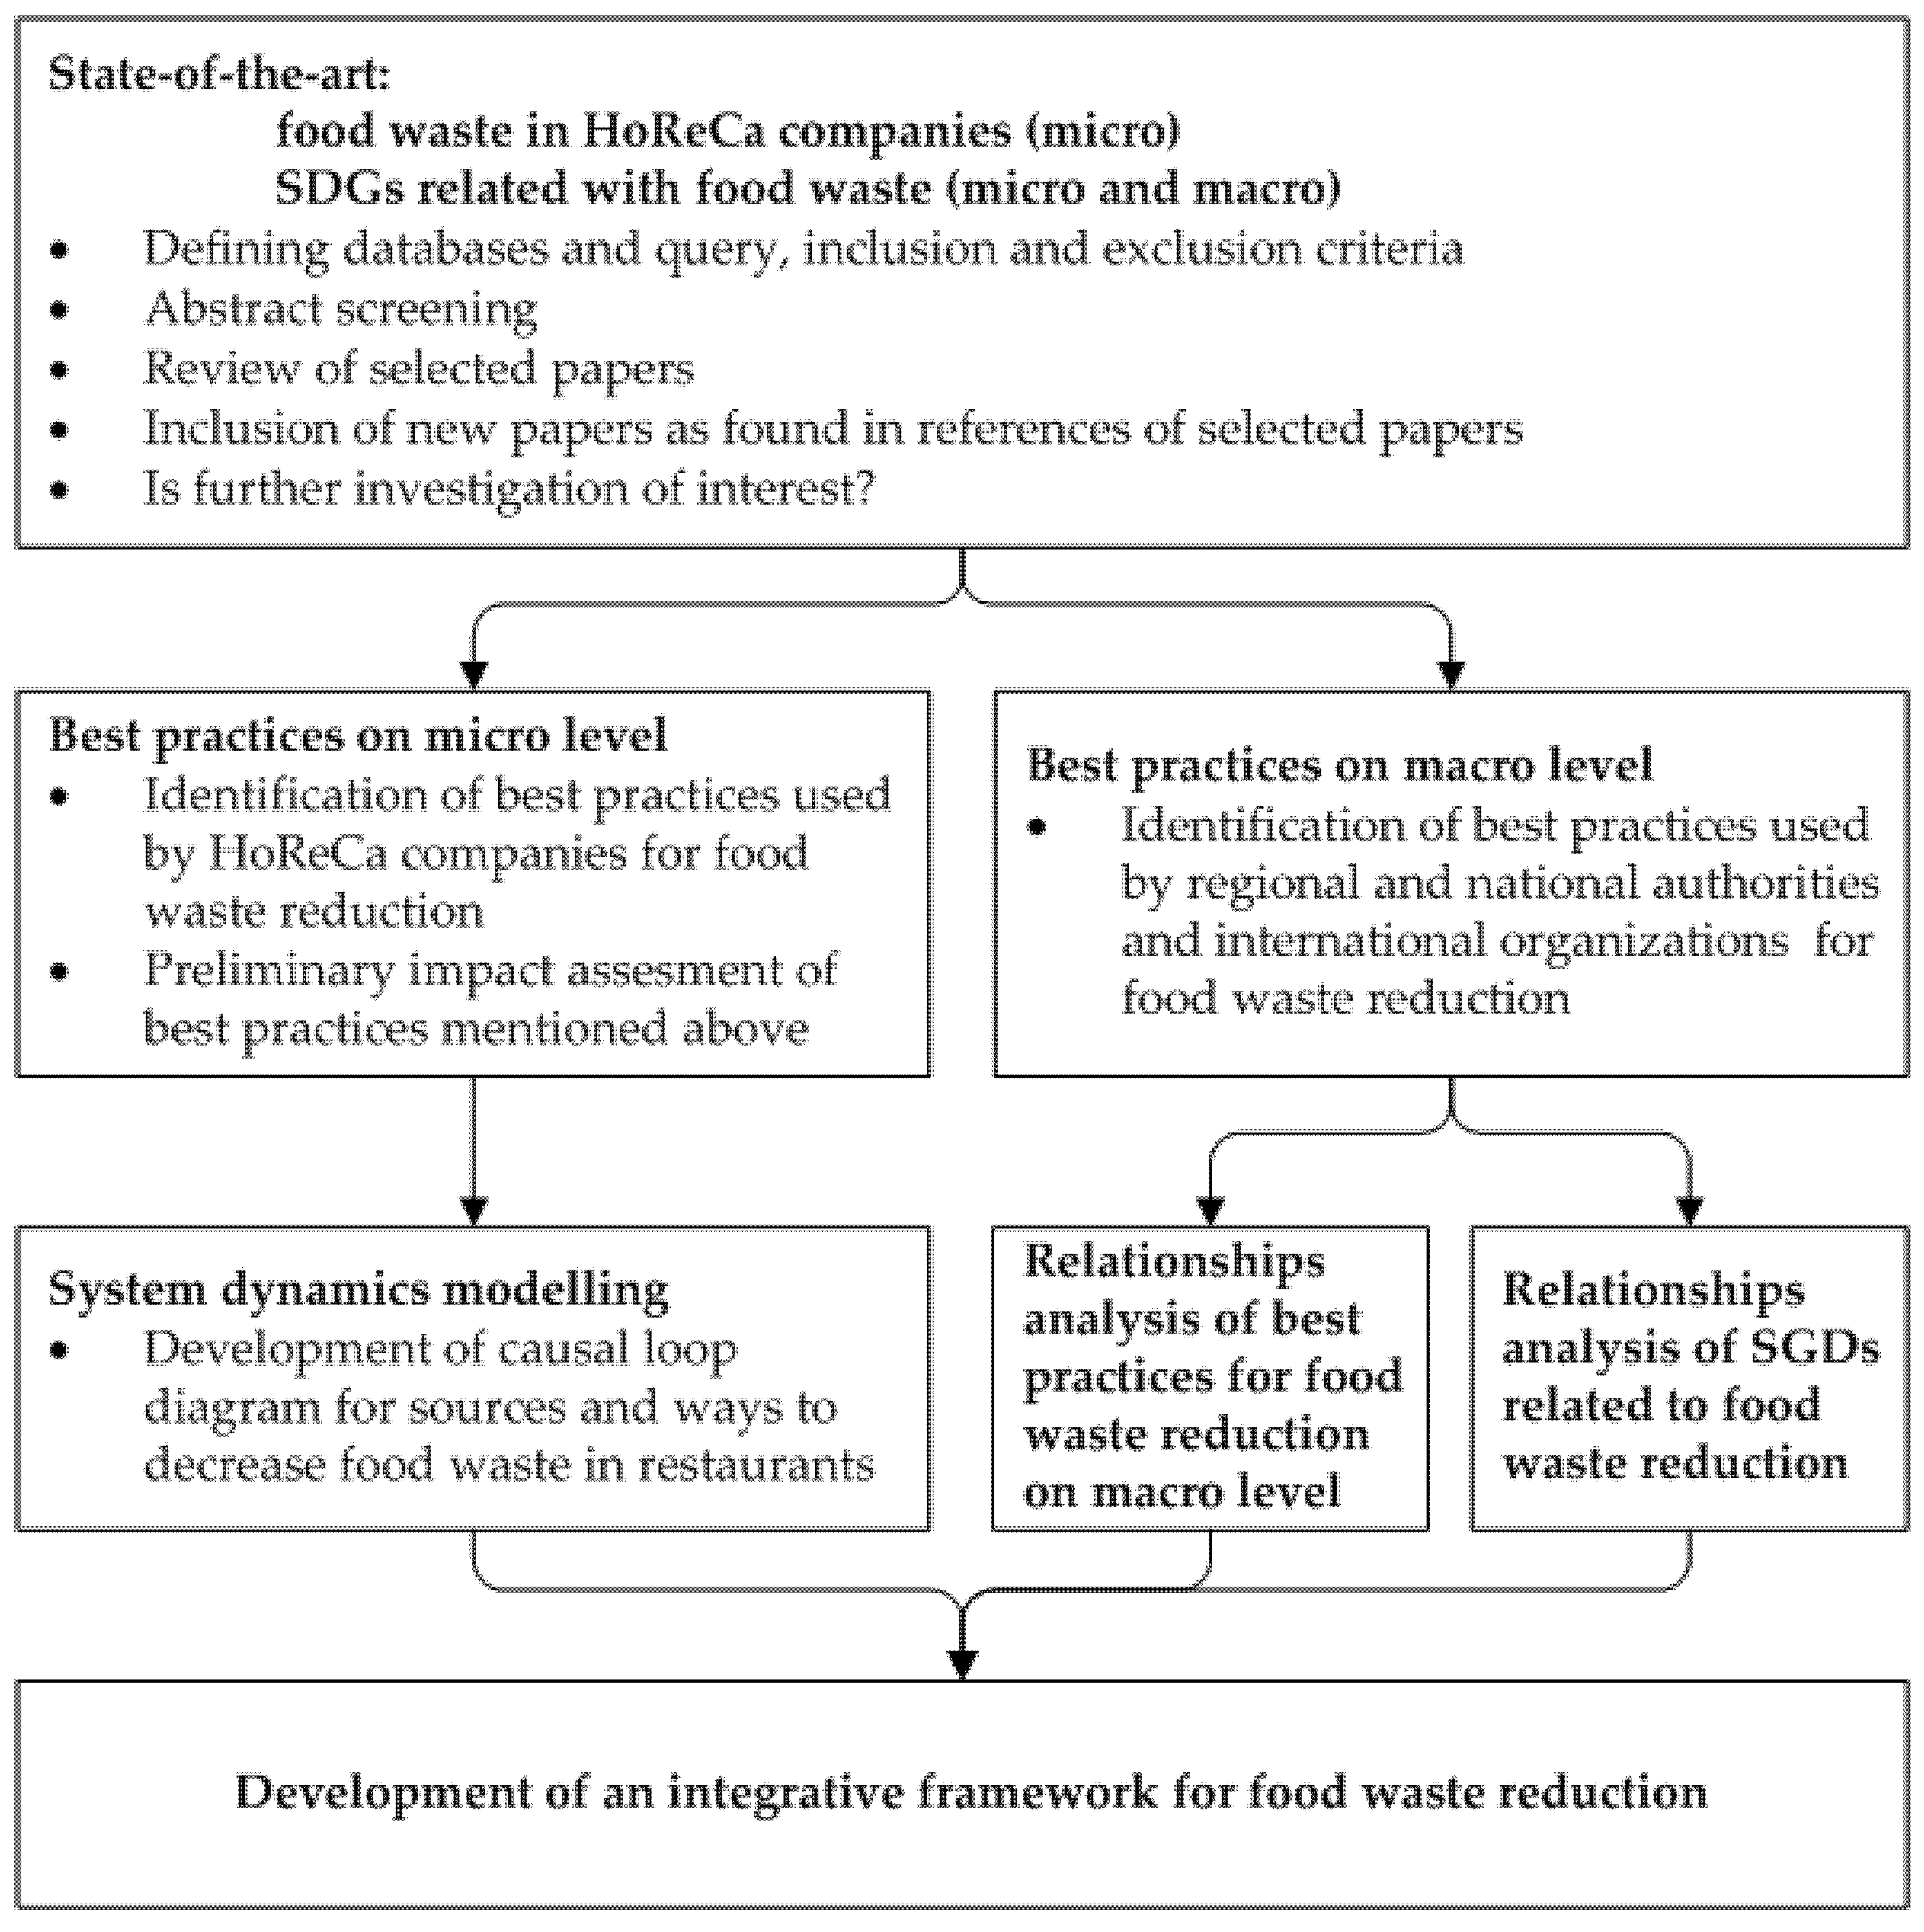
2. Materials and Methods
- (1)
- “Food waste” AND (HoReCa OR Hospitality OR “food service”)
- (2)
- “Food waste” AND “Sustainable Development Goals”
- Company level (micro)—closely related to companies’ operational activities and customer behavior.
- Policymakers at regional, national or global level (macro)—related to polices and regional, national or global programs.
3. Results
3.1. Queries Review Results
- FW AND HORECA (Table 2), with year of publication and whether it concerns good practices addressed on the micro and macro level entities of both.
- FW AND SDGs (Table 3), with year of publication and which SDGs the publication concerns. Additionally, the tables indicate whether the best practices described in the publication related to the micro and macro levels and entities of both.
3.2. Best Practices on the Micro Level
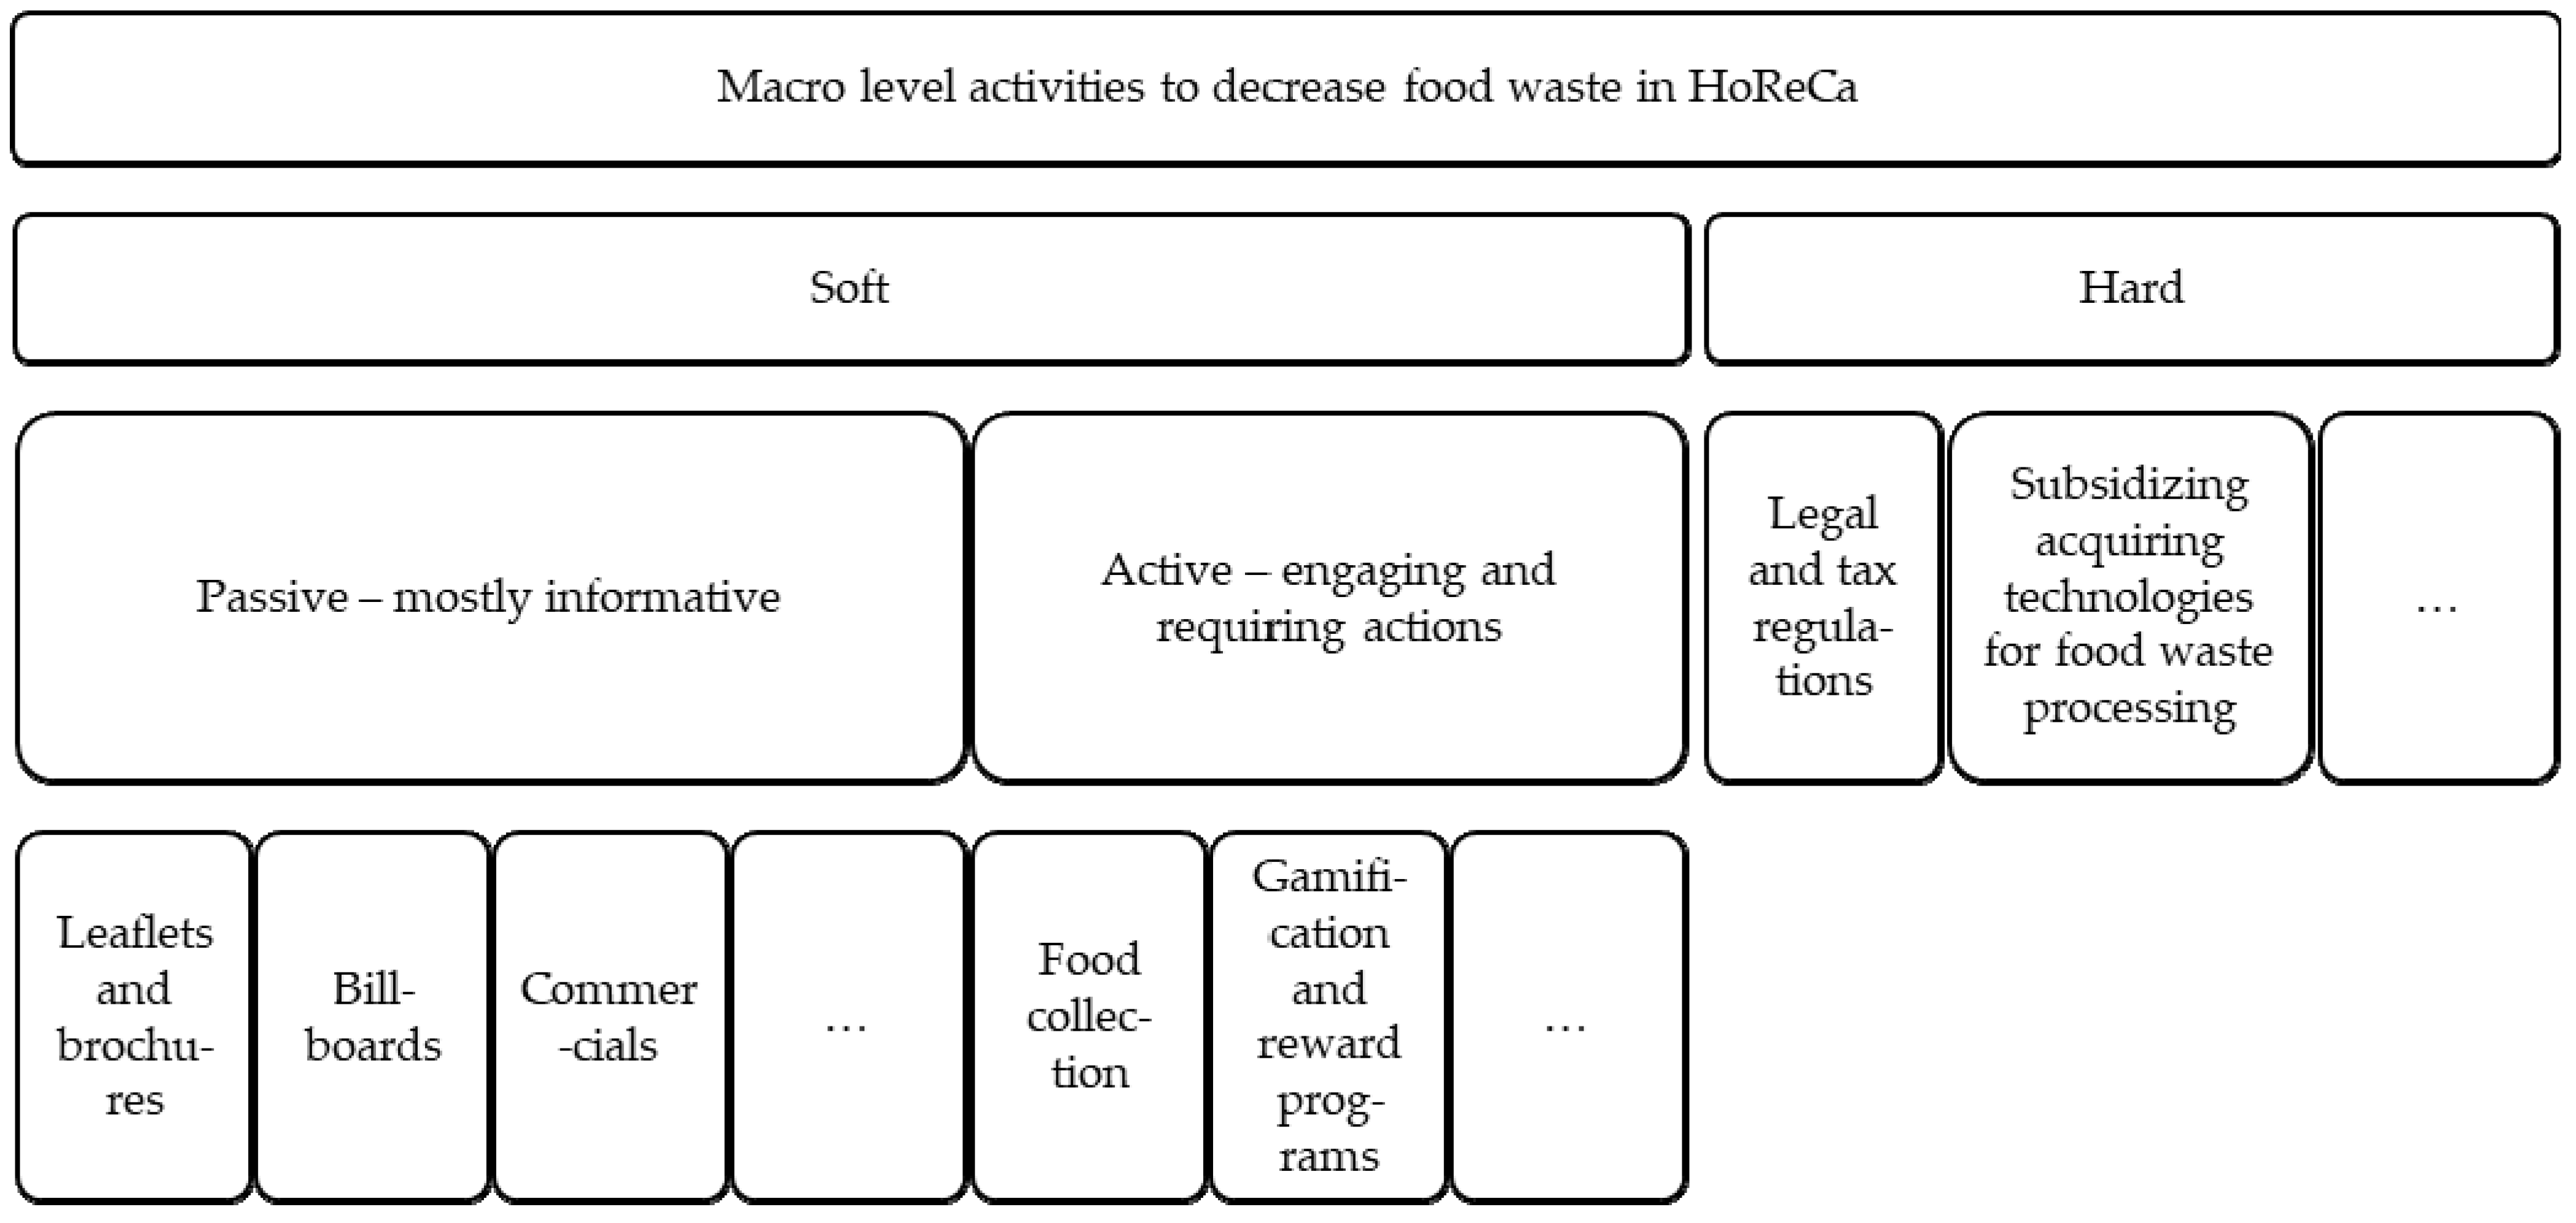
3.3. Best Practices on the Macro Level
3.4. Analysis of the SDGs Related to Food Waste
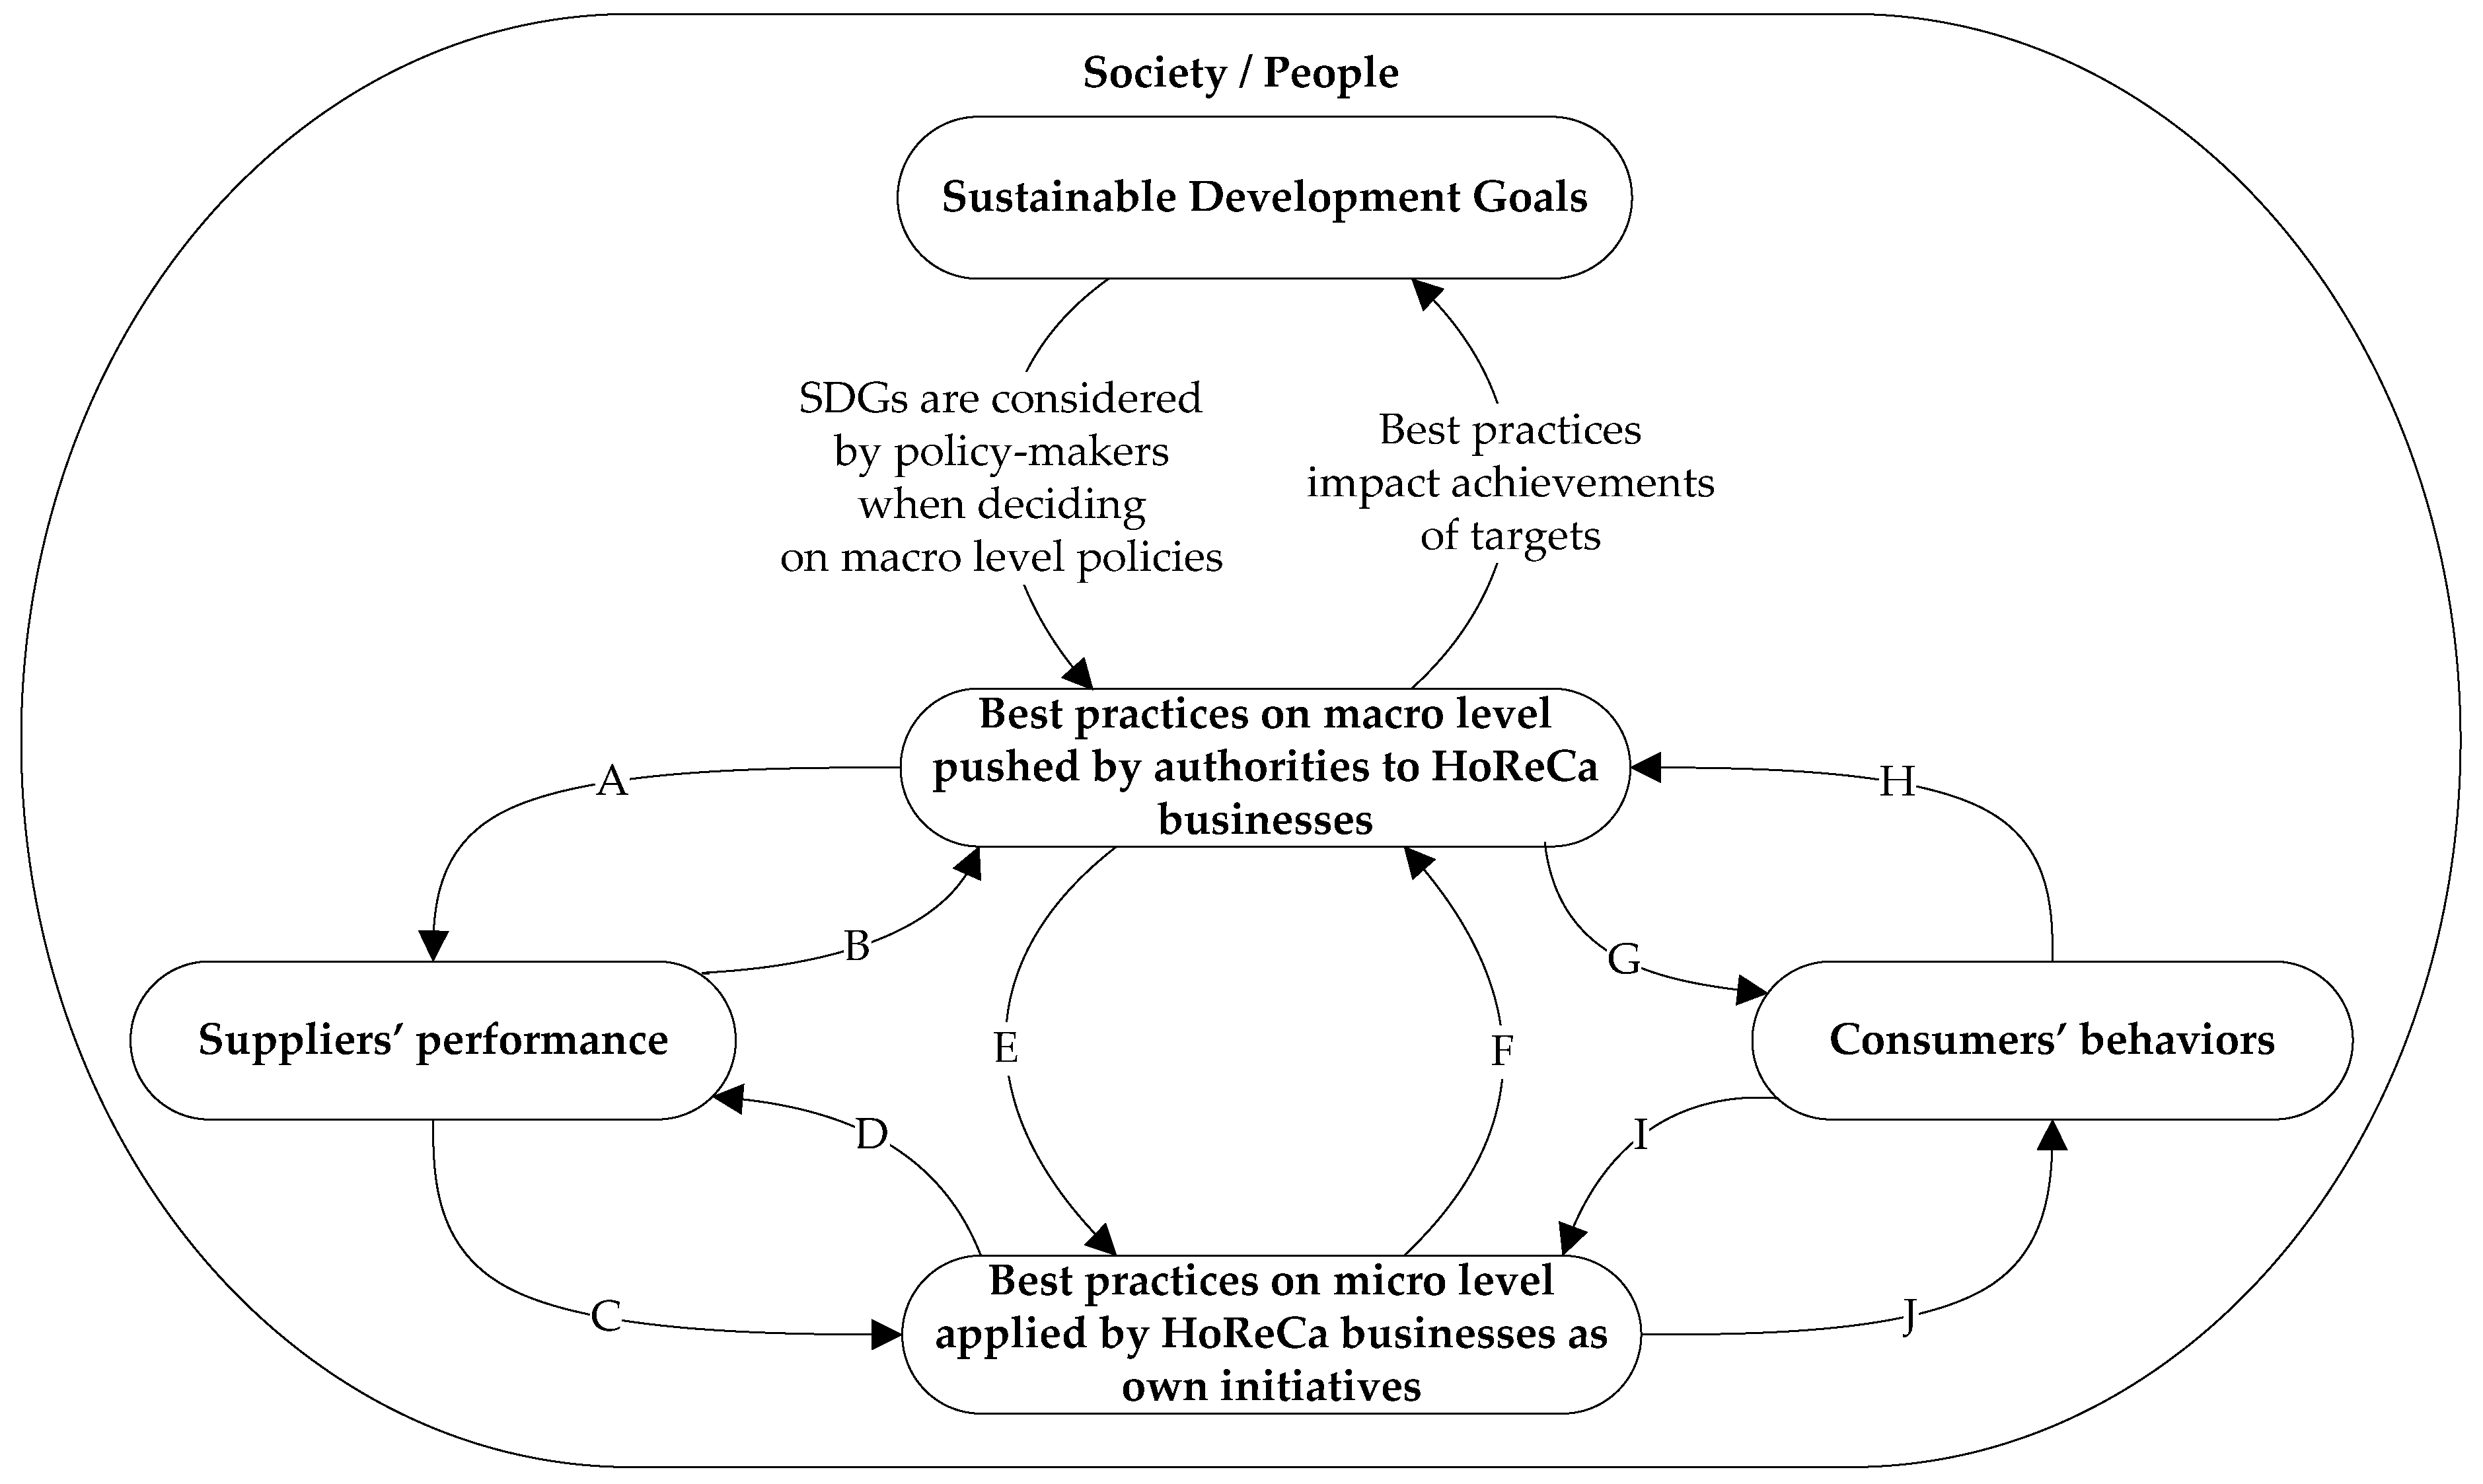
3.5. Framework
- A
- Programs launched by public authorities (regional, national and international levels) addressed to HoReCa suppliers have indirect influence on FW reduction by HoReCa sector.
- B
- Suppliers’ performance in terms of FW is considered by authorities when deciding on best practices on macro level.
- C
- Suppliers’ performance in term of FW drives their own decisions on best practices on the micro level.
- D
- Available best practices on micro level and access to information about them affects suppliers’ performance in terms of FW.
- E
- Programs launched by authorities serve as guidelines for suppliers and consumers when thinking about best practices on the micro level.
- F
- Available best practices on the micro level and access to information about serving for a bottom-up formulation of best practices on macro level by authorities.
- G
- Programs launched by public authorities (regional, national and international levels) addressed to consumers, mainly related to awareness have indirect influence on FW reduction by HoReCa sector.
- H
- Consumer behavior is considered by authorities when deciding on macro level policies.
- I
- Consumer behavior is a driver for formulation of best practices (and worst as well) on micro level.
- J
- Consumer’ behavior is impacted by best available practices on micro level and information about them.
4. Discussion—Systems Engineering for SDGs in HoReCa
5. Conclusions
Author Contributions
Funding
Institutional Review Board Statement
Informed Consent Statement
Data Availability Statement
Acknowledgments
Conflicts of Interest
References
- Fu, B.; Wang, S.; Zhang, J.; Hou, Z.; Li, J. Unravelling the Complexity in Achieving the 17 Sustainable-Development Goals. Natl. Sci. Rev. 2019, 6, 386–388. [Google Scholar] [CrossRef]
- Frank, A. Über Verwertung Der Küchenabfälle Für Gewinnung von Trockenfutter Und von Fett Durch Ausnutzung Der Abgehenden Hitze Der Gasanstalten, Sowie Anderer Industrieller Betriebe. J. Prakt. Chem. 1915, 92, 419–424. [Google Scholar] [CrossRef]
- Brown, L.P. Food Wastes—Some Causes and Remedies. J. Frankl. Inst. 1918, 185, 585–610. [Google Scholar] [CrossRef]
- Lau, W.; Cipani, E. Reducing Student Food Waste in a Cafeteria-Style Dining Setting through Contingency Management. Child Youth Care Forum 1983, 12, 301–310. [Google Scholar] [CrossRef]
- Youngs, A.J.; Nobis, G.; Town, P. Food Waste from Hotels and Restaurants in the U.K. Waste Manag. Res. 1983, 1, 295–308. [Google Scholar] [CrossRef]
- Gunders, D.; Bloom, J. Wasted: How America Is Losing up to 40 Percent of Its Food from Farm to Fork to Landfill; Natural Resources Defense Council: New York, NY, USA, 2017. [Google Scholar]
- Stenmarck, Â.; Jensen, C.; Quested, T.; Moates, G.; Buksti, M.; Cseh, B.; Juul, S.; Parry, A.; Politano, A.; Redlingshofer, B. Estimates of European Food Waste Levels; IVL Swedish Environmental Research Institute: Stockholm, Sweden, 2016. [Google Scholar]
- UN. The Sustainable Development Goals Report 2020; United Nations: New York, NY, USA, 2020; ISBN 978-92-1-004960-3. Available online: www.un-ilibrary.org (accessed on 10 April 2021).
- Bloom, J. American Wasteland: How America Throws Away Nearly Half of Its Food; Da Capo Books: Cambridge, MA, USA, 2010. [Google Scholar]
- Benton, D. Portion Size: What We Know and What We Need to Know. Crit. Rev. Food Sci. Nutr. 2015, 55, 988–1004. [Google Scholar] [CrossRef] [PubMed]
- Stöckli, S.; Dorn, M.; Liechti, S. Normative Prompts Reduce Consumer Food Waste in Restaurants. Waste Manag. 2018, 77, 532–536. [Google Scholar] [CrossRef] [PubMed]
- Lasek, A.; Cercone, N.; Saunders, J. Restaurant Sales and Customer Demand Forecasting: Literature Survey and Categorization of Methods. In Smart City 360°, Proceedings of the First EAI International Summit, Smart City 360°, Toronto, ON, Canada, 13–16 October 2015; Leon-Garcia, A., Lenort, R., Holman, D., Staš, D., Krutilova, V., Wicher, P., Cagáňová, D., Špirková, D., Golej, J., Nguyen, K., Eds.; Springer International Publishing: Cham, Switzerland, 2016; pp. 479–491. [Google Scholar]
- Sirieix, L.; Lála, J.; Kocmanová, K. Understanding the Antecedents of Consumers’ Attitudes towards Doggy Bags in Restaurants: Concern about Food Waste, Culture, Norms and Emotions. J. Retail. Consum. Serv. 2017, 34, 153–158. [Google Scholar] [CrossRef]
- Papargyropoulou, E.; Steinberger, J.K.; Wright, N.; Lozano, R.; Padfield, R.; Ujang, Z. Patterns and Causes of Food Waste in the Hospitality and Food Service Sector: Food Waste Prevention Insights from Malaysia. Sustainability 2019, 11, 6016. [Google Scholar] [CrossRef]
- UN. Global Indicator Framework for the Sustainable Development Goalsand Targets of the 2030 Agenda for Sustainable Development 2020; United Nations: New York, NY, USA, 2020. [Google Scholar]
- Da Rosa, F.S.; Lunkes, R.J.; Spigarelli, F.; Compagnucci, L. Environmental Innovation and the Food, Energy and Water Nexus in the Food Service Industry. Resour. Conserv. Recycl. 2021, 166, 105350. [Google Scholar] [CrossRef]
- Wang, L.-E.; Filimonau, V.; Li, Y. Exploring the Patterns of Food Waste Generation by Tourists in a Popular Destination. J. Clean. Prod. 2021, 279, 123890. [Google Scholar] [CrossRef]
- Gładysz, B.; Buczacki, A.; Haskins, C. Lean Management Approach to Reduce Waste in Horeca Food Services. Resources 2020, 9, 144. [Google Scholar] [CrossRef]
- De Visser-Amundson, A. A Multi-Stakeholder Partnership to Fight Food Waste in the Hospitality Industry: A Contribution to the United Nations Sustainable Development Goals 12 and 17. J. Sustain. Tour. 2020. [Google Scholar] [CrossRef]
- Batlle-Bayer, L.; Bala, A.; Roca, M.; Lemaire, E.; Aldaco, R.; Fullana-i-Palmer, P. Nutritional and Environmental Co-Benefits of Shifting to “Planetary Health” Spanish Tapas. J. Clean. Prod. 2020, 271, 122561. [Google Scholar] [CrossRef]
- Chinie, A.-C. Challenges for Reducing Food Waste. Proc. Int. Conf. Bus. Excell. 2020, 14, 819–828. [Google Scholar] [CrossRef]
- Filimonau, V.; Todorova, E.; Mzembe, A.; Sauer, L.; Yankholmes, A. A Comparative Study of Food Waste Management in Full Service Restaurants of the United Kingdom and the Netherlands. J. Clean. Prod. 2020, 258, 120775. [Google Scholar] [CrossRef]
- Vizzoto, F.; Tessitore, S.; Iraldo, F.; Testa, F. Passively Concerned: Horeca Managers’ Recognition of the Importance of Food Waste Hardly Leads to the Adoption of More Strategies to Reduce It. Waste Manag. 2020, 107, 266–275. [Google Scholar] [CrossRef] [PubMed]
- Okumus, B. How Do Hotels Manage Food Waste? Evidence from Hotels in Orlando, Florida. J. Hosp. Mark. Manag. 2020, 29, 291–309. [Google Scholar] [CrossRef]
- Visschers, V.H.M.; Gundlach, D.; Beretta, C. Smaller Servings vs. Information Provision: Results of Two Interventions to Reduce Plate Waste in Two University Canteens. Waste Manag. 2020, 103, 323–333. [Google Scholar] [CrossRef]
- Li, Y.; Wang, L.; Cheng, S. Spatiotemporal Variability in Urban HORECA Food Consumption and Its Ecological Footprint in China. Sci. Total Environ. 2019, 687, 1232–1244. [Google Scholar] [CrossRef] [PubMed]
- Filimonau, V.; Fidan, H.; Alexieva, I.; Dragoev, S.; Marinova, D.D. Restaurant Food Waste and the Determinants of Its Effective Management in Bulgaria: An Exploratory Case Study of Restaurants in Plovdiv. Tour. Manag. Perspect. 2019, 32, 100577. [Google Scholar] [CrossRef]
- Malefors, C.; Callewaert, P.; Hansson, P.-A.; Hartikainen, H.; Pietiläinen, O.; Strid, I.; Strotmann, C.; Eriksson, M. Towards a Baseline for Food-Waste Quantification in the Hospitality Sector—Quantities and Data Processing Criteria. Sustainability 2019, 11, 3541. [Google Scholar] [CrossRef]
- Chalak, A.; Abou-Daher, C.; Abiad, M.G. Generation of Food Waste in the Hospitality and Food Retail and Wholesale Sectors: Lessons from Developed Economies. Food Secur. 2018, 10, 1279–1290. [Google Scholar] [CrossRef]
- Martin-Rios, C.; Demen-Meier, C.; Gössling, S.; Cornuz, C. Food Waste Management Innovations in the Foodservice Industry. Waste Manag. 2018, 79, 196–206. [Google Scholar] [CrossRef]
- Filimonau, V.; Krivcova, M. Restaurant Menu Design and More Responsible Consumer Food Choice: An Exploratory Study of Managerial Perceptions. J. Clean. Prod. 2017, 143, 516–527. [Google Scholar] [CrossRef]
- Iraldo, F.; Testa, F.; Lanzini, P.; Battaglia, M. Greening Competitiveness for Hotels and Restaurants. J. Small Bus. Enterp. Dev. 2017, 24, 607–628. [Google Scholar] [CrossRef]
- Pirani, S.I.; Arafat, H.A. Reduction of Food Waste Generation in the Hospitality Industry. J. Clean. Prod. 2016, 132, 129–145. [Google Scholar] [CrossRef]
- Falasconi, L.; Vittuari, M.; Politano, A.; Segrè, A. Food Waste in School Catering: An Italian Case Study. Sustainability 2015, 7, 14745–14760. [Google Scholar] [CrossRef]
- Ananno, A.A.; Masud, M.H.; Chowdhury, S.A.; Dabnichki, P.; Ahmed, N.; Arefin, A.M.E. Sustainable Food Waste Management Model for Bangladesh. Sustain. Prod. Consum. 2021, 27, 35–51. [Google Scholar] [CrossRef]
- Adelodun, B.; Kim, S.H.; Choi, K.-S. Assessment of Food Waste Generation and Composition among Korean Households Using Novel Sampling and Statistical Approaches. Waste Manag. 2021, 122, 71–80. [Google Scholar] [CrossRef]
- Antón-Peset, A.; Fernandez-Zamudio, M.-A.; Pina, T. Promoting Food Waste Reduction at Primary Schools. A Case Study. Sustainability 2021, 13, 600. [Google Scholar] [CrossRef]
- Pateman, R.M.; de Bruin, A.; Piirsalu, E.; Reynolds, C.; Stokeld, E.; West, S.E. Citizen Science for Quantifying and Reducing Food Loss and Food Waste. Front. Sustain. Food Syst. 2020, 4, 589089. [Google Scholar] [CrossRef]
- Feijoo, G.; Moreira, M.T. Fostering Environmental Awareness towards Responsible Food Consumption and Reduced Food Waste in Chemical Engineering Students. Educ. Chem. Eng. 2020, 33, 27–35. [Google Scholar] [CrossRef]
- Amicarelli, V.; Bux, C. Food Waste in Italian Households during the Covid-19 Pandemic: A Self-Reporting Approach. Food Secur. 2021, 13, 25–37. [Google Scholar] [CrossRef] [PubMed]
- You, F.; Bhamra, T.; Lilley, D. Why Is Airline Food Always Dreadful? Analysis of Factors Influencing Passengers’ Food Wasting Behaviour. Sustainability 2020, 12, 8571. [Google Scholar] [CrossRef]
- Fattibene, D.; Recanati, F.; Dembska, K.; Antonelli, M. Urban Food Waste: A Framework to Analyse Policies and Initiatives. Resources 2020, 9, 99. [Google Scholar] [CrossRef]
- Fleetwood, J. Social Justice, Food Loss, and the Sustainable Development Goals in the Era of COVID-19. Sustainability 2020, 12, 5027. [Google Scholar] [CrossRef]
- Eriksson, M.; Malefors, C.; Bergström, P.; Eriksson, E.; Osowski, C.P. Quantities and Quantification Methodologies of Food Waste in Swedish Hospitals. Sustainability 2020, 12, 3116. [Google Scholar] [CrossRef]
- Kasza, G.; Dorkó, A.; Kunszabó, A.; Szakos, D. Quantification of Household Food Waste in Hungary: A Replication Study Using the FUSIONS Methodology. Sustainability 2020, 12, 3069. [Google Scholar] [CrossRef]
- Soma, T.; Li, B.; Maclaren, V. Food Waste Reduction: A Test of Three Consumer Awareness Interventions. Sustainability 2020, 12, 907. [Google Scholar] [CrossRef]
- Leverenz, D.; Moussawel, S.; Maurer, C.; Hafner, G.; Schneider, F.; Schmidt, T.; Kranert, M. Quantifying the Prevention Potential of Avoidable Food Waste in Households Using a Self-Reporting Approach. Resour. Conserv. Recycl. 2019, 150, 104417. [Google Scholar] [CrossRef]
- Caldeira, C.; De Laurentiis, V.; Corrado, S.; van Holsteijn, F.; Sala, S. Quantification of Food Waste per Product Group along the Food Supply Chain in the European Union: A Mass Flow Analysis. Resour. Conserv. Recycl. 2019, 149, 479–488. [Google Scholar] [CrossRef] [PubMed]
- Nicholes, M.J.; Quested, T.E.; Reynolds, C.; Gillick, S.; Parry, A.D. Surely You Don’t Eat Parsnip Skins? Categorising the Edibility of Food Waste. Resour. Conserv. Recycl. 2019, 147, 179–188. [Google Scholar] [CrossRef]
- Secondi, L.; Principato, L.; Mattia, G. Can Digital Solutions Help in the Minimization of Out-of-Home Waste? An Analysis from the Client and Business Perspective. Br. Food J. 2019, 122, 1341–1359. [Google Scholar] [CrossRef]
- Wakiyama, T.; Lenzen, M.; Faturay, F.; Geschke, A.; Malik, A.; Fry, J.; Nansai, K. Responsibility for Food Loss from a Regional Supply-Chain Perspective. Resour. Conserv. Recycl. 2019, 146, 373–383. [Google Scholar] [CrossRef]
- Pollard, C.M.; Booth, S. Food Insecurity and Hunger in Rich Countries—It Is Time for Action against Inequality. Int. J. Environ. Res. Public Health 2019, 16, 1804. [Google Scholar] [CrossRef]
- Lassen, A.D.; Christensen, L.M.; Spooner, M.P.; Trolle, E. Characteristics of Canteens at Elementary Schools, Upper Secondary Schools and Workplaces That Comply with Food Service Guidelines and Have a Greater Focus on Food Waste. Int. J. Environ. Res. Public Health 2019, 16, 1115. [Google Scholar] [CrossRef]
- Reynolds, C.; Goucher, L.; Quested, T.; Bromley, S.; Gillick, S.; Wells, V.K.; Evans, D.; Koh, L.; Carlsson Kanyama, A.; Katzeff, C.; et al. Review: Consumption-Stage Food Waste Reduction Interventions—What Works and How to Design Better Interventions. Food Policy 2019, 83, 7–27. [Google Scholar] [CrossRef]
- Cooper, J. Briefing: Food Waste—Next Steps for Food Processors and Manufacturers. Proc. Inst. Civ. Eng. Waste Resour. Manag. 2018, 171, 91–93. [Google Scholar] [CrossRef]
- Corrado, S.; Sala, S. Food Waste Accounting along Global and European Food Supply Chains: State of the Art and Outlook. Waste Manag. 2018, 79, 120–131. [Google Scholar] [CrossRef]
- Kowalewska, M.T.; Kołłajtis-Dołowy, A. Food, Nutrient, and Energy Waste among School Students. Br. Food J. 2018, 120, 1807–1831. [Google Scholar] [CrossRef]
- Tjarnemo, H.; Sodahl, L. Swedish Food Retailers Promoting Climate Smarter Food Choices-Trapped between Visions and Reality? J. Retail. Consum. Serv. 2015, 24, 130–139. [Google Scholar] [CrossRef]
- Clowes, A.; Hanson, C.; Swanell, R. The Business Case for Reducing Food Loss and Waste: Restaurants. Champions 12.3.2019. Available online: www.champions123.org (accessed on 10 April 2021).
- De Steur, H.; Wesana, J.; Dora, M.K.; Pearce, D.; Gellynck, X. Applying Value Stream Mapping to Reduce Food Losses and Wastes in Supply Chains: A Systematic Review. Waste Manag. 2016, 58, 359–368. [Google Scholar] [CrossRef] [PubMed]
- Morecroft, J. Strategic Modelling and Business; John Wiley &Sons: Chichester, UK; Hoboken, NJ, USA, 2007; ISBN 978-0-470-01286-4. [Google Scholar]
- Sterman, J.D. System Dynamics Modeling: Tools for Learning in a Complex World. Calif. Manag. Rev. 2001, 43, 8–25. [Google Scholar] [CrossRef]
- Breuer, A.; Janetschek, H.; Malerba, D. Translating Sustainable Development Goal (SDG) Interdependencies into Policy Advice. Sustainability 2019, 11, 2092. [Google Scholar] [CrossRef]
- Nilsson, M.; Griggs, D.; Visbeck, M. Policy: Map the Interactions between Sustainable Development Goals. Nat. News 2016, 534, 320. [Google Scholar] [CrossRef]
- EC. Closing the Loop—An EU Action Plan for the Circular Economy COM/2015/0614 Final—European Environment Agency. Available online: https://www.eea.europa.eu/policy-documents/com-2015-0614-final (accessed on 8 April 2021).
- EC. Report from the Commission to the European Parliament, the Council COM/2019/190 Final—The European Economic and Social Committee and the Committee of the Regions on the Implementation of the Circular Economy Action Plan. Available online: https://eur-lex.europa.eu/legal-content/pl/TXT/?uri=CELEX:52019DC0190 (accessed on 10 April 2021).
- EC. Farm to Fork Strategy. For a Fair, Healthy and Environmentally-Friendly Food System. Available online: https://ec.europa.eu/food/farm2fork_en (accessed on 10 April 2021).
- UN. Nationally Determined Contributions under the Paris Agreement. Synthesis Report by the Secretariat, UN. Available online: https://unfccc.int/process-and-meetings/the-paris-agreement/nationally-determined-contributions-ndcs/nationally-determined-contributions-ndcs (accessed on 10 April 2021).
- Pradhan, P.; Costa, L.; Rybski, D.; Lucht, W.; Kropp, J.P. A Systematic Study of Sustainable Development Goal (SDG) Interactions. Earth’s Future 2017, 5, 1169–1179. [Google Scholar] [CrossRef]
- Gustavsson, J.; Cederberg, C.; Sonesson, U.; Van Otterdijk, R.; Meybeck, A. FAO Global Food Losses and Food Waste—Extent, Causes and Prevention; Technical Report; FAO: Rome, Italy; Swedish Institute for Food and Biotechnology (SIK): Göteborg, Sweden, 2011. [Google Scholar]
- Bergman, Z.; Bergman, M.M.; Fernandes, K.; Grossrieder, D.; Schneider, L. The Contribution of UNESCO Chairs toward Achieving the UN Sustainable Development Goals. Sustainability 2018, 10, 4471. [Google Scholar] [CrossRef]
- Galli, F.; Cavicchi, A.; Brunori, G. Food Waste Reduction and Food Poverty Alleviation: A System Dynamics Conceptual Model. Agric. Hum. Values 2019, 36, 289–300. [Google Scholar] [CrossRef]
- Blanc, D.L. Towards Integration at Last? The Sustainable Development Goals as a Network of Targets. Sustain. Dev. 2015, 23, 176–187. [Google Scholar] [CrossRef]
- UN. Resolution Adopted by the General Assembly on 25 September 2015. Transforming Our World: The 2030 Agenda for Sustainable Development 2015; United Nations: New York, NY, USA, 2015. [Google Scholar]
- Palmer, E.; Burton, R.; Haskins, C. A Systems Engineering Framework for Bioeconomic Transitions in a Sustainable Development Goal Context. Sustainability 2020, 12, 6650. [Google Scholar] [CrossRef]
- Spangenberg, J.H. Hot Air or Comprehensive Progress? A Critical Assessment of the SDGs. Sustain. Dev. 2017, 25, 311–321. [Google Scholar] [CrossRef]
- Wong, R.; van der Heijden, J. Avoidance of Conflicts and Trade-Offs: A Challenge for the Policy Integration of the United Nations Sustainable Development Goals. Sustain. Dev. 2019, 27, 838–845. [Google Scholar] [CrossRef]
- Sanz-Hernández, A.; Esteban, E.; Garrido, P. Transition to a Bioeconomy: Perspectives from Social Sciences. J. Clean. Prod. 2019, 224, 107–119. [Google Scholar] [CrossRef]
- Palmer, E.; Rhodes, D.; Watson, M.; Haskins, C.; Olaya, C.; Presland, I.; Fossum, K. Putting the Social in Systems Engineering: An Overview and Conceptual Development; INCOSE: San Diego, CA, USA, 2021; in press. [Google Scholar]
- Skene, K.R.; Malcolm, J. Using the SDGs to Nurture Connectivity and Promote Change. Des. J. 2019, 22, 1629–1646. [Google Scholar] [CrossRef]
- Stafford-Smith, M.; Griggs, D.; Gaffney, O.; Ullah, F.; Reyers, B.; Kanie, N.; Stigson, B.; Shrivastava, P.; Leach, M.; O’Connell, D. Integration: The Key to Implementing the Sustainable Development Goals. Sustain. Sci. 2017, 12, 911–919. [Google Scholar] [CrossRef] [PubMed]
- Senge, P.M. The Fifth Discipline Fieldbook: Strategies and Tools for Building a Learning Organization; Currency, Doubleday: New York, NY, USA, 1994; ISBN 978-0-385-47256-2. [Google Scholar]
- Braun, W. The System Archetypes. System 2002, 1, 1–26. [Google Scholar]
- Wolstenholme, E. Using Generic System Archetypes to Support Thinking and Modelling. Syst. Dyn. Rev. 2004, 20, 341–356. [Google Scholar] [CrossRef]
- Probst, G.; Bassi, A.M. Tackling Complexity; Routledge: London, UK, 2014. [Google Scholar]


| Sample Characteristics | WoS | Scopus | WoS + Scopus with No Repetitions |
|---|---|---|---|
| “Food waste” AND (HoReCa OR Hospitality OR “Food service”) | 145 | 160 | N/A |
| Selected in first step after refinement | 103 | 105 | N/A |
| Selected in second step after abstracts analysis | 19 | 18 | 20 |
| Food waste AND Sustainable Development Goal (FW AND SDG) | 262 | 382 | N/A |
| FW AND SDG from 2015 in English | 232 | 310 | N/A |
| FW AND SDG after abstracts analysis | 26 | 27 | 28 |
| Ref. | Year | Level | Summary | |
|---|---|---|---|---|
| Micro | Macro | |||
| [16] | 2021 | X | Analysis of responses from 206 managers of Brazilian food service companies. Findings focused on FW reduction. | |
| [17] | 2021 | X | Presentation of sociodemographic and food consumption-related factors generated by tourists in the HoReCa sector. Insights into achieving sustainability objectives in national and international tourism sectors. | |
| [18] | 2020 | X | Description of best practices implemented by 3 HoReCa companies based on lean management approach and its impact on FW reduction. | |
| [19] | 2020 | X | X | Description of multi-stakeholder partnership program “Food waste Challenge”, involving 172 restaurants. Program focuses on a range of behavioral interventions. |
| [20] | 2020 | X | X | Paper focuses on the lifecycle assessment of 15 tapas meals, as well as analysis of nutritional quality of the meals and energy efficiency at the restaurant. |
| [21] | 2020 | X | Analysis of social, economic and environmental impact of food waste reduction activities. | |
| [22] | 2020 | X | Analysis of restaurant food waste management practices in the UK and the Netherlands in case of FW management. | |
| [23] | 2020 | X | Findings for food waste measurement and waste reduction strategies in the different stages (pre-kitchen, in-kitchen and post-kitchen). Results based on the survey of almost 500 HoReCa managers. | |
| [24] | 2020 | X | Results of semi-structured interviews with 32 hotel employees and managers. Proposition of possible strategies for reducing FW addressed for restaurants and consumers. | |
| [25] | 2019 | X | Evaluation of interventions in two university canteens on their effectiveness to reduce visitors’ plate waste. | |
| [14] | 2019 | X | X | Empirical evidence for FW reduction in HoReCa sector in Malaysia. Proposition of FW prevention strategies related to companies’ operations activities and consumers’ social practices. |
| [26] | 2019 | X | X | Analysis of direct-weighing data (from 164 restaurants) and its ecological footprint rather on macro-level. |
| [27] | 2019 | X | X | A case study of the restaurant activity in Bulgaria. Proposition of training programs for restaurateurs and public authorities. |
| [28] | 2019 | X | Presentation of research results for the quantification of food waste based on the data hospitality sector (1189 kitchens) in Sweden, Norway, Finland and Germany. Proposition of statistical measures for food waste tracking | |
| [29] | 2018 | X | Insights of food waste generation factors in HoReCa sector at the national level. | |
| [30] | 2018 | X | Identification of waste management initiatives in the food service sector and evaluation of management practices for waste reduction by managers from food service sector companies. | |
| [31] | 2017 | X | Analysis based on managerial opinions of the role of menu design in shaping more responsible consumer choice and its impact on FW prevention. | |
| [32] | 2017 | X | X | Analysis based on 315 questionnaires from Italian HoReCa SMEs operating in the tourism sector. Presenting general strategies for both levels micro (company) and macro (regional authorities and commercial chambers). |
| [33] | 2016 | X | Research results of the management staff of 45 restaurants/hotels. Proposition of strategies that involve the cooperation of the restaurant/hotel staff and the guests. | |
| [34] | 2015 | X | Presentation of a case study and implications and impact on prevention. | |
| Ref. | Year | Level | SDGs | Summary | |
|---|---|---|---|---|---|
| Micro | Macro | ||||
| [35] | 2021 | X | 12.3 | Review of the food waste scenario, adverse effects, food waste policies and regulations in Bangladesh on national and municipalities levels. | |
| [36] | 2021 | X | X | 12.3 | Statistical analysis of 46 food waste items generated by households in the Buk-gu province of Daegu, South Korea. |
| [37] | 2021 | X | 12.3 | Presentation of case study: primary school (in Valencia) pupils’ behavior change after intervention focused on food waste reduction (knowledge, awareness, attitudes). | |
| [38] | 2020 | X | 12.3 | Presentation of additional value of citizen science as a trigger for policy making on behavior change. | |
| [39] | 2020 | X | 1, 2, 6, 12, 13 | Estimation of carbon and water footprint of food. Comparison of the values of environmental footprint in the case of rational consumption of meat. Presentation of evaluation-obtained results by chemical engineering students. | |
| [19] | 2020 | X | X | 12, 17 | Description of multi-stakeholder partnership program “Food waste Challenge” involving 172 restaurants. Program focuses on a range of behavioral interventions. |
| [40] | 2020 | X | 12.3 | Study of Covid-19 pandemic impact on food waste generation, financial costs and nutritional losses in Italian households. | |
| [41] | 2020 | X | 12.8 | Study of 19 passengers from 21 full-service flights. | |
| [42] | 2020 | X | 1.2, 1.3, 3.4, 4.7, 7.2, 8.2, 8.5, 9.4, 11.6, 12.3, 12.5, 13.3, 17.16, 17.17 | Food waste policy analysis provided by 40 cities across 16 European countries. Links between different types of policies provided and their impact on selected SDGs. | |
| [21] | 2020 | X | 12 | Analysis of social, economic and environmental impact of food waste reduction activities. | |
| [43] | 2020 | X | 2, 3, 8 | Presentation of the interrelations between SDGs, food access and waste also in the case of COVID-19 pandemic conditions. | |
| [44] | 2020 | X | X | Presentation of quantification methodology of food waste in Swedish hospitals. Different types of waste defined (serving waste, plate waste, kitchen waste). | |
| [45] | 2020 | X | 12.3 | Results of research (in 2016 and 2019) of 165 Hungarian households based on FUSIONS methodology. | |
| [46] | 2020 | X | X | 12.3 | Presentation of research results on the application of different types of awareness techniques (passive approach (handouts), community engagement approach and gamification for 501 households. |
| [47] | 2019 | X | X | 12.3 | Presentation of research using different approaches for self-reporting—passive (offline), proactive (online)—and evaluation of both approaches in case of food waste reduction. |
| [48] | 2019 | X | 12.3 | Results of supply chain analysis, including production, consumption and utilization per different food groups according to the food waste reduction. | |
| [49] | 2019 | X | 12.3 | Results of questionnaire-based research in the UK. Based on the proposition of categorization of what is considered edible in the case of the quantification of food waste. | |
| [28] | 2019 | X | 12.3 | Presentation of research results for the quantification of food waste based on the data hospitality sector (1189 kitchens) in Sweden, Norway, Finland and Germany. Proposition of statistical measures for food waste tracking. | |
| [50] | 2019 | X | 12.3 | Results of the analysis of 411 individuals from central Italy. Identification of support programs related to FW awareness, business investment in innovations and digital solutions focused on FW reduction. | |
| [51] | 2019 | X | 12.3 | A footprint analysis of the food loss at the stage of vegetable production in Japan. Proposition of actions helping farmers to make a crop production and distribution plan. | |
| [52] | 2019 | X | 2, 12.3 | Proposition of the actions of food and nutrition security for supporting developing countries. | |
| [53] | 2019 | X | X | Presentation of study results of 680 Danish canteens related to nutrition and service management focused on food waste reduction. | |
| [54] | 2019 | X | X | 12.3 | Review of interventions focused on food waste reduction in the hospitality sector and society (relating to nutrition behaviors). |
| [55] | 2018 | X | 12.3 | Brief description of UK program designed to prevent food waste generation in the hospitality and food service sector launched in 2017. | |
| [56] | 2018 | X | 12.3 | Review of studies on food waste generation at the global and European scales. | |
| [30] | 2018 | X | Identification of waste management initiatives in the food service sector and evaluation of management practices for waste reduction by managers from food service sector companies. | ||
| [57] | 2018 | X | X | 12 | Study of middle school students from 11 Polish schools. Analysis of food, nutrient, and energy waste and its impact on households’ food waste and nutrition and energy losses. |
| [58] | 2015 | X | X | Presentation of 17 interview results with 17 Swedish food retailer representatives. | |
| Interdependent SDG Targets | Rationale—Synergy, Trade-off or Both with Relation to Target 12.3 |
|---|---|
| 4.7—By 2030, ensure that all learners acquire the knowledge and skills needed to promote sustainable development, including, among others, through education for sustainable development and sustainable lifestyles. | Synergy: addressing consumer and retail food waste will require a re-education and increased awareness of the importance of food resources for both local and global sustainability. |
| 12.8—By 2030, ensure that people everywhere have the relevant information and awareness for sustainable development and lifestyles in harmony with nature. | |
| 13.3— Improve education, awareness-raising and human and institutional capacity on climate change mitigation, adaptation, impact reduction and early warning. | |
| 8.2—Achieve higher levels of economic productivity through diversification, technological upgrading and innovation, including through a focus on high-value added and labor-intensive sectors. | Both: food waste reduction will require the food service industries to look at packaging, transportation, and procedural innovations and improvements across the entire food value chain. |
| 8.4—Improve progressively, through 2030, global resource efficiency in consumption and production and endeavor to decouple economic growth from environmental degradation, in accordance with the 10-Year Framework of Programs on Sustainable Consumption and Production, with developed countries taking the lead. | |
| 12.5—By 2030, substantially reduce waste generation through prevention, reduction, recycling and reuse. | |
| 2.4—By 2030, ensure sustainable food production systems and implement resilient agricultural practices that increase productivity and production, that help maintain ecosystems, that strengthen capacity for adaptation to climate change, extreme weather, drought, flooding and other disasters and that progressively improve land and soil quality. | Both: if this target is addressed, the availability of food will be secured, but waste should still be reduced to improve availability to the less advantaged in society. |
| 11.6—By 2030, reduce the adverse per capita environmental impact of cities, including by paying special attention to air quality and municipal and other waste management. | Synergy: addressing this target will not reduce food waste, but it could help ensure a proper handling of food and other organic wastes. |
Publisher’s Note: MDPI stays neutral with regard to jurisdictional claims in published maps and institutional affiliations. |
© 2021 by the authors. Licensee MDPI, Basel, Switzerland. This article is an open access article distributed under the terms and conditions of the Creative Commons Attribution (CC BY) license (https://creativecommons.org/licenses/by/4.0/).
Share and Cite
Buczacki, A.; Gładysz, B.; Palmer, E. HoReCa Food Waste and Sustainable Development Goals—A Systemic View. Sustainability 2021, 13, 5510. https://doi.org/10.3390/su13105510
Buczacki A, Gładysz B, Palmer E. HoReCa Food Waste and Sustainable Development Goals—A Systemic View. Sustainability. 2021; 13(10):5510. https://doi.org/10.3390/su13105510
Chicago/Turabian StyleBuczacki, Aleksander, Bartłomiej Gładysz, and Erika Palmer. 2021. "HoReCa Food Waste and Sustainable Development Goals—A Systemic View" Sustainability 13, no. 10: 5510. https://doi.org/10.3390/su13105510
APA StyleBuczacki, A., Gładysz, B., & Palmer, E. (2021). HoReCa Food Waste and Sustainable Development Goals—A Systemic View. Sustainability, 13(10), 5510. https://doi.org/10.3390/su13105510