Abstract
Recently, there has been an increase in apartments with a large number of inhabitants, i.e., high residential density. This is partly due to a housing shortage in general but also increased migration, particularly in suburbs of major cities. This paper specifies issues that might be caused by high residential density by investigating the technical parameters influenced in Swedish apartments that are likely to have high residential density. Interviews with 11 employees at housing companies were conducted to identify issues that might be caused by high residential density. Furthermore, simulations were conducted based on extreme conditions described in the interviews to determine the impact on the energy use, indoor environmental quality, and moisture loads. In addition, the impact of measures to mitigate the identified issues was determined. Measures such as demand-controlled ventilation, increase of a constant ventilation rate, and moisture buffering are shown to reduce the risk for thermal discomfort, mold growth, and diminished indoor air quality; while still achieving a lower energy use than in a normally occupied apartment. The results of this study can be used by authorities to formulate incentives and/or recommendations for housing owners to implement measures to ensure good indoor environmental quality for all, irrespective of residential density conditions.
1. Introduction
In Sweden, over a million homes were built during the so called “million homes program”, 1965–1974, in order to manage the housing shortage and abolish poor housing standards [1]. During the last few years, the number of residents in many apartments in these buildings, especially in suburbs of major cities, has increased due to a housing shortage in general but also due to immigration [2,3]. The question is, how the increased number of residents, and thus the excess moisture load and increased indoor air pollution, will affect the risk of poor indoor air quality (henceforth IAQ) and moisture damage? The apartments from the million homes program were designed for a normal-sized family of two to four persons, with natural ventilation in many of the buildings [4], and in some buildings mechanical exhaust ventilation systems [4], primarily designed to ensure an air exchange in the apartment according to the Swedish building regulations at that time. However, the ventilation in many of these apartments is already insufficient at normal residential load compared to modern standards, since approximately half of them have air change rates lower than 0.5 ac/h [4], which approximately corresponds to modern requirements of 0.35 L/(s∙m2). A well-functioning ventilation system in a building is a prerequisite both for achieving good IAQ and thermal comfort. Carbon dioxide (henceforth CO2) is generally accepted as an indicator for the IAQ since other pollutants correlate to CO2 concentrations. The Pettenkoefer limit for CO2 of 1000 ppm is generally regarded as a limit to not be exceeded in order to maintain good IAQ. In support of this limit, a recent study suggested the possibility of direct negative health effects, even at such low CO2 concentrations [5].
Already in 1993, Markus [6] stated that overcrowding with inadequate ventilation increases the interior moisture load. To some extent, high residential density might lead to an increase of moisture load due to the increased presence of people, as well as an increase in moisture-generating activities such as cooking, washing, and showering, which may affect the building materials and systems. Moreover, according to results from interviews conducted by Boverket [7], high residential density leads to an increased quantity of furniture and other items in the apartment, which makes it more difficult to maintain a clean indoor environment, and which can affect the IAQ and lead to respiratory diseases. High residential density might thus restrict the placement of furniture, for instance furniture or curtains might be placed against poorly insulated external walls, which might act as interior insulation. In poorly insulated apartments with high residential density, there might be an increased risk for high relative humidity (henceforth RH), when the temperature on the interior surface of an external wall decreases in combination with a high moisture load. This leads to an increased risk of mold growth, as well as an increased risk of condensation. On biological materials specifically, the risk for microbial growth is significant when the RH exceeds 75% at room temperature [8].
One solution for dealing with the increased loads in indoor air might be a higher ventilation rate, which should decrease the moisture loads on the building materials and avoid high concentrations of indoor pollutants. To force the ventilation to higher levels than the system was designed for is probably possible with existing fans, but it is likely to cause noise and draughts indoors and will increase the energy use considerably. In cold climates, the ventilation energy use will approximately double if the residential load is doubled and the air change rate matches the load, but the absolute increase can be considerably reduced if heat-recovery is installed [9].
Through a search in international and Swedish databases several publications were found that relate to residential density (household size, family size) and the impact of this on the energy use of a building, indoor environmental quality, the well-being of the inhabitants, and risks. Papakostas, Papageorgiou, and Sotiropoulos [10] measured hot water use in Greece and investigated how “family size” relates to this. According to the study, hot water use per person increases with the number of family members, and a peak is reached with four family members. However, a figure in the article shows that with five or six family members, the maximum use is lower, and that with six family members, the average use is also lower. Johansson, Bagge, and Lindistrii [11] measured air flow and carbon dioxide concentration at a building level in Swedish buildings containing a total of 342 apartments, to determine the occupancy. In total, interviews were conducted in nine studies with regards to residential density. McCarthy and Saegert [12] investigated how residential density affected the residents’ perception of overcrowding, control, security, and privacy. Al-Nahari and Ballal [13] linked domestic accidents in Saudi Arabia to the number of family members through an interview study that included 654 people, of whom 231 had been identified as having had an accident at home. Papakostas and Sotiropoulos [14] interviewed 158 families in the suburbs of Athens regarding their housing, use of electrical equipment, and various user-related activities, in order to gather data for energy analyses. Popoola [15] interviewed 14 families in Malmö regarding overcrowding in order to map possible risk factors that may be associated with high residential density. The National Board of Housing, Building, and Planning [7], through annual surveys, conducted interviews with a selection of individuals from the Swedish population to shed light on welfare. The report links overcrowding with:
- practical problems such as lack of space, i.e., due to a larger amount of furniture, household items, etc. which leads to several other problems,
- stressors for both adults and children that can lead to physical and mental ailments,
- a financially stressful situation for those who are in a difficult situation,
- increased material wear,
- increased physical and mental ailments,
- homelessness, and
- problems with family formation.
Kubota, Surahman, and Higashi [16] conducted interviews with 544 families in Jakarta and Badung in Indonesia, to assess factors that may affect energy use with regard to the growing middle class and future energy needs. Ekstam [17] conducted survey studies from a sociological perspective, which showed that those who live in cramped conditions experience reduced freedom, which in the study was described as “the influence that the residents feel that they have over their housing situation, and how well they thrive”. Adebayo and Iweka [18] conducted a study to assess the variation in residential density in Lagos, Nigeria. Besides interview studies, there are those who linked household size with factors such as housing design [19], waste management [20], heating needs [21], hot water use [21], electricity use [22], household electricity use [20], water use [23,24,25], and children’s exposure to tobacco smoke [26].
The literature search revealed that there is a lack of research dealing with the impact of high residential density on energy use, building materials and components, HVAC systems, and the indoor environment. There is also a gap regarding how to design and manage apartments as a function of residential density. Therefore, this paper aims to contribute with knowledge on the impact of high residential density by investigating the nature and scope of issues related to overcrowded apartments, and by analyzing technical parameters that can be influenced by high residential density. Another aim of this study is to provide valuable guidance to authorities and help them formulate incentives and/or recommendations, and to provide valuable input to housing owners on mitigating measures. These measures include, for example, applying ventilation technology that improves the IAQ and ensures a good indoor environment for all, irrespective of residential density conditions.
This paper is an extended version of work published in [27]. We extend our previous work by (1) adding content to the introduction on previous publications regarding the topic of the paper and content found through a systematic literature search; (2) further clarifying results from literature reviews; (3) adding analyses of the impact of mitigating measures; (4) adding analyses of the impact on the energy use, indoor air quality, thermal comfort, and risk for mold growth; and finally (5) adding content to the discussion and conclusions of the study.
2. Materials and Methods
In order to contribute knowledge on the impact of high residential density on building systems and functionality, this study mapped issues in areas with higher-than-average residential density through interviews with housing caretakers. In addition, this study determined the impact of high residential density on energy use, IAQ, and the hygrothermal conditions of the building materials, through building energy performance, indoor climate, and hygrothermal simulations. Furthermore, through simulations the study also determined the impact of measures that might mitigate the impact of high residential density. Figure 1 shows a flowchart of the process of this study.
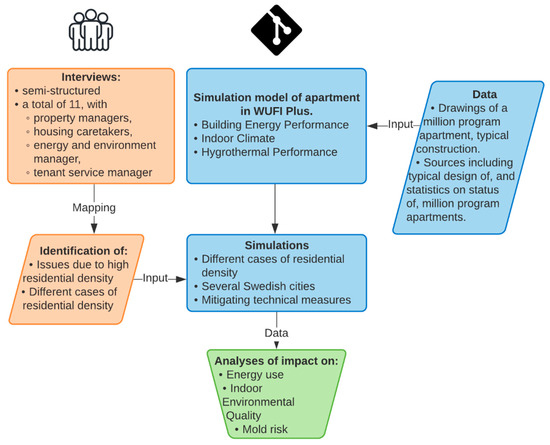
Figure 1.
Flowchart of process used in this study.
2.1. Semi-Structured Interviews
The first part of the study consisted of 11 semi-structured interviews with property managers, housing caretakers, an energy and environment manager, and one tenant service manager at their workplaces in areas that were known to have a higher-than-average residential density. Semi-structured interviews were conducted in order to allow the interviewees to speak freely and thereby gather as much information as possible from the limited number of interviews, but also to ensure the answers and information were connected to pre-formulated questions. Since the purpose of conducting interviews was to gain a general understanding of the issues that residential density can cause with regard to building functionality and management, it was important to obtain answers, but not to be restricted to pre-formulated questions. For this purpose, 11 interviews were considered enough, since they covered a variety of housing companies that together contributed to a sufficient, and reasonably coherent, description of the issues and challenges.
The interviews were mainly conducted with property managers and housing caretakers since they work closely with the buildings and the residents, which means that they are well-informed on the issues regarding building functionality and management that arise due to high residential density. The interviews were conducted with employees at several companies across southern Sweden, see Table 1. In order to exemplify the climatic conditions of the locations included in the interviews, Table 2 shows the climate of the city of Halmstad, which is one of the included cities and centrally placed with regard to the included cities. In six of the interviews, two of the authors were present; one leading the conversation based on pre-formulated questions and the other making notes and interjecting into the conversation. The other five interviews were conducted by one author. In every interview, pre-formulated questions were generally strictly asked in consecutive order, but interviewees were encouraged to elaborate and were also asked follow-up questions when relevant. The pre-formulated questions are included in the Appendix A and cover topics such as:

Table 1.
Type of company, location of residential area, and role of interviewees. Major city >200,000 inhabitants. Middle sized cities 50,000–200,000 inhabitants. Small cities <50,000 inhabitants. Cities have been anonymized to avoid identification of the different housing companies.
Table 2.
Showing the typical climate in Halmstad, Sweden. Data acquired from METEONORM [28]. RH: Relative humidity. Ta: Air temperature. H_Gh: Mean irradiance of global radiation horizontal. H_Dh: Mean irradiance of diffuse radiation horizontal. N: Cloud cover fraction. RH: Relative humidity. FF: Wind speed. DD: Wind direction. RR: Precipitation. Lin: Mean irradiance of longwave radiation incoming.
- ◦
- types of building
- ◦
- biggest challenges with the buildings
- ◦
- types of households
- ◦
- number of residents in each apartment,
- ◦
- problems with high/low residential density
- ◦
- residents experience of the indoor environment
- ◦
- types of complaint
- ◦
- performed measures to remedy complaints
- ◦
- moisture damages
- ◦
- types of ventilation system
- ◦
- measures to adapt the ventilation system
- ◦
- residents’ own measures or interventions in the apartment and possible consequences of these
- ◦
- possibility to adjust apartment to number of residents
- ◦
- the effect of high residential density on need of maintenance and wear of drainage and sewage
- ◦
- the effect of high residential density on wear and tear of interior materials
- ◦
- the interviewees’ own suggestions on possible technical solutions to overcome problems caused by high residential density
To structure the results from the interviews and facilitate interpretation, the problems that were mentioned by the interviewees were categorized by the authors. First, a categorization was made by deducing the most likely cause(s) of the problem, whether it was high residential density or the residents’ behavior. Second, each problem was categorized based on the most likely source of the problem, whether a high load on the building and its installations, or adjustments made by the residents. By categorizing problems in this way, it was easier to distinguish problems that were direct and indirect effects of high residential density, from problems that were caused by the behavioral habits of the residents.
2.2. Simulations
To determine the impact of high residential density on energy use, the IAQ, and the hygrothermal conditions of the building materials, simulations were conducted using a model of a Swedish apartment in WUFI Plus [29]. WUFI Plus is a building performance simulation software that can be used to determine the energy performance of a building, the indoor climate, and the hygrothermal conditions of the building materials in the building envelope. The software has been validated in several studies [30,31,32].
The simulation model used for the study was based on an apartment that was built in 1969; an apartment erected during the million homes program. The apartment has a structural design that is typical for the time period [33,34]. The apartment was chosen for these simulations as its building technology and building services are representative of the later part of the million homes program. The model in WUFI Plus was not based on any of the buildings discussed in the interviews. However, the interviewees mentioned that the apartments in which they have issues with high residential density were built between 1950–1980, which further supports the validity of the model. The simulations conducted in this study are therefore based on a single model of an apartment that is typical for the million homes program. As mentioned in the introduction, it is in apartments built during the million homes program that many apartments with high residential density can be found [2].
The model apartment consists of two bedrooms, one living room, one hallway, one kitchen, and one bathroom. It has 100 m2 (9.1 × 11.2 m2) living space area, and the height of the interior walls inside the apartment is 2.7 m. In Table 3, details on the building envelope of the apartment are described based on drawings provided by the property manager. As shown in Table 3, the simulations assumed a relatively vapor-tight surface for the interior and exterior surfaces that are (presumed to be) painted or otherwise (presumed to) have a relatively vapor-tight material (such as linoleum flooring). The model also assumes an adiabatic floor (“foundation”) and department-dividing wall since the modeled apartment represents a second (top) floor apartment.
Table 3.
Description of the building envelope of the simulated model, in the nominal case, as well as some details pertaining to the hygrothermal simulations. Based on blueprints for the apartment.
The outdoor climate for the simulations were acquired from METEONORM [35]; in the nominal case for the city of Malmö, and for comparison the climates for the cities of Gothenburg, Kalmar, Stockholm, and Luleå were also used in the simulations. For all cities nothing was changed except the climate data, i.e., orientation, construction design, usage, HVAC settings, etc. remained the same no matter which climate data was used for the simulation. The simulations included an initialization period of 365 days, and then a simulation period of one year. In the nominal case, the initial indoor temperature was set to 21 °C, initial RH to 50%, initial (outdoor) CO2 concentration to 400 ppm, and no cooling was applied. The set point for the heating system was set to 21 °C in the nominal case, which is a common temperature provided by building owners according to the interviewees. In the nominal case of four people, the heating period is between, and including, the months of September and May.
In order to compare the impact of different occupancies, the occupancy in the apartment was based on an existing daily schedule for a family of four in WUFI Plus named “Family Household (4 Persons)–Total–Weekday“, see Table 4. According to the description of this profile, it assumes that three persons are present 17 h/day and that the household includes 15 plants, two bathrooms, two showers per day, and four laundries in four days, as well as the use of one dishwasher. The schedule includes heat emission through convection and radiation in hourly average in W, moisture and CO2 production in g/h, and human activity in MET (i.e., metabolism: kcal/(kg∙h)). According to the description of the profile in WUFI Plus, data for heat emission per person was based on VDI 2078:1996 (DIN 1946-2) [36], and data for other heat sources was based on DIN V 4108-6 [37] and acquired from Nipkow et al. [38]. Furthermore, data for the moisture production was according to Kunze [39] and Lutz et al. [40]. Finally, data for the CO2 production was acquired from VDI 4300-7 [41]. In order to simulate an increased occupancy, the loads in this schedule (Table 4) were multiplied in order to match the number of people specified in three occupancy cases (cases 1, 2, and 3, see Table 5), of which case 2 (10 people) and case 3 (19 people) were based on information from the interviews.
Table 4.
Daily profile for internal loads used in model of apartment in WUFI Plus, “Family Household (4 Persons)–Total–Weekday“.
Table 5.
Simulation cases, with abbreviations and descriptions.
In the building-performance simulations, the apartment was modelled as a single zone with no interior walls. This was because the load profile that was used for an entire family of four in WUFI Plus is specified for a one-zone apartment, although there are specific profiles for specific rooms. However, since (to our knowledge) there exist no specific profiles or methods to account for a higher residential density, the profile for a family of four was multiplied and adjusted for the higher residential densities (10 and 19 people). If the model of the apartment was divided into rooms and specific load profiles for each room were applied, more details on the family/inhabitant composition, presence, and room usage would be needed when considering higher residential densities. For now, such detailed simulations do not fit the scope of this study.
The conducted simulations were mainly conducted for a comparative analysis of the impact of different variables. Thus, simulations were conducted based on different scenarios, or cases, in order to determine the impact of different residential densities and different measures on the resulting loads on the indoor air, and thus the impact on the building materials and the indoor environmental quality. All cases with descriptions and abbreviations are presented in Table 5. Simulations considering different mitigating technical measures were all based on case 3, which is the nominal model and with the highest residential density that was identified in the interviews (19 people). Furthermore, in order to determine the impact that a high density might have on the energy use at different Swedish locations, case 3 was also simulated with climate data from different locations (Gothenburg, Kalmar, Stockholm, Luleå).
In a study by the National Board of Housing, Building, and Planning [42], the average total air change rate of Swedish multifamily buildings was determined as 0.52 ac/h, and the average apartment in the study was built 1959. Considering this, the average total air change rate in the nominal model was approximated to 0.5 ac/h, and for all cases that did not apply a mechanical balanced ventilation system. Furthermore, such cases assumed a constant ventilation rate of 0.5 ac/h, which included the air infiltration as well. Thus, in such cases, the air infiltration in the model was set to 0 ac/h. However, in cases that apply mechanical ventilation, the mechanical ventilation rate was set to 0.5 ac/h and the infiltration ventilation rate to 0.35 ac/h, based on the minimal rates found in Swedish studies on similar buildings [4,42,43].
The simulations were analyzed regarding impact on:
- 1)
- the energy needed for space heating in the apartment,
- 2)
- the thermal comfort, by analyzing the temperature in the indoor air,
- 3)
- the IAQ by comparing the sum of hours that the CO2 in the indoor air exceeded the generally accepted Pettenkoefer limit (1000 ppm),
- 4)
- the moisture loads by comparing the sum of hours that the indoor air exceeded an RH of 75%,
- 5)
- the risk for condensation by comparing the sum of hours that the indoor air exceeded an RH of 99.9%, and
- 6)
- the risk for mold growth on interior surfaces using the Viitanen model [44].
3. Results
3.1. Semi-Structured Interviews
In the following Section 3.1.1, Section 3.1.2, Section 3.1.3, Section 3.1.4, Section 3.1.5 and Section 3.1.6, issues associated with high residential density are summarized by the authors and grouped based on their possible impact (increased risk for moisture and mold, diminished IAQ, increased wear and tear, increased dirt and waste, increased noise, and increased consumption). Furthermore, these issues are categorized by the authors in Table 6. The columns in Table 6 show the cause of the issue, i.e., whether the issue can be related to, or is known to be caused by, a high residential density (column A in Table 6) or by a certain behavior of the residents (column B in Table 6). The causes are then split up into the character of the issue, i.e., whether the issue is more likely (or is known to) be related to a high load on the building and its systems (row 1 in Table 6) or related to residents actively modifying the building and its systems (row 2 in Table 6). In Table 6, it can thus be concluded that issues in column A and row 1 (cell A1) are direct effects of high residential density, as these issues arise from the high residential density causing a high load on the building and its systems. Issues in cell A2 can instead be considered indirect effects of high residential density, since these issues are caused by residents modifying the building to cope with the high residential density. Issues in cell B1 and B2 are not caused by high residential density, but rather from certain behaviors that either cause a high load on the building (B1) or through which the building and/or its installations and functionality are modified (B2). Beyond distinguishing which issues are caused by a high residential density and which are not, these categorizations help separate issues that should be possible to remedy through communication with the residents (e.g., change of behavior and removal of interference) from those that might require technical measures (e.g., altering the building to accommodate a higher moisture load). In addition, in the interviews several extreme examples of behavior and high residential density were revealed: these are summarized in Table 7. In Section 3.1.1, Section 3.1.2, Section 3.1.3, Section 3.1.4, Section 3.1.5 and Section 3.1.6 below, the interview results are summarized and the issues more thoroughly described. After every summary follows a paragraph in italics explaining the authors reasoning for each issue’s categorization in Table 6.
Table 6.
Categorization and summary of the issues (compared to normal) caused by high residential density and behavior noted in the interviews.
Table 7.
Examples of extreme situations with high density revealed by the interviewees.
3.1.1. Moisture and Mold
Increased shower frequency. Buildings from the million homes program were designed for the habits of that time. According to several interviewees, it was common to design bathrooms and ventilation systems based on the assumption that each resident showered twice a week. Moreover, according to the interviewees, it is not uncommon that residents today shower once a day. Some of the interviewees note mold growth in the ceiling-wall corner of the bathroom and believe it to be caused by the increased shower frequency.
Even when the residential density is not high, contemporary showering habits contribute to moisture loads that exceed the tolerance of the existing building materials. Similarly, an increased residential density should result in an increased shower frequency which also increases the moisture loads in the bathrooms. The issue of moisture and mold from increased shower frequency is thus categorized in cell A1 and B1 in Table 6.
Crowded bedrooms. The interviewees describe that several people often sleep in the same bedroom in crowded apartments, with examples of up to six persons sleeping in one room. They noted that, due to the excessive generation of moisture, walls are sometimes found to be “almost wet” and that mold in some cases is found in the ceiling-wall corner, especially at thermal bridges at junctions of two external walls and a ceiling. Furthermore, when beds are placed next to outer walls due to crowdedness, some interviewees noted findings of condensation, grease, and/or mold on the wall next to the bed.
Since high moisture loads caused by crowded bedrooms (with consequential mold growth) is primarily deemed to be an issue associated with high residential density, it is categorized in cell A1 in Table 6.
Insufficient drain capacity. A high residential density places a high stress on the drains. One interviewee described that the high residential density often causes issues with the drains in a high-rise building with eight apartments per floor and 16 apartments per drain.
Since this issue is directly related (by the interviewee) to a high residential load on the drains, it is categorized in cell A1 in Table 6. However, it is important to note that such issues might also be caused by old sewage pipes in apartment buildings with normal loads.
Clogging of drains. One interviewee describes clogged drains due to disposal of inappropriate waste in toilets. The interviewee does not believe this to be a consequence of high residential density, but rather an issue of behavior. Other interviewees also mentioned that disposal of oils and fats in the kitchen sink causes clogging of drains, which is an action they believe to be mainly behaviorally conditioned.
Clogging of drains appears to primarily be an effect of residents’ behavior and is thus categorized in cell B1 in Table 6.
Longer cooking times. Some interviewees state that many households cook meals for longer time periods, meaning that a simmering pot could be on the stove all day long.
It is likely that longer cooking times generate a significant amount of moisture in the air. However, this issue is more associated with behavior rather than residential density, since we assume that high residential density has greater effects on cooking frequency rather than cooking time (refer to the following paragraph). This issue is thus categorized in cell B1 in Table 6.
Higher cooking frequency. With a higher residential density, food is more likely cooked more frequently than with a low residential density. Interviewees stated that a high residential density leads to more frequent and more extensive cooking. They also stated that cooking is more frequent when several different households lived in one apartment, since this leads to two or three dinners being cooked separately each night, instead of just one. Interviewees noted that this contributes to high moisture loads in the kitchen when kitchen ventilation is insufficient.
Since moisture loads from high cooking frequency are found to primarily be an issue associated with high residential density, it is categorized in cell A1 in Table 6.
Washing and drying laundry in the apartment. One interviewee mentioned that residents sometimes wash their laundry in the bathtub, and several interviewees noted laundry hanging to dry in the apartments, sometimes leading to condensation on the windows. The interviewees did not deem this to be a direct consequence of high residential density, but some interviewees assumed that residents in areas with a high residential density have difficulty finding slots in the common laundry room and thus sometimes do their laundry in the apartment.
Since moisture loads from washing and drying laundry in the apartment can reasonably be caused by high residential density as well as behavior, this issue is categorized in cell A1, as well as in cell A2 in Table 6.
Bathtub removed. It is common to have a bathtub in older apartments. Some interviewees noted that residents prefer to remove the bathtub so that they can stand directly on the floor when showering. However, since bathrooms in Swedish buildings from the million homes program were not designed for showering, interviewees state that it is not uncommon that the removal of a bathtub leads to water leakage through, or damage to, the bathroom floor. Interviewees did not believe this issue to be connected to high residential density, but rather to residents’ behavior.
Since issues with moisture issues caused by removal of a bathtub are not considered to be associated with high residential density, but rather by modified building usage, this issue is categorized in cell B2 in Table 6.
3.1.2. Indoor Air Quality
Additional walls are put up that block airflow. Several interviewees described apartments where additional walls are installed by the residents to divide rooms into smaller sections that could constitute “bedrooms” for residents. According to one interviewee, the sectioning of a room is in many cases performed in a way that blocks the airflow from one part of the original room to the other, thus contributing to an impaired indoor environment.
Since putting up extra walls appears to be a way for the residents to increase the number of bedrooms in the apartment, this issue is categorized as an indirect consequence of high residential density, placing it in cell A2 in Table 6.
Residents seal fresh air inlet to alleviate issues with draught. Almost all interviewees described extensive problems with residents sealing their fresh air inlets as a means to alleviate issues with draught in the indoor environment. Some interviewees stated that this is especially a problem when residents sleep near air inlets, which is more likely to occur when space is limited in the apartment.
Sealing the air inlets results in a decreased air change rate, and it most likely also leads to higher moisture loads and pollutant concentrations. Although some interviewees noted that this issue is more common when the residential density is higher, the occurrence of the issue seems to be common. Thus, it is categorized as a behavioral issue caused by modifications by the residents, placing it in cell B2 in Table 6.
Heavy curtains block the window. Many interviewees described that some residents hang heavy curtains in front of the windows; in some cases, to alleviate issues with draught, and in some cases for privacy. The interviewees stated that the consequence of this is that mold is often found behind the curtains around the window.
Since mold growth behind curtains is described as caused by behavioral habits, this issue is categorized as a behavioral issue caused by modifications by the residents, placing it in cell B2 in Table 6.
Furniture is placed against windows and outer walls. According to the interviewees, similarly to the issue with heavy curtains, furniture is often found placed close to outer walls, causing condensation and mold growth on the wall. One interviewee claimed that the amount of furniture (e.g., beds) is closely related to the residential density, meaning that furniture close to windows and walls is more common in densely occupied apartments.
Like the curtains, this issue is not directly connected to high residential density. However, high residential density was thought to, and is likely to, contribute to an increased amount of furniture (especially beds/matrasses), which in turn increases the occurrence of furniture being placed close to outer walls. Thus, this issue is categorized as a modification in the building functionality, potentially being caused by both a high residential density as well as behavioral preferences, placing it in cell A2, as well as in cell B2 in Table 6.
3.1.3. Wear and Tear
Apartment interior surfaces. Most of the interviewees stated that interior surfaces (such as floors, walls, wallpapers, doors, and skirting boards) in apartments need repairs and/or replacements more frequently when the residential density is high. Several interviewees emphasized that families with many children brought about an especially high wear and tear to the interior surfaces simply due to the playfulness of the children.
Increased wear and tear of interior surfaces was (by the interviewees) generally associated with high residential density. However, as the wear in apartment usage is subject to great individual variation, the issue of excessive wear and tear is categorized as a high load on the building interior potentially caused by both high residential density as well as behavioral habits, placing it both in cell A1 as well as in cell B1 in Table 6.
Kitchen white goods. The interviewees stated that, apart from the interior surfaces, kitchen whitegoods such as stoves, fridges, and freezers are also exposed to high wear and tear when the residential density is high. The wear and tear are assumed to be caused by more frequent cooking; due to this one interviewee said that the kitchen whitegoods had to be replaced with shorter intervals (every four years).
Following the same reasoning as for wear and tear of interior surfaces, wear and tear of kitchen white goods is categorized in cell A1 as well as in cell B1 in Table 6.
3.1.4. Dirt and Waste
Dirtying. Several interviewees describe that they observed issues with dirtying of the apartments. They stated that, due to this, sometimes there is an accelerated growth of mold on dirty surfaces, and that sometimes the dirt causes an increased wear and tear of the apartment interior. However, interviewees emphasized that dirtying is not connected to high residential density, since their own observations suggest that there are great differences in dirtying between households of all sizes.
Whether the cause of this issue is a lack of cleaning, or a high load of dirt, this issue was primarily associated to behavioral habits (by the interviewees) and not high residential density, and thus is categorized in cell B1 in Table 6.
Difficulties sanitizing vermin. Some interviewees noted that high residential density might be an obstruction when sanitizing vermin. Interviewees claim that this is because sanitation often requires cleaning and removal of furniture and belongings from the walls, which is a task that might be obstructed by a high number of beds/mattresses. Similarly, interviewees mentioned that the high number of residents and beds/mattresses makes it more difficult to evacuate specific rooms for sanitation, since the rest of the apartment is not always big enough to fit the beds/mattresses for everyone in the household.
Since difficulties in sanitizing vermin can be aggravated by the obstruction that a large amount of furniture can pose, and since a large amount of furniture can be caused by a high residential density, this issue is categorized in cell A1, Table 6. However, since a large quantity of furniture may also be due to residents’ preferences, this issue is also placed in cell B1, Table 6.
Accumulation of waste and bulky waste in staircases. Several interviewees mentioned problems associated with the high generation of waste that follows high residential density. Most common among the issues is the accumulation of waste and bulky waste in staircases. Several interviewees stressed that this contributes to a messy appearance, besides constituting a fire hazard and a hindrance in case of evacuation.
Although high residential density contributes to the high generation of waste, whether the waste is disposed of properly or not can also be associated with the residents’ behavior. This issue is thus categorized in cell A1, as well as in B1, in Table 6.
3.1.5. Noise
Noise from neighbors. Several interviewees stated that they receive complaints regarding noise from neighbors. The noises can be from running (often playing) children, or from arguments, but the interviewees also emphasized that there are great differences among households, where some crowded households generate a lot of noise and other crowded households do not. Moreover, there are also differences in whether such sounds are perceived as disturbing (noise) or not.
Since noise can be generated due to high residential density, as well as due to individual behavior, this issue is categorized in cell A1 and B1 in Table 6 (row 1, since noise can be perceived as a “high load”).
3.1.6. Consumption
Residents install extra appliances. Some interviewees observed that some households with a high residential density install extra appliances such as white goods and washing machines in order to adjust to the high residential density. One interviewee even described a case where an extra kitchen was installed in such an apartment.
Extra appliances are likely to contribute to an increased use of electricity and water (and thus an increased moisture load). This issue is therefore categorized as an indirect consequence of high residential density due to residents modifying the apartment to cope with their needs, placing it in cell A2, Table 6.
High water use. Many interviewees suggested that there is a correlation between water usage and the number of residents in an apartment. One interviewee, who works in an area with high residential density, claimed to know that the area has the highest water use in the city. Most interviewees described that water use is not measured per household in the area they work in, but many considered individual metering and billing of water to be a promising method to reduce water use.
High water use is identified as a direct consequence of high residential density, but water use is also subject to great individual variation. This issue is thus categorized in both cell A1 and in cell B1 in Table 6.
3.2. Simulation Results
3.2.1. Energy Use
Results for the energy used for space heating are shown in Figure 2 and Figure 3 in kWh/m2 for the living space area. It is quite clear that the energy needed for heating the living space area decreases with increasing residential density. This in turn can be explained by the increase in the sum of the internal heat source which is 46.4 kWh/m2 with 4 persons, 116.1 kWh/m2 with 10 persons, and 220.7 kWh/m2 with 19 persons.
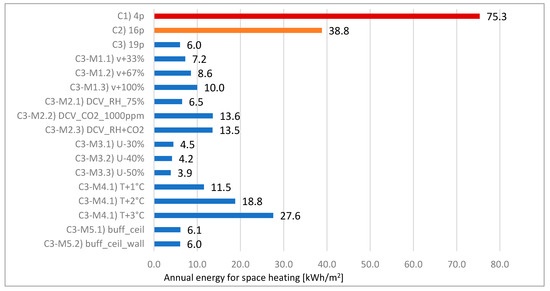
Figure 2.
Annual energy used for space heating in the different scenarios (Malmö).
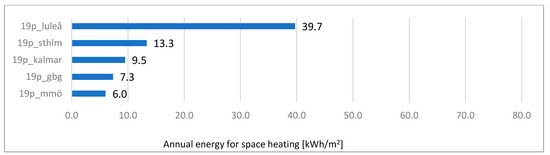
Figure 3.
Annual energy used for space heating in scenario C3 19p at different locations.
The results also show the impact of different measures on energy use. The only measure that decreases the energy use is reduction of the transmission losses through the exterior walls, while all other measures increase the energy use (although some only marginally). It must, however, be noted that the mechanical ventilation systems deployed in these scenarios included heat recovery.
Finally, these results also show clear differences between locations, which is due to a generally colder outdoor climate further north in Sweden.
3.2.2. Indoor Environmental Quality
Figure 4 shows how the temperature of the indoor air is affected during the winter and during the summer by increased residential density. During the winter this causes no issues with regard to the indoor environmental quality (henceforth IEQ), but during the summer, temperatures can become quite high and might cause discomfort unless the inhabitants open windows, which is a habit that was not been included in these simulations. What may also be noted is that the temperature is higher in general during the summer, and that the peaks within the graph are higher both during the winter and the summer. Furthermore, temperatures peak at several different times during the day, but are especially high towards the evening. Table 8 details the increase in risk of discomfort due to high temperatures based on the sum of annual hours that a certain degree is exceeded. It is quite clear that the number of inhabitants increases the number of hours and with that the risk of discomfort due to high temperatures. The table also includes measures that have a clear impact on the values in case 3, which are, in general, all measures that increase the ventilation rate in one way or another. Of these measures, the most effective is the demand-controlled ventilation (henceforth DCV) system, although it is not controlled by the indoor air temperature. However, it must be noted that none of these measures target the indoor air temperature and that such measures would probably reduce the risk of discomfort due to this parameter even further.
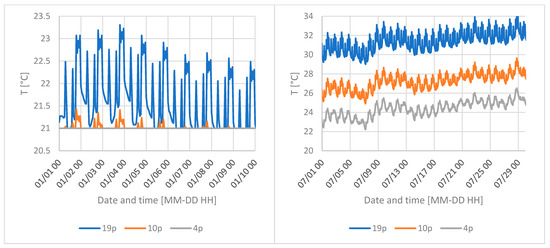
Figure 4.
Resulting indoor air temperature during 10 days in the winter (left) and ten days in the summer (right). The legend in the bottom shows case abbreviations with line coloring.
Table 8.
Annual sum of hours during which the temperature exceeds a certain value for the indoor air. The table includes density differences, as well as measures that clearly affect the parameter.
Figure 5 shows the resulting CO2 concentration in the indoor air during one day, which varies marginally over the year. The higher density increases the overall CO2 concentration and especially the peaks, which can reach values much higher than 1000 ppm. Table 9 details the risk of discomfort through the sum of annual hours during which certain concentrations of CO2 are exceeded. The risk is increased both for the profile including 10 people and for the profile including 19 people. The table also includes the measures that have a clear impact on the values in case 3; measures that increase the ventilation rate in one way or another. The results show that even a doubling of a constant ventilation rate is not sufficient to eliminate the risk of exceeding 1000 ppm over longer time periods. The most effective measure is a DCV system controlled by the CO2 concentration with a set point of 1000 ppm.

Figure 5.
Resulting CO2 concentrations during one day (24 h). The legend in the bottom shows case abbreviations with line coloring.
Table 9.
Annual sum of hours during which the CO2 concentration exceeds a certain value.
3.2.3. Moisture Loads and Risks
The results show that increased residential densities increase the RH in indoor air. Figure 6 shows the RH in the indoor air during a winter day and a summer day with different residential densities. With a normal density (4p) the RH does not exceed 75%, which does not entail a risk of damage to interior surfaces. With a higher density (10p or 19p) the moisture load is generally much higher, even reaching the point of condensation (100%) for two to four hours per day. During the summer, the loads are lower in general.
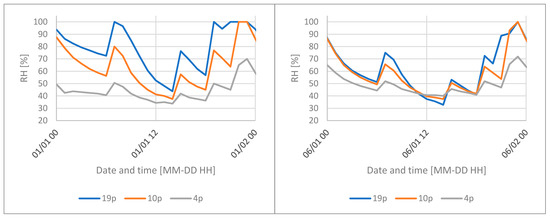
Figure 6.
Resulting RH of indoor air with different residential densities, during a winter day (left) and summer day (right). The legend in the bottom shows case abbreviations with line coloring.
Table 10 shows that with a density of more than four persons in a two-bedroom apartment, the RH of the indoor air exceeds 75% for a large number of hours annually, even in the nominal case (4p), and that this is increased with increasing residential density. Furthermore, the table shows that the number of hours during which the RH of the indoor air exceeds 99.9% also increases with residential density, entailing an increased risk of condensation on interior surfaces. The table also includes the measures that had a clear impact on the values in case 3, which are the measures that increase the ventilation rate in one way or another, as well as those that allow the walls and ceiling to act as buffers for the moisture in the indoor air. With these buffers, the risk for condensation is eliminated; however, the sum of hours during which the moisture load (>75%) is exceeded is greater. With an increased constant ventilation rate, the load is reduced in general, and the most efficient measure with regard to the RH of the indoor air is a DCV system controlled by the RH.
Table 10.
Sum of annual hours during which RH is below or exceeds a certain value for the indoor air.
Interestingly, Table 10 points to a benefit with increased density, and that is that the number of hours during which the RH is below 30% is reduced with the increasing number of people in the apartment. However, the table also shows that using the walls and ceilings as moisture buffers is even more beneficial with regard to this parameter.
Figure 7 shows the resulting T and RH at the interior surface of the exterior walls with a gypsum board. The observations made for Figure 4 and Figure 6 can be made for these graphs. However, a slight difference between Figure 6 and Figure 7 can be noted during the winter day, and a larger difference during the summer day. The RH on the surface of the wall is higher, which is to be expected since the surface has a slightly lower temperature than the indoor air (compare Figure 7 with Figure 4). Table 11 details the difference in moisture loads between the scenarios on a yearly basis through the sum of annual hours during which 75% and 99.9% is exceeded. The table indicates that there might already be a risk of moisture damage with the nominal load (4p), which increases with residential density. The table also shows the results from the simulations that deployed measures that had a clear impact on the results. All measures that increased the air change rates, reduced the RH on interior surfaces, and the DCV had the highest efficacy with regard to this parameter, especially if controlled by the RH of the indoor air. What also made a difference was using the walls and the roof as a moisture buffer. Finally, insulating the exterior walls or increasing the indoor air temperature, and thereby increasing the surface temperature, also reduced the risk, but only marginally.
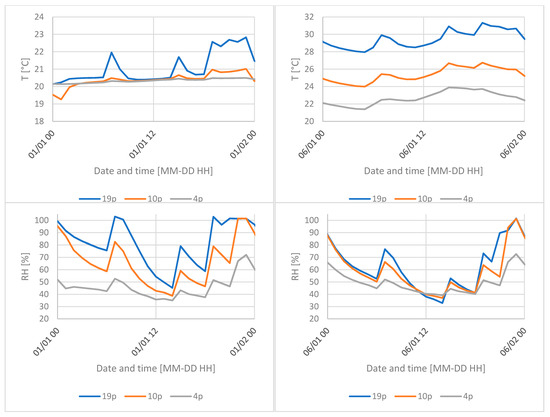
Figure 7.
Resulting T and RH at the interior surface of the gypsum board during a winter day (left) and a summer day (right) with different residential densities. The legend in the bottom shows case abbreviations with line coloring.
Table 11.
Annual sum of hours during which RH was exceeded at the surface of the gypsum board. *3228 at thermal bridge.
Figure 8 shows the mold growth risk index for the interior surface of the exterior walls with a gypsum board, based on the VTT model [44]. This analysis applies the sensitivity of pine sapwood according to the ASHRAE standard in order to account for biological contaminants on the surface. An index above 1 indicates mold growth that is visible under a microscope. The figure clearly shows that the risk increases with the increased density (blue, green, and cyan lines). Furthermore, it shows that the risk is significant (>1), even when 10 people reside in the apartment. It also shows that several measures decrease the risk significantly (<1). However, some decrease the risk but still obtain an index above 1: buffering only with the ceiling, adding insulation, and increasing the indoor air temperature. The risk is low (<1) or non-existent with all ventilation measures, even with a small increase of the ventilation rate (+33%).
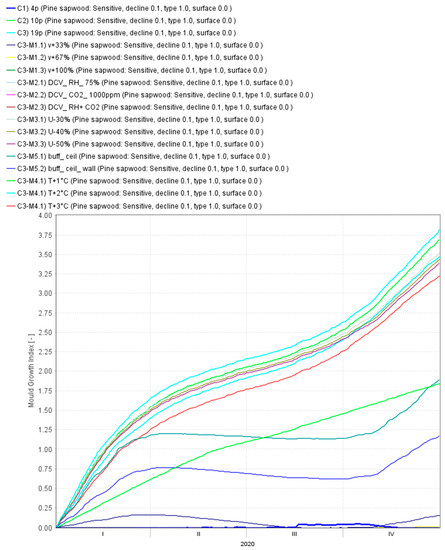
Figure 8.
Resulting risk for mold growth according to the VTT-model, an index above 1 indicates mold growth visible with a microscope.
4. Synoptic Discussion
Interviews. As suggested by the results in Table 6, most problems associated with a high residential density were directly linked to the high load that the residents place on the building and its systems. Only in a few cases were problems identified to be caused by interfering adjustments made by the residents. Moreover, many problems associated with high residential density were also associated with behavior, meaning that the behavior of the residents can reduce or aggravate the issues, and high residential density does not always have to be the cause of these problems. Consequently, depending on the type of problem, either technical or behavioral solutions can be applied. Based on the interviews and the analyses, several possible measures that can improve the indoor environment in apartments with high residential density are suggested.
The issues listed that were identified as being caused by high residential density and the subsequent high load on the building (cell A1 in Table 6) are issues that require technical adjustments to the building in order to ensure an adequate indoor environment and minimize the risk of damage to the building and its materials. Many of the issues that were placed in this category can be confirmed by results from previous studies, e.g., Boverket’s study [7] also found issues with moisture and mold, wear and tear, and dirt and waste. However, the mentioned study [7] lacked the level of detail regarding the causes and consequences of issues that are provided in this study, and that arguably is needed to suggest effective solutions.
One way to reduce wear and tear is to choose durable interior materials, for example paint instead of wallpaper and robust interior doors and cabinet doors. Furthermore, while monitoring of the indoor air temperature is frequently conducted by the housing companies, it can also be of interest to monitor RH and CO2, especially in bedrooms. The property manager would thus be informed when RH exceeds a value related to an increased risk for microbial growth and when CO2 concentrations exceed values that are related to risks regarding the residents’ health and well-being. Such monitoring would allow the property manager to act and help remedy the poor indoor environment.
The results of issues related to residents’ behavior and a high load on the building (cell B1 in Table 4) have a large overlap with the results in cell A1 and can thus also be supported by previous findings. Results regarding the residents’ modifications of the building (cell A2 and B2) were however unprecedented in previous studies and thus add to our understanding of issues that can arise from high residential density and how to alleviate them. It is possible that the issues listed as caused by the behavioral patterns of the residents (cell B1 and B2 in Table 4) can, at least to some extent, be remedied by communicating with and informing the residents. Likewise, it is possible that issues listed as caused by interventions conducted by the residents (cell A2 and B2) can be remedied by informing the residents of the risks related to such interventions. It is also possible that such issues might (in some cases) be remedied by providing a better solution to the problem the residents are trying to solve themselves. For example, the results from the interviews revealed that it was common that residents blocked air inlets to deal with draughts. By informing the residents of the importance of having the air inlets open, the ventilation could be improved. This communication should be facilitated by a good relationship between the housing caretaker and the tenants. Such a good relationship also comes with benefits, such as prompt reports of errors or problems. Moreover, it is of great importance to help residents understand the functions of the apartment and its systems (ventilation, drainage, and kitchen exhaust fan) and also to advise on beneficial behaviors and furnishing, such as window opening, cooking procedures, fat separation, food storage, waste handling, sewage treatments, cleaning and drying laundry, and placement of furniture and curtain sets. One solution might be to provide instructions for the usage of the apartment to the tenants. Finally, informing residents of the importance of the frequent and well-organized handling of bulky waste can be an effective solution to avoid the feeling of untidy environments and insecurity, and also to decrease the risk of fire in staircases.
The results from the semi-structured interviews helped form a general picture of the challenges regarding building functionality and maintenance in buildings with high residential density. Although research has been conducted on how high residential density affects residents and their social life, the impact of high residential density on buildings’ technical functionality remains an overlooked issue, which is why a first overview of such issues is provided in this study. The interview results should thus be considered as a first glance at issues that can arise, and although only 11 interviews were conducted, these interviews were comprehensive and provided a coherent picture of several common issues. However, in order to accurately determine the occurrence of different issues, more interviews should be conducted. Finally, by conducting semi-structured interviews the study could not ensure that all interviewees were asked the exact same questions, since follow-up questions varied depending on interviewees’ answers. Neither could it ensure that all topics were brought up in every interview. The inherent variance of the methodology thus contributed to a broad collection of information, suitable for the purpose of the interview study, but did not allow for determining the general occurrence of different issues.
Simulations. The results from the simulations, which were based on extreme examples from the interviews, show that the identified situations of high residential density lead to a clearly increased risk of high indoor air temperatures during the summer, high CO2 concentrations in general, high moisture loads (RH of indoor air), and an increased risk of mold growth on interior surfaces due to high RH and interstitial condensation. However, the results do not only show disadvantages with increased residential density, but also some benefits, such as energy savings on space heating, and an increased minimum RH, which should mitigate dryness in the indoor air and the disadvantages that come with it. Increased residential density should also mitigate housing shortages, as well as reduce resource scarcity.
The simulation results showed that there are several measures that can be applied in order to mitigate the simulated disadvantages of increased residential density; however, at the cost of an increased energy use. Among the measures investigated, a demand-controlled system controlled by both CO2 and RH shows the most promise, followed by control by just CO2 or just RH, then an increase in a constant ventilation rate, and finally using the ceilings and the roof for buffering moisture. However, these measures increase the energy use of the apartment substantially in comparison with not implementing them (case 3). However, in comparison with a normally inhabited apartment (case 1), less energy is needed for space heating in an apartment with a high residential density, while simultaneously implementing any one of the simulated measures. What shows the least promise is the use of exterior insulation or increasing the indoor air temperature. The former should increase surface temperatures and thereby the RH on the interior surface on the exterior walls, but the impact of the amount of insulation that was tested was marginal. Perhaps more insulation is needed for a clear impact. The latter should not only increase the indoor air temperature, but also the temperature on the interior surfaces, which should reduce the RH. However, the increase in air temperature showed only marginal differences. Perhaps a higher increase might contribute to a distinct difference. However, a higher indoor air temperature is unrealistic since that would further increase issues with too high indoor air temperatures. Besides the simulated measures, other measures could be to install water-saving nozzles, which should reduce the amount of water introduced into the indoor air and thereby reduce the moisture loads. Finally, it is important to design and place air inlets to allow for furnishings close to the outer wall without causing issues such as condensation or discomfort for the residents.
What the simulations cannot show is the risk of noise from the mechanical ventilation system, which increases with the air change rate unless the system is designed for higher airflows. Furthermore, they do not show the impact of window opening, which should mitigate the issues mentioned above, but also decrease the advantages (energy savings, increased minimum RH) that come with an increased density, as mentioned above. In addition, they do not show the impact of the increased density on the water use or the energy needed to heat water. Additionally, simulations do not consider measures that were not possible to simulate, such as individual metering and billing of water, or water-saving showerheads, etc. Finally, the profile used to simulate the impact of an increased density was based on a four-person family and according to several accepted standards. To assess the impact of the increased density, the values within the profile were multiplied (amplified) to fit the number of people in the identified cases. This is a simplification of reality since the behavior of the inhabitants in an apartment with high residential density might not at all conform to the amplified profiles. The sum of the loads for one day might be the same, e.g., the moisture load due to the number of showers, however, the peaks might not be as large as the amplified profiles suggest and might be spread out over a longer period. The results might therefore show a worse situation than could be expected. Furthermore, it might be assumed that the inhabitants in an apartment with high residential density are not equally present in the apartment as in an apartment with normal presence, due to possible discomforts, as identified in the interviews. Thus, the loads in general might be lower, as well as the possible risks and benefits that come with a higher density. It is however likely that the current COVID-19 pandemic is aggravating issues with the indoor environment in residentially dense apartments, since alternative sites for recess and recreation are limited and residents are requested to stay at home. Under these circumstances, it is thus possible that the results in this study represent a fair reflection of reality. The simulation results are however supported by observations from the interviewees who have seen condensation and mold in resident-dense apartments. However, some of the results from the simulations did not appear in the interviews. Such as the diminished IEQ. Thus, it is important to increase knowledge about measures that can help assure an adequate indoor environment for the residents and minimize the risk of damage to the building in resident-dense areas.
5. Conclusions
The study set out to determine the impact of high residential density on apartment building materials and components, the HVAC systems, and the indoor environment. This paper has successfully done so through interviews with housing managers and caretakers from several Swedish housing companies, as well as building energy performance simulations and hygrothermal simulations.
The interviews showed several disadvantages with high residential density, such as increased: moisture loads (due to, e.g., increased shower and cooking frequency), wear and tear of apartment interiors and white goods, dirt and waste, water use, and noise. The simulation results showed an increased risk for discomfort due to high temperatures during the summer, health risks due to diminished IAQ (higher CO2 concentration), as well as an increased risk of mold growth due to high RH and interstitial condensation. The results also show two advantages of a higher density: decreased energy use for space heating and an increased minimum RH (and thus a decreased dryness in the indoor air, which is also known to have disadvantages); for typical apartments from the million homes program with natural ventilation and residential densities higher than a family of 4 people at 100 m2. The simulation results further showed that several technical solutions might be applied to mitigate the disadvantages, while keeping the benefits of the increased residential density. The most promising of the simulated measures were those that in one way or another increase the ventilation rate, such as a DCV system, or an increase of the ventilation rate in a constant air volume system. In addition, allowing moisture buffering with the existing walls and ceilings might also help mitigate possible issues due to high moisture loads to some extent, but not as efficiently as DCV, which in this article was shown to be the most beneficial measure.
In future studies the impact of increased residential density should be measured through field studies. Such measurements might also aid in determining more realistic user profiles for building energy performance simulations and hygrothermal simulations. Furthermore, the impact of a higher density on, e.g., the energy use and the IEQ, as well as the impact of different measures to mitigate its disadvantages, should also be determined through measurements. In addition, the impact of the simulations could be extended to more than the one type of apartment that was typical for this study, i.e., typically has a high residential density. Furthermore, a larger number of cases might be considered in future simulations. Finally, other types of simulations might also consider the impact of high residential density on the risk of mold growth on the interior surfaces of thermal bridges. Besides more comprehensive, or other types of, simulations, further interviews or survey studies could be conducted in order to determine the extent of the issue in Sweden.
The results of this study could be used by authorities to formulate incentives and/or recommendations and for housing owners to implement measures such as applicable ventilation technologies that improve the IAQ and ensure a good indoor quality for all, irrespective of residential density conditions.
Author Contributions
Conceptualization, K.M., D.J., H.B. and A.A.H.; methodology, K.M., D.J., H.B. and A.A.H.; formal analysis, A.A.H., J.v.P. and K.M.; investigation A.A.H., J.v.P. and K.M.; data curation A.A.H., J.v.P. and K.M.; writing—original draft preparation, A.A.H., J.v.P. and K.M.; writing—review and editing A.A.H., J.v.P., K.M., D.J. and H.B.; visualization, A.A.H., J.v.P. and K.M.; supervision, D.J. and K.M.; project administration, D.J.; funding acquisition, K.M., D.J. and H.B. All authors have read and agreed to the published version of the manuscript.
Funding
This research was funded by the Swedish Energy Agency, program E2B2 grant 47826-1.
Institutional Review Board Statement
Not applicable.
Informed Consent Statement
Not applicable.
Data Availability Statement
Please refer to suggested Data Availability Statements in section “MDPI Research Data Policies” at https://www.mdpi.com/ethics, accessed on 11 May 2021.
Conflicts of Interest
The authors declare no conflict of interest.
Appendix A
Questionnaire
- 1)
- Tell us about your buildings?
- 2)
- Tell us about the residents in your buildings?
- 3)
- Which are the greatest challenges/problems in these buildings?
- 4)
- Do you know the number of residents in every apartment, or are there hidden statistics; if so, do you expect your estimations to be too high or too low?
- 5)
- Do you have problems connected to high residential density?
- 6)
- Do you have problems connected to low residential density?
- 7)
- Do you know how the residents perceive their indoor environment?
- 8)
- Do you get complaints, and if so, about what? (noise from neighbors, moisture/mold, odors from cooking or smoking etc.)
- 9)
- Have you undertaken any measures based on potential complaints; is it problems that can be remedied?
- 10)
- Do you have moisture related problems or damage?
- 11)
- Have you undertaken any measures to alleviate potential moisture-related problems?
- 12)
- What ventilation system do you have in buildings with high residential density?
- 13)
- Have you had to undertake any measures to adapt the buildings to a high residential density (e.g., increase ventilation)?
- 14)
- If no to question 13, have you noticed if the residents themselves have undertaken measures to adapt their living environment according to their own preferences, owing to the insufficient indoor environment?
- 15)
- If yes to question 13, have these measures caused consequential problems? (e.g., complaints of increased noise from increased ventilation, or complaints of draught and cold/low thermal comfort/low temperatures.)
- 16)
- If yes to question 15, have you noticed if residents themselves have undertaken measures to adapt their living environment according to their own preferences owing to issues arising from measures? (For example blocked fresh air inlets or supply air inlets/ducts)
- 17)
- Do you have individual metering and billing of energy for domestic hot water or heating?
- 18)
- If yes to question 17, what is your perception of the effect individual metering and billing has had on water use or energy use for heating?
- 19)
- Relating to question 18, do you have data that could be shared regarding individual metering and billing?
- 20)
- Have you measured/logged temperature or relative humidity in apartments with high residential density?
- 21)
- Do you have access to household electricity use per apartment in your buildings?
- 22)
- If no to question 21, have you measured the total electricity use per building in your building portfolio?
- 23)
- Do you have a register of living area, number of rooms and number of residents per apartment (relating to questions 18–22)?
- 24)
- Can your buildings be adapted based on the number of residents? If not, is there potential to reconstruct the buildings to achieve such adaptability?
- 25)
- Have you noted if high residential density has caused increased maintenance on the sewage system? (E.g., through more frequently clogged drains.)
- 26)
- Have you noticed if high residential density has caused increased wear and tear of sewage and drains?
- 27)
- Have you noticed if high residential density has caused increased wear and tear of interior materials in apartments? (E.g., doors, windows, walls, etc.)
- 28)
- Do you believe there could be technical solutions to some of the issues? If so, which?
- 29)
- What support would you need to improve the function of the buildings?
- 30)
- Other comments?
References
- Allmännyttan. 1946–1975 Allmännyttan Byggs ut och Bostadsbristen Byggs Bort-SABO Allmännyttan. Available online: http://www.allmannyttan.se/historia/historiska-epoker/1946-1975-allmannyttan-byggs-ut-och-bostadsbristen-byggs-bort/ (accessed on 24 November 2020).
- Von Platten, J. From Housing Inequalities to an Unjust Energy Transition-Data-Driven analyses of Socio-Technical Links. 2020. Available online: https://portal.research.lu.se/portal/files/86948171/Jenny_von_Platten_Licentiatavhandling_web.pdf (accessed on 11 May 2021).
- von Platten, J.; Mangold, M.; Mjörnell, K. A matter of metrics? How analysing per capita energy use changes the face of energy efficient housing in Sweden and reveals injustices in the energy transition. Energy Res. Soc. Sci. 2020, 70. [Google Scholar] [CrossRef]
- Boverket, Så Mår Våra Hus. 2009. Available online: https://www.boverket.se/globalassets/publikationer/dokument/2009/sa_mar_vara_hus.pdf (accessed on 11 May 2021).
- Jacobson, T.A.; Kler, J.S.; Hernke, M.T.; Braun, R.K.; Meyer, K.C.; Funk, W.E. Direct human health risks of increased atmospheric carbon dioxide. Nat. Sustain. 2019, 2, 691–701. [Google Scholar] [CrossRef]
- Markus, T.A. Cold, condensation and housing poverty. Unhealthy Hous. Res. Remedies Reform 2011, 141–167. [Google Scholar] [CrossRef]
- Boverket. Var Finns Rum för Våra Barn. 2006. Available online: https://www.boverket.se/globalassets/publikationer/dokument/2006/var_finns_rum-for_vara_-barn.pdf (accessed on 11 May 2021).
- Sedlbauer, K. Prediction of Mould Growth by Hygrothermal Calculation. J. Build. Phys. 2002, 25, 321–336. [Google Scholar] [CrossRef]
- Mjörnell, K.; Johansson, D.; Bagge, H. The effect of high occupancy density on IAQ, moisture conditions and energy use in apartments. Energies 2019, 12, 4454. [Google Scholar] [CrossRef]
- Papakostas, K.T.; Papageorgiou, N.E.; Sotiropoulos, B.A. Residential hot water use patterns in Greece. Sol. Energy 1995, 54, 369–374. [Google Scholar] [CrossRef]
- Johansson, D.; Bagge, H.; Lindstrii, L. Measurements of occupancy levels in multi-family dwellings—Application to demand controlled ventilation. Energy Build. 2011, 43, 2449–2455. [Google Scholar] [CrossRef]
- McCarthy, D.; Saegert, S. Residential density, social overload, and social withdrawal. Hum. Ecol. 1978, 6, 253–272. [Google Scholar] [CrossRef]
- Al-Nahari, L.C.H.S.; Ballal, S.G. Home accidents in Al-Khobar City, eastern province, Saudi Arabia: A case-control socioeconomic study. J. Community Health 1992, 17, 109–115. [Google Scholar] [CrossRef]
- Papakostas, K.T.; Sotiropoulos, B.A. Occupational and energy behaviour patterns in Greek residences. Energy Build. 1997, 26, 207–213. [Google Scholar] [CrossRef]
- Popoola, M. Trångt i Herrgårdsmiljö. 1999. Available online: https://muep.mau.se/bitstream/handle/2043/12539/popoola_tr%20ngboddhet.pdf?sequence=2 (accessed on 11 May 2021).
- Kubota, T.; Surahman, U.; Higashi, O. A comparative analysis of household energy consumption in Jakarta and Bandung. In Proceedings of the 30th International PLEA Conference, Ahmedabad, India, 16–18 December 2014; Volume 2, pp. 260–267. [Google Scholar]
- Ekstam, H. Trångboddhet—Mellan Bostadsstandard Och Boendemoral; Uppsala University: Uppsala, Sweden, 2016. [Google Scholar]
- Adebayo, A.; Iweka, A. Dwelling density variability across government-built multifamily apartments in Lagos. Ethiop. J. Environ. Stud. Manag. 2013, 6, 517–522. [Google Scholar] [CrossRef]
- Tervo, A.; Hirvonen, J. Solo dwellers and domestic spatial needs in the Helsinki Metropolitan Area, Finland. Hous. Stud. 2020, 35, 1194–1213. [Google Scholar] [CrossRef]
- Margal, F.L. Analyzing changes in waste reduction behavior in a low-income urban community following a public outreach program. Environ. Behav. 1997, 29, 769–792. [Google Scholar] [CrossRef]
- Iwafune, Y.; Yagita, Y. High-resolution determinant analysis of Japanese residential electricity consumption using home energy management system data. Energy Build. 2016, 116, 274–284. [Google Scholar] [CrossRef]
- Bedir, M.; Hasselaar, E.; Itard, L. Determinants of electricity consumption in Dutch dwellings. Energy Build. 2013, 58, 194–207. [Google Scholar] [CrossRef]
- Ghavidelfar, S.; Shamseldin, A.Y.; Melville, B.W. A Multi-Scale Analysis of Low-Rise Apartment Water Demand through Integration of Water Consumption, Land Use, and Demographic Data. J. Am. Water Resour. Assoc. 2016, 52, 1056–1067. [Google Scholar] [CrossRef]
- Ghavidelfar, S.; Shamseldin, A.Y.; Melville, B.W. Evaluating the determinants of high-rise apartment water demand through integration of water consumption, land use and demographic data. Water Policy 2018, 20, 966–981. [Google Scholar] [CrossRef]
- Mangold, M. The Effect of Resource Sustainability Interventions on Social Sustainable Development in the Built Environment; Department of Civil and Environmental Engineering, The University of Auckland: Auckland, New Zealand, 2013. [Google Scholar]
- Bolte, G.; Fromme, H. Socioeconomic determinants of children’s environmental tobacco smoke exposure and family’s home smoking policy. Eur. J. Public Health 2009, 19, 52–58. [Google Scholar] [CrossRef] [PubMed]
- Hamid, A.A.; von Platten, J.; Mjörnell, K.; Johansson, D.; Bagge, H. Impact of high residential density on the building technology, HVAC systems, and indoor environment in Swedish apartments. E3S Web Conf. 2020, 172, 1–8. [Google Scholar] [CrossRef]
- Intro-Meteonorm (en). Available online: https://meteonorm.com/en/ (accessed on 8 April 2021).
- WUFI® Plus|WUFI (en). Available online: https://wufi.de/en/software/wufi-plus/ (accessed on 16 September 2020).
- Antretter, F.; Sauer, F.; Schöpfer, T.; Holm, A. Validation of a hygrothermal whole building simulation software. In Proceedings of the Building Simulation 2011: 12th Conference International Building Performance Simulation Association, Sydney, Australia, 14–16 November 2011; pp. 1694–1701. [Google Scholar]
- Holm, A.; Kuenzel, H.M.; Sedlbauer, K. The hygrothermal behaviour of rooms: Combining thermal building simulation and hygrothermal envelope calculation. In Proceedings of the Eighth International IBPSA Conference, Eindhoven, The Netherlands, 11–14 August 2003; pp. 499–506. [Google Scholar]
- Antretter, F.; Mitterer, C.; Young, S.M. Use of moisture-buffering tiles for indoor climate stability under different climatic requirements. HVAC R Res. 2012, 18, 275–282. [Google Scholar] [CrossRef]
- Björk, C.; Kallstenius, P.; Reppen, L. Så Byggdes Husen 1880–2000: Arkitektur, Konstruktion och Material i Våra Flerbostadshus under 120 år; Svensk byggtjänst: Västerås, Sweden, 2008. [Google Scholar]
- Janson, U.; Berggren, B.; Sundqvist, H. Energieffektivisering Vid Renovering Av Rekordårens Flerbostadshus; Lund University: Lund, Sweden, 2008. [Google Scholar]
- Meteonorm Version 8-Meteonorm (en). Available online: https://meteonorm.com/en/meteonorm-version-8 (accessed on 24 November 2020).
- VDI 2078-1996-07: Cooling Load Calculation of Air-Conditioned Rooms (VDI Cooling Load Regulations). Available online: https://www.beuth.de/en/technical-rule/vdi-2078/1169044 (accessed on 24 November 2020).
- DIN Deutsches Institut für Normung. DIN V 4108-6: Thermal Protection and Energy Economy in Buildings-Part 6: Calculation of Annual Heat and Annual Energy Use. 2003. Available online: https://www.beuth.de/en/pre-standard/din-v-4108-6/63939447 (accessed on 24 November 2020).
- Nipkow, J.; Gasser, S.; Bush, E. Der typische Haushalt-Stromverbrauch: Energieverbrauch von Haushalten in Ein-und Mehrfamilienhäusern. Bull. SEV/AES 19/2007 2007, 19, 24–26. [Google Scholar]
- Kunze, H. Wohnungslüftung und Raumklima; 2009; Available online: https://www.amazon.com/Wohnungsl%C3%BCftung-und-Raumklima/dp/3816776590 (accessed on 11 May 2021).
- Häupl, P.; Höfker, G.; Homann, M.; Kölzow, C.; Maas, A.; Nocke, C. Lehrbuch der Bauphysik; Springer Vieweg: Wiesbaden, Germany, 2013. [Google Scholar]
- VDI 4300-7: 2001|Indoor-Air Pollution Measurement-Measurement of Indoor Air Change Rate|Sai Global. Available online: https://infostore.saiglobal.com/en-us/Standards/VDI-4300-7-2001-1115727_SAIG_VDI_VDI_2591413/ (accessed on 24 November 2020).
- Jönsson, D. Lägenheters Lufttäthet i Ett Flerbostadsområde Från 1960-Talet; 2013; Available online: https://www.hvac.lth.se/fileadmin/hvac/TVIT-5043DJ_web.pdf (accessed on 11 May 2021).
- Hamid, A.A.; Bagge, H.; Johansson, D. Measuring the impact of MVHR on the energy efficiency and the IEQ in multifamily buildings. Energy Build. 2019, 195, 93–104. [Google Scholar] [CrossRef]
- Viitanen, H.; Ojanen, T. Improved Model to Predict Mold Growth in Building Materials. VTT Tech. Res. 2007. Available online: https://web.ornl.gov/sci/buildings/conf-archive/2007%20B10%20papers/162_Viitanen.pdf (accessed on 11 May 2021).
Publisher’s Note: MDPI stays neutral with regard to jurisdictional claims in published maps and institutional affiliations. |
© 2021 by the authors. Licensee MDPI, Basel, Switzerland. This article is an open access article distributed under the terms and conditions of the Creative Commons Attribution (CC BY) license (https://creativecommons.org/licenses/by/4.0/).