Article

Community Perceptions of Mangrove Ecosystem Services and Their Determinants in the Rufiji Delta, Tanzania

1
Department of Physical Geography, Stockholm University, 106 91 Stockholm, Sweden
2
Institute of Marine Sciences, University of Dar es Salaam, Buyu Campus, Zanzibar P.O. Box 668, Tanzania
3
School of Natural Sciences, Technology and Environmental Studies, Södertörn University, 141 89 Huddinge, Sweden
*
Author to whom correspondence should be addressed.
Sustainability 2021, 13(1), 63; https://doi.org/10.3390/su13010063
Submission received: 30 October 2020 / Revised: 10 December 2020 / Accepted: 19 December 2020 / Published: 23 December 2020
(This article belongs to the Special Issue Ecosystem Services for Sustainable Governance)

Abstract

:
Understanding how local communities perceive and depend on mangrove ecosystem services (MES) is important for translating and incorporating their benefits, priorities, and preferences into conservation and decision-making processes. We used focus group discussions, key informant interviews, household questionnaires, and direct observations to explore how local communities in the Rufiji Delta perceive a multitude of MES and factors influencing their perceptions. Sixteen MES were identified by the respondents. Provisioning services were the most highly identified services, accounting for 67% of the overall responses, followed by regulating (53%), cultural (45%), and supporting (45%) services. Poles for building, firewood for cooking, coastal protection, and habitats for fisheries were perceived as the most important MES to sustain local livelihoods, although the perceptions differed between sites. Distance from household homes to mangroves and residence time were significant predictors of the local communities’ awareness of all identified MES. Gender of household heads and performance of local management committees also determined the local communities’ awareness of provisioning, regulating, and cultural services. We conclude that perceptions of MES are context-specific and influenced by multiple factors. We believe a deeper understanding of local stakeholders’ preferences for MES can help strengthen the link between local communities and conservation actors and can provide a basis for sustainable management of mangrove forests.

1. Introduction

The interaction between people and mangroves is not a new theme at the global scale, but the attention on “ecosystem services” as a core concept over recent decades has provided tools to apprise policymakers and managers on preferences and priorities of benefits they provide to local people [1]. Mangroves provide many ecosystem services, which are premised not only on ecological functioning but in sustaining livelihoods and well-being of coastal communities, who often are poor and marginalized [2,3]. These services are primarily characterized as provisioning services, such as poles, firewood and traditional medicines [4], cultural services, such as spiritual values and education [5], regulating services. such as coastal protection and storm buffering [6], and supporting services, such as providing habitats for coastal animals [7,8].
Despite the well-recognized benefits of mangrove ecosystem services (MES), mangroves are exposed to degradation and loss due to the massive demand placed by humans to secure livelihoods through, for example, unsustainable aquaculture, agriculture, and overharvesting [9,10]. Moreover, the link between ecosystem services and livelihoods is often multifaceted, and some of these services are more recognized than others. Even the perceived value of particular services may differ between different individuals or social groups [11,12]. From this perspective, an enhanced understanding of local people’s perception of ecosystem services, where communities closely rely on natural resources for their livelihoods, are inevitable for successful management and decision making [13,14]. Such understanding is context-specific and depends on geographical settings, socioeconomic characteristics at the community level, and the local management institutions [12,15]. For instance, distance from the forests can influence how local communities in a particular place perceive and prioritize different ecosystem services relevant to their livelihoods [16,17]. The perceived importance of the particular services may also be influenced by a set of social factors, such as household income, education, and gender, which vary among socioeconomic groups [18]. Government agencies, local institutions and non-governmental organizations that are responsible for the management and conservation of mangroves could also influence on how the community perceives and depends on goods and services that are associated with mangroves [19].
In Tanzania, mangroves are protected as forest reserves and are estimated to cover an area of 158,100 ha along the mainland coast [20]. The largest fraction of mangroves is found in the Rufiji Delta [21] and is considered as one of the most important ecosystems with numerous goods and services to sustain the environment and livelihoods of coastal communities [6]. Nevertheless, poor coastal communities, who rely on mangroves for their livelihood, are branded by policymakers as culprits of mangrove degradation, due to excessive reliance on natural capital and conversion of mangrove forests to other land uses [4,22]. Mangrove degradation is also associated with lack of common ground to coordinate the needs of resource users and the interest of different conservation actors [23]. Moreover, existing studies, for example [24,25,26], which highlight the link between people and mangroves have focused on a narrow range of ecosystem services, such as those that have direct value and market prices, while less is known about the multitude of ecosystem services provided by mangroves to communities and their predictors at a local scale. Therefore, a clear and broad characterization of ecosystem services through the lens of local communities could be an important way to translate and incorporate their perceived benefits, priorities and preferences in decision making.
In the present study, we explored how local communities in the Rufiji Delta perceive a multitude of ecosystem services provided by mangroves and factors influencing on their perception. Specifically, the study answered the following questions: (1) To what extent are local communities aware of ecosystem services provided by mangroves and how do they depend on these services? (2) How do local communities perceive the relative importance of MES for their livelihoods and well-being? (3) How do the proximity to mangroves, socioeconomic factors, and management factors influence on peoples’ awareness of MES?

2. Materials and Methods

2.1. Study Area

The Rufiji Delta lies within the Kibiti and Rufiji Districts of the Pwani Region in Tanzania (7°40′–8°00′ S, 39°10–20′ E; Figure 1). The delta holds the largest mangrove ecosystem in Tanzania and is covered by almost 45,519 ha of mangrove forests [27]. The delta is well settled with several villages that are located outside and within the mangrove forests [26]. On the basis of disparity in proximity to mangrove forests, as well as on social systems (transport and energy accessibility, livelihood options, and sociodemographic status), we selected six villages spread across the delta for this field survey, namely, Mohoro, Mtunda A, Ruaruke Magharibi, Ruma, Mbwera Magharibi, and Mbuchi. The first 3 stated villages are situated at a relatively large distance (>1 km) from any edge of mangrove forests (DM); accessible by roads; electrified; and dominated by livelihoods from farming, small business-like food vending, and exploitation of both inland and mangrove forests. The other villages (Ruma, Mbwera Magharibi, and Mbuchi) are located in close proximity to mangrove forests (CM); often only accessible by boat through river channels, and sometimes by roads, especially during the dry season; non-electrified; and are mainly characterized by livelihood opportunities, which include farming, fishing, and heavy utilization of mangrove resources, such as poles and firewood. Farming activities in the delta are highly dependent on the rainfall and overflow frequency from the Rufiji River [4]. The delta exhibits a bimodal rainfall pattern, which occurs from February to May as long rains, and from October to December as short rains [28]. According to the village census of 2018, the Mohoro village has a population of 5119 people, which is larger compared to Mtunda A (3583), Ruaruke Magharibi (3371), Ruma (2336), Mbwera Magharibi (3467), and Mbuchi (2978) (Village leaders, personal communication, 2018).

2.2. Local Management Institutions

Mangrove forests are managed and protected by the Tanzania Forest Services Agency (TFS) in collaboration with different stakeholders at national, sub-national, and local level institutions [23]. Two local management institutions, i.e., Village Natural Resources Committees (VNRCs) and Beach Management Units (BMUs), exist in the study area, but they differ in their functions. The VNRCs are found in both DM and CM villages and aim at managing both land-based and mangrove resources. The committees serve as the local bodies for community partnership with the TFS, the District Council Environment, and forest officers, with the responsibility of protecting mangrove resources. They have also a mandate to raise awareness and support enforcement of environmental conservation by-laws at the community level. The BMUs have a focus on fisheries and exist only in the CM villages, being mandated with enforcement of rules and regulations, patrolling, and providing awareness on fisheries management and associated resources, including mangroves. VNRCs and BMUs report to the Village Council, which in turn receives commands from the District Council. Despite the existence of these institutions, mangroves in the delta are still threatened. Inadequate coordination among sectors of the government and poor interaction with local communities are highlighted as drawbacks for their efficient conservation. With these challenges, a well-structured partnership, including collaborative arrangements, rehabilitation initiatives, and appropriate harvesting plans are warranted to secure sustainable use and management of mangroves in the delta [23]. Therefore, in an effort to further contribute to the design of management interventions, which would promote collaborative arrangements, an improved understanding of local communities’ awareness, priority, and preferences of mangrove ecosystem services is important.

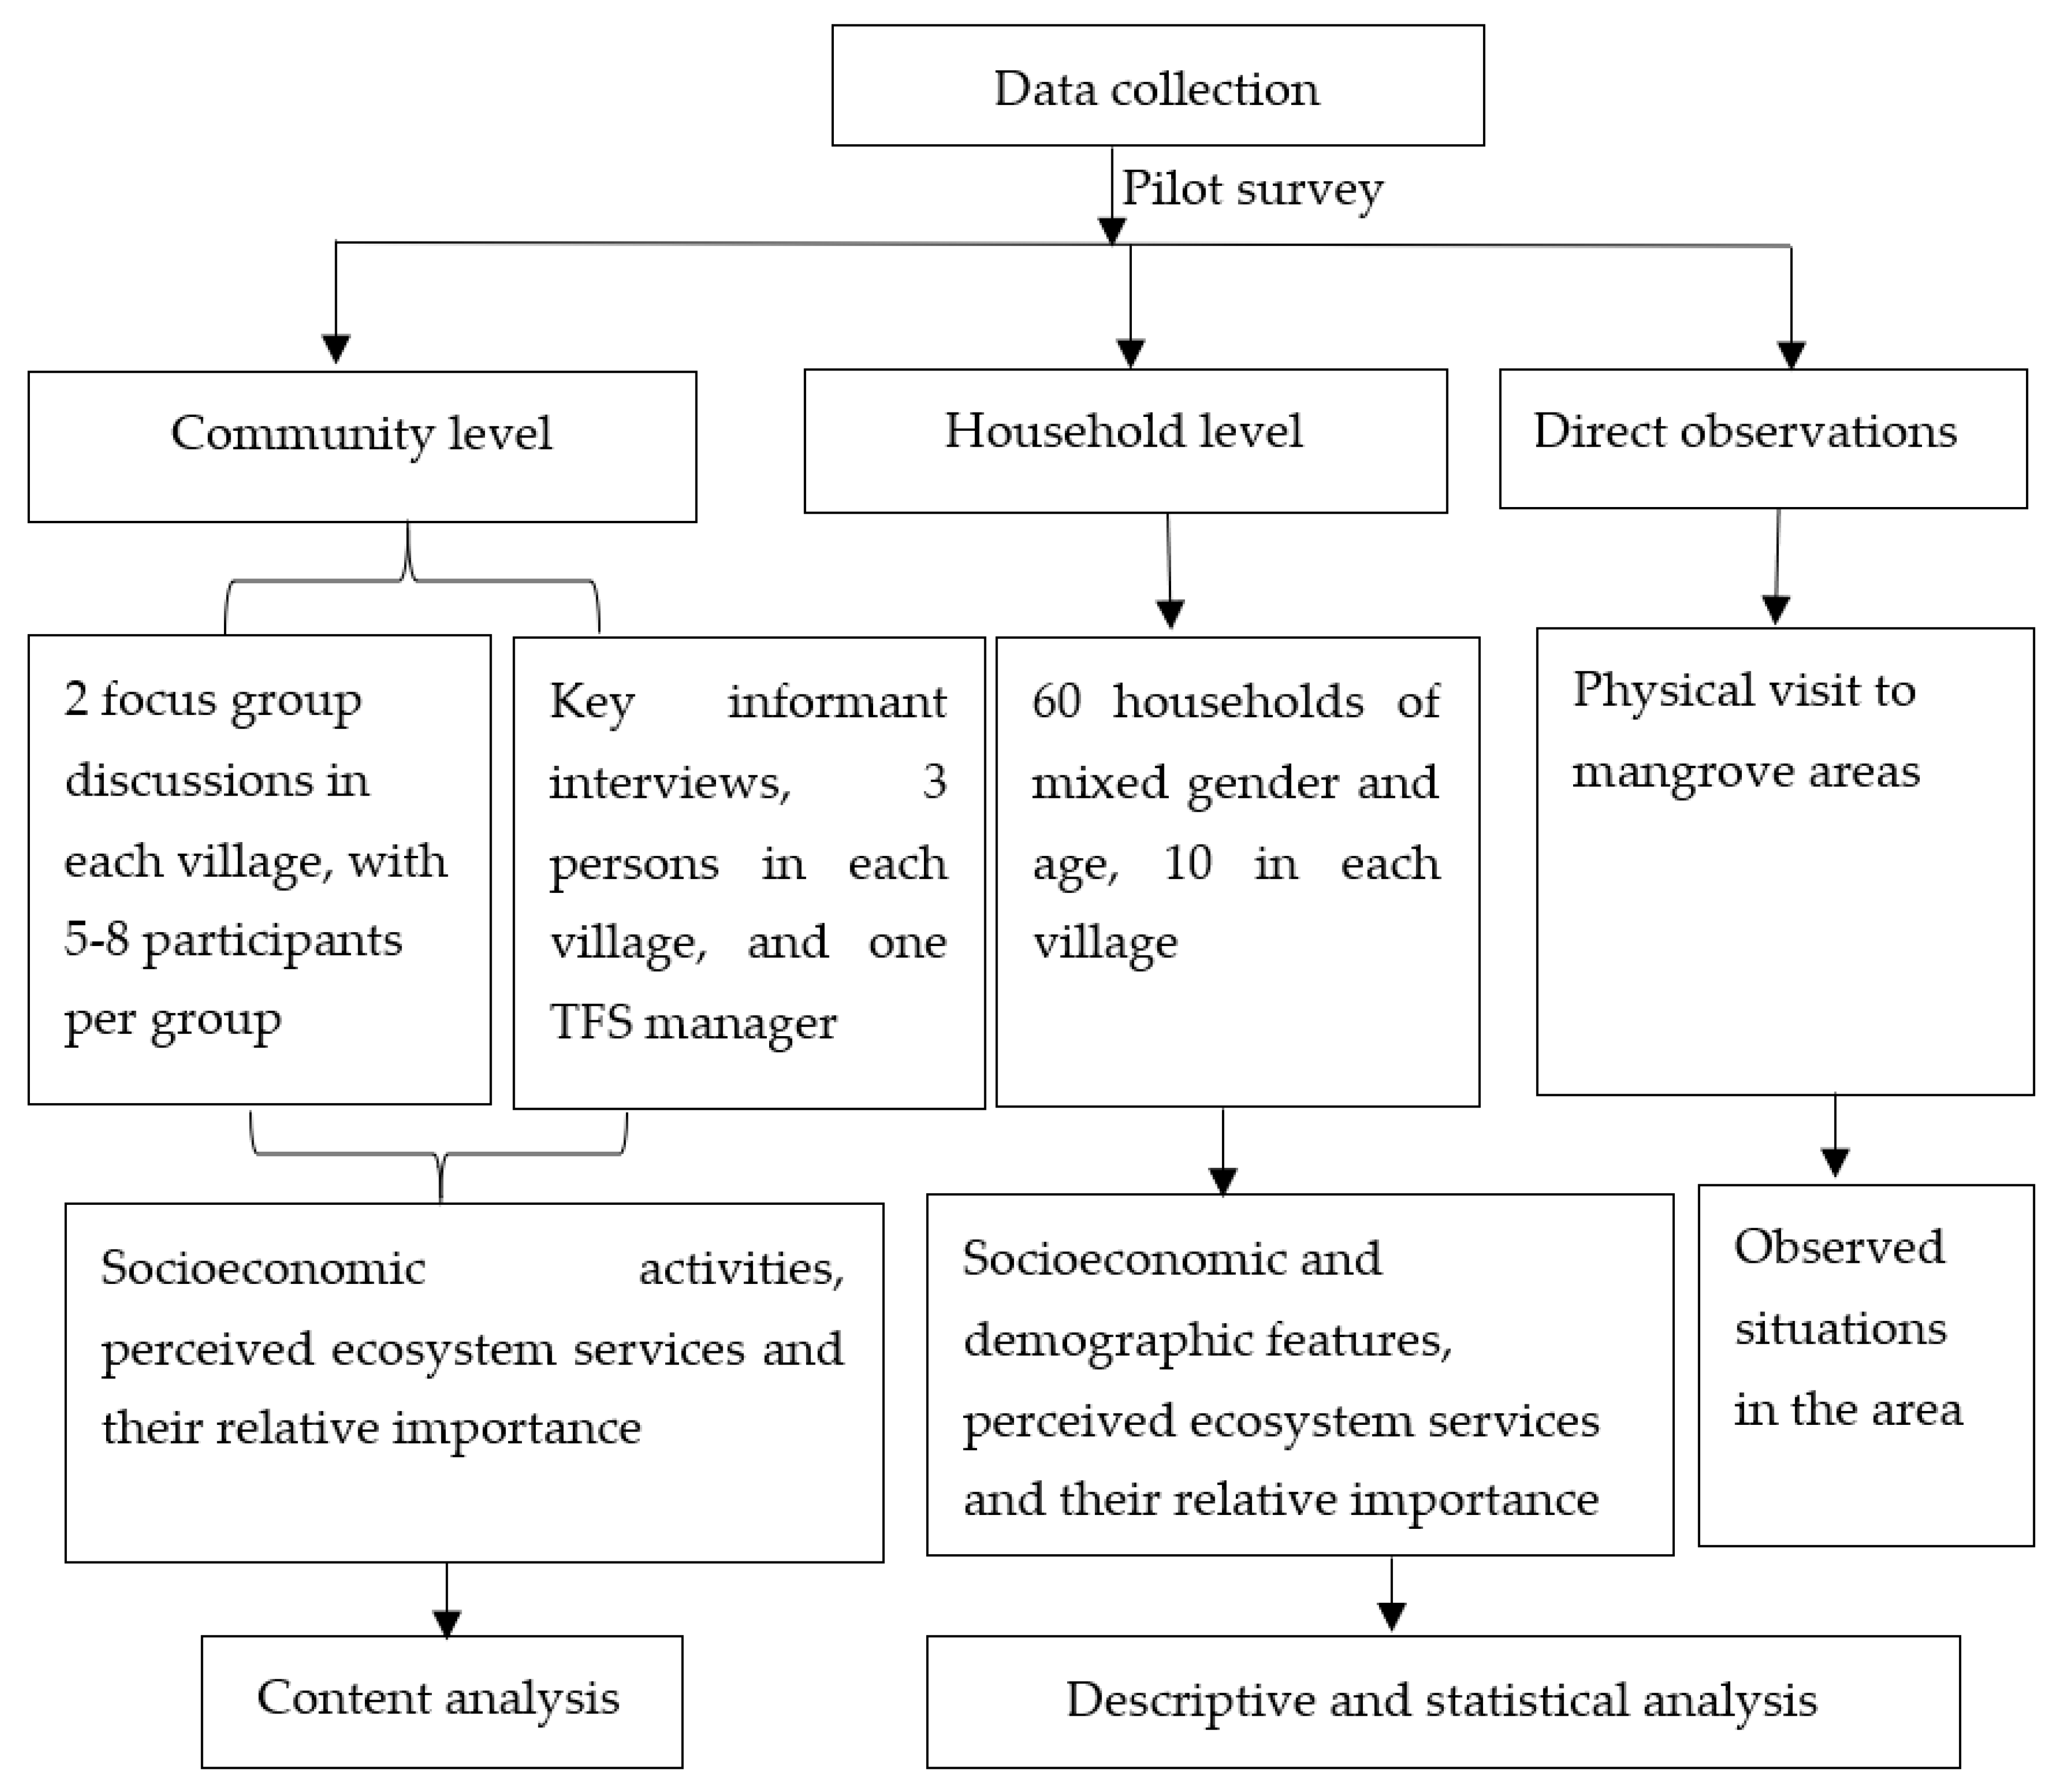
2.3. Research Design and Data Collection

A research design of both qualitative and quantitative nature [29] was used in this study. The field work was carried out from February to April, 2018, at both community and household levels, to explore how local communities in the Rufiji Delta perceive a multitude of ecosystem services provided by mangroves and factors influencing on their perceptions. Data were collected through focus group discussions (FGDs), key informant interviews (KIIs), household questionnaire survey (HHQ), and field observations. A mixture of these methods was used to cross check and validate the collected information. Prior to the data collection, respondents were informed about the purpose of the study and requested for their consent to participate. The respondents were purposively selected by the assistance from village leaders, and only those that to some extent interacted with mangroves were involved, because they were believed to have good knowledge and information about mangrove ecosystems. The overall methodological scheme is illustrated in Figure 2.

2.3.1. Focus Group Discussions and Key Informant Interviews

Two FGDs were carried out at the community level in each village. One FGD involved local resource beneficiaries, including mangrove cutters, fishers, farmers, and food vendors. The other FGD was comprised of representatives from the VNRCs or BMUs, depending on the existing local management institutions in the studied villages. The group discussions involved 5–8 participants of mixed gender and age to allow for effective discussions, as suggested by Hennink [30]. Discussions were guided by facilitators using a prepared checklist adopted from studies by Casado-Arzuaga et al. [15] and Costanza et al. [12], and modified to meet the objectives of the study. Prior to the interaction between facilitators and community members, we asked participants to narrate their own expression on important socioeconomic activities in the study area, the different benefits that they received from mangroves, and the relative importance of these benefits to their livelihoods and well-being. In this study, livelihoods refer to a way of securing requirements of basic needs and well-being from services provided by mangroves as natural capital [31]. The expressed benefits were then translated into the term “ecosystem services” by the facilitators. After initial conversations with the participants, a detailed discussion was carried out, where the facilitators interacted with the communities to encourage more exploration of ecosystem services and brainstorming of raised issues. To intellectualize the potential link between mangroves and the communities in the study area, we selected ecosystem services that were formulated by community members in their own words and those raised by the facilitators during discussions, and later agreed by the participants, in order to construct a deeper understanding about perceived benefits of mangroves in the delta. The information provided by the FGDs were complemented by conducting in-depth interviews with 19 key informants (i.e., KIIs), which included (i) 1 village leader in each village, (ii) 2 influential village elders in each village, and (iii) 1 Tanzania Forest Services Agency (TFS) manager in the Kibiti District. Key informants were nominated on the basis of their knowledge about the local environment and the history of the area [32].

2.3.2. Household Survey

Prior to the actual survey with the households, a pilot survey was conducted with a few households to test the relevance and clarity of the questionnaire. During the actual survey, a pretested semi-structured questionnaire was administered to 60 household heads, 10 in each village, and in their absence, any adult family member was consulted for an interview. Household heads were chosen because they are primarily responsible for the socioeconomic well-being and safety of the family members [33]. Due to dispersed settlement patterns and transport constrains across the villages, we kept the sample size small but at a size still believed to be adequate in order to provide a deeper insight into the intended objectives, as it was targeted to households that to some extent commonly interacted with mangroves and not the entire population of the villages. The sample size used included a higher proportion of male-headed households compared to female-headed households, which was due to different factors. First, from our pilot survey, we realized that men in the study area are traditionally responsible for the household welfare and basic needs. It is considered to be bad manners for a woman to speak in public, especially in front of men, and this reduced women’s power to participate in the interviews, and even in the decision-making processes within their communities, which are in line with observations by Mshale et al. [23]. Second, since the mangroves in the delta are complex and difficult to access, most women are more afraid to go deep into the mangrove forests compared to men, who tend to wander far into the forests, and thus men may have more knowledge on the services associated with mangroves than women. The questionnaire used was adopted from studies by Oteros-Rozas et al. [34] and Mensah et al. [35], and modified on the basis of the information obtained from the FGDs and KIIs. The information elicited included (i) socioeconomic characteristics of the respondents and (ii) services (benefits) derived from mangroves and their relative importance to livelihoods and well-being. Ecosystem services were identified through the respondent’s selection from a predefined list of services explored at the community level. Those respondents who were revealed to depend on such services for their livelihoods were defined as mangrove-reliant and vice versa as mangrove-non-reliant. The relative importance of the assessed services was elicited through a Likert scale [36]. The ranking of ecosystem services was performed using 4 categories: 1 = not important, 2 = least important, 3 = second most important, and 4 = most important.

2.3.3. Field Observations

Occasional physical observations on socioeconomic activities, including visits to mangrove areas, were conducted to explore the real situation of the areas under study and to cross check the information collected.

2.4. Data Analysis

Data collected from the household survey were sorted using Microsoft Excel, and statistical analyses were conducted using the SPSS statistical software, version 23. Since there were only small differences within both the CM villages and the DM villages, we pooled the studied villages into 2 groups: villages distant from mangrove forests (DM) and villages close to mangroves (CM), with 30 households per group. In some cases, all groups (n = 60) were merged to obtain the overall responses. A chi-squared test of independence was used to compare respondent’s awareness of services derived from mangroves between the DM and CM groups. One-way ANOVA was applied to compare the respondent’s perception on the relative importance of the mangrove ecosystem services for livelihoods between DM and CM groups, followed by a posteriori multiple comparison tests (Tukey) to link the importance of perceived services with the occupation of households. A logistic regression model [37] was used to predict factors associated with respondents’ perceptions of the identified mangrove ecosystem services. This model was selected because it can simultaneously analyze the effects of both continuous and categorical explanatory variables. The variables included in the model were defined on the basis of the link between a binary dependent (response) variable and one or more independent (predictor) variables, which were either categorical or continuous (Appendix A). The selection of the 9 variables in the model was based on the fact that (i) the Rufiji communities have different social groups that directly or indirectly rely on mangrove resources to support their livelihoods and well-being, and thus the awareness of particular ecosystem services is related to the socioeconomic conditions of the members of the community, where the stated variables are the dominant features of the studied village, and (ii) awareness of ecosystem services also being shaped by the management approach involved, where VNRCs and BMUs exist in the delta as local institutions. To determine whether the stated variables influenced the community awareness of ecosystem services among the respondents, we grouped respondents on the basis of (i) gender—female or male, (ii) age of respondents in years, (iii) education level—educated (primary school, secondary school, and college) or uneducated (informal), (iv) occupation—mangrove cutters or other (farmers, fishers, small business, and others), (v) household size—actual number of members in the family, (vi) household income—monthly income earned by family members, (vii) management committee—whether active or not, (viii) proximity—actual distance to forests, and (ix) resident time—actual number of years that the respondent lived in the village. A dummy variable for independent ordinal data (education and occupation) was created in the SPSS custom dialog, where one of the levels was randomly selected and set as a reference group. Qualitative information from the FGDs and KIIs were subjected to content analysis, as suggested by Erlingsson and Brysiewicz [38], where the observed text (field notes taken) was converted to generate the smallest meaningful units that represent information described by the respondents in relation to services provided by mangroves.

3. Results

3.1. Socioeconomic and Demographic Profiles of the Households

The communities of the studied villages were dominated by Muslims, followed by Christians and a few traditional believers (Table 1). Both DM and CM were composed of mangrove-dependent rice farmers, and almost the entire communities in the CM relied on mangroves for fuelwood (Table 1). The majority of the household heads (80% and 73% in DM and CM, respectively) were male, and almost 50% of the respondents were in the age group of 36 to 55 years old (Table 2). In terms of marital status, 80% of the respondents in the DM and nearly 77% in the CM were married (Table 2). Almost 13.3% of the respondents in the DM had attained secondary school, while 63.3% in the CM had managed to get a primary education (Table 2). About 40% of the surveyed respondents in the DM had stayed in the area for less than 10 years, while 50% of the respondents in the CM had resided in the area for over 15 years (Table 2). Farming was the main occupation of most respondents in both DM and CM, accounting for 50% of the overall responses, and nearly 43% of the respondents earned more than 150,000 Tanzanian shillings per month. The mean monthly household income was estimated to be 106,267 Tanzanian shillings. It was also observed that 53% of the respondents in the DM lived more than 1.5 km from mangrove forests, while the majority of the CM residents lived much closer to the mangrove forests than the DM residents (Table 2).

3.2. Awareness of Mangrove Ecosystem Services

Sixteen mangrove ecosystem services and their importance were identified in the study area during the FGDs and KIIs (Table 3). People in the CM group were more aware of services provided by mangroves compared to those in the DM group (Table 3). In general, provisioning services were the most identified services accounting for 67% of the overall responses, followed by regulating (53%), cultural (45%), and supporting (45%) services (Figure 3). While there were no significant differences regarding the respondents’ awareness of regulating (χ2 = 2.411, p = 0.121) and cultural (χ2 = 1.684, p = 0.194) services between the DM and CM groups, the ability to identify provisioning (χ2 = 4.800, p = 0.028) and supporting (χ2 = 5.455, p = 0.020) services differed significantly between these two groups (Figure 3) A comparison based on radar diagram analysis adopted from Dawson and Martin [39] also illustrates that respondents living in the DM were less aware of mangrove ecosystem services than those residing in the CM (Figure 4). Among the provisioning services, poles, firewood, and honey were the most commonly cited services (Figure 4). Regulating services that were highly mentioned included coastal protection and climate regulation. In terms of cultural services, natural beauty was the most listed service followed by spiritual beliefs (Figure 4). Among supporting services, habitats or nursery ground for fisheries was the most commonly mentioned ecosystem service (Figure 4). Latrine site was only cited in the CM (Figure 4), which also was reported as a supporting service in the study by Warren-Rhodes et al. [40].

3.3. Perception on the Relative Importance of Mangrove Ecosystem Services

On the basis of the results from the FGDs and KIIs, we found that the local community in the CM was more aware of various ecosystem services (identified more services) that were provided by mangroves to sustain their livelihood and well-being compared to those in the DM (Table 4). Among the services identified, poles for buildings, firewood for cooking, coastal protection, and climate regulation were scored as the most important mangrove ecosystem services in the study area (Table 5). In general, provisioning services followed by regulating services were perceived as more important than supporting and cultural services, and there were significant differences in the relative importance of specific ecosystem services, credited by respondents, between DM and CM (Table 5). In some cases, perceived services were seen as particularly important, when they had a clear link with the occupation of the households. For example, habitats for fish were scored high by fishermen and mangrove cutters but ranked lower by public servants and small business operators (Table 6). Approximately 37% of the respondents in the DM were mangrove-non-reliant as they reported not “relying” on any services derived from mangroves for their livelihoods, while all respondents (100%) in the CM were mangrove-reliant as they indicated to some extent that they relied on services provided by mangroves for their livelihoods and well-being (Figure 5). There was no significant difference in the reliance on mangroves in relation to the respondent’s occupation (χ2 = 7.815, p = 0.167; Table 7).

3.4. Factors Influencing on Communities’ Awareness of Mangrove Ecosystem Services

A logistic regression model was used to predict factors associated with the respondents’ perception of the identified mangrove ecosystem services. To increase the strength of the association between predictors and response variables that fit the logit model, we combined the studied villages (CM and DM), and determined factors that were associated with the communities’ awareness of mangrove ecosystem services (Table 8). Gender of household heads and contact of households with mangrove management committees predicted the communities’ awareness of provisioning, regulating, and cultural services, while the distance from household homes to mangroves and residence time significantly predicted the awareness of all categories of ecosystem services (Table 8). These factors contributed to the community ability to identify ecosystem services in the study area. The observed negative sign with the distance factor indicates that an increase in distance from households’ home to mangroves reduced the likelihood of respondents to identify services provided by mangroves.

4. Discussion

4.1. Awareness of Mangrove Ecosystem Services and Their Relative Importance

A better understanding of peoples’ awareness of ecosystem goods and services is an important tool to elucidate the relationship between humans and their environment [41]. A high community awareness shapes individuals’ appreciation of what an ecosystem has to offer, and helps to identify the role played by ecosystems for sustaining peoples’ livelihoods and well-being [42]. Building on community knowledge is also an entry point for establishing management intervention through identification of different interests on the use of ecosystems. This could help to balance trade-offs in ecosystem services and encourage activities that build on multifunctional landscapes and sustainable use of natural resources [42,43]. The present study explored how local communities in the Rufiji Delta perceive a multitude of ecosystem services provided by mangroves and factors influencing on their perception. Respondents perceived mangroves as a provider of provisioning, regulating, cultural, and supporting services, where provisioning services were the most highly cited services compared to the others. This was in accordance with the findings of López-Santiago et al. [44], that many provisioning services are easy to identify because of their direct market value. Among the identified provisioning services, poles and firewood were the highest ranked services in terms of supporting local livelihoods. These services were seen as quite important in both DM and CM, but they were more appreciated in the CM than in the DM. The results of the FGDs and KIIs revealed that almost all communities in the CM depend on mangrove poles for construction of houses, making furniture, and building boats, due to their accessibility. This is in line with the results of Mensah et al. [35], who found that local communities in forested areas display a high appreciation of timber for house construction due to its availability. Communities in the CM villages also felt that alternative building materials, such as cement and iron sheets, were difficult to obtain and expensive, due to poor infrastructure (boat accessibility and roads) from Mohoro to the CM villages, that limited the supply. Furthermore, local communities in the CM relied more on mangrove forests for cheap fuel compared to peri-urban communities in the DM, who narrated about the opportunities to use liquefied natural gas, charcoal, and inland forests as alternative sources for cooking energy. This finding aligns with observations by Makonese et al. [45], that rural people in nearby forests often use firewood to meet their basic cooking requirements due to its easier access and affordability. The importance of other provisioning services, such as honey production, received similar perceptions. Local communities in both the DM and CM unraveled that beekeeping in mangroves is a common economic activity in the entire study area. It is an important source of income to sustain local livelihoods and its products are applied to treat illnesses and wounds. Some provisioning services, such as traditional medicines and fruit and animal fodder, were identified by only a few respondents and were ranked relatively low. The results of the KIIs revealed that the use of traditional medicines was common in the past, but currently people prioritize modern medicines, which are offered at health centers and dispensaries. This finding mirrors the view that people tend to be less reliant on traditional medicines, due to better access to modern healthcare services [46]. Moreover, elders in the study area explained that mangrove fodder consumption is low because livestock often graze on the existing inland grasses and shrubs, which is consistent with results of Joshi and Negi [47], who explained that livestock grazing on forests occurs only when fodder from other sources, such as grazing land, become unavailable.
The result of the FGDs revealed that during the late 1970s, the Rufiji River changed its flow to the northern delta, which led to an inflow of more fresh water. This change attracted agriculture in the northern delta, allowing some members of the community in the DM villages (Mtunda A and Ruaruke Magharibi) to engage more in mangrove rice farming compared to some communities from the central and southern delta CM villages, who indicated wandering far to the northern delta to look for land for rice farming. In this regard, some community members identified rice farming in mangrove areas as an ecosystem service, although it is more a factor causing a decline of mangroves, which is why this was not included as a MES in Table 3. Still, this implies that local communities tend to place high value on the activities or services that they consider as important for their livelihoods. For example, while salt making through boiling of brackish water has persisted in the delta for generations, a few households in the central and southern CM villages (Ruma, Mbuchi and Mbwera Mashariki) reported it as an occupational safety net activity in times of shocks in crop production. This supports the observations that mangrove areas offer space for such minor traditional livelihood activities to enhance income security for coastal dwellers [48].
The results show that the communities appreciated the value of mangroves providing regulating services in terms of coastal protection and climate regulation. The results of the FGDs and KIIs revealed that local communities, especially those of the CM, had experienced coastal flooding due to the overflow of the Rufiji River. This experience had contributed to increased insights of the value of mangroves in protecting their villages and lives from flooding. A similar result was reported by Damastuti and de Groot [49], who showed that the incidence of coastal hazards, such as storms and tsunamis, make coastal communities value mangrove ecosystem services, such as coastal protection. Furthermore, during the FGDs, all local communities perceived that mangrove forests contributed to the formation of rainfall and thus provided suitable climatic conditions for agricultural activities. This concords with findings of Joshi and Negi [47], who revealed that evapotranspiration intercepted by the forests contributes to local atmospheric humidity and rainfall of a particular place. The perceived lowest scores with regard to regulating services was given to sediment trapping, which may be explained by its intangible nature, where the value may be difficult for local communities to identify [50].
Cultural services, such as spiritual beliefs and natural beauty, received lower scores than provisioning and regulating services. The result of the FGDs revealed that the Rufiji Delta is dominated by Muslims, followed by Christians and a few traditional believers. As such, local communities tend to live by the word of God and hence discourage issues of rituals and spiritual beliefs. Likewise, cultural ecosystem services, such as education and ecotourism, had low scores, probably because of their indirect benefits that have no immediate impact on the communities’ livelihoods. Among mangrove-supporting services, habitat (or nursery ground) for fish was perceived as the most important service and varied between DM and CM. Local communities living near the mangroves highly appreciated habitat-related services because fishing is one of the most important forms of economic livelihood in the inner part of the Rufiji Delta, and many fishermen reside close to mangrove forests. This observation supports the view that mangroves offer an important fishing ground for the well-being of coastal communities through the enhancement of fisheries production [51]. Only a few people, particularly in the CM, mentioned latrine function and soil formation as services provided by mangroves. Many respondents during the FGDs revealed that they have a latrine at their homes, and only a few fishermen use mangroves as defecation sites when working along mangrove swamps to fish. A similar finding was observed by Warren-Rhodes et al. [40], but in their results, the toilet function was ranked as one of the most important services derived from mangroves without illustrating the clear reason for that rating.

4.2. Factors Influencing on Communities’ Awareness of Mangrove Ecosystem Services

In this study, the distance of household homes to mangroves and residence time were significant predictors of community awareness of all types of ecosystem services identified in the study area (i.e., provisioning, regulating, cultural, and supporting services). The communities living near the mangroves were likely to identify more services provided by mangroves than distant communities, due to their close contact with mangroves. A similar pattern was reported by Gouwakinnou et al. [17], who showed that respondents close to a forest rely more on forest resources for their livelihoods and thus they are much more familiar with the services provided by the forest. The length of the residence time was also positively correlated with identification of mangrove ecosystem services. Respondents who had resided longer in the study area seemed to feel more connected with their environment, and were more likely to identify services provide by mangroves than those who had lived a shorter time in the area. This finding concord with the study by Nesheim et al. [52], who showed that communities who live longer in a forest tend to have higher experience and traditional knowledge of what a forest has to offer than those that have spent less time in the forest. It was also observed that being a male-headed household in the studied communities had a positive influence on the identification of provisioning, regulating, and cultural services. The FGDs and KIIs revealed that men are traditionally breadwinners in the family, and thus they tend to access and use different provisioning services to support livelihoods of their families, which is why they have become more acquainted with these services than woman. This interaction with mangroves could perhaps also be a reason for those men to be more aware of regulating services compared to women. Likewise, the insight from the FGDs in the study sites revealed that men are spiritual healers and ceremonial leaders in communities and therefore they are expected to appreciate cultural services more than women do. In contrast, both male- and female-headed households had similar perception regarding supporting services. This could be because both men and women are involved in fishing activities to sustain their livelihoods, and hence they had a similar experience in making them recognize habitats for fish as a service provided by mangroves. These findings concur with the results of Mensah et al. [35], who found that the gender of households significantly influences on how people perceive the services provided by ecosystems, but the degree of influence depends on the explicit livelihoods practiced and accessibility to the areas that provide the ecosystem services in question.
Household main occupation had no major influence on the perception of mangrove ecosystem services. However, in some cases, the importance score assigned to specific ecosystem services significantly differed with type of occupation. For example, habitat service was ranked highest by fishers and mangroves cutters, while spiritual belief was ranked lower by public servants. Similarly, household income had no significant effect on the identification of mangrove ecosystem services. This may have been because the majority of the local communities in the study area displayed similar levels of income and were revealed to gain income from a variety of livelihoods aside from mangroves. Moreover, different age groups had similar perceptions of ecosystem services, and both young and aged people recognized many services provided by mangroves. These findings contradict the results of Meijaard et al. [53], where the authors found that age and income significantly influenced the perceptions of ecosystem services because aged individuals are more familiar with their ecosystem than young individuals, and that older respondents may generate their income through selling of ecosystem goods, such as poles for building. Likewise, it was also expected that an increase in education level would increase the awareness of mangrove ecosystem services, but level of education had no significant influence on this awareness. This may be attributed to the fact that people in the studied communities primarily had received local knowledge about the importance of their mangroves, which is consistent with observation by Boafo [54], who applied traditional knowledge in assessing ecosystem services. Household size had no major influence on the awareness of ecosystem services, although an observed positive coefficient implies that households with large families are more likely to recognize various services from mangroves, probably due to high demand placed on mangrove resources by the members of a large family. It was also noticed that the contact between households and mangrove management committees positively correlated with the awareness of provisioning, regulating, and cultural services. This could be because such committees often collaborate with the Tanzania forest services agency to protect and raise awareness about the value and importance of mangrove forests. According to Iniguez-Gallardo et al. [55], the perception and recognition of goods and services provided by a particular ecosystem is strongly shaped by the management process and the role that conservation actors play in protecting that ecosystem. However, the intricacy to identify supporting services by local communities implies that prevailing management committees in the study area do not raise enough information about all possible benefits provided by mangroves. The results of the FGDs and KIIs revealed that the majority of the community members who form management committees had only attained primary education, and thus they may not have sufficient knowledge to educate local communities about the full bundle of mangrove ecosystem services nor the multi-functionality of mangrove forests. Furthermore, some fishers and farmers during the FGDs complained about the poor relationship between local communities and some conservation actors, and that forest officers sometimes spend more time in their offices than working together with the communities. In addition, they stated that the majority of the conservation actors, such as BMU members, were inclined to political factions rather than technical conservation, indicating a continued mismanagement of mangroves.
According to Mshale et al. [23], about 75% of the livelihoods in and around the delta revolve around mangroves, where communities depend and utilize these resources in different ways [4]. Commercial harvesting of mangrove poles and timber requires licenses, but recently the government imposed a ban on mangrove harvesting as a management measure to reduce degradation. This resulted in an outcry amongst a large section of the households that are most dependent on mangrove goods and services. The results of the FGDs and KIIs revealed that some mangrove products, such as fish and honey, are not only used for subsistence but also sold to local markets within and outside the delta. This implies that the perceptions of mangrove ecosystem services are also influenced by other contextual factors, such as the availability of local markets, which were not explored in our study. The delta is characterized by poor access roads, which makes transportation expensive and limits people’s access to markets to sell or buy their products. Under such circumstances, poor communities living around mangrove areas will continue to rely on mangrove ecosystem services for cheap fuel and other benefits.
Overall, understanding of how local communities perceive ecosystem services and factors influencing on their perceptions, such as the those revealed in this study, enhances policy-relevant knowledge on human–mangrove relationships. An improved understanding of local peoples’ priorities and preferences of mangrove ecosystem services and their importance for peoples’ livelihoods must go hand-in-hand with the development of a well-adjusted policy and joint collaborative arrangements for sustainable mangrove management.

5. Conclusions

This study explored how local communities in the Rufiji Delta perceive a multitude of ecosystem services provided by mangroves and factors influencing on peoples’ perception. Among the four categories of ecosystem services, provisioning services were the most commonly recognized and highest ranked services in support to local livelihoods, due to their direct value. The comparatively lower score assigned to regulating, cultural, and supporting services revealed in this study calls for existing management initiatives to raise more awareness about the value, importance, and multi-functionality of mangrove forests. This can encourage local communities and management institutions to consider a wider array of benefits that mangroves provide and could contribute to a more sustainable use and management of mangrove ecosystem services for the benefit of future generations. Moreover, the results show that perceptions of mangrove ecosystem services are context-specific and influenced by multiple factors, including proximity of communities to mangrove forests, social factors, and local communities’ contact with management committees. We believe that a deeper understanding of local stakeholders’ preferences for mangrove ecosystem services can help to strengthen the links between local communities and conservation actors for sustainable management of mangrove forests.

Author Contributions

Conceptualization B.P.N., H.B. and M.M.M.; methodology B.P.N., H.B., M.M.M., M.G. and M.S.S.; formal analysis, B.P.N. and H.B.; writing—original draft preparation B.P.N.; supervision, H.B., M.M.M., M.G. and M.S.S.; writing—review and editing, B.P.N., H.B., M.M.M., M.G. and M.S.S. All authors have read and agreed to the published version of the manuscript.

Funding

This research was funded by the Swedish International Development Cooperation Agency (Sida) through the bilateral Marine Science Program between Sweden and Tanzania.

Informed Consent Statement

Informed consent was obtained from all subjects involved in the study.

Data Availability Statement

Research data are available when needed. The data are not publicly available to respect the privacy of the responding communities.

Acknowledgments

We are highly grateful to the local communities in the Rufiji Delta for providing valuable information used in this study. We would also like to thank postgraduate students from the University of Dar es Salaam, especially Emanuel Japhet and Joseph Bugota for their participation in data collection. Two anonymous reviewers provided valuable comments.

Conflicts of Interest

The authors declare no conflict of interest.

Appendix A

Table A1. Description of variables used in logit regression analysis.
VariablesDescription Coded Value
Dependent variable Each category of ecosystem services If the respondents listed specific services within the category 1 = yes,
0 = no
Independent variablesGender Male-headed households are likely to cite more services than female-headed households 1 = male,
0 = female
AgeThe length of time in years lived by householdcontinuous
EducationHighest level of education attained by household1 = educated,
0 = uneducated
Occupation Main occupation of the households1 = mangrove cutters,
0 = otherwise
Household sizeSum of members in the household continuous
Household incomeIncome earned by all members in the household per month continuous
Contact of households with management committeeIf the existing management initiatives in the study area are active in providing information related to mangroves (uses and protection)1 = yes,
0 = no
Proximity to forests Distance from household homes to mangrovescontinuous
Residence time Number of years household lived in the areacontinuous

References

  1. Rivera-Monroy, V.H.; Kristensen, E.; Lee, S.Y.; Twilley, R.R. Mangrove Ecosystems: A Global Biogeographic Perspective: Structure, Function, and Services; Springer: Cham, Switzerland, 2017; ISBN 9783319622064. [Google Scholar]
  2. Mukherjee, N.; Sutherland, W.J.; Dicks, L.; Hugé, J.; Koedam, N. Ecosystem service valuations of mangrove ecosystems to inform decision making and future valuation exercises. PLoS ONE 2014, 9, 1–9. [Google Scholar] [CrossRef] [Green Version]
  3. Himes-Cornell, A.; Grose, S.O.; Pendleton, L. Mangrove ecosystem service values and methodological approaches to valuation: Where do we stand? Front. Mar. Sci. 2018, 5, 376. [Google Scholar] [CrossRef]
  4. Mwansasu, S. Causes and Perceptions of Environmental Change in the Mangroves of Rufiji Delta, Tanzania: Implications for Sustainable Livelihood and Conservation. Ph.D. Thesis, Stockholm University, Stockholm, Sweden, 2016. [Google Scholar]
  5. Mangora, M.M.; Shalli, M.S. Sacred Mangrove Forests: Who Bears the Pride? In Science, Policy and Politics of Modern Agricultural System; Behnassi, M., Shahid, S.A., Mintz-Habib, N., Eds.; Springer: Dordrecht, The Netherlands, 2014; pp. 291–305. [Google Scholar]
  6. Wagner, G.M.; Sallema-Mtui, R. The Rufiji Estuary: Climate Change, Anthropogenic Pressures, Vulnerability Assessment and Adaptive Management Strategies; Springer: Cham, Switzerlnad, 2016; pp. 183–207. [Google Scholar]
  7. Masalu, D.C.P. Challenges of coastal area management in coastal developing countries—Lessons from the proposed Rufiji delta prawn farming project, Tanzania. Ocean Coast. Manag. 2003, 46, 188–195. [Google Scholar] [CrossRef]
  8. Kimirei, I.A.; Igulu, M.M.; Semba, M.; Lugendo, B.R. Small Estuarine and Non-Estuarine Mangrove Ecosystems of Tanzania: Overlooked Coastal Habitats? In Estuaries: A Lifeline of Ecosystem Services in the Western Indian Ocean; Diop, S., Scheren, P., Machiwa, J.F., Eds.; Springer: Cham, Switzerland, 2016; pp. 209–226. [Google Scholar]
  9. UNEP. The Importance of Mangroves to People: A Call to Action; van Bochove, J., Sullivan, E., Nakamura, T., Eds.; UNEP: Cambridge, UK, 2014; ISBN 9789280733976. [Google Scholar]
  10. Islam, M.M.; Sunny, A.R.; Hossain, M.M.; Friess, D.A. Drivers of mangrove ecosystem service change in the Sundarbans of Bangladesh. Singap. J. Trop. Geogr. 2018, 39, 244–265. [Google Scholar] [CrossRef]
  11. Fedele, G.; Locatelli, B.; Djoudi, H. Mechanisms mediating the contribution of ecosystem services to human well-being and resilience. Ecosyst. Serv. 2017, 28, 54. [Google Scholar] [CrossRef]
  12. Costanza, R.; de Groot, R.; Braat, L.; Kubiszewski, I.; Fioramonti, L.; Sutton, P.; Farber, S.; Grasso, M. Twenty years of ecosystem services: How far have we come and how far do we still need to go? Ecosyst. Serv. 2017, 28, 1–16. [Google Scholar] [CrossRef]
  13. Sinare, H.; Gordon, L.J.; Enfors Kautsky, E. Assessment of ecosystem services and benefits in village landscapes—A case study from Burkina Faso. Ecosyst. Serv. 2016, 21, 141–152. [Google Scholar] [CrossRef] [Green Version]
  14. Owuor, M.A.; Icely, J.; Newton, A.; Nyunja, J.; Otieno, P.; Tuda, A.O.; Oduor, N. Mapping of ecosystem services flow in Mida Creek, Kenya. Ocean Coast. Manag. 2017, 140, 11–21. [Google Scholar] [CrossRef]
  15. Casado-Arzuaga, I.; Madariaga, I.; Onaindia, M. Perception, demand and user contribution to ecosystem services inthe Bilbao Metropolitan Greenbelt. J. Environ. Manag. 2013, 28, 1–6. [Google Scholar] [CrossRef]
  16. Ouko, C.A.; Mulwa, R.; Kibugi, R.; Owuor, M.A.; Zaehringer, J.G.; Oguge, N.O. Community perceptions of ecosystem services and the management of Mt. Marsabit forest in Northern Kenya. Environments 2018, 5, 121. [Google Scholar] [CrossRef] [Green Version]
  17. Gouwakinnou, G.N.; Biaou, S.; Vodouhe, F.G.; Tovihessi, M.S.; Awessou, B.K.; Biaou, H.S.S. Local perceptions and factors determining ecosystem services identification around two forest reserves in Northern Benin. J. Ethnobiol. Ethnomed. 2019, 15, 1–12. [Google Scholar] [CrossRef] [PubMed]
  18. Quintas-Soriano, C.; Brandt, J.S.; Running, K.; Baxter, C.V.; Gibson, D.M.; Narducci, J.; Castro, A.J. Social-ecological systems influence ecosystem service perception: A programme on ecosystem change and society (PECS) analysis. Ecol. Soc. 2018, 23, 3. [Google Scholar] [CrossRef] [Green Version]
  19. Banjade, M.R.; Liswanti, N.; Herawati, T.; Mwangi, E. Governing Mangroves: Unique Challenges for Managing Indonesia’s Coastal Forests; CIFOR and USAID Tenure and Global Climate Change Program: Washington, DC, USA, 2017. [Google Scholar]
  20. MNRT. National Forest Resources Monitoring and Assessment of Tanzania Mainland; Dar es Salaam, T., Ed.; Ministry of Natural Resource and Tourism: Dodoma, Tanzania, 2015; Available online: http://naforma.mnrt.go.tz (accessed on 20 October 2019).
  21. Wang, Y.; Bonynge, G.; Nugranad, J.; Traber, M.; Ngusaru, A.; Tobey, J.; Hale, L.; Bowen, R.; Makota, V. Remote sensing of Mangrove change along the Tanzania coast. Mar. Geod. 2003, 26, 35–48. [Google Scholar] [CrossRef]
  22. Mangora, M.M. Poverty and institutional management stand-off: A restoration and conservation dilemma for mangrove forests of Tanzania. Wetl. Ecol. Manag. 2011, 19, 533–543. [Google Scholar] [CrossRef]
  23. Mshale, B.; Senga, M.; Mwangi, E. Governing Mangroves: Unique Challenges for Managing Tanzania’s Coastal Forests; CIFOR and USAID Tenure and Global Climate Change Program; USAID: Washington, DC, USA, 2017. [Google Scholar]
  24. Nakamura, R. Direct and environmental uses of mangrove resources on Kilwa Island, southern Swahili coast, Tanzania. Ann. Jpn. Assoc. Middle East Stud. 2010, 26, 215–240. [Google Scholar] [CrossRef]
  25. Ngomela, A. The Contribution of Mangrove Forests to the Livelihoods of Adjacent Communities in Tanga and Pangani Districts. Ph.D. Thesis, Sokoine University of Agriculture, Morogoro, Tanzania, 2007. [Google Scholar]
  26. Peter, L. Assessment of the Status of Mangrove Vegetation and Their Degradation in Rufiji Delta in Tanzania. Ph.D. Thesis, University of Ghana, Accra, Ghana, 2017. [Google Scholar]
  27. Monga, E.; Mangora, M.M.; Mayunga, J.S. Mangrove cover change detection in the Rufiji Delta in Tanzania. West. Indian Ocean J. Mar. Sci. 2018, 17, 1–10. [Google Scholar] [CrossRef]
  28. Japhet, E.; Mangora, M.M.; Trettin, C.C.; Okello, J.A. Natural recovery of mangroves in abandoned rice farming areas of the Rufiji Delta, Tanzania. West. Indian Ocean J. Mar. Sci. 2019, 18, 25–36. [Google Scholar] [CrossRef] [Green Version]
  29. Schoonenboom, J.; Johnson, R.B. How to Construct a Mixed Methods Research Design. Kolner Z. Soz. Sozpsychol. 2017, 69, 107–131. [Google Scholar] [CrossRef]
  30. Hennink, M.M. Focus Group Discussions (Understanding Qualitative Research); Oxford University Press: New York, NY, USA, 2014; ISBN 978-0-19-985616-9. [Google Scholar]
  31. Orchard, S.E.; Stringer, L.C.; Quinn, C.H. Mangrove system dynamics in Southeast Asia: Linking livelihoods and ecosystem services in Vietnam. Reg. Environ. Chang. 2016, 16, 865–879. [Google Scholar] [CrossRef] [Green Version]
  32. Zhang, W.; Kato, E.; Bhandary, P.; Nkonya, E.; Ibrahim, H.I.; Agbonlahor, M.; Ibrahim, H.Y.; Cox, C. Awareness and perceptions of ecosystem services in relation to land use types: Evidence from rural communities in Nigeria. Ecosyst. Serv. 2016, 22, 150–160. [Google Scholar] [CrossRef]
  33. Boafo, Y.A.; Saito, O.; Jasaw, G.S.; Otsuki, K.; Takeuchi, K. Provisioning ecosystem services-sharing as a coping and adaptation strategy among rural communities in Ghana’s semi-arid ecosystem. Ecosyst. Serv. 2016, 19, 92–102. [Google Scholar] [CrossRef] [Green Version]
  34. Oteros-Rozas, E.; Martín-López, B.; González, J.A.; Plieninger, T.; López, C.A.; Montes, C. Socio-cultural valuation of ecosystem services in a transhumance social-ecological network. Reg. Environ. Chang. 2014, 14, 1269–1289. [Google Scholar] [CrossRef]
  35. Mensah, S.; Veldtman, R.; Assogbadjo, A.E.; Ham, C.; Glèlè Kakaï, R.; Seifert, T. Ecosystem service importance and use vary with socio-environmental factors: A study from household-surveys in local communities of South Africa. Ecosyst. Serv. 2017, 23, 1–8. [Google Scholar] [CrossRef]
  36. Ruiz-Frau, A.; Hinz, H.; Edwards-Jones, G.; Kaiser, M.J. Spatially explicit economic assessment of cultural ecosystem services: Non-extractive recreational uses of the coastal environment related to marine biodiversity. Mar. Policy 2013, 38, 90–98. [Google Scholar] [CrossRef]
  37. Ranganathan, P.; Pramesh, C.; Aggarwal, R. Common pitfalls in statistical analysis: Logistic regression. Perspect. Clin. Res. 2017, 8, 148–151. [Google Scholar] [CrossRef]
  38. Erlingsson, C.; Brysiewicz, P. A hands-on guide to doing content analysis. African J. Emerg. Med. 2017, 7, 93–99. [Google Scholar] [CrossRef]
  39. Dawson, N.; Martin, A. Assessing the contribution of ecosystem services to human wellbeing: A disaggregated study in western Rwanda. Ecol. Econ. 2015, 117, 62–72. [Google Scholar] [CrossRef] [Green Version]
  40. Warren-Rhodes, K.; Schwarz, A.M.; Boyle, L.N.; Albert, J.; Agalo, S.S.; Warren, R.; Bana, A.; Paul, C.; Kodosiku, R.; Bosma, W.; et al. Mangrove ecosystem services and the potential for carbon revenue programmes in Solomon Islands. Environ. Conserv. 2011, 38, 485–496. [Google Scholar] [CrossRef] [Green Version]
  41. He, S.; Gallagher, L.; Su, Y.; Wang, L.; Cheng, H. Identification and assessment of ecosystem services for protected area planning: A case in rural communities of Wuyishan national park pilot. Ecosyst. Serv. 2018, 31, 169–180. [Google Scholar] [CrossRef]
  42. Su, K.; Wei, D.Z.; Lin, W.X. Evaluation of ecosystem services value and its implications for policy making in China—A case study of Fujian province. Ecol. Indic. 2020, 108, 105752. [Google Scholar] [CrossRef]
  43. Quyen, N.T.K.; Berg, H.; Gallardo, W.; Da, C.T. Stakeholders’ perceptions of ecosystem services and Pangasius catfish farming development along the Hau River in the Mekong Delta, Vietnam. Ecosyst. Serv. 2017, 25, 2–14. [Google Scholar] [CrossRef]
  44. López-Santiago, C.A.; Oteros-Rozas, E.; Martín-López, B.; Plieninger, T.; Martín, E.G.; González, J.A. Using visual stimuli to explore the social perceptions of ecosystem services in cultural landscapes: The case of transhumance in Mediterranean Spain. Ecol. Soc. 2014, 19, 27. [Google Scholar] [CrossRef]
  45. Makonese, T.; Ifegbesan, A.P.; Rampedi, I.T. Household cooking fuel use patterns and determinants across southern Africa: Evidence from the demographic and health survey data. Energy Environ. 2018, 29, 29–48. [Google Scholar] [CrossRef] [Green Version]
  46. Moutouama, F.T.; Biaou, S.S.H.; Kyereh, B.; Asante, W.A.; Natta, A.K. Factors shaping local people’s perception of ecosystem services in the Atacora Chain of Mountains, a biodiversity hotspot in northern Benin. J. Ethnobiol. Ethnomed. 2019, 15, 38. [Google Scholar] [CrossRef]
  47. Joshi, G.; Negi, G.C.S. Quantification and valuation of forest ecosystem services in the western Himalayan region of India. Int. J. Biodivers. Sci. Ecosyst. Serv. Manag. 2011, 7, 2–11. [Google Scholar] [CrossRef] [Green Version]
  48. Liingilie, A.S.; Kilawe, C.; Kimaro, A.; Rubanza, C.; Jonas, E. Effects of salt making on growth and stocking of mangrove forests of south western Indian Ocean coast in Tanzania. Mediterr. J. Biosci. 2015, 1, 27–31. [Google Scholar]
  49. Damastuti, E.; de Groot, R. Participatory ecosystem service mapping to enhance community-based mangrove rehabilitation and management in Demak, Indonesia. Reg. Environ. Chang. 2019, 19, 65–78. [Google Scholar] [CrossRef] [Green Version]
  50. Small, N.; Munday, M.; Durance, I. The challenge of valuing ecosystem services that have no material benefits. Glob. Environ. Chang. 2017, 44, 57–67. [Google Scholar] [CrossRef]
  51. Seary, R.C.O. Mangroves, Fisheries, and Community Livelihoods. Ph.D. Thesis, University of Cambridge, Cambridge, UK, 2019. [Google Scholar]
  52. Nesheim, I.; Dhillion, S.S.; Stølen, K.A. What happens to traditional knowledge and use of natural resources when people migrate? Hum. Ecol. 2006, 34, 99–131. [Google Scholar] [CrossRef]
  53. Meijaard, E.; Abram, N.K.; Wells, J.A.; Pellier, A.S.; Ancrenaz, M.; Gaveau, D.L.A.; Runting, R.K.; Mengersen, K. People’s Perceptions about the Importance of Forests on Borneo. PLoS ONE 2013, 8, e73008. [Google Scholar] [CrossRef] [Green Version]
  54. Boafo, Y.A.; Saito, O.; Kato, S.; Kamiyama, C.; Takeuchi, K.; Nakahara, M. The role of traditional ecological knowledge in ecosystem services management: The case of four rural communities in Northern Ghana. Int. J. Biodivers. Sci. Ecosyst. Serv. Manag. 2016, 12, 1–2. [Google Scholar] [CrossRef] [Green Version]
  55. Iniguez-Gallardo, V.; Halasa, Z.; Briceño, J. People’s Perceptions of Ecosystem Services Provided by Tropical Dry Forests: A Comparative Case Study in Southern Ecuador. In Tropical Forests—New Edition; Sudarshana, P., Nageswara-Rao, M., Soneji, J., Eds.; Intechopen: London, UK, 2018; pp. 95–113. [Google Scholar]
Figure 1. Map of the Rufiji Delta showing the study area and the location of the six studied villages. Mohoro, Mtunda A, and Ruaruke Magharibi are located distant from the mangrove forests and electrified. Ruma, Mbwera Magharibi, and Mbuchi are located in close proximity to the mangrove forests and are non-electrified.
Sustainability 13 00063 g001
Figure 2. Flow chart of the methodology for data collection and analysis.
Sustainability 13 00063 g002
Figure 3. Community awareness of ecosystem services provided by mangroves in the study area grouped by category (n = 30 per grouped village). Bars marked with different letters within the same category of ecosystem services indicate significant differences (at p < 0.05). Error bars represent SE.
Sustainability 13 00063 g003
Figure 4. Radar diagram showing awareness of respondents as a percentage for each of the identified mangrove ecosystem services in the study area (n = 30 per grouped village). P = provisioning services, R = regulating services, C = cultural services, and S = supporting services.
Sustainability 13 00063 g004
Figure 5. Mangrove-reliant and -non-reliant stakeholders in the study area (n = 30 per grouped village).
Sustainability 13 00063 g005
Table 1. General information about socioeconomic aspects in the study area with regard to focus group discussions and key informant interviews.
Variables ExploredVillage Distant from Mangroves (DM)Village Close to Mangroves (CM)
Major socioeconomic activities ranked from the most to least importantFarmingFarming
Small businessFishing
FishingSmall business
TransportationUtilization of mangroves
Livestock keepingLivestock keeping
Arts and craftsBeekeeping
BeekeepingSalt production
Important crops grownRice, maize, cassava, and bananaRice, coconut, maize, and cashew nuts
Rice farming siteOften practiced in mangrove areasRarely practiced in mangrove area
Major sources of lighting fuelElectricity/solar lamps, kerosene, and candlesKerosene/solar lamps and torch
Major sources of cooking fuelCharcoal/liquefied natural gas and firewood from inland forestsFirewood from mangrove forests and coconut shell
Construction materials for most of the housesBricks/poles, cemented walls, and roofed with iron sheetPoles, mud walls, and roofed with thatches
Major religionMuslims, Christians, and a few traditional believersMuslims, Christians, and a few traditional believers
Table 2. Socioeconomic and demographic characteristics of households in the study area.
Village Distant from Mangroves
(DM, n = 30)
Village Close to Mangroves
(CM, n = 30)
Overall
VariableCategoryResponse in %
GenderFemale202724
Male807377
Age18–3527717
36–55435750
>56303833
Marital statusMarried807778
Single3107
Divorced101010
Widow735
Level of educationInformal333031
Primary536358
Secondary1338
College302
Household size1–4233730
5–8534750
>8231720
Main occupationFarming505050
Fishing132016
Small business231318
Mangrove Cutters6108
Public servants333
Others333
Income per month<50,00071712
51,000–100,000273028
100,001–150,000201317
>150,000474043
Residence time<10 years402733
11–15 years232323
>15 years375043
Distance to mangroves<500 m03718
600 m–1 km203025
1 km–1.5 km272727
>1.5 km53730
Table 3. Mangrove ecosystem services identified in the study area during focus group discussions and key informant interviews. Letters (A and B) indicate services that were identified before (B) and after (A) interactions between facilitators and the communities. X = not identified.
Mangrove Ecosystem ServicesVillage Distant from Mangroves (DM)Village Close to Mangroves (CM)Community Expressions on the Importance of Identified Ecosystem Services
Poles (P)BBFor construction of houses and making furniture, fences, and boats. Mangrove species of the family Rhizophoraceae (Ceriops tagal, Rhizophora mucronata and Bruguiera gymnorhiza) are most preferred for poles due to their high wood strength.
Firewood (P)BBMangrove woods from Ceriops tagal and Rhizophora mucronata species are used as a source of cooking energy due to their good burning quality.
Honey (P)B **BAdditives in porridge, tea, and breads; also sterilize wounds and heals burns.
Medicine (P)A **BXylocarpus granatum leaves are traditionally used as medicine for stomachache.
Fodder (P)A **BLeaves of Avicennia marina and Heritiera littoralis are used to feed cattle.
Fruit (P)A *BThe fruits from Avicennia marina are grinded and chewed to reduce heartburns.
Coastal protection (R)A **BMangroves stabilize the coastline and prevent erosion from waves and flood.
Climate regulation (R)BBMangroves provide shade and influence rainfall.
Sediment trapping (R)XB **Improved soil fertility for rice farming.
Spiritual belief (C) BBMangroves provide place for rituals such as divinity to control drought.
Education (C)AASource of knowledge and information about mangrove ecosystems.
Natural beauty (C)A **AOpportunity to view its components for mental and physical relaxation.
Ecotourism (C)A **BPeople visit mangroves for wildlife viewing.
Habitat (S)ABHome for variety of fish, crab, shrimp, and mollusk, which act as a source of food.
Soil formation (S)A *B **Mangroves filter sediments to form soil, which is then mined to build local houses.
Latrine site (S)XB **Acts as an open defecation site for community who do not have toilets.
P = provisioning services, R = regulating services, C = cultural services, and S = supporting services. * The stated service was recognized by only one village within the group. ** The stated service was identified by only two villages within the group.
Table 4. Mangrove ecosystem services and their relative importance identified through focus group discussions and key informant interviews in the study area.
RankVillage Distant from Mangroves (DM)Village Close to Mangroves (CM)
Services arranged in the order of their importance from top to bottom of the table per grouped villagePolesPoles
Climate regulationFirewood
FirewoodCoastal protection
HoneyHabitats/nursery ground for fish
Coastal protectionHoney
Habitats/nursery ground for fish Climate regulation
Natural beauty Natural beauty
Spiritual beliefSpiritual belief
Education Fodder
Traditional medicinesTraditional medicines
Sediment trapping
Ecotourism
Education
Soil formation
Fruit
Latrine site
Table 5. The relative importance of ecosystem services provided by mangroves in the study area according to the household survey.
Mangrove Ecosystem ServicesVillage Distant from Mangroves (DM, n = 30)Village Close to Mangroves (CM, n = 30)Overall
Provisioning Services (P)
Poles3.5 a (0.6)3.9 b (0.3)3.7 (0.5)
Firewood2.6 a (0.8)3.5 b (0.5)3.1 (0.8)
Honey2.6 (0.6)2.7 (0.6)2.6 (0.6)
Traditional medicines 1.1 (0.3)1.4 (0.4)1.3 (0.3)
Fodder1.0 (0.2)1.4 (0.3)1.2 (0.3)
Fruit1.0 (0.2)1.1 (0.2)1.1 (0.2)
Average (P)1.9 a (0.2)2.3 b (0.3)2.2 (0.2)
Regulating Services (R)
Coastal protection2.5 a (0.9)3.3 b (0.7)2.9 (0.8)
Climate regulation 2.6 (0.7)2.4 (0.6)2.5 (0.6)
Sediment trapping1.1 (0.3)1.4 (0.4)1.2 (0.3)
Average (R)2.1a (0.3)2.3 b (0.2)2.2 (0.2)
Cultural Services (C)
Natural beauty 1.8 a (0.5)2.1 b (0.7)1.9 (0.6)
Spiritual belief1.4 (0.5)1.6 (0.6)1.5 (0.5)
Ecotourism1.1 (0.3)1.3 (0.4)1.2 (0.4)
Education1.2 (0.4)1.2 (0.4)1.2 (0.4)
Average (C)1.4 a (0.2)1.6 b (0.4)1.5 (0.3)
Supporting Services (S)
Habitats for fish2.0 a (0.6)2.7 b (0.4)2.4 (0.5)
Soil formation1.0 a (0.0)1.2 b (0.3)1.1 (0.2)
Latrine site1.0 (0.0)1.1 (0.1)1.0 (0.1)
Average (S)1.3 a (0.2)1.6 b (0.3)1.5 (0.2)
Numbers outside and inside the brackets indicate means and standard deviations (SD), respectively. Means with different superscript letters within rows are significantly different at p < 0.05. Likert scale: 1 = not important, 2 = least important, 3 = second most important, and 4 = most important.
Table 6. Perceived importance of mangrove ecosystem services by occupation in the study area (n = 60).
Ecosystem ServicesFarmersFishermenSmall BusinessMangroves CuttersPublic ServantsOthersTotal
(n = 30)(n = 10)(n = 11)(n = 5)(n = 2)(n = 2)(n = 60)
Provisioning services
Poles3.7 (0.6)4.0 (0.5)3.7 (0.5)3.4 (0.5)3.5 (0.7)4.0 (0.4)3.7 (0.5)
Firewood3.4 (0.8)2.9 (0.9)3.0 (0.8)3.1 (0.4)2.5 (0.7)3.4 (0.9)3.1 (0.8)
Honey2.7 (0.5)3.1 (0.4)2.4 (0.5)2.0 (0.4)2.1 (0.3)3.0 (0.9)2.6 (0.6)
Traditional medicines 1.3 (0.4)1.4 (0.5)1.1 (0.3)1.5 (0.4)1.0 (0.0)1.0 (0.0)1.3 (0.3)
Fodder1.2 (0.4)1.1 (0.3)1.2 (0.5)1.4 (0.6)1.5 (0.6)1.0 (0.0)1.2 (0.3)
Fruit 1.0 (0.2)1.1 (0.3)1.1 (0.3)1.1 (0.1)1.0 (0.0)1.0 (0.0)1.1 (0.2)
Regulating services
Coastal protection2.8 (0.7)2.7 (1.1)3.2 (0.6)3.0 (0.6)3.0 (1.2)3.0 (0.5)2.9 (0.8)
Climate regulation 2.6a (0.6)2.4a (0.7)2.6a (0.5)2.0 b (0.0)2.7 a (0.7)2.6 a (0.7)2.5 (0.6)
Sediment trapping1.3 (0.3)1.1 (0.3)1.4 (0.4)1.1 (0.1)1.0 (0.0)1.0 (0.0)1.2 (0.3)
Cultural services
Natural beauty 2.0 (0.6)1.9 (0.7)1.8 (0.6)2.2 (0.4)2.0 (0.0)1.5 (0.7)1.9 (0.6)
Spiritual belief1.6 a (0.4)1.5 a (0.5)1.3 a (0.5)1.6 a (0.4)1.0 b (0.0)2.0 a (0.2)1.5 (0.5)
Ecotourism1.2 (0.3)1.2 (0.4)1.4 (0.5)1.0 (0.0)1.5 (0.6)1.0 (0.0)1.2 (0.4)
Education1.1 (0.3)1.3 (0.5)1.4 (0.5)1.2 (0.4)1.0 (0.0)1.0 (0.0)1.2 (0.4)
Supporting services
Habitats for fish2.3 a (0.5)2.9 b (0.7)2.2 a (0.5)2.6 b (0.5)2.0 a (0.7)2.4 a (0.3)2.4 (0.5)
Soil formation1.1 (0.3)1.0 (0.0)1.2 (0.2))1.0 (0.0)1.0 (0.0)1.0 (0.0)1.1 (0.2)
Latrine site1.0 (0.0)1.0 (0.3)1.1 a (0.5)1.0 (0.0)1.0 (0.0)1.0 (0.3)1.0 (0.1)
Numbers outside and inside the brackets indicate means and standard deviations (SD), respectively. Means with different superscript letters within rows are significantly different at p < 0.05. Likert scale 1 = not important, 2 = least important, 3 = second most important, and 4 = most important.
Table 7. Stakeholders’ reliance on mangroves by occupation in the study area.
Mangrove-Reliant Mangrove-Non-Reliant
Occupationn%Examples of Cited Services from Mangrovesn%Examples of Cited Alternative
Village distant from mangroves (DM), n = 30Farmers747Provide suitable site for rice farming853Farming done in upland areas
Fishermen 4100Fish caught in mangrove swamp and Indian Ocean 00
Small business343Honey sourced from mangrove forests 457Honey sourced from inland forests
Mangrove cutters2100Poles from mangroves00
Public servants00 1100House made by brick and cement
Others 1100Place for education00
Village close to mangroves (CM), n = 30Farming15100Place for coastal defense, farming, and rituals00
Fishing6100Home for variety of fish00
Small business4100Sources of firewood00
Mangrove cutters3100Source of honey, poles, and firewood00
Public servants1100Source of building poles00
Others1100Defecation site00
Table 8. Factors that influence communities’ awareness of mangrove ecosystem services (n = 60).
VariablesProvisioning ServicesRegulating Services
βSESigExp(β)βSESigExp(β)
Gender of household head2.681.250.03 *14.623.171.380.02 *23.75
Age of household0.350.640.581.430.550.600.361.73
Education level of household0.420.880.631.520.220.790.781.25
Main occupation of household 0.410.380.281.510.150.270.581.16
Household size0.350.680.621.400.580.630.351.79
Household income 0.690.490.151.990.750.460.092.12
Contact of household with management committee1.740.830.04 *5.672.160.900.02 *8.69
Distance from household homes to mangroves −0.700.390.04 *0.46−1.030.410.01 *0.36
Residence time of household1.410.590.02 *4.101.180.520.03 *3.26
Constant−7.784.170.060.01−8.643.860.030.01
VariablesCultural ServicesSupporting Services
βSESigExp(β)βSESigExp(β)
Gender of household head2.251.200.01 *9.460.240.820.781.27
Age of household0.390.680.560.680.370.520.481.45
Education level of household1.810.870.086.110.210.550.700.81
Main occupation of household0.580.300.060.560.040.220.851.04
Household size0.140.610.820.870.420.490.380.65
Household income0.700.490.150.490.020.350.951.02
Contact of household with management committee2.730.930.04 *15.230.560.650.371.76
Distance from household homes to mangroves−1.100.440.01 *0.33−0.790.320.01 *0.45
Residence time of household1.110.470.02 *3.040.870.340.02 *2.38
Constant−1.833.510.600.16−0.272.630.910.76
* indicates significant factors at p < 0.05, SE indicates standard error, β is the coefficient of regression, a negative sign (-) of the coefficient implies that a unit increase in a specific variable will decrease the chance of the community to identify the stated services by a factor of the observed odds order (Exp(β)).
Publisher’s Note: MDPI stays neutral with regard to jurisdictional claims in published maps and institutional affiliations.

