Article

A Proposal for Measuring In-Use Buildings’ Impact through the Ecological Footprint Approach

by
Alice Paola Pomè
*,
Chiara Tagliaro
and
Gianandrea Ciaramella
Department of Architecture, Built Environment and Construction Engineering, Politecnico di Milano, 20133 Milan, Italy
*
Author to whom correspondence should be addressed.
Sustainability 2021, 13(1), 355; https://doi.org/10.3390/su13010355
Submission received: 30 November 2020 / Revised: 27 December 2020 / Accepted: 29 December 2020 / Published: 2 January 2021

Abstract

:
To reduce the environmental impact of the construction sector, sustainable strategies for managing the in-use phase of buildings must be integrated urgently. Current green certifications present several limitations and, in particular, do not help determine where to focus for reducing the environmental demand of buildings. Among existing indicators, the ecological footprint (EF) is the most useful for assessing the buildings’ environmental performance through impact sources that reveal the over-consumption of resources. The present paper expands EF by taking into account the role of human behavior in over-consumption, and thus the efficiency in buildings’ use. After comparing ecological footprint with the existing green certifications, the paper demonstrates how a new integrated ecological footprint assessment can describe the impact of built-up, energy consumption, water consumption, material consumption, food and drink, mobility, waste generation, recycling potential, and occupants in the environmental efficiency of a building. The application of a case study demonstrates the reliability and the effectiveness of the model and shows that the estimated ecological deficit reflects not only the consumption of energy and materials, but also the behaviors of building users. This highlights the need for integrating a sustainable culture in the users of buildings.

1. Introduction

Studies on environmental assessment demonstrate the need for integrating sustainable management in the evaluation of buildings to monitor their impact on the environment more effectively and efficiently [1,2]. The construction sector is a major contributor to global warming, carbon emissions and environmental degradation [3,4,5,6,7,8,9].
Since the early 1980’s, the concept of “sustainable development” has been recognized as a new value [10], which entails the goal of making economies more productive without damaging future generations [11]. While climate change does not seem to be slowing down, the implementation of new strategies and policies to reduce greenhouse gas emissions and energy consumption is urgent.
To improve the environmental performance of buildings, several methods, environmental standards, and policies have been elaborated. Globally, there are over 600 different sustainable building certifications [12,13], which makes the comparison of how buildings perform hard, as they are built on different baseline standards [14].
Given the multiplicity of tools (e.g., BREEAM, LEED, DGNB, CASBEE, and Green Star) [15,16,17,18,19], a few issues emerge, mainly showing two orders of problems: technical and methodological.
Among technical problems, each rating system is the result of building standards that vary not only from country to country but even at sub-national level. This inconsistency brings increasing challenges from an implementation standpoint as it makes the systems based on different parameters and structured through different schemes and languages, including the use of different weights to evaluate the same parameter. Therefore, the unique characteristics and focus of each rating tool constitute a barrier to increasing knowledge about the overall environmental impact and sustainability of buildings [20,21]. As the JRC Science for Policy Report states: “the lack of knowledge is not only due to a lack of information, but […] depends very much on the way the information is provided” [22]. In effect, the limited comparability of these measures makes it difficult to convey among non-experts the real meaning of the results, which affects the individual energy-related conducts and decisions. Common standards and a global set of benchmark parameters are pre-requisites to increase the effectiveness, the flexibility of application, and the efficiency of green measures, as they would allow multiple stakeholders to compare buildings easily at an international level by using a shared “language” [23].
Among methodological problems, rating systems give a picture of a building’s environmental impact in one single moment of their life cycle. For instance, while LEED standard certifies the “greenness” of buildings at the design stage, often the same buildings have been found to perform poorly once in normal operation, showing a significant shift between predicted and actual operation [24]. Of course, not only the construction phase, but also the occupancy phase is likely to affect the actual functioning of a building. Therefore, the need for continuous monitoring of how buildings work in their in-use phase comes to light, for both aligning operation with expectations and for ensuring the best environmental performance over time [25]. BREEAM tries to address this issue. It allows a test to be performed once a year, but this is just on a voluntary basis [20]. Thus, buildings certified “excellent” may downgrade their operations after some years but still maintain a high certification if this is not updated regularly. In addition, BREEAM uses different methods according to the stage of building life cycle (BLC) when the evaluation is performed. This strategy complicates the evaluation process, as each stage uses different categories of impact to define the environmental performance.
Finally, the last methodological problem regards the definition of buildings’ inefficiency. Wackernagel and Rees [26] (p. 118) wrote that “It might be sustainable to operate a gas guzzling Rolls Royce if it was shared among twenty friends and maintained for a long time. On the other hand, it might be unsustainable for everybody to own an electric car”. This, translated in the built environment, means that a high-performance building may be sustainable if shared among users. Therefore, it is necessary to account for the impact of building occupancy to reveal if the building is environmentally efficient or inefficient. Green certifications fail to express the concept of inefficiency.
A valuable approach to consider in the scope of solving the downsides of common green certification is the ecological footprint (EF) concept.

2. Why Use EF to Assess Building Sustainability

The science of sustainability (SS) needs to find a suitable index to explain complex human-nature interactions [27]. Sala et al. [27] highlight that SS requires a solution-oriented approach. The EF concept can come be handy for fulfilling this methodological requirement. Indeed, EF represents a reasonable measure for evaluating the built environment’s contribution to sustainable development and can help decision-making and social learning by showing the concreteness of sustainability issues and producing goal-oriented and actionable knowledge about the ability of the built environment to respect biocapacity.
EF looks at the “biocapacity”, namely the capacity of an ecosystem to renew what has been consumed by the demand [28,29]. The Earth is a closed, material, and limited system with defined capacity of natural resources production and waste absorption [30]. Even if the biocapacity of Earth has increased by about 27% in the past 50 years thanks to technology, humanity is in overshoot, meaning that people are using more resources than the Earth can renew [31]. The importance of implementing the concept of “sustainable development” in all sectors is urgent [10,11].
Measures for sustainable development can be indicators or ratings [32,33]. Whereas indicators report only one dimension of sustainability (i.e., energy), ratings (or indices) are aggregations of underlying indicators [10]. Therefore, ratings, such as green certifications, provide a multidimensional and simplified overview of a system of indicators [11].
What is missing from rating systems is to define the use and overuse of Earth’s resources. Mancini [34] argues that the one sustainable index able to reveal them is the EF. This is a multiscale approach, applicable at all levels of aggregation, from individual to global scale.

2.1. EF and Definition

EF calculates the resources used and waste generated by a society and compares them to the planet’s capacity to produce resources and absorb waste. More recently, the EF has been used as an indicator of corporate environmental performances [35].
There are primarily two methods of estimating the EF as global hectares of land (gha) [36]. The “comprehensive method” calculates EF through macroscopic statistics on overall consumption, using life cycle assessment (LCA) data. The “component method” calculates EF by considering six types of equivalence productive lands (i.e., cropland, grazing land, forest land, fishing land, built-up land and CO2 sinks) that are impacted by the consumption of different products [26]. The latter, which is an input-output analysis method, seems a more useful approach with the goal for EF to evaluate the environmental impact of buildings, but a link between EF and LCA would improve the effectiveness of the EF index [37].
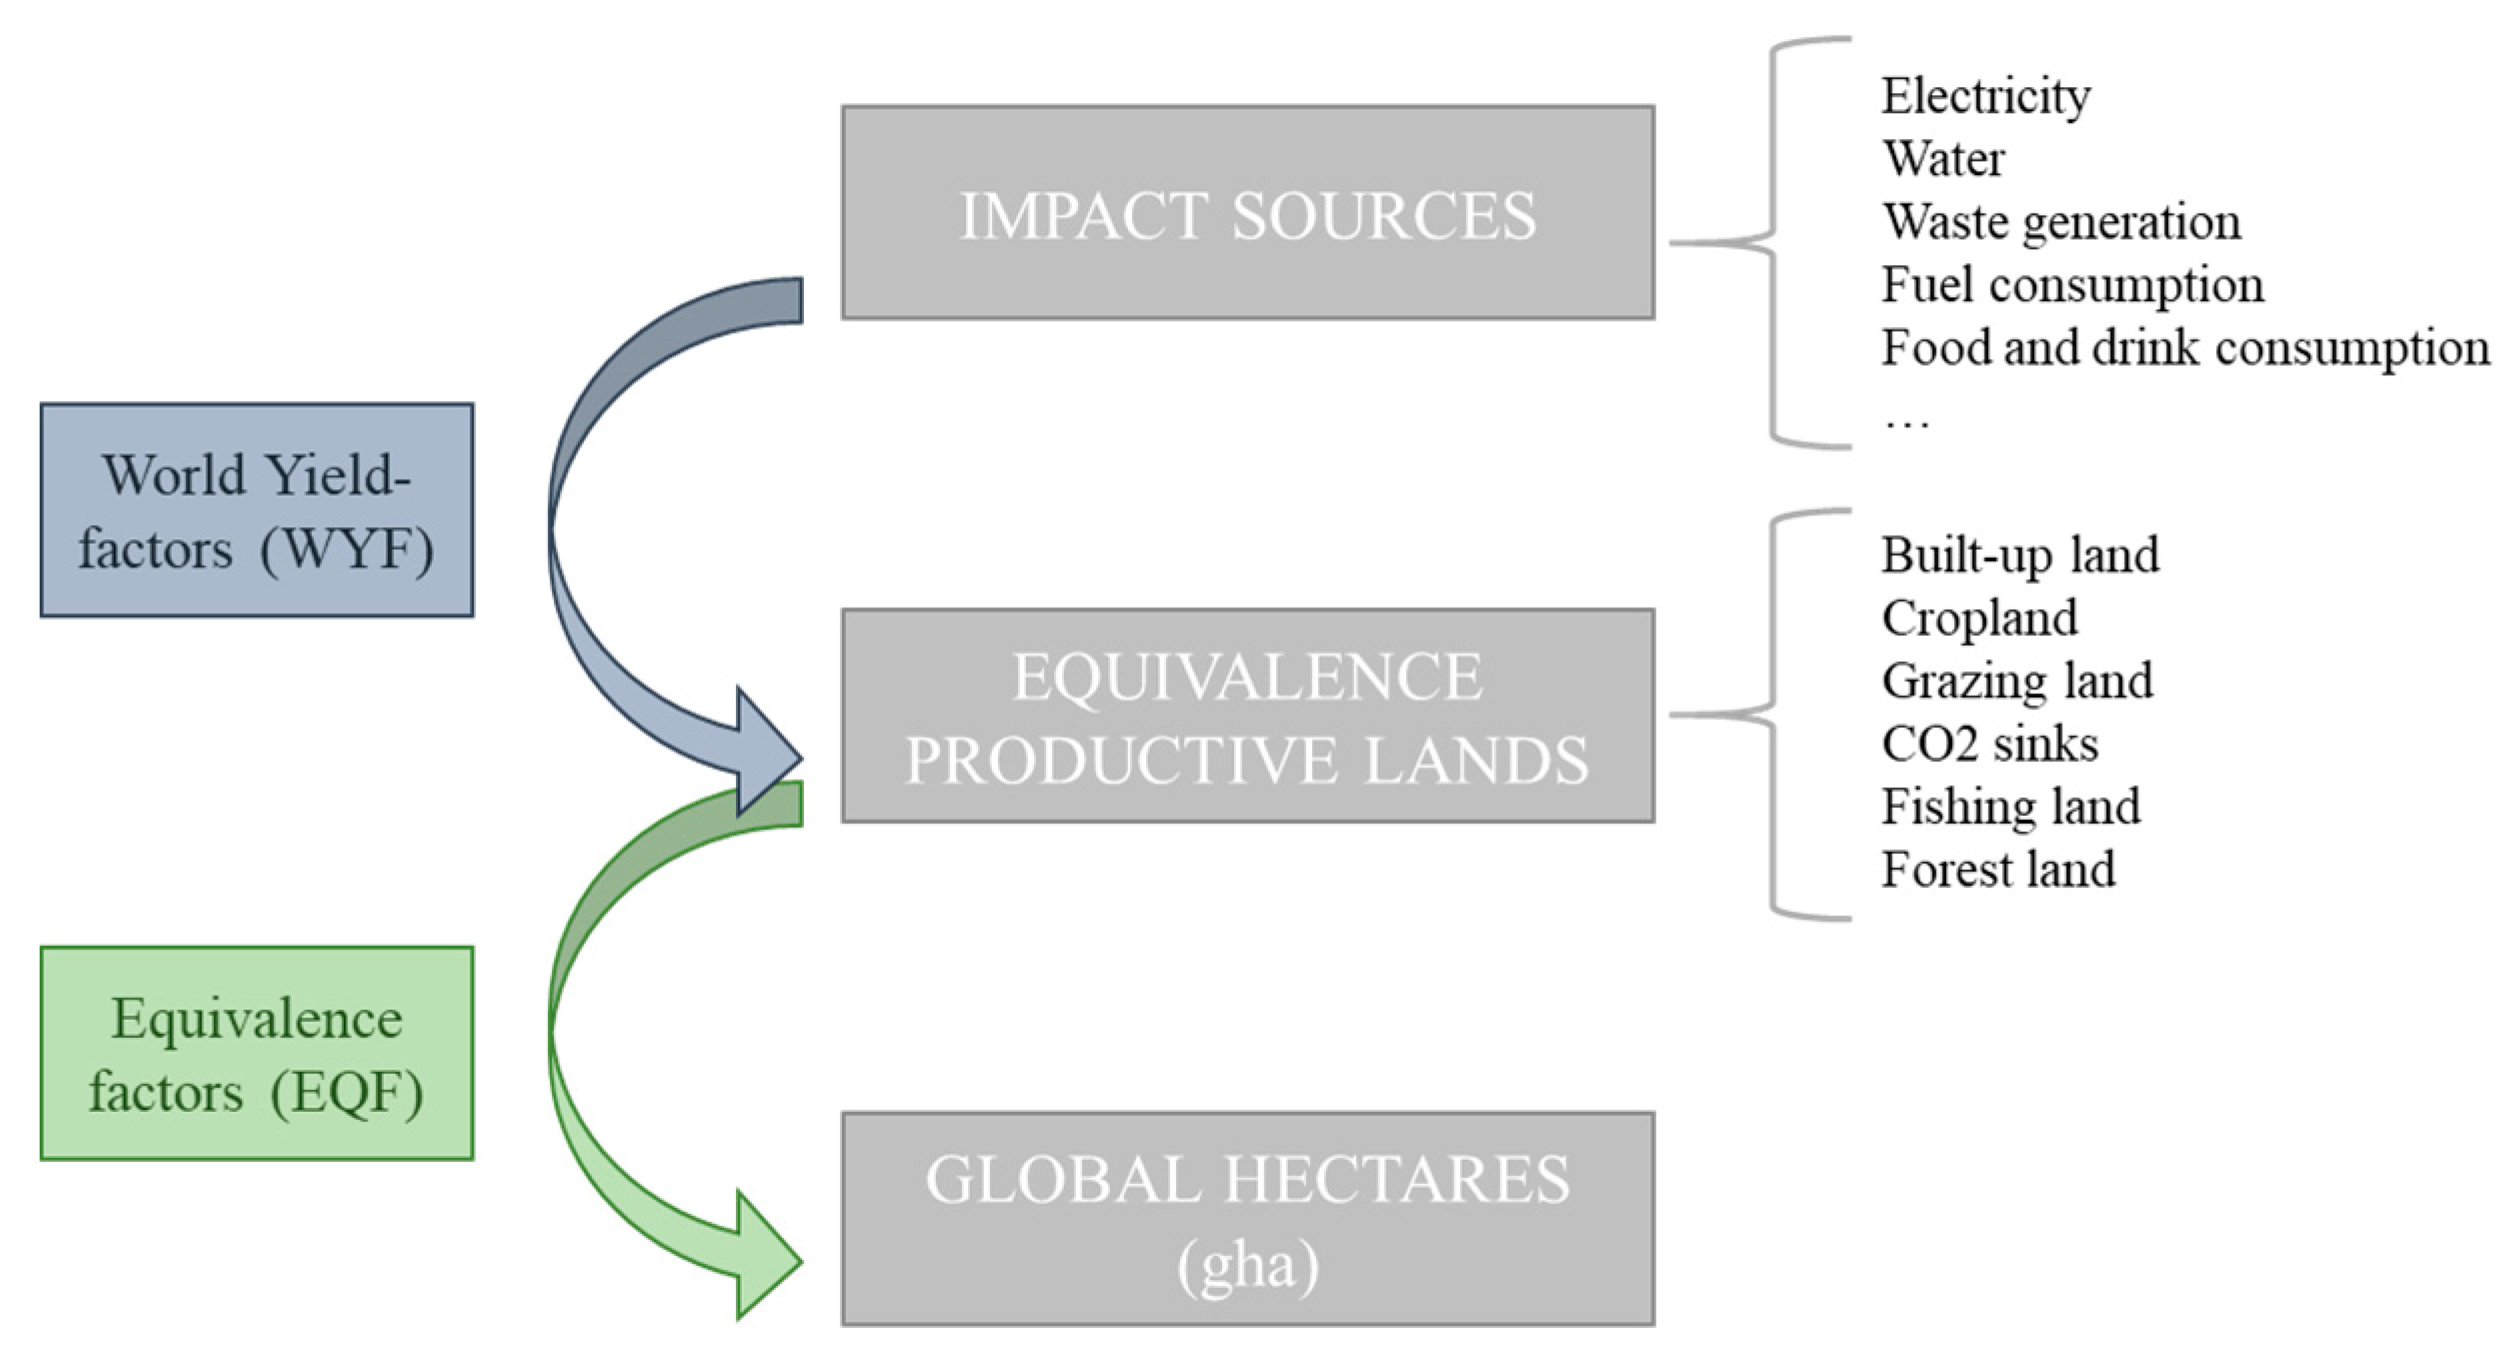
The EF principle is based on the concept of converting impact sources, such as electricity, water, waste generation, fuel consumption, food consumption and more into the equivalence productive lands that would be needed to produce and/or absorb their impacts [38]. To do this conversion, the EF calculation methodology relies on two steps, as Figure 1 shows. First the so-called “world yield-factors” (WYF) convert consumptions and/or emissions into equivalence productive lands. Subsequently, “equivalence factors” (EQF) convert the productive lands into global hectares (gha) that correspond to common hectares [38,39].
To date, the most important institution applying the EF is the global footprint network (GFN) [31], which provides annual worldwide accounts of EF and biocapacity, and defines world yield-factors (WYF) and equivalence factors (EQF) every year [31].
Based on the GFN, the Earth’s has been in overshoot since the 1970’s, and, nowadays, it needs 1.7 Earths to overcome the demand for resources [31]. Initially, studies used EF to evaluate the impact of consumptions of nations and regions, then it started to be applied to smaller environments, like buildings, as shown in Table 1.
Many critics (e.g., [41,46,47,48,49]) argued that the calculation of EF oversimplifies the complex task of measuring sustainability, and that it was inadequate for regional design of policies [41]. In response to these issues, researchers proposed several modifications.
First, EF started being adapted to be used in the design of meaningful national and urban policies, linking economic activities and environmental impacts. Bicknell et al. [40] assessed the EF through the input-output analysis, allowing the calculation of consumptions by translating the demand of land through the WYF. Then, Lenzen and Murray [41] proposed an approach that reflects better the image of a footprint on land by describing the impact of human use of land on ecosystems. Their approach demonstrated EF’s potential to expose inefficient resource use.
Afterwards, some studies implemented this approach to monitor the environmental impacts of buildings. Wood and Lenzen [1] developed a hybrid ecological footprint (HEF) for two buildings to enable the use of the results in urban policy formulation. They did not look at the impacts of all the six equivalence productive lands, but they limited their assessment to generic land disturbance and greenhouse gas emissions. Then, Bastianoni et al. [42] applied the EF on the construction of two Italian buildings. They introduced the use of embodied energy to translate the use of materials into equivalence productive lands. However, they do not implement a calculation model. Acosta and More [39] developed an ecological footprint assessment (EFA) to measure the ecological sustainability of organizations. They pictured a building’s impact through the materials used and the energy spent. Since their application, the models to assess buildings’ environmental impact were built on looking at the consumptions generated into the building, called impact sources [4,38,39,45,46]. However, these approaches were applied only once over the building’s lifetime, so they were unable to track evolutions over time.
To overcome the limit of time, EF was later integrated with system dynamics [43]. Their objective was to define scenarios to formulate integrated policies for sustainable improvements. However, this approach is too complicated to be applied at the building level as it requires comparable or different scenarios of the analyzed building. Finally, Husain and Prakas [45] applied EF to BLC, which is a good compromise for plotting the sustainable progress over time. Nevertheless, the account of people during the in-use stage of the building is not relevant in this approach.
If we look at the impact sources that have been considered into the above mentioned studies at the building level, some deficiencies can be detected. Table 2 shows that the most common impact sources are water consumption [4,38,39,44,45], energy consumption [4,38,39,44,45], material consumption [4,38,39,44,45], waste generation [4,39,45] and user mobility [4,39,44,45]. None of the existing applications applied all the Impact sources together, except for Husain and Prakas [45]. However, they don’t consider all the elements. For example, in developing food and drink, they just considered the consumption of food but disregarded drinks, and in implementing recycling potential, they only looked at the disposal stage of BLC, instead of considering all the waste produced in the in-use phase. Moreover, previous applications do not consider accurately the pressure that people and their behaviors have on EF.
In this regard, Brownell [37] emphasized the importance of evaluating the in-use phase of a building because it has the longest duration, compared to the other phases of a BLC (construction and disposal). He proposed a valuable theoretical framework including the estimation of: embodied footprint, which calculates the impact due to construction materials; operational footprint, which defines the impact of users; and influence footprint, which estimates the impact of building’s utilization over time [37]. Brownell’s approach to EF index is innovative as he emphasized that buildings do not stop consuming when unoccupied. Anyway, Brownell did not implement his idea into actual calculations but left it at a theoretical level. In this paper, we follow up on his proposal and develop it further.

2.2. Potential and Limitations of EF

The state-of-the-art suggests the potential of EF in showing the environmental impacts of buildings by condensing the human pressure on the environment into a single “figurative” quantity [35], which provides a snapshot of users’ current demand [39] and evaluates the environmental pressure generated by the built environment [42]. EF can assess the human “responsibility” in the environmental impact of buildings by looking not only at resource consumption but also at the presence of people in the building [38]. EF provides a glimpse of users’ current demand [39]. Finally, EF can potentially show variations in the sustainable performance of the built environment overtime [43,45].
Anyway, in its current state the EF index still presents some limitations if applied to buildings, for the following reasons:
  • It is mainly applied as a static snapshot (e.g., [39,46]);
  • It primarily includes energy and water consumption, along with waste and pollution generation, without considering the number of people occupying the building [4,38,39,44,45];
  • None of the previous studies addressed all impact sources together.
In conclusion, a system is still missing for expressing the environmental impact of a building over its in-use stage by picturing the consequences of its actual functioning on the planet.

3. Goals and Approach

Based on the literature review and on the limits detected into the previous implementations of the EF index, the aim of the present work is to establish a new conceptual model for calculating the environmental impact of buildings. This model will seek to:
  • Evaluate the environmental impact of buildings within the in-use phase of the BLC as this represents the most enduring stage and the most resource-consuming;
  • Reveal the efficiency or inefficiency of buildings by looking at people occupancy;
  • Integrate all the impact sources used in previous research that have an impact on the in-use phase;
  • Integrate the “comprehensive method” and the “component method” into a combined model. The two methods allow the evaluation of impact sources through the embodied energy of products and materials, and then estimate EF addenda through WYF and EQF.
We called this new model integrated ecological footprint assessment (IEFA). The factors of the conceptual model and calculation method are presented below, along with some necessary assumptions that were established to proceed with the IEFA implementation. Later, we discuss the model through a test on an existing building. Discussion and conclusions present the results of the test and prospective developments to work on.

4. Model Design

4.1. IEFA Impact Sources

Based on the discussion of previous studies (see Table 2), IEFA gathers all impact sources that have been already applied in the literature, and introduces an additional source, occupant, which includes the occupancy data as a proxy for human pressure on the environment. This addition, which develops concepts elaborated by Wackernagel and Rees [26] and Bornwell [37], represents a marked innovation compared to previous models. According to Wackernagel and Rees [26] the level of sustainability of a resource is reduced if it is shared among several people. Sustainability depends on the assessment of user consumption per time interval [26]. Thus, it is not possible to assess the environmental performance of a product (a building) without acknowledging the fundamental variables of user consumption and time. Wackernagel and Rees [26] proposed to approximate an individual’s need for land to 1.5 hectares per person; however, this serves only as a simple means for calculating individual EF. The IEFA model suggests using the occupant impact source to estimate simultaneous consumption by taking into account the number of hours spent in the building per individual.
Therefore, IEFA accounts for nine different Impact sources, as described in Table 3: built-up; energy consumption; water consumption; material consumption; food and drink; mobility; waste generation; recycling potential; and occupant.

4.2. Implementation through Equivalence Factors

As recommended in all EF calculation models to convert the Impact sources into addenda of IEFA, equivalence factors (EQF) available online at GFN [31] were used. EQF are scaling factors converting the actual areas of use of a single activity into global hectares’ equivalence. GFN provides five EQF, corresponding to five of the six equivalence productive lands, i.e., built-up land, forest land, fishing land, pastureland, and cropland.
Our model is based on EQF provided by GFN in 2019 [31], as depicted in Table 4.
Moreover, the proposed model considers also the impact on CO2 sinks, therefore further analysis was required to calculate the CO2 sinks. According to Mancini et al. [34], carbon is estimated through the so-called absorption factors, which represent CO2 emissions absorbed by oceans and land (cropland, forest and pastureland). 30% of the emission is absorbed by the ocean [50]. Among all sources of CO2, human activities (and, therefore, buildings) account for one of the predominant causes of the fossil fuel in the atmosphere.
For the sake of simplicity, our model considers only fuel emission, which is an approximation for all CO2 emissions. The absorption factor depends on the average carbon sequestration of ocean and land, as shown in Table 5.
To estimate the EQF for CO2 sink, it is necessary to divide the EQF (Table 4) for each component (ocean, forest, cropland and pastureland) by the absorption factor components (Table 5), as shown in the following Table 6.
Then, forest, cropland and pastureland need to be combined to estimate the CO2 sink factor for land. We applied the average, according to the following formula:
CO 2   sink factor for land   =   ( 0.47 + 0.52 + 0.26 ) 3 = 0.42 g h a t C O 2 ,
Finally, as ocean absorbs 30% of the emissions and land 70%, we combined the two components, according to the following formula:
CO 2   sink factor   =   ( 0.19 0.3 + 0.42 0.7 )   =   0.35   g h a t C O 2 ,

4.3. Integrated Ecological Footprint Assessment Addenda

The proposed model develops an algebraic sum of the nine IEFA addenda. Each of the IEFA addenda needs to be previously calculated separately, which is possible by recurring to the formulas reported below. In addition to impact sources, and EQF, emission factors must also be used. Emission factors are coefficients able to convert the consumed material into tons of CO2. We have used emission factors available online at the EU commission [53].
1. Built-up (BU) [33,38,45]:
BU   =   total building surface area   ( h a y e a r )   ×   EQF of built up   ( g h a h a )
2. Energy Consumption (EC) [4,38,39,44,45]:
EC = Fuel Consumption EF + Electricity Consumption EF,
Fuel Consumption   ( g h a y e a r )   =   Fuel Consumption   ( G J y e a r )   ×   Emission   factor fuel   ( t C O 2 G J )   ×   CO 2   sink   factor   ( g h a t C O 2 ) ,
Electricity Consumption   ( g h a y e a r )   =   Electricity Consumption   ( k W h y e a r )   ×   Emission   factor electricity   ( t C O 2 k W h )   ×   CO 2   sink factor   ( g h a t C O 2 ) ,
3. Water Consumption (WC) [4,38,44,45,53]:
WC   ( g h a y e a r )   =   Water Consumption   ( m 3 y e a r )   ×   Emission   factor water   ( t C O 2 m 3 )   ×   CO 2   sink factor   ( g h a t C O 2 ) ,
4. Material Consumption (MC) [4,38,39,44,45]:
MC   ( g h a y e a r )   =   Hour per use of material   i   ( h y e a r )   ×   Emission   factor material   ( t C O 2 h )   ×   CO 2   sink factor   ( g h a t C O 2 ) ,
5. Food and Drink (FD) [4,38,39,44,45]:
FD ( g h a y e a r )   =   Σ   ( Energy land for item   i ( g h a t )   ×   total amount of item   i   delivered   in   1   year   ( t y e a r ) ) ,
E n e r g y l a n d f o r i t e m i ( g h a t )   =   a s s o c i a t e d t o t h e e m b o d i e d e n e r g y ( t C O 2 ) t o n s ( t )   ×   CO 2   sink   factor   ( g h a t C O 2 ) ,
6. Mobility (M) [4,39,44,45]:
M   ( g h a y e a r )   =   N u m b e r o f p e o p l e ( u n i t ) D i s t a n c e ( k m ) M a x i m u m c a p a c i t y o f t h e t r a n s p o r t ( u n i t )   ×   Average   fuel   efficiency   ( t k m )   ×   Emission   factor   fuel   ( t C O 2 t y e a r )   ×   CO 2   sink   factor   ( g h a t C O 2 ) ,
7. Waste Generation (WG) [4,39,45]:
WG   ( g h a y e a r )   =   Tons   of   waste   ( t )   ×   Emission   factor material ( t C O 2 t )   ×   CO 2   sink   factor   ( g h a t C O 2 ) ,
8. Recycling Potential (RP) [45]:
RP   ( g h a y e a r )   =   Tons   of   reused   materials   ( t )   ×   Emission   factor material ( t C O 2 t )   ×   CO 2   sink   factor   ( g h a t C O 2 ) ,
9. Occupant (O) [37]:
O   ( g h a y e a r )   =   Influence   factor   ×   ( BU   +   EC   +   WC )   ( g h a y e a r ) ,
Influence   factor   =   S p e n t h o u r s i n t h e b u i l d i n g ( h ) H o u r s i n a y e a r ( h )
BU, EC, WC, MC, FD, M, and WG are added together as they represent consumed resources, while RP and O are subtracted to the others. RP represents the amount of material reuse in the built environment. For example, if the building has a photovoltaic plant, the amount of electricity produced by the plant, which is a consumption, will be subtracted, as it has been produced within the building, and it has no impact on the environment. O represents the benefit of the simultaneous occupation of the building by multiple users. This is why it influences all those impact sources deriving from the consumption of resources related to the built environment: built-up, energy consumption, and water consumption. Of course, the greater the agglomeration of people, the greater impact on the environment. In fact, more people generate more waste and produce more carbon emissions. However, all emissions and consumptions are already considered in the calculation of IEFA thanks to the other addends. O serves the purpose of showing how the simultaneous use of some resources, if shared among numerous people, can be less impactful on the environment. This addendum assumes that when the light is on in a room and more people are present at the same time, electricity consumption must be divided between them and, therefore, globally it will have a lower weight because it is spent in a more efficient way and it avoids electricity consumption by the same people somewhere else in the world.
The overall IEFA result will be equal to the sum of all the above-mentioned components, as schematized in Figure 2:
IEFA = (3) + (4) + (7) + (8) + (9) + (11) + (12) − (13) − (14),
After defining the model and describing its theoretical implementation, we tested its applicability on an experimental case.

5. Application on a Case Study

The IEFA model was applied on the administrative headquarters of a multi-utility company located in the city center of Milan, Italy. The building was built in the early 1900’s. It consists of a single C-shaped structure of five floors, with a gross external area of 4803 m2. It hosts approximately 800 people, including visitors and workers.
To apply the formula described in the previous section, the facility management and human resources department collaborated with the researchers in data gathering. Data was collected through different sources, as summarized in Table 6. We were able to define all the impact sources, even though data was available from different years, between 2015 and 2018. The only addenda that was not possible to calculate is recycle potential EF, because the building does not present any systems for recycling or energy production.
Considering the feeding modalities of the building’s plants, EF results from the combination of two factors, fuel consumption and electricity consumption. The only fuel used by the building’s heating system is methane. Therefore, fuel declared in the consumption bills (13,279 m3) was converted into kg, through methane density (0.656 kg/m3) [53,55]. This result was converted into MJ through the energy density factor of 55.65 MJ/kg [55]. Electricity consumption is estimated using the emission factor of electricity of Italy, defined by EU commission, equal to 0.000343 tCO2/MWh [56].
WC results as the combination of company’s utility bills (9981 m3), the energy intensity of drinking water, 0.78 kWh/m3 [57], and the emission factor of electricity [56].
As the company has not developed a detailed maintenance program, but only a supply contract for out-of-service item replacements, MC is estimated according to the works that maintenance operators have concluded in a year of activity. A more detailed analysis has been possible for cleaning activities. A cleaning trolley has been defined through the data given by the company. Each product has been associated to the hours of use and the frequency in a year has been defined through company’s data. After adding up the amount of materials used, we translate them into kgCO2 through the embodied energy [39,58].
M is estimated by combining the distance from home of every worker, and which means of transport is used to reach the building. These data come from a survey of the company itself. For every means of transportation (car, bus, train, subway, tram, trolleybus, bicycle, foot, and motorbike), by using the index of conversion [59], expressed in kgCO2/Km, we defined the footprint. Finally, we added all the results together for estimating the overall M.
As there were only food and drink vending machines in the building, we estimated FD through embodied energy (MJ/t) and CO2 factors (tCO2/t) [36,39] of the snacks and beverages sold. Then, we added everything together to evaluate the FD.
WG was the result of a month monitoring of the amount of rubbish produced by the workers. As it is an office building, three main types of waste were detected: plastic, paper, and unsorted waste (e.g., organic, wood of furniture, foam rubber, etc.). Through the density [60] of each component, and the waste emission factor of Italy [61], we estimated the WGEF.
O is estimated through the number of hours the building’s users spend in the building. This data has been collected through the access system to the headquarters. Taking into consideration the total hours in a year, equal to 8760 h, we calculated the influence coefficient, which represents the percentage of time in a year the building is used. Finally, we applied Formula (14).
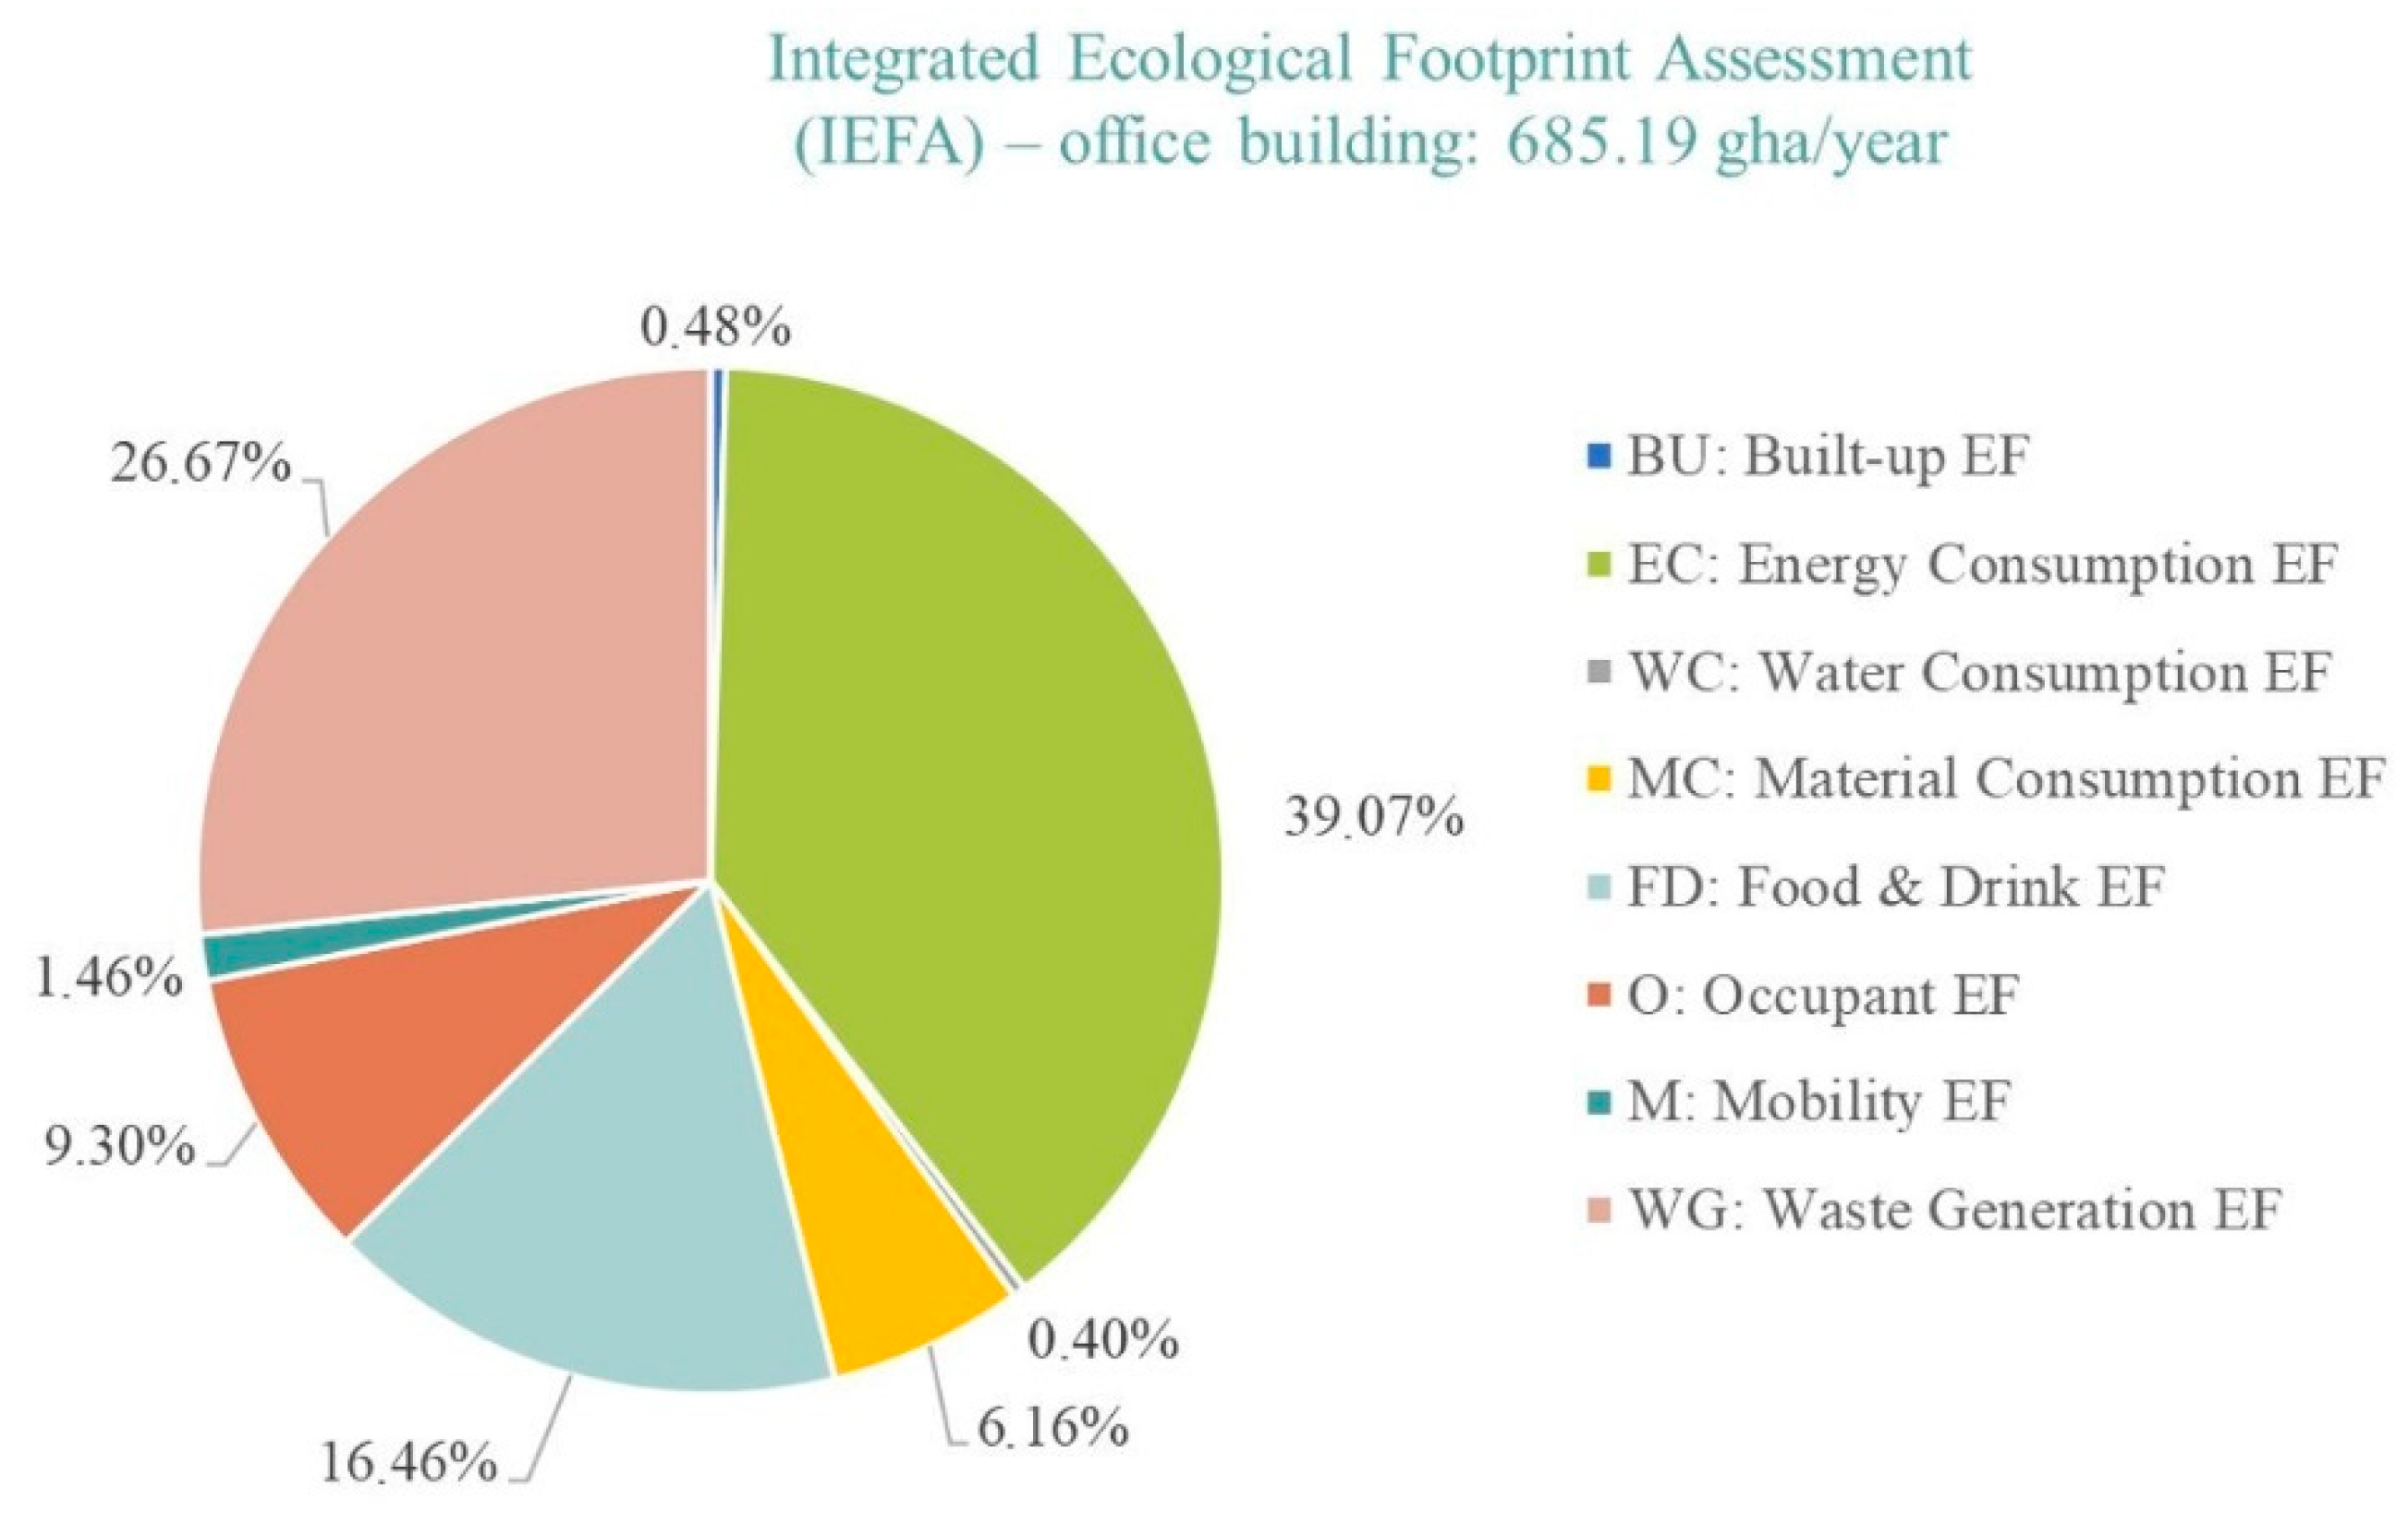
Based on the above-mentioned input data and formula, our calculations (see Appendix A) show that the overall IEFA for the company’s headquarter sums up to 685.19 gha/year, as presented in Table 7.
Looking at the EF breakdown, the IEFA is, for the most part, caused by electricity consumption ecological footprint (EC), waste generation ecological footprint (WG), and food and drink ecological footprint (FD). EC affects the result by 39.07%, WG by 26.67%, and FD by 16.46% the total IEAF, as shown in Figure 3.
Due to the lack of similar applications, this result of IEFA for the analyzed office building cannot be compared nor interpreted through a benchmarking study. However, to grasp the magnitude of this company’s footprint, one can compare the result of 685.19 gha/year to the area of a football field (which is equal to 0.7 ha). Thus, the case building needs 979 football fields to cover its demand in a year.

6. Discussion

The proposed IEFA model intended to assess the environmental efficiency of buildings through a synthetic indicator that depicts the buildings’ demand for resources on Earth. IEFA evaluates the buildings’ impact in the in-use phase of the BLC by looking at the influence of people behaviors and simultaneous occupancy. The model design has been inspired by Wackernagel and Rees [26], and Brownell [37] for the development of occupant impact source; and by Husain and Prakas [45] for the combination of the BLC with LCA. IEFA advances these pre-existing models by applying EF to the building in-use phase, proposing a calculation for Brownell’s theoretical proposition, and using all the impact sources.
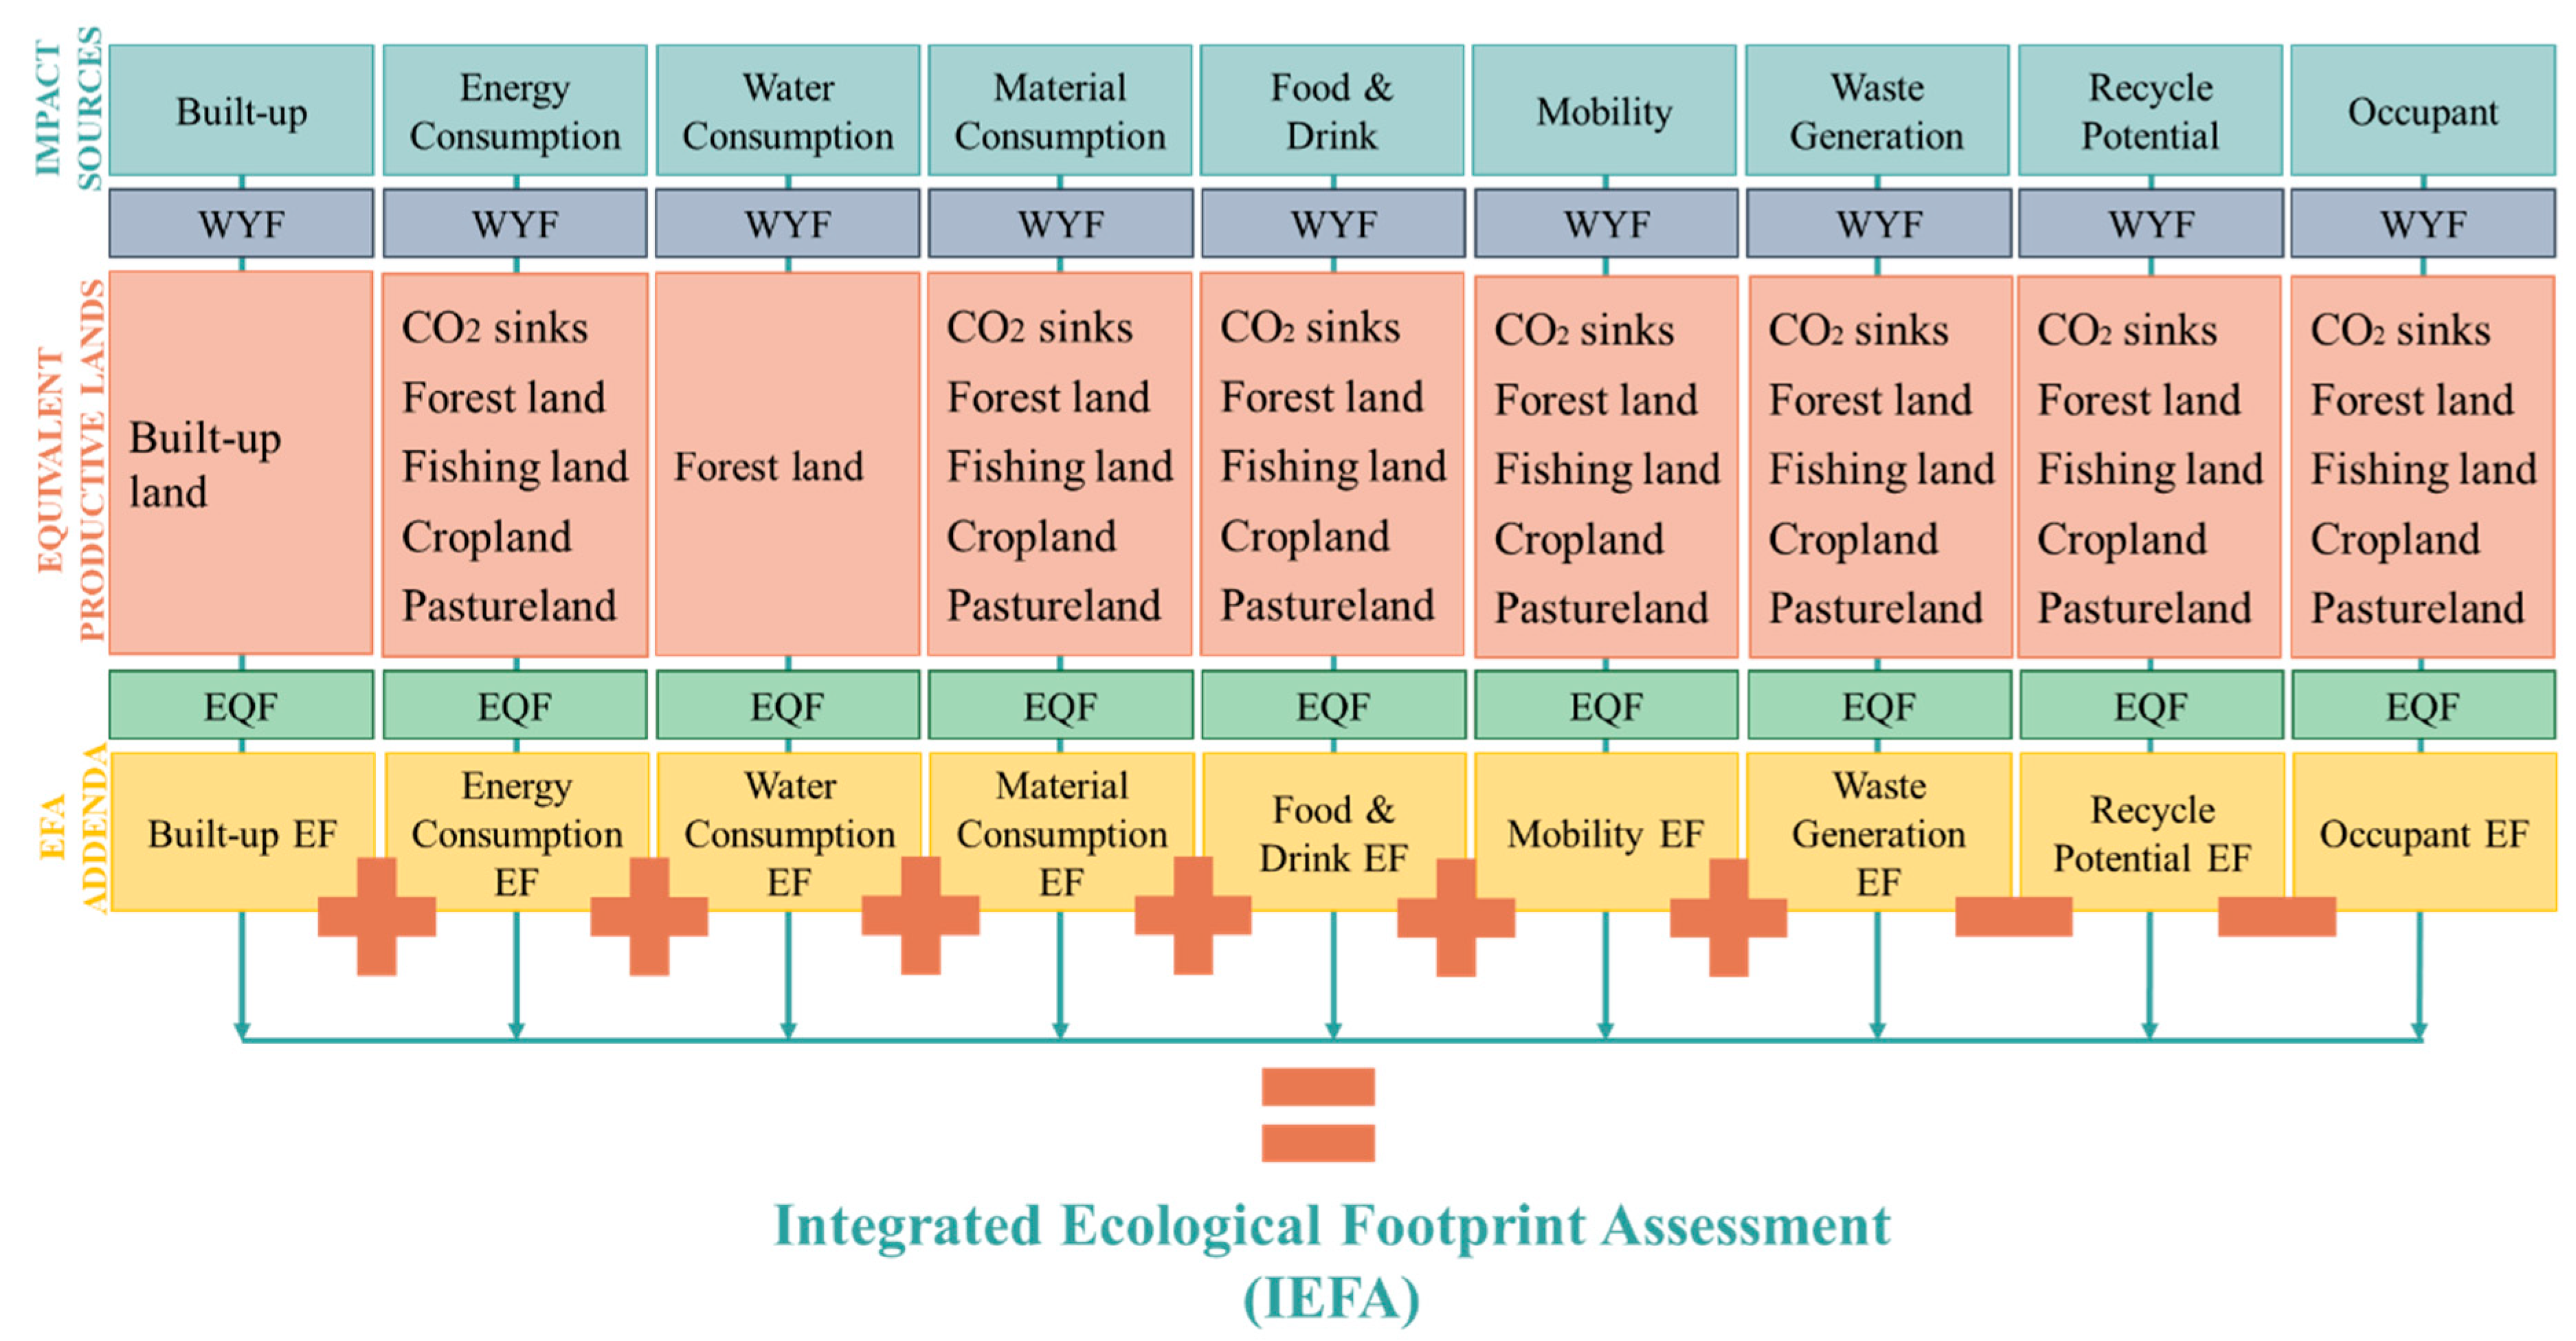
The nine Impact sources estimated in IEFA consider the consumption of resources (energy consumption EF, water consumption EF, food and drink EF, material consumption EF), the generation of waste (waste generation EF), the impact of travelling (mobility EF), the recycling potential (recycle potential EF), and the efficiency in consuming the same resource among multiple users (occupant EF).
To evaluate the accuracy IEFA, ideally it would be appropriate to apply it simultaneously with another standard, and then to look at the misalignments between the two indexes to check whether EF over- or under-performs. However, to the knowledge of the authors, no previous studies have applied EF together with other sustainability metrics. Therefore, the final result of IEFA, calculated for the administrative headquarters of an Italian company, was compared with the five studies [4,38,39,44,45] that informed the development of the model, as shown in Table 8.
The IEFA applied to the case building resulted in 0.85 gha/person. This value resembles the same order of magnitude of previous studies, thus can be considered valid. Overall, it is slightly higher that the average values reported in most of the other references [38,39,44], which makes sense as IEFA considers nine impact sources, while the other sources included only five [38], seven [39], and just four [44] sources, respectively. In addition, IEFA considers all the food and drinks consumed and the materials used, while previous studies calculated just the food component and some materials (e.g., plastic, paper, and cans [44]). Only Husain and Prakas’s [46] calculation results higher, even if it is still in a similar order of magnitude, because they have calculated the EF for a school related to all the stages of the BLC.
Despite limited possibility for comparing the proposed model with similar metrics and cases, it is worth highlighting its benefits compared to existing approaches and carbon metrics.
First, IEFA defines an organic system that integrates existing methods, and it bases the calculations on general parameters, shared worldwide. This overcomes the limit of the green certifications, which are relative models, developed on different building standards [38].
Second, EF does not produce a relative result, such as stars or percentage, but a simple and intuitive unit of measurement, global hectares (gha), which makes comparisons easy even for buildings located in different countries. In addition, this scientific result can be understood not only by the evaluators, but also by building managers, owners, and end users [36].
Third, the model proposes a systematic organization of IEFA addenda, which is useful for implementing calculations based on the “composition” approach, and for understanding where the main impacts are caused. Comparing the IEFA addenda allows to identify which factors most significantly affect EF and makes it possible to create strategies and to implement solutions for performance improvement. This partially prevents the proposed EF metric from being distorted or abused by building owners and policy makers. For example, it allows to detect if decision makers decide to reduce a large footprint only by decreasing water consumption but not energy demand or carbon emissions. This should theoretically discourage misleading strategies only aimed at gaining popularity and large agreement among the public. Moreover, gha express an intuitive quantity, which would enable the public to undertake a control function on environmental sustainability trends.
Fourth, IEFA assesses, through O, FD, MC and M, buildings’ environmental impacts by considering users’ behavior, which none of the previous studies have incorporated. In particular, the model includes the user variable by considering the number of people who occupy the building. This responds to the lack of applications considering the intensity of space utilization as a positive element in EF calculation. Even though O does not seem impactful in our analysis, it is worth noting that the more people are using the space, the smaller impact they are causing.
In practical terms, the IEFA model herewith proposed promises to be useful for a range of professionals, from executives to facility managers, but also for the end users of buildings. Facility managers can evaluate a building’s performance over time, with the benefit of recognizing what factors are more impactful on biocapacity and require intervention. Executives can take advantage of this information when they aim at implementing strategies to reduce building consumption, waste, and pollution generation. Possible strategies span from technical/operative solutions to soft interventions on people’s behavior and attitudes through policies or guidelines.
Taking this case study as an example, improving the electric plants and building envelop could potentially lead to reducing electricity consumption. At the same time, an organizational culture emphasizing the benefits of sustainability could lead to more responsible consumption. The EF, in fact, also depends on when the consumption takes place. For example, on a solar-rich grid, the EF of a building whose peak demand is in the middle of the day would be substantially different from one whose demand is relatively flat or peaks at night. This is coherent with the theory that building users contribute substantially. Users could alter the emission factor of a building, just by modifying their consumption habits and use practices. EF is meant to raise evidence of how even unconscious demand shifting would affect buildings’ sustainability, thus it will support more conscious demand management and perhaps the implementation of automated systems to regulate energy demand (e.g., sensors for artificial lighting management, elevator activation, etc.). In the future, culture will be key to especially affect electricity consumption, food and drink consumption and waste generation. As FD in our company was mainly affected by hot beverages consumption, which amounts to 90% of the overall FD (Appendix A), some “coffee free” days could be introduced by company policies. In addition, providing the employees with their own mugs would allow for reducing waste production. Every coffee purchased from a vending machine corresponds to a plastic glass that affects WG, so reducing the use of single-use cups would influence the EF factor positively too.

7. Conclusions

Considering that people in the western world spend most of their time indoors it is important to implement indicators showing to what extent people’s behavior can affect building’s impact on the planet.
The calculation of greenhouse gas (GHG) emissions and lifetime energy, which are the most common indicators of the impact of man-made environments on natural environments, are very abstract and would benefit from being combined with a range of other measures that can support mitigation actions [4,38,44]. While multiple green certifications exist, there is the need to homogenize a wide range of different criteria and dimensions of buildings’ sustainability. In this paper we proposed a first exploration of the potential of EF as a simple indicator of building’s sustainability (i.e., IEFA). IEFA addresses current EF limitations by:
  • Evaluating buildings’ environmental impact within the in-use phase of the BLC;
  • Revealing the environmental efficiency of buildings by looking at people occupancy;
  • Integrating all the impact sources used in previous studies;
  • Combining the “comprehensive method” and the “component method”.
The application of a case study made it clear that users play a key role in the reduction of environmental impacts in the in-use stage. The extent to which they can contribute to EF depends not only on the activities that are undertaken in a building (e.g., office building), but also on their behaviors. Habits in waste generation and food and drink consumption were particularly impactful on IEFA in the case study.
Our experimental application shows that IEFA can provide important evidence to inform guidelines aimed at improving buildings’ sustainability in the in-use phase. Focusing on the in-use stage might highlight that a low energy building can be energy inefficient in the provision of services, such as food and beverage.
IEFA provides a measure that represents over-consumption and can encourage a more sustainable culture. Gha makes the model potentially comparable to the hectares of production and waste assimilation by city or region, so that these benchmarks could set an overall budget or target of sustainable consumption by specific territorial areas. For instance, in 2012 there were approximately 12.2 billion global hectares of production and waste assimilation on Earth, while consumption totaled 20.1 billion global hectares, meaning about 65% more was consumed than produced [31]. How would this translate at scale for a city as Milan or for the Lombardy region? Some more research would be necessary to translate this approach down to the neighborhood, city, or regional level.
Still the proposed model presents multiple limitations that might hinder its implementation and expansion. These limitations have mainly to do with: (i) data provision; (ii) absence of benchmarks; and (iii) lack of standards for calculation. Inventory quality is a major element for the consistency of results related to IEFA. Generally speaking, a harmonization approach should be performed in future implementations of the model, as in the LCA harmonization by Heath and Mann [61]. A similar approach could be used also to develop a meta-analytical procedure, based on several EF approaches, which simplifies the direct comparison of results. Our test uses data from surveys, and measurements done by the company in different years; however, data should be gathered on only one year of analysis and should be consistent for all data sources. Second, the absence of benchmarks makes comparisons impossible. In future applications, a cross-company analysis should be developed. Third, the absence of calculation standards might have generated errors and imprecisions. Major difficulties have been encountered when avoiding double counting. For example, the embodied factor needed for calculating food and drinks EF (Appendix A) takes the wasted packaging into account already. Therefore, this waste should not be included in waste generation EF. At the current time, a system for helping building managers, or whoever performs the calculations in this kind of accounting, does not exist. In addition, in the proposed model, a weighting system of addenda has been neglected. In future applications, a system to understand which addendum is most important due to its impact on Earth would be beneficial. These limits can be partially solved by implementing technology (i.e., installing sensors). A real time estimation of IEFA will improve the effectiveness of building management.
Finally, even though we contend that EF is a more easily understandable metric than green rating systems, a survey could be submitted to verify whether this has a beneficial effect on people’s responsibility toward the environment. Future implementations must look at how different sustainability metrics impact, or not, human behavior. Theoretical frameworks could be developed by elaborating on Daniel Kahneman’s [62] works on the psychology of choice for appraising how we might expect the EF metric to over- or under-perform other metrics. A crucial question yet to be answered is: do gha, number of Earths or football fields induce people to implement sustainable policies and adopt sustainable behaviors more effectively than other carbon metrics or energy consumption measures?

Author Contributions

The following statements should be used “Conceptualization, G.C., A.P.P. and C.T.; methodology, A.P.P. and C.T.; validation, A.P.P.; formal analysis, A.P.P.; investigation, A.P.P.; resources, A.P.P. and C.T.; data curation, A.P.P.; writing—original draft preparation, A.P.P.; writing—review and editing, A.P.P. and C.T.; visualization, A.P.P. and C.T.; supervision, G.C. All authors have read and agreed to the published version of the manuscript.

Funding

This research received no external funding.

Institutional Review Board Statement

Not applicable.

Informed Consent Statement

Not applicable.

Data Availability Statement

No new data were created or analyzed in this study. Data sharing is not applicable to this article.

Acknowledgments

The authors particularly wish to thank Elena Gheda for the assistance in testing the model. Special thanks to Federica Tomasini and Matteo Falletta for the support in collecting materials used for experiments.

Conflicts of Interest

The authors declare no conflict of interest.

Appendix A

Built-Up Ecological Footprint
Company dataEQFResult [gha/year]
SQM: 1.6 ha2.514.01
Energy Consumption Ecological Footprint
Fuel Consumption—Methane
Company DataConversion Data [53]EQFResult [gha/year]
13,279 m3/yearDensity of methane: 0.656 kg/m30.35971
Electricity Consumption
Company dataConversion Data [55,56]EQFResult [gha/year]
2,658,830 KWh/yearEmission factor of electricity: 0.000343 tCO2/KWh0.35319.19
TOTAL Energy Consumption Ecological Footprint 328.91
Water Consumption Ecological Footprint
Company dataConversion Data [56,57]EQFResult [gha/year]
9981 m3/yearEnergy Intensity of drinking water: 0.78 KWh/m3
Emission factor of electricity: 0.000343 tCO2/KWh
1.263.36
Material Consumption Ecological Footprint
Cleaning
Product—Company DatakgCO2/kgkg/ykgCO2/year [39,58]tCO2/year [39,58]gha/tCO2MCcleaning [gha/year]
Cleaning trolley2.8582.88.00240.0080020.350.00280084
Wide mop8.90911.977106.7030930.1067030.350.037346083
Dust cloth (3)9.6010.7016.7303010.006730.350.002355605
Buckets (2)2.8580.351.00030.0010.350.000350105
Mop or broom sticks (4)7.2471.96814.2620960.0142620.350.004991734
Mops8.9095.30147.2266090.0472270.350.016529313
Broom7.7540.96.97860.0069790.350.00244251
Dustpan2.8580.1350.385830.0003860.350.000135041
Large garbage—bag2.0962.55.240.005240.350.001834
Trash bags2.09616.66734.9340320.0349340.350.012226911
Wiper blade7.4460.1060.7892760.0007890.350.000276247
Wiper blade runner2.3940.280.670320.000670.350.000234612
Wiper tool2.8580.060.171480.0001710.350.000060018
Wiper tool fleece8.9090.050.445450.0004450.350.000155908
Disposable gloves2.0961.252.620.002620.350.000917
Paper hand towel roll (120 m)0.67523.26215.701850.0157020.350.005495648
Ostrich feather duster2.8580.220.628760.0006290.350.000220066
Antistatic duster2.8580.461.314680.0013150.350.000460138
Bleach (5 L)0.374116.27943.4883460.0434880.350.015220921
Neutral cleaner (1.5 L)0.37434.88413.0466160.0130470.350.004566316
Bath descaler (750 mL)0.37431.1220.0011220.350.0003927
Floor cleaner (1 L)0.37445.45517.000170.0170.350.00595006
Furniture cleaner spray (450 mL)0.3742.6951.007930.0010080.350.000352776
Mop cleaner spray0.37431.1220.0011220.350.0003927
Soapy cleaner (1 L)0.3745.9882.2395120.002240.350.000783829
Glass cleaner (750 mL)0.3749.0363.3794640.0033790.350.001182812
Ink remover (750 mL)0.37417.4426.5233080.0065230.350.002283158
Liquid soap refill (5 L)0.37476.92328.7692020.0287690.350.010069221
Air freshener0.37412.0484.5059520.0045060.350.001577083
TOTAL0.131603352
Maintenance: Cleaning
Product—Company DatakgCO2/kgkg/ykgCO2/year [39,58]tCO2/year [39,58]gha/tCO2MC [gha/year]
Cleaning trolley2.8582.88.00240.00800240.350.00560168
Trash bags2.09616.66734,9340320.0349340320.350.024453822
Wiper blade7.4460.1060,7892760.0007892760.350.000552493
Wiper blade runner2.3940.280,670320.000670320.350.000469224
Wiper tool2.5850.060.171480.000171480.350.000120036
Wiper tool fleece8.9090.050.445450.000445450.350.000311815
Disposable gloves2.0961.252.620.002620.350.001834
Machinery fat0.74376.92357.1537890.0571537890.350.040007652
TOTAL0.073350723
Maintenance: Repair
Product—Company DataTime/YearTons of ComponentstCO2/year [39,58]gha/tCO2MC [gha/year]
Light bulbs2004200.2580.3537.926
Electrical cables29098.860.2580.358.565858
Bolts30042.640.2580.353.850392
Water tubes514.530.2580.351.312059
TOTAL51.654309
TOTAL Material Consumption Ecological Footprint 51.85
Food and Drink Ecological Footprint
Product—Company DataEmbodied Energy MJ/t [39,58]Emission Factor [39,58]gha/tCO2t/yearFD [gha/year]
Mineral water7.770.830.3521.776.324185
Fruit juices32.212.430.351.241.05462
Cold drink (like tea)55.166.010.352.3324.905362
Taralli (bread)14.051.490.350.3110.1621865
Chips39.443.720.350.1160.151032
Biscuits26.352.720.350.2760.262752
Chocolate confectionery36.0511.730.350.0970.3982335
Non-chocolate confectionery38.064.640.350.1360.220864
Tea55.166.010.3512.99627.337086
Coffee128.9213.620.3512.99661.951932
Drinking chocolate60.517.310.3512.99633.250266
Ice-cream38.157.260.350.4282.541
TOTAL138.55951
Mobility Ecological Footprint
Mobility Ecological Footprint—From Milan
Way of TransportN° PeopleN° of Working Day/YearAverage DistanceMax Transp. CapacityEFF [59]Index of Conversion [L/km] [59]gha/tCO2M [gha/year]
Car2240510.00240.06590.350.1328544
Bus982405950.00250.06140.350.066506
Train024054500.00034330.350
Subway11524051,2000.00034330.350.041417
Tram8224052620.00034330.350.135262
Trolleybus1024051660.00034350.350.0433916
Bicycle15240513 × 10−101440.350.0002722
Foot1240513 × 10−10900.350.0000113
Motorbike11240510.00240.050.350.5544
TOTAL0.974115
Mobility Ecological Footprint—From the Province of Milan
Way of TransportN° PeopleN° of Working Day/YearAverage DistanceMax Transp. CapacityEFF [59]Index of Conversion [L/km] [59]gha/tCO2M [gha/year]
Car82402010.00240.06590.352.1256704
Bus1024020950.00250.06140.350.027145263
Train102240204500.00034330.353.918432
Subway34240201 2000.00034330.350.0489804
Tram0240202620.00034330.350
Trolleybus0240201660.00034350.350
Bicycle02402013 × 10−101440.350
Foot02402013 × 10−10900.350
Motorbike122402010.00240.050.352.4192
TOTAL8.539428
Mobility Ecological Footprint—From the Lombardian Region
Way of TransportN° PeopleN° of Working Day/YearAverage DistanceMax Transp. CapacityEFF [59]Index of Conversion [L/km] [59]gha/tCO2M [gha/year]
Car82402010.00240.06590.352.1256704
Bus024020950.00250.06140.350
Train160240204500.00034330.350.614656
Subway0240201 2000.00034330.350
Tram0240202620.00034330.350
Trolleybus0240201660.00034350.350
Bicycle02402013 × 10−101440.350
Foot02402013 × 10−10900.350
Motorbike02402010.00240.050.350
TOTAL2.740326
TOTAL Mobility Ecological Footprint 12.25387
Waste Generation Ecological Footprint
Company DataConversion Data [60,61]EQFWG [gha/year]
2 486.720.258 tCO2/t0.35224.551
Occupancy Ecological Footprint
Company DataInfluence IndexBU + EC + WCO [gha/year]
2 040 h/year0.23336.28224.551
TOTAL IEFA for the administrative headquarters, BU + EC + WC + MC + FD + M +WG − O = 685.19 gha/year.

References

  1. Wood, R.; Lenzen, M. An application of a modified Ecological Footprint method and Structural Path Analysis in a Comparative Institutional Study. Local Environ. 2003, 8, 365–386. [Google Scholar] [CrossRef]
  2. Shen, L.Y.; Hao, J.L.; Tam, V.W.Y.; Yao, H. A checklist for assessing sustainability performance of construction projects. J. Civ. Eng. Manag. 2007, 13, 273–281. [Google Scholar] [CrossRef]
  3. Doan, D.T.; Ghaffarianhoseini, A.; Naismith, N.; Zhang, T.; Ghaffarianhoseini, A.; Tookey, J. A critical comparison of green building rating system. Build. Environ. 2017, 123, 243–260. [Google Scholar] [CrossRef]
  4. Solìs-Guzmàn, J.; Marrero, M.; Ramìrez-de-Arellano, A. Methodology for determining the ecological footprint of the construction of residential buildings in Andalusia (Spain). Ecol. Indic. 2013, 25, 239–249. [Google Scholar] [CrossRef]
  5. Zuo, J.; Zhen-Yu, Z. Green building research-current status and future agenda: A review. Renew. Sustain. Energy Rev. 2014, 30, 271–281. [Google Scholar] [CrossRef]
  6. Dixit, M.K.; Fernández-Solís, J.L.; Lavy, S.; Culp, C.H. Need for an embodied energy measurement protocol for buildings: A review paper. Renew. Sustain. Energy Rev. 2012, 16, 3730–3743. [Google Scholar] [CrossRef]
  7. Lu, W.; Yuan, H. A framework for understanding waste management studies in construction. Waste Manag. 2011, 31, 1252–1260. [Google Scholar] [CrossRef] [Green Version]
  8. Yeheyis, M.; Hewage, K.; Alam, M.S.; Eskicioglu, C.; Sadiq, R. An overview of construction and demolition waste management in Canada: A lifecycle analysis approach to sustainability. Clean Technol. Environ. Policy 2013, 15, 81–91. [Google Scholar] [CrossRef]
  9. Dixit, M.K.; Lavy, S.; Culp, C.H.; Fernández-Solís, J.L. System boundary for embodied energy in buildings: A conceptual model for definition. Renew. Sustain. Energy Rev. 2013, 21, 153–174. [Google Scholar] [CrossRef]
  10. World Commission on Environment and Development. Our Common Future; Oxford University Press: Oxford, UK, 1987; pp. 36–51. [Google Scholar]
  11. United Nations. Agenda 21. In Proceedings of the United Nations Conference on Environment and Development, Rio de Janeiro, Brazil, 3–14 June 1992. [Google Scholar]
  12. Gui, X.; Gou, Z. Association between green building certification level and post-occupancy performance: Database analysis of the National Australian Built Environment Rating System. Build. Environ. 2020, 179, 1–14. [Google Scholar] [CrossRef]
  13. Build Institut for Bygger, Aalborg Universitet. Available online: https://sbi.dk/Pages/Guide-to-sustainable-building-certifications.aspx (accessed on 12 October 2020).
  14. Dixon, T.A.; Colantonio, D.; Shiers, D.; Reed, D.; Wilkinson, S.; Gallimore, P. A Green Profession? A Global Survey of RICS Mambers and Their Engagement with the Sustainability Agenda. J. Prop. Invest. Financ. 2008, 26, 460–481. [Google Scholar] [CrossRef]
  15. U.S. Green Building Council. Available online: https://www.usgbc.org/ (accessed on 12 October 2020).
  16. BREEAM International New Construction. Available online: https://www.breeam.com/ (accessed on 12 October 2020).
  17. DGNB. Available online: http://www.dgnb.de/en/ (accessed on 12 October 2020).
  18. CASBEE. Available online: http://www.ibec.or.jp/CASBEE/english/ (accessed on 12 October 2020).
  19. Green Star. Available online: https://ricerca.windtre.it/?d=er (accessed on 12 October 2020).
  20. Reed, R.; Bilos, A.; Wilkinson, S.; Schulte, K.W. International Comparison of Sustainable Rating Tools. Josre 2009, 1, 2–22. [Google Scholar]
  21. Rezaallah, A.; Bolognesi, C.; Khoraskani, R.A. LEED and BREEAM; Comparison between policies, assessment criteria and calculation methods. In Proceedings of the 1st International Conference on Building Sustainability Assessment, Porto, Portugal, 23–25 May 2012. [Google Scholar]
  22. Rivas, S.; Cuniberti, B.; Bertoldi, P. Effective Information Measures to Promote Energy Use Reduction Across EU Member States; European Union: Brussels, Belgium, 2016. [Google Scholar]
  23. BREEAM and LEED to Work Together on New Global Standard. Available online: https://www.building.co.uk/news/breeam-and-leed-to-work-together-on-new-global-standard/3135155.article (accessed on 12 October 2020).
  24. Hua, Y.; Göçer, Ö.; Göçer, K. Spatial mapping of occupant satisfaction and indoor environment quality in LEED platinum campus building. BuildingEnviron. 2014, 79, 124–137. [Google Scholar] [CrossRef]
  25. Costa, P. Valutare l’architettura. Ricerca Sociologica e Post-Occupancy Evaluation, 1st ed.; Franco Angeli: Milan, Italy, 2014; pp. 25–102. [Google Scholar]
  26. Wackernagel, M.; Rees, W. Our Ecological Footprint: Reducing Human Impact on the Earth, 9th ed.; New Society: Gabriola, BC, Canada, 1996; pp. 9–148. [Google Scholar]
  27. Sala, S.; Farioli, F.; Zamagni, A. Progress in sustainability science: Lesson learnt from current methodologies. Int. J. Life Cycle Assess. 2013, 18, 1653–1672. [Google Scholar] [CrossRef]
  28. Daly, H.E. Toward some operational principles of sustainable development. Ecol. Econ. 1990, 2, 1–6. [Google Scholar] [CrossRef]
  29. Ewing, B.; Reed, A.; Galli, A.; Kitzes, J.; Wickernagel, M. Calculation Methodology for the National Footprint Accounts, 1st ed.; Global Footprint Network: Oakland, ON, Canada, 2010. [Google Scholar]
  30. Mancini, M.; Galli, A.; Niccolucci, V.; Lin, D.; Bastianoni, S.; Wackernagel, M.; Marchetti, N. Ecological Footprint: Refining the carbon Footprint calculation. Ecol. Indic. 2016, 61, 390–403. [Google Scholar] [CrossRef]
  31. Global Footprint Network. Available online: https://www.footprintnetwork.org/ (accessed on 12 October 2020).
  32. Rogmans, T.; Ghunaim, M. A framework for evaluating sustainability indicators in the real estate industry. Ecol. Indic. 2016, 66, 603–611. [Google Scholar] [CrossRef]
  33. Mayer, A.L. Strengths and weaknesses of common sustainability indices for multidimensional systems. Environ. Int. 2008, 34, 277–291. [Google Scholar] [CrossRef]
  34. Mancini, M.S.; Galli, A.; Coscieme, L.; Niccolucci, V.; Lin, D.; Pulselli, F.M.; Bastianoni, S.; Marchetti, N. Exploring ecosystem services assessment through Ecological Footprint accounting. Ecosyst. Serv. 2018, 30, 228–235. [Google Scholar] [CrossRef]
  35. Wiedmann, T.; Brret, J. A Review of the Ecological Footprint Indicator—Perceptions and Methods. Sustainability 2010, 2, 1645–1693. [Google Scholar] [CrossRef] [Green Version]
  36. Simmons, C.; Lewis, K.; Barrett, J. Two feet-two approaches: A component-based model of Ecological Footprint. Ecol. Econ. 2000, 32, 375–380. [Google Scholar]
  37. Brownell, E.B. Determining Architecture’s Footprint: Preliminary Methods for Measuring the True Environmental Impact of Buildings. In Reusable and Sustainable Building Material in Modern Architecture, 1st ed.; Koç, G., Christiansen, B., Eds.; IGI Global Publishing: Hershey, PA, USA, 2019; pp. 28–59. [Google Scholar]
  38. Martínez-Rocamora, A.; Solís-Guzmán, J.; Marrero, M. Toward the Ecological Footprint of the use and maintenance phase of buildings: Utility consumption and cleaning tasks. Ecol. Indic. 2016, 69, 66–77. [Google Scholar] [CrossRef]
  39. Acosta, K.; Moore, J. Creating an Ecological Footprint Assessment: Using Component and Compound Economic Input Output Methods together with the Natural Step to Develop Sustainability Management System. In Proceedings of the State of the Art in Ecological Footprint Theory and Applications, Colle Val d’Elsa, Italy, June 2010; Bastianoni, S., Ed.; British Columbia Institute of Technology (BCIT): Burnaby, BC, Canada, 2010. [Google Scholar]
  40. Bicknell, K.; Ball, R.J.; Cullen, R.; Bigsby, H.R. New methodology for the ecological footprint with an application to the New Zealand economy. Ecol. Econ. 1998, 27, 149–160. [Google Scholar] [CrossRef] [Green Version]
  41. Lenzen, M.; Murry, S.A. A modified ecological footprint method and its application to Australia. Ecol. Econ. 2001, 37, 229–255. [Google Scholar] [CrossRef]
  42. Bastioni, S.; Gall, A.; Niccolucci, V.; Pulselli, R.M. The ecological footprint of building construction. Sustain. City 2006, 4, 345–356. [Google Scholar]
  43. Jin, W.; Xu, L.; Yang, Z. Modelling a policy making framework for urban sustainability: Incorporating system dynamics in the Ecological Footprint. Ecol. Econ. 2009, 68, 2938–2949. [Google Scholar] [CrossRef]
  44. Gottlieb, D.; Kissinger, M.; Vigoda-Gadot, E.; Haim, A. Analyzing the ecological footprint at the institutional scale—The case of an Israeli high-school. Ecol. Indic. 2012, 18, 91–97. [Google Scholar] [CrossRef]
  45. Husain, D.; Prakas, R. Life Cycle Ecological Footprint Assessment of an Academic Building. J. Inst. Eng. 2018, 100, 97–110. [Google Scholar] [CrossRef]
  46. Levett, R. Footprinting: A great step forward, but tread carefully. Local Environ. 1998, 3, 67–74. [Google Scholar] [CrossRef]
  47. Van den Bergh, J.C.J.M.; Verbrugge, H. Spatial sustainability, trade and indicators: An evaluation of the ecological footprint. Ecol. Econ. 1999, 29, 61–72. [Google Scholar] [CrossRef]
  48. Ayres, R.U. Commentary on the utility of the ecological footprint concept. Ecol. Econ. 2000, 32, 347–349. [Google Scholar]
  49. The Maritime Executive. Available online: https://www.maritime-executive.com/features/ocean-storage-of-co2 (accessed on 12 October 2020).
  50. Godde, C.M.; de Boer, I.J.M.; zu Ermgassen, E.; Herrero, M.; van Middelaar, C.E.; Muller, A.; Röös, E.; Schader, C.; Smith, P.; van Zanten, H.H.E.; et al. Soil carbon sequestration in grazing systems: Managing expectation. Clim. Chang. 2020, 161, 385–391. [Google Scholar] [CrossRef]
  51. Our World in Data. Available online: https://ourworldindata.org/land-use#pastureland-permanent-meadows-and-pasture (accessed on 12 October 2020).
  52. Caraballo Penala, A.; Garcia Negro, M.C.; Doménech Quesada, J.L.; Villasante, C.S.; Rodríguez, G.; González Arenales, M. La huella ecológica corporativa: Concepto y aplicación a dos empresas pesqueras de Galicia. Rev. Galega Econ. 2008, 17, 1–29. [Google Scholar]
  53. Romano, D.; Arcanese, C.; Bernetti, A.; Caputo, A.; Contaldi, M.; Cordella, M.; De Lauretis, R.; Di Cristofaro, E.; Gagna, A.; Gonella, B.; et al. Italian Grennhouse Gas Inventory 1990–2018. In National Inventory Report 2020; ISPRA: Roma, Italy, 2020. [Google Scholar]
  54. The Engineering Tool Box. Available online: https://www.engineeringtoolbox.com/fuels-densities-specific-volumes-d_166.html (accessed on 12 October 2020).
  55. Default Emission Factors for the Member States of the European Union. Available online: https://data.europa.eu/euodp/en/data/dataset/jrc-com-ef-comw-ef-2017 (accessed on 12 October 2020).
  56. Molinos-Senance, M.; Sala-Garrido, R. Energy intensity of treating drinking water: Understanding the influence of factors. Appl. Energy 2017, 202, 275–281. [Google Scholar] [CrossRef]
  57. Berge, B. The Ecology of Building Materials, 2nd ed.; Architectural Press: Burlington, MA, USA, 2009; pp. 19–160. [Google Scholar]
  58. CO2nnect. Available online: https://www.co2nnect.org/ (accessed on 12 October 2020).
  59. Chimica online. Available online: https://www.chimica-online.it/ (accessed on 12 October 2020).
  60. Ferraris, M.; Paleari, S. Municipal Waste Management in Italy; European Environment Agency: Copenhagen, Denmark, 2018; pp. 1–20. [Google Scholar]
  61. Heath, G.A.; Mann, M.K. Background and Reflections on the Life Cycle Assessment Harmonization Project. J. Ind. Ecol. 2012, 16, 8–11. [Google Scholar] [CrossRef]
  62. Kahneman, D.; Tversky, A. On the psychology of prediction. Psychol. Rev. 1973, 80, 237–251. [Google Scholar] [CrossRef] [Green Version]
Figure 1. Ecological footprint calculation methodology.
Sustainability 13 00355 g001
Figure 2. Integrated ecological footprint assessment (IEFA)—flowchart.
Sustainability 13 00355 g002
Figure 3. Influence of ecological footprint assessment addenda on the total for the analyzed building.
Sustainability 13 00355 g003
Table 1. Different contributions useful to implement ecological footprint (EF) by year.
AuthorsImplementationYear
[26]Wackernagel and ReesDefinition of EF, world yield-factors and equivalence factors1996
[40]Bicknell et al.Definition of the link between economic activities and environment1998
[36]Simmons et al.A component-based model of EF to measure the impact of different lifestyles of regions2000
[41]Lenzen and MurrayThe EF has been used to define impacts for implementing meaningful policies2001
[1]Wood and LenzenInput-output analysis has been added to EF by developing a hybrid EF (HEF)2003
[42]Bastianoni et al.Ecological footprint analysis for construction stage looking at the embodied energy of materials2006
[39]Acosta and MoreDevelopment of EF assessment (EFA) to monitor the impacts of buildings on the environment2009
[43]Jin, Xu and YangIntegrating EF to system dynamics to overcome the problem of time2009
[44]Gottlieb et al.Implement of EF Assessment for in-use stage2010
[4]Solìs-Guzman et al. 2012
[38]Martìnez-Rocamora et al.Implement of EF Assessment for construction stage2016
[45]Husain and PrakasAssociation between EF and buildings life cycle (BLC)2018
[37]BrownellIntroduction of occupancy impact in the estimation of building EF index2019
Table 2. Impact sources used in the evaluation of EF—literature review.
Authors[39][44][4][38][45]
Acosta and MoreGottlieb et al.Solìs-Guzman et al.Martìnez-Rocamora et al.Husain and Prakas
Year20102012201320162018
BLC StageIn-useIn-useConstructionIn-UseAll
Impact SourcesDefinitions
Built-upReveal the green space covered by buildings and parking lotsN.A.N.A.EF of land surface occupied by buildingsThe land covered by buildings at the construction stage
Energy ConsumptionReveal the impact of the electrical and heat energy useCapture the CO2 emissions from electricity useReveal the amount of energy spentEF of electricity and fuel consumedEnergy consumed in all BLC stages
WaterReveal the impact of water demandN.A.Reveal the amount of water consumedEF of water consumptionWater consumed in all BLC stages
Food and DrinkReveal the impact of the creation and transport the product + their packagingCapture the CO2 emissions of food consumptionReveal the amount of food consumedEF of the food and drink used by manpower performing the activities of maintenance and cleaningFood consumed by manpower in all stages
MobilityReveal the impact of the fuel used to travelCapture the CO2 emissions of travellingReveal the impact of travellingN.A.Travel of the manpower
MaterialReveal the impact of the creation and the transport of materialsCapture the CO2 emissions of three types of materials used: paper, plastic, and cansReveal the amount of construction materialsEF of materials used for maintenance and cleaningMaterial used in all BLC stages
WasteReveal the impact of solid wasteN.A.Reveal the impact of solid wasteN.A.Solid waste generated in all BLC stages
Recycling potential N.A.N.A.N.A.N.A.Materials reused in the demolition stage
Table 3. Impact sources used in integrated ecological footprint assessment (IEFA) model.
ReferencesImpact SourcesDefinitionData for CalculationEQF Impacted
[38,39,45]Built-UpImpact coming from the surface land covered by the buildingSurface of buildingBuilt-up land
[4,38,39,44,45]Energy ConsumptionImpact in consuming energy to run the activities taking place in the buildingTotal energy consumed: electricity and fuelCO2 sinks, forest land, fishing land, cropland, and pastureland
[4,38,39,45]Water ConsumptionImpact in consuming waterTotal water consumedForest land
[4,38,39,44,45]Material ConsumptionImpact in consuming materials that serve the purpose to keep the building functionalThe sum of all materials used for cleaning and maintenanceCO2 sinks, forest land, fishing land, cropland, and pastureland
[4,38,39,44,45]Food and DrinkImpact in consuming food and drinksThe sum of all drinks and food consumedCO2 sinks, forest land, fishing land, cropland, and pastureland
[4,39,44,45]MobilityImpact in travelling to the building from/to other destinationsThe transport used to go to the buildingCO2 sinks, forest land, fishing land, cropland, and pastureland
[4,39,45]Waste GenerationImpact in generating solid waste produced by human activity within the buildingThe sum of all solid waste CO2 sinks, forest land, fishing land, cropland, and pastureland
[45]Recycling PotentialBenefit in recycling materials, food, drinks, water, and energyThe sum of all materials reused within the buildingCO2 sinks, forest land, fishing land, cropland, and pastureland
[37]OccupantBenefit in using the building simultaneously by several peopleThe number of hours spent in the building, and the number of usersCO2 sinks, forest land, fishing land, cropland, and pastureland
Table 4. Equivalence factors, 2019 [31].
Equivalent Productive LandEquivalence Factor (EQF) [gha/ha]
Built-up land3.51
Forest land1.26
Fishing land0.37
Pastureland0.46
Cropland2.51
Table 5. Absorption factors for CO2 sinks conversion [34,50,51,52].
ComponentAverage Carbon Sequestration [t/tCO2 year]Total HectaresAbsorption Factor Components [tCO2/ha]
Ocean7 × 109 [52]3.6 × 10⁹ [53]1.94
Forest1.04 × 108 [51]39 × 106 [51]2.68
Cropland8.4 × 106 [54]40 × 106 [53]4.76
Pastureland11 × 106 [54]11 × 106 [53]1.76
Table 6. Equivalence factors (EQF) for CO2 sinks conversion [34,50,51,52].
ComponentCorrespondent EQF [gha/ha]Absorption Factor Components [tCO2/ha]CO2 Sink Factors [gha/tCO2]
Ocean0.371.940.19
Forest1.262.680.47
Cropland2.514.760.52
Pastureland0.461.760.26
Table 7. Source of data of case study.
Ecological Footprint Assessment AddendaSource (see Appendix A for Details)Impact SourcesYearResulting EF [gha/year]
BUDrawings—plans1.5975 ha20184.01
ECElectricity bills2,658,830 KWh/year2018328.91
Fuel bills13,279 m3/year
WCWater bill9981 m3/year20180.93
MCFacility management bills and contracts0.376 tCO2/year20150.13
FDContract with vending machine providers65.69 t/year2017138.56
MEmployees’ surveyPeople:
18 by car
108 by bus
262 by train
149 by subway
82 by tram
24 by motorbike
10 by trolleybus
15 by bicycle
1 on foot
20187.72
WG1 month of monitoring by data collection2 486.72 t/year2019224.55
RPN.A.N.A.N.A.0.00
OAccess monitoring through badge swipes2 040 h/year20190.93
TOTAL685.19
Table 8. IEFA compared with six previous studies.
ComparisonType of BuildingBLC StageSurface [m2]UsersTotal EF [gha/year]EF/User
IEFAOffice BuildingIn-Use4803800678.790.85
[39]Acosta and MoreSchoolIn-use378,53932,47916,5900.51
[44]Gottlieb et al.SchoolIn-use19,60015203140.21
[4]Solìs-Guzman et al.Residential buildingConstruction10,243N.A.2694N.A.
[38]Martìnez-Rocamora et al.SchoolIn-use7187139670.48
[45]Husain and PrakasSchoolAll35,000148044262.99
Publisher’s Note: MDPI stays neutral with regard to jurisdictional claims in published maps and institutional affiliations.

