Article

Subsidies, Clean Heating Choices, and Policy Costs: Evidence from Rural Households in Northern China

1
Business School, Beijing Normal University, Beijing 100875, China
2
Chinese Academy of Environmental Planning, Beijing 100012, China
*
Authors to whom correspondence should be addressed.
Sustainability 2021, 13(1), 169; https://doi.org/10.3390/su13010169
Submission received: 2 December 2020 / Revised: 22 December 2020 / Accepted: 23 December 2020 / Published: 26 December 2020
(This article belongs to the Special Issue Energy Efficiency and Urban Climate Adaption)

Abstract

:
Clean heating renovation is important for optimizing the regional energy structure and improving the quality of the atmospheric environment in Northern China. According to survey data of 1298 rural households in the “coal-to-gas” reform in Hengshui of Hebei Province, in this paper, we construct a clean heating subsidy model which focuses on clean heating choices, the reburning rate, and the subsidy cost. The key parameters affecting farmers’ choice of clean heating, including the lifeline, classification of rural households, and gas price elasticity, are estimated. Furthermore, we simulate changes between the existing and new subsidy policies, including the impact on the welfare of rural residents. We present the following findings: (1) under the current subsidy standard, the level of gas heating lifeline in Hengshui is 700 m3, the proportion of low-gas-consumption households is approximately 47.38%, and the reburning rate ranges from 47.38% to 63.80%; (2) under a new subsidy standard which we designed to ensure that households will not reburn the coal, the optimal subsidy value is 1.23 CNY/m3, the optimal subsidy volume is 970 m3, and the total subsidy demonstrates an increase of 46.21%; and (3) the government’s subsidy standards should focus on low-income households.

1. Introduction

Coal heating is a large contributor to the quality of the regional atmospheric environment in the Beijing–Tianjin–Hebei (BTH) Region of China [1]. Large-scale clean heating transformation is an important measure for optimizing the regional energy structure and improving the quality of the atmospheric environment [2,3]. On 3 July 2018, the State Council of China issued the “Three-Year Action Plan for Defending the Blue Sky” (which is called the Plan). Currently, “2 + 26” key urban areas of the Plan are close to reaching the goal. However, a certain gap is still observed for the rural areas in terms of achieving the goal of a 60% clean heating rate in 2021.
At present, the clean heating renovation projects of China in winter have entered the final phase. The construction of clean heating facilities and the installation of user equipment have been gradually implemented. Meanwhile, the governments have provided subsidies to rural households to reduce the rising cost of clean heating. The scale of clean heating subsidies is large, increasing the financial burden of the northern governments. In 2018, 44.2% of the total investment for the “2 + 26” urban clean heating transformation came from the central government and provincial and municipal funds [4]. Beijing, Tianjin, and Hebei province invested CNY 5.00 billion, 2.599 billion, and 12.249 billion, accounting for 3.6%, 2.4%, and 5.5% of the regional general public budget expenditure in that year, respectively [5].
The effective period of government subsidy policy for clean heating is only three years. As the government subsidy is about to expire, many pilot cities will be faced with the cessation of subsidies and the previous achievements are likely to be wasted. Ensuring the operation of clean heating facilities and encouraging users to utilize them are critical for achieving high clean heating rates [6]. In order to avoid coal reburning by farmers, it is necessary to study the standard of the clean heating subsidy after the pilot project. The subsidy policy will further change the heating methods of farmers and help them to cultivate clean heating habits and to form a clean heating awareness. In order to maintain the current effectiveness and further improve the efficiency of clean heating, the key is to balance the cost of clean heating and the economic affordability of residents.
This paper delves into the impact of clean heating subsidy standards on farmers’ heating behavior and government fiscal expenditures, in order to identify a reasonable subsidy measure that can ensure that farmers use clean energy for heating without reigniting coal and minimize the government’s fiscal expenditures. We also hope that the subsidy policy can help more low-income household groups to obtain benefits. In this paper, we propose the “gas equivalent” concept to normalize coal heating and gas heating on a price equivalent basis, through which we are able to determine the optimal gas subsidies [7]. The remaining part of this paper is organized as follows: In Section 2, we review the related literature; in Section 3. we present the construction of the subsidy model of clean heating; in Section 4, we explain the survey data and estimate three key parameters; in Section 5, we simulate the resurgence and subsidy; and in Section 6, we provide relevant suggestions on the subsidy standard.

2. Literature Review

2.1. Energy Subsidies

According to International Energy Agency (IEA), energy subsidies are commonly used by governments to reduce residential energy consumption costs [8]. Price subsidies can effectively promote the use of clean energy [9,10]. As compared with bulk coal heating, clean heating in rural areas increases the cost of rural households [11]. Although local governments provide operation subsidies, the heating expenditure is still generally rising. The main factor affecting the willingness of rural households to adopt clean heating is family income [1]. In China and Mongolia, policy measures such as large stove switching programs have mostly been successful, but the expected goals have not been fully reached due to several factors. One of the key factors has been the variability of human behavior and its response to the policy stimuli [12]. If the pricing mechanism is unreasonable, demands for electricity, natural gas, and transport fuels in the residential sector will be inelastic [13]. In the process of accepting policy, rural residents mentally rely too much on external financial support, which may affect the long-term effective execution of the policy [10]. The subsidy standard of clean heating is the key standard for ensuring sustainable development [14].
Energy subsidy reform for fossil fuel is a challenging prospect for many governments [15,16]. It has been realized that energy subsidies have led to market distortion and welfare loss. The impact of this reform on families is the most concerning issue for the government [15]. Phasing out energy subsidies is high on the agenda of policymakers in several countries. Energy subsidy cuts may hamper economic growth in the short term but will improve growth prospects and family welfare in the longer term, depending on the policy measure. To counteract the negative effects, while gradually abolishing energy subsidies, we should continue to carry out the reform on household consumption, take targeted social security measures, and expand the scale [17].

2.2. Impacts of Subsidy Reform

At the same time, the uncertainty about the impact of reducing energy subsidies on people’s living expenses hinders changes in energy policy [18]. The objective of raising the energy price to cover the cost of energy production is not an easy one [19]. Households and farmers are accustomed to low price and often already have difficulties affording power costs. The removal of energy subsides, especially for electricity and natural gas, has more negative effects on the poor than on the rich [15,20]. As a result, many countries have cross-subsidized residential and agricultural consumers by having high tariffs for industrial and commercial consumers that are often above cost-recovery levels [21,22].
Researchers have found that subsidy is largely used by higher expenditure groups [20]. It is regressive, and therefore it is unlikely to have had much effect on clean energy use. Lin et al. discussed that the reduction of power subsidies would have a negative impact on the welfare of residents, especially low-income residents; they also indicated that a reasonable electricity subsidy mechanism should be designed under the principles of fairness and efficiency [23]. Li et al. found varying effects of the cancelation of gas and electricity subsidies on residents of different income groups. As compared with the high-income group, low-income residents have less tolerance to a price rise, and the rural low-income residents suffer the most [24].
Furthermore, the possibility of coal reburning is high once the subsidy in China is canceled. According to Song et al. [11], in the BTH Region, the average heating cost of coal-to-gas households increased by CNY 874, and 76.6% of the actual heating expenditure of residents increased. Thus far, the clean heating transformation has mainly relied on the financial subsidies of the central and local governments, and the financial burden of the government is high. At present, the adoption of clean heating in rural areas is mainly implemented through administrative orders of governments at all levels, and the degree of implementation heavily relies on government subsidies [9]. According to the survey, if the subsidies are canceled, then, 59% of rural households may discontinue their use of clean heating equipment [11]. This situation has threatened the sustainability of the clean heating standard [4]. To help the poor and distribute resources more equally, the financial resources available from the elimination of energy subsidies should be supported by the government [12]. In-depth research on the impact of subsidies on clean heating behavior is needed. Therefore, our analysis for the BTH region is of value for much of Northern China.

3. Methodology

This section will build a clean heating subsidy model to identify the optimal subsidy level in order to estimate the reburning behavior and find the minimum subsidy cost.

3.1. Clean Heating Choice

First, the cost calculation formula is provided. In the case of using bulk coal for heating, the total cost C i coal of the ith resident is:
C i coal = p coal · v i coal .
Under the current subsidy standard, the total cost C i 0 of the ith resident is:
C i 0 = p · v i 0 m i n { V 0 , v i 0 } · W 0 .
Under the new subsidy standard, the total cost of the ith resident without changing the gas consumption is as follows:
C i * = p · v i * m i n { V * , v i * } · W * ,
where p coal and p are coal and gas prices, respectively; v i coal and v i are the coal and gas consumptions, respectively; V is the maximum volume of gas subsidy; W is the price subsidy value; and the superscript 0 and *, respectively, represent the current and new subsidy standard situation.
The heating utility indicates the satisfaction state of households with respect to heating cost expenditure under a certain heating mode. The heating cost is considered to be the main factor that affects the heating choice of rural households. Cost is the purchase cost of fuel, and C i = v i · p . Therefore, U i is the ith resident heating utility, that is, U i = f ( C i ) . Under the coal-fired scenario, U i coal = f ( C i coal ) ; under the current subsidy standard, the utility of households is U i 0 = f ( v i 0 · p 0 ) ; and under the new subsidy standard, the utility of rural households is U i * = f ( v i * · p * ) . A high heating cost results in low utility.
A central issue is that the heating behavior of residents will change with the subsided price. Revival is chosen by farmers based on the following two variables: the lifeline and affordability.
The lifeline is the gas volume used by farmers to ensure the minimum heating conditions. This concept refers to the “lifeline” of the electricity price [25]. As a preferential treatment for poor households, the lifeline price is set at a low level when the monthly consumption falls below the lifeline level. Setting the lifeline consumption is important for ensuring the basic welfare of low-income households.
Affordability is the highest heating cost that farmers can accept. When facing the high cost of gas, compared with the cost of coal-fired heating, the affordability of farmers is higher or close to the range of the coal-fired cost. We define the gas equivalent to measure the affordability. The gas equivalent is the cost of gas consumption when the probability is equal for coal-fired heating and gas-fired heating. If it is expressed by utility, U ( C i coal ) = U ( C i ) , that is, the utility of the ith resident for C i coal is equal to the utility of C i , then, C i is the gas equivalent of the ith resident.
Therefore, the two key factors for households’ choice are the lifeline and gas equivalent, that is, the gas consumption is higher than the lifeline, and the gas cost is lower than the gas equivalent. When gas consumption is lower than the lifeline, it cannot meet the heating requirements and reburning will arise. When the cost is higher than the gas equivalent, the coal-fired economy is high, and farmers will choose coal-fired heating.

3.2. Formula of the Reburning Rate

Income determines the behavior of heating. Therefore, analyzing the reburning behavior of different income level users is necessary. According to the income level, households can be divided into low-, middle-, and high-income households. Overall, the formula for calculating the reburning rate γ is as follows:
γ = F N 1 + F N 2 + F N 3 N
where F N 1 , F N 2 , and F N 3 are the reburning numbers of low-, middle-, and high-income households, respectively, and N is the total number of households.
For simplicity, under the current subsidy standard, the current heating choice of farmers is the best choice ( v i o p t i m a l = v i 0 ), while the utility of gas heating is larger than that of coal-fired heating ( U i 0 U i coal ). U i 0 is the max utility of the ith resident at the current price p 0 .
If the price of fuel increases, then, the heating cost will increase, and the utility of farmers is reduced. Rural households must reduce the use of gas and decrease the heating temperature to maintain the utility. If the utility of heating is reduced, then, rural households must maintain their heating behavior within a certain range of affordability. The bearing boundary is considered to be the lifeline heating capacity to simplify the analysis. When the heating gas consumption is lower than the lifeline heating quantity, that is, when the minimum indoor temperature cannot be guaranteed, cost reduction cannot increase the utility. Therefore, the utility is substantially low and unacceptable, and farmers choose to use coal for heating.
The price sensitivity of low-income households and their gas consumption are low. This level is lower than the lifeline of normal heating, and households may show unwillingness regarding its usage. Bulk coal heating may be resumed. For low-income households, under the current subsidy standard, the number of reburning households ( F N 1 ) is assumed to be F N 1 0 = k 1 0 N 1 . If the subsidy is reduced, then, the number of reburning households will increase, and the number of reburning households will be F N 1 * = k 1 * N 1 . Among these findings, k 1 0 and k 1 * are the coefficients of reburning, and N 1 is the number of low-income households. Increasing the subsidy value such that the gas consumption of these households is higher than the lifeline and within its gas equivalent range is necessary for reducing the reburning behavior of low-income households.
The price sensitivity of medium-income households is relatively high. These households will reduce the consumption to maintain the utility. When the consumption is lower than the lifeline, it cannot meet the heating requirements and coal will be reburned. The gas consumption of some households is far larger than the lifeline level, while that of some households may be close to or lower than the lifeline level. Simultaneously, if the cost of gas is higher than the gas equivalent, then the resident may not be able to bear this gas cost and reburn. If the number of medium-income households is N 2 , then F N 2 * = k 2 * N 2 , where F N 2 * is the part of medium-income households that reburn coal. Under the current subsidy standard, F N 2 0 = k 2 0 N 2 , where k 2 0 and k 2 * are the coefficients of reburning, and the coefficient of middle-income households is relatively low.
The price sensitivity of high-income households is relatively low. When subsidies decrease and gas prices rise, farmers will reduce their gas consumption to ensure the same utility. However, the reduction of gas consumption is small because high-income households are insensitive to price. Theoretically, when the price rises beyond the affordability of high-income households, they may also opt to revive old practice. According to research on the water price [26], when gas expenditure accounts for 1% of the per capita disposable income, the psychological impact on farmers is insignificant. When the proportion is 2%, farmers begin to consider gas consumption; a proportion exceeding 5% has a substantial impact on farmers. According to the income distribution data of households in Hebei Province, the average disposable income of high-income households is between 80,000 and 120,000, and the heating cost of CNY 4115.02 accounts for less than 5%. Therefore, the impact on high-income households is small. However, no reduction to the lifeline is observed, and the gas equivalent is relatively high, thus, reburning is impossible. Therefore, under the current and new subsidy standard, F N 3 0 = 0 and F N 3 * = 0 .
Overall, under the current and new subsidy standard, the reburning rates γ 0 and γ * are respectively calculated as follows:
γ 0 = j = 1 3 F N j 0 N = F N 1 0 + F N 2 0 + F N 3 0 N = k 1 0 N 1 + k 2 0 N 2 + 0 N ,
γ * = j = 1 3 F N j * N = F N 1 * + F N 2 * + F N 3 * N = k 1 * N 1 + k 2 * N 2 + 0 N .

3.3. Subsidy Cost

The subsidy cost of the government depends on the number of users and the subsidy standards. The subsidy standards determine the range of users and the price of subsidies. Two subsidy standards are commonly used. The first standard is the unified subsidy, which subsidizes all users and sets the maximum volume for a certain subsidy. For example, under the current gas subsidy standard in Hebei Province, the maximum volume of gas consumption is 1200 m3, and the subsidy value is 0.8 CNY/m3. If the gas consumption is higher than 1200 m3, then the household can receive a subsidy of CNY 960 at most. The second standard is the tiered price, which divides the users into the following three types: low-income users with high subsidies; middle-income users with low subsidies; and high-income people with no subsidies. The range of subsided users and the subsided price of the two standards are different, which leads to a considerable difference in the subsidy cost. The total subsidy cost of the tiered price is lower than that of the unified standard.

3.3.1. Formula of the Subsidy Cost

The adoption of the unified subsidy standard is considered by most cities of Northern China. For example, the current subsidy standard in Hebei Province is the household whose consumption is less than 1200 m3, and the subsidy value is 0.8 CNY/m3. The subsidy cost S 0 of the current standard is as follows:
S 0 = j = 1 m i = 1 N j m i n { V 0 , v j i 0 } · W j 0 ,
where v j i 0 is the gas consumption for the ith farmer in the jth category. When the gas consumption does not exceed the subsidy standard V 0 , the subsidy volume is calculated in accordance with the actual gas consumption; when the gas consumption exceeds the standard V 0 , the maximum subsidy amount is V 0 · W j 0 . Therefore, the subsidy amount for the ith farmer in the jth category is m i n { V 0 , v j i 0 } · W j 0 .
Similarly, the subsidy cost S * under the new subsidy scheme is as follows:
S * = j = 1 m i = 1 N j m i n { V * , v j i * } · W j * .
A high number of subsided users leads to a high subsidy cost; when the subsidy is high, the subsidy cost is also high, that is, S * V * > 0 , S * W j * > 0 .
The optimization objective of the model is given as follows: S * S 0 , γ * = 0 . The following hypotheses are presented: (1) The distribution of gas consumption of different types of households is uniform or follows a normal distribution. (2) The capability of households to bear the change in the gas subsidy standard is subject to a uniform or normal distribution from no subsidy to an unchanged subsidy. (3) The impact of canceling subsidies on households depends on the demand price elasticity of households.
Reducing the two parameters, namely, the subsidized user range and subsidy, is necessary for minimizing the subsidy cost. When the subsidy is reduced, the coal reburning of households will depend on whether the new gas consumption can guarantee the minimum heating demand and whether this consumption is within the scope of the households’ tolerance; that is, the gas consumption is larger than the lifeline and lower than the gas equivalent.
S * = j = 1 m i = 1 N j m i n { V * , v j i * } · W j * S 0 = j = 1 m i = 1 N j m i n { V 0 , v j i 0 } · W j 0 .
Therefore, the reburning rate is γ * = j = 1 3 F N j * N = k 1 * N 1 + k 2 * N 2 + 0 N . K should be estimated separately as k 1 * and k 2 * to obtain a zero reburning rate.

3.3.2. Estimation of Low-Income Households

Firstly, the gas consumption for low-income households under the current subsidy standard is at the lowest level, that is, lower than the lifeline gas consumption. Therefore, gas subsidies of low-income households can only be increased, and not decreased: W 1 * = W 2 * = W 3 * . This condition means that the subsidy of all farmers cannot be reduced.
W j * W j 0 .
The total financial expenditure must be reduced. Therefore, the following formula must be established:
S * = j = 1 m i = 1 N j m i n { V * , v j i * } · W j * S 0 = j = 1 m i = 1 N j m i n { V 0 , v j i 0 } · W j 0 .
According to the two formulas, the following can be considered:
W j * W j 0 , V * V 0 .
The gas consumption for low-income households under the current subsidy standard is at the lowest level, which is lower than the lifeline gas consumption. Therefore, increasing the subsidy value such that the gas consumption of these farmers is higher than the lifeline and within the scope of its coal gas equivalent is required to reduce the reignition behavior of low-income households.
The optimal volume of gas subsidy V * should be larger than the maximum value of gas consumption in low-income households:
V * max i N 1 v i 0 .
The range of gas subsidy consumption V * is max i N 1 v i 0 V * V 0 . The subsidy cost S * increases monotonically to V * . Therefore, the minimum value of the subsidy cost corresponds to that of gas subsidy consumption V * ,that is, when the subsidy volume V * is the maximum value of gas consumption in low-income households, max i N 1 v i 0 , the subsidy cost is reduced to the lowest value. Therefore, V * = s v is required for low-income households. Estimating the gas equivalent and the minimum subsidy according to the coal consumption of low-income households is required to ensure that low-income households do not reignite k 1 * = 0 . The survey indicates that the average coal cost of low-income households in winter is CNY 1000, and the gas equivalent is 1000 p W * . The gas equivalent is the highest gas quantity that households are willing to pay. Therefore, this quantity should reach the lifeline of 1000 p W * = s v , and then W * = p 1000 s v W j 0 .
Therefore, the optimal subsidy value and volume for low-income households are W * = p 1000 s v and V * = s v , respectively.

3.3.3. Estimation of Middle-Income Households

The average gas price p i * for middle-income households is no longer a fixed price p 0 ( p 0 = p W 0 ), but turns into the following:
p i * = v i 0 p V * · W 0 v i 0 .
The price elasticity is t 2 because middle-income households are remarkably sensitive to gas prices. The calculation formula of price elasticity indicates that t i = v i * v i 0 v i 0 p i * p 0 p 0 . The change to gas consumption can be calculated as follows:
v i * = v i 0 · ( 1 + p i * p 0 p 0 · t 2 ) .
Combined with Formulas (14) and (15), the gas consumption of middle-income households under the new subsidy standard v i * can be estimated. If the gas consumption of some households is lower than the lifeline level v i * < s v , then, the number of households who may be reignited is F N 2 * . Moreover, v i * s v must be created.Therefore, according to v i * s v , substituting (14) and (15) can yield the following:
V * v i 0 p ( s v v i 0 t 2 v i 0 + 1 ) · v i 0 ( p W 0 ) W 0 .
Considering the volume of subsidy v i 0 p ( s v v i 0 t 2 v i 0 + 1 ) · v i 0 ( p W 0 ) W 0 s v , the part which is higher than the lifeline gas consumption can be regarded as a buffer between a low and high income.
Simultaneously, if the cost of the gas consumption for middle-income households under the new subsidy standard v i * is higher than the gas equivalent, then, this condition may lead to the coal reburning of households. α is used to characterize the ratio between clean and coal-fired heating alternatives when U i = U i coal , α = C i coal C i , and 0 α 1 . When the cost of gas consumption is higher than that of coal combustion, the coal reburning of households depends on α . Therefore, C i coal α is the best gas cost of alternative coal determined by households. Considering this, C i * C i coal α due to C i * = v i * p V * W 0 . According to C i * C i coal α , substituting (16) can lead to the following results:
V * W 0 t 2 p p W 0 C i coal α + v i 0 p W 0 ( t 2 p ( p W 0 ) v i 0 + 1 ) .

3.3.4. Estimation of High-Income Households

The previous discussion revealed that the resurgence situation of high-income households may not be considered.

3.3.5. Optimal Model of Subsidy and Volume

Overall, setting a new subsidy value and volume is necessary for reducing the subsidy cost and guaranteeing a zero reburning rate as follows:
W * = p 1000 s v
V * = max { s v , W 0 t 2 p p W 0 C i coa ; α + v i 0 p W 0 ( t 2 p ( p W 0 ) v i 0 + 1 ) , v i 0 p ( s v v i 0 t 2 v i 0 + 1 ) · v i 0 ( p W 0 ) W 0 }
Here, the classification of gas consumption, lifeline s v , and price elasticity must be estimated following the actual situation of rural heating.

4. Data Description and Parameter Estimation

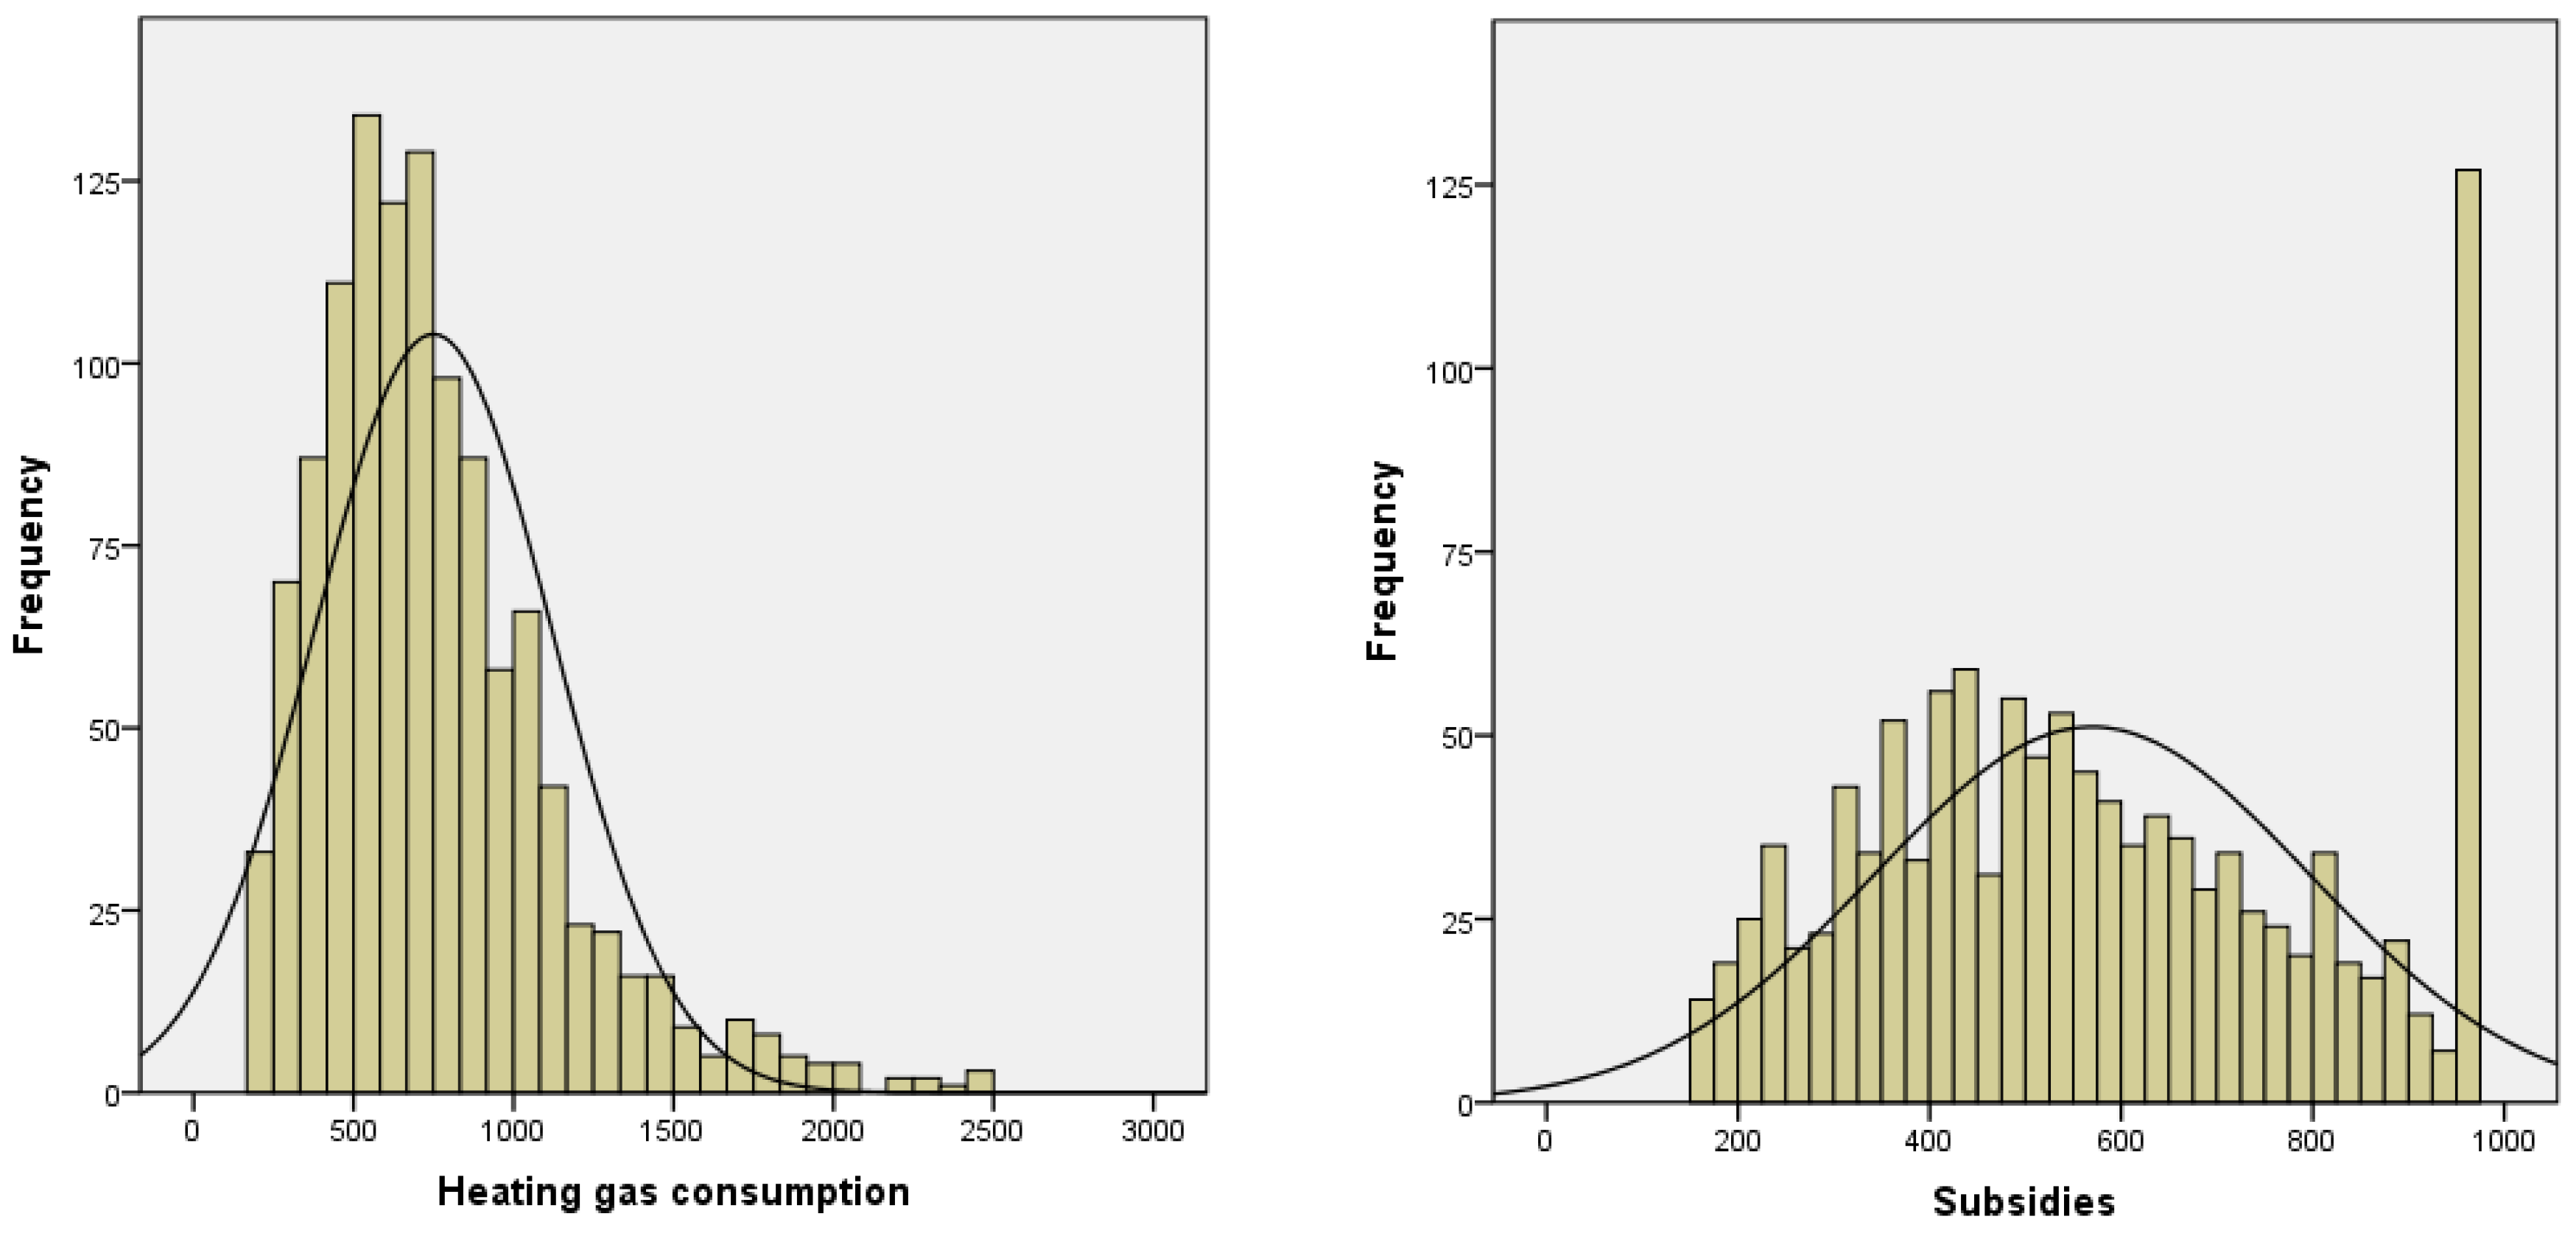
4.1. Data Description

In the Plan, Hengshui is one of the “2 + 26” cities and is in Hebei Province. From February 2020 to March 2020, the project team investigated the gas companies in various districts and counties in Hengshui.
All 13 districts and counties were investigated, and 50 households in each village were randomly selected to obtain the monthly gas consumption data for the heating season in 2018 and 2019. A total of 1300 households’ data were obtained, which is the most complete data presented in domestic gas heating research.
The data of 1298 families were obtained after removing the missing data. It was observed that 132 out of the 1298 families used less than 200 m3 for heating, which was not regarded as normal heating conditions. Through telephone interviews, these households were identified to represent fewer than two situations as follows: one situation is that the farmers have many houses, but do not live in the house in the winter and the other situation is that the households live in the city with their children during winter. For the convenience of estimating the classification of households, these households were not estimated temporarily; instead, they were considered when estimating the overall subsidy level and included in the middle-income households. Therefore, data for the 132 families were deleted, and the valid data (more than 200 m3 of heating) were obtained from 1166 families. The data show that the proportion of real heating households in the Hengshui rural areas is 89.83%. The descriptive statistics of the samples are shown in Table 1.
Table 1 shows that in the valid samples, the heating capacities of households with the 25th, 50th, and 90th percentile are 490, 679, and 1222 m3, respectively, with an average of 750 m3. The data also reveal that the maximum subsidy volume of the existing standard is 1200 m3, and only 10% of the households can obtain all of the subsidies; a large consumption leads to additional subsidies. Figure 1 shows the distribution of the heating gas consumption and subsidy amount. The distribution of the heating gas consumption is clearly skewed, with more low-gas-consumption households. Similarly, two peaks in the frequency of subsidies received are found, i.e., low and full subsidies. This indicates that the current subsidy standard with a subsidy volume of 1200 m3 is a full-coverage subsidy strategy, and the main subsidy volume flows to the middle- and high-income groups.

4.2. Parameter Estimation

4.2.1. Lifeline

The gas consumption of a gas fireplace is affected by many factors, including the house insulation, house location, plain or mountainous area, and surrounding occupancy (whether there is heating around). The rated thermal output of a gas wall-hung furnace is usually measured in kW. The common wall-hung furnaces are 18, 20, 24, 28, 32, and 35 kW. The larger the household’s area, the more powerful the gas fireplace needs to be. According to actual data obtained from the surveyed households, for a three-room residential house with a building area of 110 m2 and using a steel plate-type radiator heating system, the daily gas consumption ranges from 15 to 20 m3 if the indoor temperature is maintained at 18 °C. The heating behavior of households also affects gas consumption. Some households divide their rooms into several heating zones, heating the living room during the daytime and the bedroom at night, which consumes less gas.
Therefore, a common low-income household gas consumption scenario is a 24 kW wall-hung furnace, a heating area for only one room (approximately 30 m2) or different rooms in rotation, an indoor temperature maintained at 18 °C, and a minimum daily gas consumption of 6 m3. Then, about 700 m3 of gas will be required in a heating season, which is estimated at 4 months. Therefore, we estimate that the lifeline level of gas heating in the Hengshui area is approximately 700 m3. Farmers have to endure the cold in the winter when the gas consumption is below 700 m3.

4.2.2. Classification of Household Gas Use Behavior

Cluster analysis was conducted for the data on household gas consumption to obtain the classification of household gas consumption. The K-means algorithm was used for clustering analysis. Two characteristic quantities were utilized for clustering, i.e., the annual heating gas consumption and payment amount. Using SPSS, the K-means clustering algorithm based on the Euclidean distance was employed for clustering analysis, and the values of the two characteristic quantities and the classification of households corresponding to three categories were determined. The classification results and descriptions of the households are shown in Table 2. Clustering found three different types of gas consumption. Since the income level is considered to be the main factor affecting gas consumption, we consider that the three obtained categories correspond to the following three types of households with different incomes: low-income households; middle-income households; and high-income households.
According to the data from the 1166 households, if the lowest 31% are regarded as low-income households, then, the corresponding heating gas consumption boundary is 549 m3, and the low-income households have values lower than 549 m3. If the highest 9% are high-income households, then, the corresponding boundary of heating gas consumption is 1254 m3, and those who have values higher than 1254 m3 are high-income households. The heating gas consumption between 549 and 1254 m3 represents middle-income households, thereby accounting for 60% of those included in this study.
Since the concept of “low income” has a considerable relativity, several situations need to be taken into account to better fit the actual classification of the gas consumption behavior of households.
According to the statistical data of Hebei Province, in 2017, 40% of the low-income households in rural Hebei Province had a per capita disposable income of less than CNY 8697 and 20% of the high-income households displayed a value of CNY 15,508 [27]. According to China Dispersed Coal Governance Report 2019 [28], 47.38% of households in the valid sample earn less than CNY 30,000, corresponding to the gas consumption of 668 m3, representing low-income farmers. As for the high-income households, 8.16% of households earn more than CNY 50,000. It is also reported that residents are generally reluctant to spend more than CNY 2000, corresponding to 1170 m3 of heating. Several provinces and cities set 1200 m3 as the upper limit of subsidies. Therefore, the households who use more than 1200 m3 of gas are defined as high-income households.
Combined with the coal consumption of households, this research indicates that in rural areas, the purchase cost of general bulk coal for low- and middle-income households is CNY 1000 and 1300, respectively, and the corresponding gas consumption is 537 and 699 m3, respectively.
On the basis of the above consideration, three types of heating households are presented as follows: low-gas-consumption households with less than 700 m3; middle-gas-consumption households with 700~1200 m3; and high-gas-consumption households with more than 1200 m3. The final classification results, including 132 non-heating households, are shown in Table 3. The current research and analysis revealed that in rural areas, the heating capacities of households in the 25th, 50th, and 90th percentile are 490, 679, and 1222 m3, respectively, with an average of 750 m3, that is to say, half of the heating households (51.34%) use gas below the lifeline, which cannot guarantee the heating demand in winter. Moreover, the risk of reburning is high.

Consumption of Low-Income Households

The typical heating scenario of this kind of household is as follows: Gas is only used to meet the most basic living needs. The heating area can only satisfy one room, the heating temperature is set as the minimum acceptable temperature (18 °C), and the heating period is four months. This estimation indicates that the monthly gas consumption required to meet the basic heating needs of low-income group households is approximately 700 m3. This gas consumption can be regarded as the lowest gas consumption of the group of households.
Table 3 reveals that the number of households of this type is 615, thereby accounting for 47.38% of all households. The average gas consumption is 484.62 m3, which accounts for 33.64% of the total gas consumption of households.

Consumption of Middle-Income Households

The typical scene of the farmer is as follows: Taking a 70 m2 households as an example, there are four permanent residents, the house is a brick and concrete structure with wooden doors and windows, the family conditions are general, the heating season is four months, and the heating temperature is set at 18 °C. The study indicates that the gas consumption required to meet the basic heating needs of middle-income households is approximately 1000 m3.
Table 3 shows that the number of households of this type is 426, which accounts for 32.82% of all households. The average gas consumption is 895 m3, thereby, accounting for 43.04% of the total gas consumption of households.

Consumption of High-Income Households

The typical scene of the farmer is as follows: Taking a 100 m2 of household as an example, there are four permanent residents, the house is a brick concrete structure with wooden doors and windows, the family conditions are good, the heating season is four months, and the heating temperature is set at 18 °C. The results reveal that the monthly gas consumption required for the basic heating of high-income households is approximately 1200 m3.
Table 3 also shows that the number of households of this type is 125, thus, accounting for 9.63% of all households. The average gas consumption is 1547 m3, which accounts for 21.82% of the total gas consumption of households.

4.2.3. Price Elasticity of the Gas Demand

The gas price elasticity is key to analyzing the changes in the heating behavior of households due to subsidy variation. The impact of canceling the gas subsidy on households depends on the demand price elasticity [23]. The definition of IEA in 1999 indicates that the function of the energy demand is as follows:
q = p ε .
The impact of a gas price rise on the demand can be expressed as follows: Δ q = Q 0 Q 1 .The logarithm is taken to obtain the following:
ln Q 1 = ε × ( ln P 1 ln P 0 ) + ln Q 0 ,
where Δ q is the reduced gas demand after the gas subsidy is canceled; ε is the price elasticity of the long-term demand; P 0 and Q 0 represent the gas price and demand before the subsidy is canceled, respectively; and P 1 and Q 1 represent the gas price and demand before the subsidy is canceled, respectively.
Albertini et al. estimated that the price elasticity of natural gas in 50 metropolitan areas of the United States from 1997 to 2007 was in the range of −0.693 to −0.566, and the short- and long-term self-price elasticity of natural gas under the dynamic model were −0.572 and −0.647, respectively [29]. Zhang et al. estimated the natural gas consumption data of greater North China from 2000 to 2012 and found that regions with a high economic level and strong user price tolerance has small demand price elasticity and vice versa [30]. Wang et al. also used the logarithmic linear model to build a natural gas demand model in China and estimated that the price elasticity of the natural gas demand was −2.88 and the natural gas price elasticity of the industrial sector was −0.4 [31]. Hu et al. estimated that the average price elasticity of natural gas of Beijing residents was −0.608 [32]. Yu et al. used city average gas data and estimated an income elasticity of 0.21 [33]. Solheim et al. estimated a slightly lower price elasticity from −0.003 to −0.223 for natural gas in OECD countries [34]. Meier et al. estimated values in the range of −0.34 to −0.56 for the U.K. [35]. The estimates of price elasticity for gas and coal in China ranged from −0.94 to −0.46 in the research of Cao et al. [36].
The above studies revealed that the price elasticity of natural gas in China was negative and the absolute value was less than one. This finding indicates that the demand for natural gas lacks price elasticity, and the natural gas consumption of residents’ decreases with a rise in the natural gas price. This phenomenon is attributed to the subsidization of residential gas by the Chinese government and the lower price of residential gas than its marginal cost. In addition, research on the price elasticity of the natural gas consumption demand of rural residents is lacking. The research on high-income households is believed to refer to the research results of urban residents. Therefore, consideration of the unique situation of some low-income rural households is necessary.
The double logarithm model was used to obtain the elastic coefficients. Considering the influence of many factors on the demand of heating gas, the gas price, income, and payment amount were finally selected, and the factors that are difficult to quantify and measure, such as the environment and weather, were excluded. Therefore, the explanatory variables were the gas price P after subsidy, per capita income of households in counties and districts I , and average payment amount V . The explanatory variable was the heating gas consumption Q , which is expressed as follows:
ln Q = β 0 + β 1 ln P + β 2 ln I + β 3 ln V + μ ,
where Q is the heating gas consumption, P is the subsided price, I is the per capita income of households in the county, V is the average payment amount, μ is the random error, β 1 is the price elasticity of the gas demand, and β 2 is the income elasticity of the gas demand.
The sample data of high-income households were used because the gas price of the low-income group is the same after subsidy, and only the gas prices of the high-income group are different from each other. The price elasticity model of the heating gas demand of rural residents in Hengshui can be obtained as follows:
ln Q = 8.051 0.187 ln P + 0.445 ln I + μ ,
where the price elasticity of the high-income group is −0.187. Therefore, the situation of other groups must be further estimated. The price elasticity of China’s gas demand was estimated to be −15.31, in 2010. Li et al. estimated the price elasticity of the urban and rural gas demand. The price elasticity of urban low-, middle-, high-, rural low-, rural middle-, and rural high-income families was −0.31, −0.51, −0.21, −0.11, −0.21, and −0.11, respectively [24]. Therefore, the demand price elasticity of high-income households (−0.187) can be used as a benchmark value to estimate other groups. The demand price elasticity of middle-income households is the highest, which can increase by approximately 0.1. Therefore, the demand price elasticity of middle-income households was estimated to be −0.31. The demand price elasticity of low-income households is low and was estimated to be −0.15. The demand price elasticity of Hengshui rural residents for gas heating is shown in Table 4.

5. Data Analysis and Scenario Simulation

5.1. Simulation of the Existing Subsidy Standard

We designed an estimated scenario. The heating behavior and distribution of 100,000 gas heating households were exactly the same as those in the survey area.
The current subsidy standard of heating gas for farmers in Hengshui is to subsidize the gas consumption of 1200 m3, and the subsidy value is 0.8 CNY/m3. In the survey sample of Hengshui, 47.38% of the total households are low-gas-consumption households with less than 700 m3. Meanwhile, 32.82% of the total households are medium gas users. Therefore, the two groups are likely to revive old practices. A total of 10.17% of the non-heating farmers and 9.63% of the high-gas-consumption households could not reburn coal. The reburning rate can be estimated as follows:
R e b u r n i n g   R a t e = k 1 0 N 1 + k 2 0 N 2 + 0 N = 47.38 % × k 1 0 + 32.82 % × k 2 0
Estimating k 1 0 and k 2 0 was necessary because the project team did not conduct a special investigation on the rekindling behavior of the two groups. The living standard of low-income groups is critical to winning the battle against poverty alleviation k 1 0 = 1 , which guarantees that the low-income households can obtain basic heating security. In the middle-income group, the probability range of farmer resurgence was assumed to be 0~0.5. The possible range of the reburning rate is 47.38% to 63.80%:
R e b u r n i n g   R a t e = 47.38 % × 1 + 32.82 % × 0 = 47.38 % ,
R e b u r n i n g   R a t e = 47.38 % × 1 + 32.82 % × 0.5 = 63.80 % .
The cost of the existing subsidy standard was calculated on the basis of Formulas (18) and (19). The estimated results are shown in Table 5. In the table, the overall subsidy cost and the three types of households’ subsidy amount and proportion are estimated. Among the results, the proportion of low-gas-consumption households is approximately 47.38%, but the proportion of subsidies is only 35.41%. Meanwhile, the proportion of high-gas-consumption households is only 9.63%, and that of subsidies is 17.79%. The overall distribution of subsidies tends to be in the middle and high-income households.

5.2. Simulation of the New Subsidy Standard

In this part of the paper, we will present a new subsidy standard to ensure that all of the households will not reburn coal.
Heating and gas must be guaranteed for low-income households. Therefore, the best subsidy value is W * = p 1000 s v = 2.66 1000 700 = 1.23 CNY/m3.
The gas equivalent of households was estimated. The field survey indicates that the coal cost of middle-income households is generally CNY 1200. The average gas equivalent value of middle-income households was estimated to be CNY 1800 of the gas cost (corresponding to CNY 1300 of the coal-fired cost). The coal-fired cost of middle-income households was assumed to be related to the current gas consumption cost, which follows a normal distribution. The average distribution of the gas equivalent could be estimated following the average income range of CNY 1800. The average gas equivalent of CNY 1800 indicates that the gas equivalent distribution of middle-income households is in the range from 1017.10 to 1738.30.
When the new subsidy standard is implemented, the subsidy cost will change with variations in the subsidy value and the maximum subsidy volume. The gas consumption of middle-income households ranges between 700 and 1200 m3, with an average of 895. The maximum subsidized gas volume V * = 970 could be calculated following Formula (19). By comparing V * with lifeline 700, the maximum value 970 is selected as the maximum subsidy volume. Table 6 shows that, after the implementation of the new standard, the subsidy value is 1.23 CNY/m3, the maximum subsidy volume is 970 m3, and the total subsidy is increased to CNY 75.9922 million, thereby, demonstrating an increase of 46.21%.

5.3. Welfare Changes

In this part of the paper, we present two variables to discuss the changes in consumer welfare due to the new subsidy standard, i.e., the increase in expenditure and the influence index. The increase in expenditure is the increase in the heating and gas cost. The impact index indicates that the increase in energy consumption expenditure caused by the rise of the energy price accounts for the income of residents. A large impact index leads to a considerable proportion of the increase in energy consumption expenditure caused by the abolition of subsidies in the income of residents, that is, a large direct impact on the lives of residents. The calculation formula is as follows:
influence   index = Heating   gas   expenditure × Expenditure   increase Per   household   disposable   income × 100 .
The per capita disposable income refers to the statistical data of Hebei Province [27]. In 2017, 20% of the middle- and low-income households in Hebei Province had a disposable income of CNY 20, which was 20% of the middle- and low-income households in Hebei Province. The income was calculated with a value of three people per household. The estimated results are shown in Table 7. From the perspective of welfare impact, if the maximum volume of subsidy is changed and its unit price is increased, then, the welfare impact index of the low-income group is the smallest, and the welfare increase is the greatest. The middle-income group is affected the most, and the welfare of the high-income group is also increased.

6. Conclusions

The main content and the conclusion of this article are as follows:
(1) The lifeline consumption of gas heating in Hengshui is 700 m3. The level can be used to divide the heating households into three types, i.e., low-income households below 700 m3, medium-income households between 700 and 1200 m3, and high-income households with more than 1200 m3. Half of the heating households (51.34%) use gas below the lifeline, which cannot guarantee the heating demand in the winter, thus, presenting a considerable risk of the reignition of coal. The demand price elasticity of low-, middle-, and high-income households is −0.15, −0.31, and −0.187, respectively.
(2) Under the current subsidy standard, the proportion of low-gas-consumption households is approximately 47.38%, and the proportion of subsidies is only 35.41%. Meanwhile, the proportion of households with a high gas consumption is only 9.63%, and that of subsidies is 17.79%. The overall distribution of subsidies tends to be in the middle- and high-income households. In order to protect farmers from the reignition of coal, we have designed a new subsidy standard, where the subsidy value is 1.23 CNY/m3, the maximum volume of subsidy is 970 m3, and the total subsidy cost is increased by 46.21%.
The suggestions are as follows:
(1) Current financial subsidies should not be stopped, and a long-term mechanism must be designed. At present, the clean heating work in North China has resulted in remarkable achievements. In order to maintain the effect of clean heating, it is necessary to continue to support farmers with operating subsidies and design a long-term mechanism. The effective period of current policy made by central or local government is almost three years. Some localities have already planned a subsidy decline plan. However, the rash implementation of the subsidy decline may have a large impact on low-income farmers.
Simultaneously, multiple channels should be considered for solving the financing problem of clean heating projects. The National Development and Reform Commission issued “The Opinions on the Price Policy of Clean Heating in Northern China”, which proposed many measures, such as exploring diversified financing methods; vigorously developing green finance; increasing support for clean heating enterprises and projects considering controllable risk; supporting solutions of financing problems of clean heating projects through enterprise bonds and low interest loans; and encouraging social capital participation in the investment, construction, and operation of clean heating projects through Public-Private Partnership (PPP) mode.
(2) The government should precisely subsidize low-income groups and key areas, and tired subsidies are more scientific. At present, most regions adopt a unified subsidy standard, thus, allowing farmers to receive subsidies regardless of their income. In this case, low-income households receive fewer subsidies than high-income households. Most of the subsidies fall into the middle- and high-income group. The indiscriminate subsidy mechanism will result in most of the subsidies going into the pockets of the rich. Moreover, if the fiscal revenue is used to subsidize, it may eventually lead to poor people subsidizing rich people, which is obviously unfair. Therefore, the current subsidy mechanism needs to be reformed.
At the same time, the preferential subsidy standard should be implemented for special groups. The poor households with special difficulties who are officially registered should be additionally subsidized by the local government, in accordance with the regulations in light of the actual situation.
The follow-up of this study will focus on the application and effect of tiered pricing. The current unified subsidy mode, even if it can guarantee the heating demand of low-income groups and does not revive old practice, may substantially increase the overall subsidy cost. We hope to implement tiered subsidies that focus on subsidizing low-income groups and some of the middle- and high-income households in order to help the subsidy standard achieve the desired effect.

Author Contributions

Conceptualization, J.L. and Y.Z.; methodology, J.L.; formal analysis, J.L.; investigation, J.L. and Y.Z.; resources, L.S.; data curation, L.S.; writing—original draft preparation, J.L.; writing—review and editing, J.L. and Y.Z.; project administration, L.S.; funding acquisition, Y.Z. All authors have read and agreed to the published version of the manuscript.

Funding

This research was funded by the Chinese Ministry of Ecology and Environment’s Pilot Program for Clean Winter Heating in the North, grant number 2019A225.

Institutional Review Board Statement

Not applicable.

Informed Consent Statement

Not applicable.

Data Availability Statement

The data presented in this study are available on request from the corresponding author.

Conflicts of Interest

The authors declare no conflict of interest. The funders had no role in the design of the study; in the collection, analyses, or interpretation of data; in the writing of the manuscript, or in the decision to publish the results.

References

  1. Barrington-Leigh, C.; Baumgartner, J.; Carter, E.; Robinson, B.E.; Tao, S.; Zhang, Y. An evaluation of air quality, home heating and well-being under Beijing’s programme to eliminate household coal use. Nat. Energy 2019, 4, 416–423. [Google Scholar] [CrossRef]
  2. Wang, W.; Li, F. Study on substitutable value of electric heating instead of coal heating in northern China under carbon constraints. J. Clean. Prod. 2020, 260, 121155. [Google Scholar] [CrossRef]
  3. Wu, Y.; Yu, Z.; Ngan, H.W.; Tan, Z. Sustainning China’s electricity market development. Energy Policy 2014, 73, 30–37. [Google Scholar] [CrossRef]
  4. Liu, Y.H. Analysis of affordability on residents heating with coal to gas: A case study in urban and rural of Beijing. Int. Pet. Econ. 2017, 25, 45–50. [Google Scholar] [CrossRef]
  5. Song, J. Beneficiaries and redistribution effect of fiscal expenditure on heating. J. Beijing Technol. Bus. Univ. (Soc. Sci.) 2018, 33, 23–31. [Google Scholar] [CrossRef]
  6. Zhao, J.; Duan, Y.; Liu, X. Study on the policy of replacing coal-fired boilers with gas-fired boilers for central heating based on the 3E system and the TOPSIS method: A case in Tianjin, China. Energy 2019, 189, 116206. [Google Scholar] [CrossRef]
  7. Lin, B.; Kuang, Y. Natural gas subsidies in the industrial sector in China: National and regional perspectives. Applied Energy 2020, 260, 114329. [Google Scholar] [CrossRef]
  8. IEA. World Energy Outlook. 2015. Available online: https://www.iea.org/reports/world-energy-outlook-2015 (accessed on 10 September 2020).
  9. Sun, G.Y. Research on Difficulties and Countermeasures of Rural Clean Heating Implementation of Grass-Roots Government-Taking Huairen Town of Shanghe County as an Example. Master’s Thesis, Shandong University, Jinan, China, June 2020. [Google Scholar] [CrossRef]
  10. Gong, Y.; Cai, B.; Sun, Y. Perceived fiscal subsidy predicts rural residential acceptance of clean heating: Evidence from an indoor-survey in a pilot city in China. Energy Policy 2020, 144, 111687. [Google Scholar] [CrossRef]
  11. Song, L.L.; He, J.; Wu, J.N.; Xu, Y.; Cheng, L.; Wang, Z.F.; Yao, M.Y. Study on the implementation evaluation of clean heating pilot city in northern China. Environ. Protect. 2019, 47, 64–68. [Google Scholar] [CrossRef]
  12. Kerimray, A.; Rojas-Solorzano, L.; Torkmahalleh, M.A.; Hopke, P.K.; Gallachoir, B.P.O. Coal use for residential heating: Patterns, health implications and lessons learned. Energy Sustain. Dev. 2017, 40, 19–30. [Google Scholar] [CrossRef]
  13. Sun, C.; Ouyang, X. Price and expenditure elasticities of residential energy demand during urbanization: An empirical analysis based on the household-level survey data in China. Energy Policy 2016, 88, 56–63. [Google Scholar] [CrossRef]
  14. Xu, S.; Ge, J. Sustainable shifting from coal to gas in North China: An analysis of resident satisfaction. Energy Policy 2020, 138, 111296. [Google Scholar] [CrossRef]
  15. Lin, B.; Kuang, Y. Household heterogeneity impact of removing energy subsidies in China: Direct and indirect effect. Energy Policy 2020, 147, 111811. [Google Scholar] [CrossRef]
  16. Breton, M.; Mirzapour, H. Welfare implication of reforming energy consumption subsidies. Energy Policy 2016, 98, 232–240. [Google Scholar] [CrossRef]
  17. Breisinger, C.; Mukashov, A.; Raouf, M.; Wiebelt, M. Energy subsidy reform for growth and equity in Egypt: The approach matters. Energy Policy 2019, 129, 661–671. [Google Scholar] [CrossRef]
  18. Saboohi, Y. Evaluation of the impact of reducing energy subsidies on living expenses of households. Energy Policy 2001, 29, 245–252. [Google Scholar] [CrossRef]
  19. Moerenhout, T.S.H.; Sharma, S.; Urpelainen, J. Commercial and industrial consumers’ perspectives on electricity pricing reform: Evidence from India. Energy Policy 2019, 130, 162–171. [Google Scholar] [CrossRef]
  20. Dube, I. Impact of energy subsidies on energy consumption and supply in Zimbabwe. Do the urban poor really benefit? Energy Policy 2003, 31, 1635–1645. [Google Scholar] [CrossRef]
  21. Erdogdu, E. The impact of power market reforms on electricity price-cost margins and cross-subsidy levels: A cross country panel data analysis. Energy Policy 2011, 39, 1080–1092. [Google Scholar] [CrossRef] [Green Version]
  22. PwC. Report on Road Map for Reduction in Cross Subsidy. Price Water House Coopers, 2015. Available online: http://www.forumofregulators.gov.in/Data/WhatsNew/Report.pdf (accessed on 25 September 2020).
  23. Lin, B.; Wang, F. Impact of energy price increase on general price level in China: A study based on input-output model and recursive SVAR model. Econ. Res. J. 2009, 44, 66–79. [Google Scholar]
  24. Li, H.; Dong, L.; Xie, M.H. A study on the comprehensive evaluation and optimization of how removing gas and electricity subsidies would affect households’ living. Econ. Res. J. 2011, 46, 100–112. [Google Scholar]
  25. Matar, W.; Anwer, M. Jointly reforming the prices of industrial fuels and residential electricity in Saudi Arabia. Energy Policy 2017, 109, 747–756. [Google Scholar] [CrossRef]
  26. Brent, D.A.; Ward, M.B. Price perceptions in water demand. J. Environ. Econ. Manag. 2019, 98, 102266. [Google Scholar] [CrossRef]
  27. Hebei Provincial Bureau of Statistics. Hebei Economic Yearbook; China Statistics Press: Beijing, China, 2018; pp. 349–378. [Google Scholar]
  28. China Dispersed Coal Governance Report. 2019. Available online: http://coalcap.nrdc.cn/datum/info?id=101&type=1 (accessed on 15 September 2020).
  29. Alberini, A.; Gans, W.; Velez-Lopez, D. Residential consumption of gas and electricity in the U.S.: The role of prices and income. Energy Econ. 2011, 33, 870–881. [Google Scholar] [CrossRef] [Green Version]
  30. Zhang, Y.; Ji, Q.; Fan, Y. The price and income elasticity of China’s natural gas demand: A multi-sectoral perspective. Energy Policy 2018, 113, 332–341. [Google Scholar] [CrossRef]
  31. Wang, T.; Lin, B. China’s natural gas consumption and subsidies-From a sector perspective. Energy Policy 2014, 65, 541–551. [Google Scholar] [CrossRef]
  32. Hu, W.; Ho, M.S.; Cao, J. Energy consumption of urban households in China. China Econ. Rev. 2019, 58, 101343. [Google Scholar] [CrossRef]
  33. Yu, Y.; Zheng, X.; Han, Y. On the demand for natural gas in urban China. Energy Policy 2014, 70, 57–63. [Google Scholar] [CrossRef]
  34. Solheim, M.C.W.; Tveteras, R. Benefitting from co-location? Evidence from the upstream oil and gas industry. Extract. Ind. Soc. 2017, 4, 904–914. [Google Scholar] [CrossRef]
  35. Meier, H.; Rehdanz, K. Determinants of residential space heating expenditures in Great Britain. Energy Econ. 2010, 32, 949–959. [Google Scholar] [CrossRef] [Green Version]
  36. Cao, J.; Ho, M.S.; Liang, H. Household energy demand in Urban China: Accounting for regional prices and rapid income change. Energy J. 2016, 37, 87–110. [Google Scholar] [CrossRef]
Figure 1. Distribution of the heating gas consumption and subsidies.
Sustainability 13 00169 g001
Table 1. Distribution of the annual heating consumption.
StatisticsAll SamplesValid Samples
(Above 200 m3 of Heating)
Mean value684.85750.99
Minimum value2.30202.00
Maximum value2485.802485.80
10th Percentile198.00344.57
25th Percentile418.70490.00
50th Percentile635.00679.00
75th Percentile889.60929.00
90th Percentile1196.401222.12
Number of users with consumption above 1200126.00126.76
Proportion of users with consumption above 120010.47%11.65%
Number12981166
Table 2. Cluster analysis outcome.
CategoryAverage Annual Gas Consumption (m3)Average Payment Amount (CNY)ClassificationHouseholdsProportion
1403246Low-income households36131%
2928480Middle-income households70060%
31971504High-income households1059%
Table 3. Classification of household gas use behavior.
CategoryConsumption Range (m3)ClassificationHouseholdsProportion
1Less than200Non heating households13210.17%
2Less than 700Low-income households61547.38%
3700~1200Middle-income households42632.82%
4Above 1200High-income households1259.63%
Table 4. Price elasticity of the gas heating demand.
Classification of IncomeCharacteristicsNumerical Value
Low-income householdsLow gas consumption−0.15
Middle-income householdsMiddle gas consumption−0.31
High-income householdsHigh gas consumption−0.187
Table 5. Estimation results of the subsidy cost under existing policies (taking 100,000 households as an example).
ClassificationHouseholdsExisting Policies
NumberProportionSubsidy Cost (Million CNY)Proportion
Low-income households47,38147.38%18.405735.41%
Middle-income households32,82332.82%23.506845.23%
High-income households96309.63%9.2446017.79%
Non heating households10,16910.17%0.81361.57%
Overall subsidy cost--51.9720100%
Subsidy value--0.8 CNY/m3
Subsidy volume--1200 m3
Table 6. Estimation results of the subsidy cost under new policies (taking 100,000 households as an example).
ClassificationHouseholdsNew Policies
NumberProportionSubsidy Cost (Million CNY)Proportion
Low-income households47,38147.38%28.2546 37.18%
Middle-income households32,82332.82%34.9978 46.05%
High-income households96309.63%11.4888 15.12%
Non heating households10,16910.17%1.2510 1.65%
Overall subsidy cost--75.9922 100%
Subsidy value--1.23 CNY/m3
Subsidy volume--970 m3
Change of subsidy cost--Increase 46.21%
Table 7. Outcome of welfare changes (taking 100,000 households as an example).
ClassificationNumberPortionGas Consumption (m3)Increase in ExpenditureInfluence Index
Low-income households47,38147.38%484−23.24%−0.83
Middle-income households32,82332.82%8978.28%0.44
High-income households96309.63%1546−6.94%−0.43
Non heating households10,16910.17%100−23.12%−0.09
Means--756.75−11.26%−0.23
Publisher’s Note: MDPI stays neutral with regard to jurisdictional claims in published maps and institutional affiliations.

