Abstract
The stability and erosion of natural and man-made slopes is influenced by soil-vegetation-atmosphere interactions and the thermo-hydro-mechanical slope conditions. Understanding such interactions at the source of slope mass-wasting is important to develop land-use planning strategy and to promote environmentally adapted mitigation strategies, such as the use of vegetation to stabilize slopes and control erosion. Monitoring is essential for calibrating and validating models and for better comprehending the physical mechanisms of soil-vegetation-atmosphere interactions. We approached this complex problem by means of an experimental work in a full-scale monitored embankment, which is divided into four instrumented partitions. These partitions are North or South-faced and present a bare and vegetation cover at each orientation. Our main findings show that vegetation enhances rainfall infiltration and decreases runoff, which reduces slope stability and surficial erosion, while plant transpiration induces higher suctions and hence slope stability. Concerning thermal aspects, vegetation reduces the incidence of net solar radiation and consequently heat flux. Thus, daily temperature fluctuations and evaporation decreases. However, the effect of vegetation in the development of dryer soil conditions is more significant than the orientation effect, presenting higher drying rates and states at the North-vegetated slope compared to the South-bare slope.
1. Introduction
Slope mass-wasting induced by erosion and slope failures has become, in the past decade, one of the most important environmental problems in present and forthcoming semi-arid regions [1]. This geomorphological process has many direct and indirect socio-economic consequences such as loss of agricultural and forest lands, reduction of reservoir capacity by sedimentation, damage to infrastructures and hazard related fatalities [2,3,4,5]. All these impacts may be a limitation for the sustainable development of human society. Therefore, the understanding of the processes leading to slope mass-wasting is crucial. One of the main mechanisms pointed out as responsible of the triggering of slope failures is the reduction of soil shear strength due to increase in pore water pressure during heavy rainfall [6,7,8,9,10]. On the other hand, rainfall energy is known to be the principal cause of soil erosion on bare land, when the soil lacks a protective vegetation cover [11]. There is also a strong concern about the effect of the current climate change on slope mass-wasting, since recent studies have shown increases of extreme precipitation events after more intense droughts [11,12,13,14].
The adoption of traditional engineering measures to prevent landslides and slope erosion can be costly, unsustainable and difficult to construct. Alternatively, solutions based on the use of vegetation on the surface of the slope, whether natural or man-made, provide sustainable and environment-friendly measures at a relative low cost [15,16]. Slope erosion is related to the characteristics of surface water flow, the hydrologic surface conditions, soil texture and the slope gradient and cover, among others [17,18]. Vegetation cover reduces rainfall energy by protecting the soil surface from rainfall drops and intercepting runoff, which decreases soil erosion [19]. In addition, plant roots can reinforce the soil due to root tensile strength, which increases the soil shear strength and consequently slope stability [20,21,22]. Adequate design of such solutions requires accounting for multiple soil-vegetation-atmosphere interactions [23,24,25,26,27], such as rainfall canopy interception, protection from both raindrop impact and solar radiation, changes in infiltration/runoff mechanisms, evapotranspiration, and root soil reinforcement [20,28,29,30,31,32], among others. The balance between solar, atmospheric and heat fluxes at ground surface plays an important role as it controls the evaporation rates [33] and thus the suction in the soil. This effect is patent on bare ground where soil heat inflow can be half of the net solar radiation [34] but is known to be reduced in vegetated ground [35,36]. There are, however, few quantitative experimental evidences of the effect of vegetation on ground temperature. Slope orientation is another factor controlling the net solar radiation entering in the soil.
On the other hand, water uptake by roots is responsible for suction increase at depth while root growth and penetration modify soil permeability. Gain in suction due to root water uptake enhances soil shear strength and consequently slope stability [37,38,39,40,41,42]. Results concerning the effect of plants on soil permeability are more diverging and depend on the type of vegetation, root architecture and ageing. Depending on the conditions, authors report lower [43,44,45] or higher [46,47,48,49,50,51] water infiltration in vegetated soils.
Only a few studies are available on full-scale experiments that monitor the soil-vegetation-atmosphere interactions in a comprehensive way over a long time period (e.g., [52,53,54]). Therefore, with the perspective to provide quantitative data on the relative effect of vegetation and atmosphere conditions, this work presents results from a large-scale experiment purposely built to monitor thermo-hydraulic variables over a long period of time and exposed to site climatic actions.
2. Methods
2.1. Site, Embankment and Monitoring Description
The experimental embankment was built at the end of 2016 at the site of Parc UPC Agròpolis (41°17′18″ N 2°02′35″ E), located 20 km southwest from Barcelona, Spain.
The embankment is 18 m long, 12 m wide, 2.5 m high and has 3H:2V slopes (34 degrees); it consists of four instrumented partitions with different slope orientations and covers: North not Vegetated (NnV), North Vegetated (NV), South not Vegetated (SnV) and South Vegetated (SV). In each partition, thermo-hydraulic variables are monitored within a shallow soil layer of 50–70 cm thickness, wrapped into an impervious polyethylene geomembrane to avoid water transfer with other partitions. The soil used is a silty sand with a large part of coarse-grained particles. A complete description of the monitoring set-up, soil properties and laboratory tests can be found in Oorthuis (2018) [55]. Figure 1 shows details of the North-facing partitions.
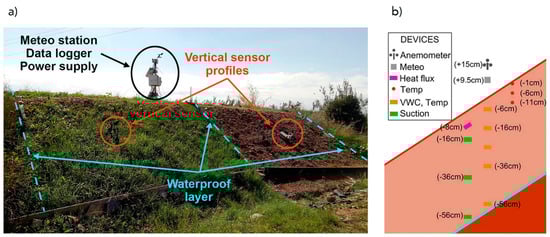
Figure 1.
(a) Photograph of the embankment looking towards the North-faced slope and (b) schematic distribution of North vegetated (NV) sensor profile. Meteo stands for air temperature, relative humidity and barometric pressure, VWC for volumetric water content, Temp for temperature and Suction for matric suction.
The monitoring of the slopes includes 56 sensors installed at four vertical profiles. They record 114 variables at different depths each 5 min: volumetric water content (VWC), matric suction (Sm), pore water pressure, temperature, heat flux, and electrical conductivity. In addition, measurements of air temperature, relative humidity, and barometric pressure are recorded above each partition (at 9.5 cm height). Wind velocity and direction are measured at 15 cm height above the soil. The same variables are monitored on the top of the embankment by a standard meteorological station including a tipping bucket rain gauge of 0.2 mm resolution and a total solar radiation sensor located at 180 cm above soil surface. Finally, sensors to measure net solar radiation have been installed at 55 cm above ground level in the direction parallel to the slope at both North and South bare slopes.
2.2. Characterization of the Vegetation Species
The growth of vegetation at the bare slopes was prevented by periodic application of herbicide. A seed mix 80% Cynodon dactylon and 20% Festuca arundinacea was hand sowed with a seeding density of 34 g/m2 and an average plant spacing of 30 ± 5 mm. Seed sowing density and distance are factors affecting the hydraulic behavior of soils [50,56]. These perennial species were chosen because they have a high drought tolerance, increase soil strength due to their roots and are commonly used in bioengineering for slope revegetation in warm climates [45,57,58,59,60,61]. A mix of the hand sown vegetation species and native plants from the Llobregat river delta coexist and grow under natural conditions with no irrigation.
The specific vegetation cover (SVC) was defined as the relation between vegetated covered area and the total slope area and determined by means of the image processing freeware software ImageJ 1.52a [62]. The evolution of the SVC was assessed by converting color images taken from the vegetated slopes to 8-bit black and white images and by applying a threshold color tool to recognize vegetation from soil.
3. Results and Discussion
3.1. Hydraulic Aspects
Figure 2 presents almost 2.5 years of VWC and Sm time series monitored at three and four different depths, respectively, within the vegetated and bare slopes. For comparison purposes, daily rainfall and time variation of the SVC are also indicated. Discussion of Figure 2 is further supported by Figure 3, which presents a comparison of changes in water contents measured in the different slopes at the same depth and for the same event, distinguishing between rainfall infiltration events (Figure 3a,b) and drying periods (Figure 3c–e). For drying periods (time windows between rainfall events), the decrease in water content is divided by the drying period duration in order to provide an averaged drying rate. For wetting or infiltration events, the increment in water content is assessed by the difference between the initial VWC prior to the rainfall event, and the maximum VWC observed during or after the rainfall event. The interval of analysis considered in Figure 3 lasts over the period of full vegetation cover (SVC = 1) and only events causing perceptible variations in VWC, at least at the most surficial sensor, have been reported.
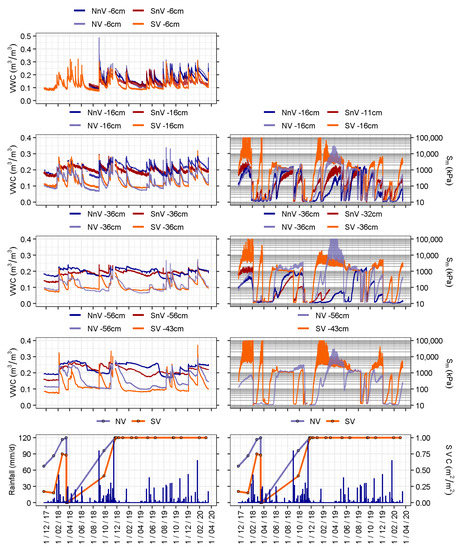
Figure 2.
Time series of hydraulic variables at all embankment slopes. Left column; volumetric water content (VWC) at several depths. Right column; suction (Sm) at different depths. Last row of each column: daily rainfall and Specific Vegetation Cover (SVC) at North and South vegetated slopes. Labels NV, NnV, SV and SnV indicate: North vegetated, North non-vegetated, South vegetated and South non-vegetated slopes, respectively.
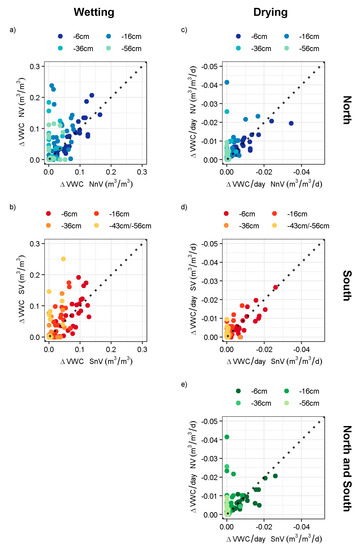
Figure 3.
Comparison between changes of water contents (ΔVWC) at the same depth and for the same event in the four embankment slopes: (a) and (b) ΔVWC during infiltration in the North and South slopes; (c) and (d) ΔVWC (divided by drying period duration) during drying in the North and South slopes; (e) ΔVWC (divided by drying period duration) in the North vegetated and South non-vegetated slopes. Note: vegetated data correspond to the period when slopes were fully covered by vegetation (SVC = 1, from December 2018 to March 2020).
From a general point of view, VWCs exhibit lower values in the vegetated than in the non-vegetated slopes, independently of the orientation. They also experiment higher and quicker increments during rainfall events. This applies to all sensors, with the exception of the shallowest one (−6 cm depth), where all VWC series present similar variations over the whole period (see comment below). These results highlight, on the one hand, higher infiltration rates at the vegetated slopes and, thus, lower runoff. On the other hand, they point out that, whatever the slope orientation, drying is higher in the vegetated than in the non-vegetated slopes for depths below 6 cm, evidencing the in-depth effect of evapotranspiration due to root penetration pointed out by Guswa (2010) [63]. The latter result is also portrayed in Figure 3c,d where data at depths greater than 6cm are located above the line of equal changes of VWC in vegetated and non-vegetated slopes.
Analysis of water content variation is further supported by the monitoring of Sm (negative water potential), which is the driving variable for water flow within the soil and is related to VWC by the soil-water retention curve. Sm ranges between 10 kPa and 1 MPa in the non-vegetated slopes and between 10 kPa and 100 MPa in the vegetated ones. 10 kPa is the air entry potential of the largest pores in the ceramic discs of the sensor and corresponds to the lower limit of sensor measurement range, it can be reasonably interpreted as indicating soil quasi-saturation. In the upper range, measurements present large oscillations, particularly for values higher than 3 MPa. This is a consequence of the moisture characteristic curve of sensor porous ceramic, characterized by large variations of matric suction under small changes in water content for suctions higher than 3 MPa [64]. In any case, suction measurements exhibit higher values and variations in the vegetated than in the non-vegetated slopes, which corroborates the measurements of water content and consistently support the in-depth effect of plants transpiration.
Regarding infiltration, both suction and water content measurements present faster recovery after rainfall events in the vegetated slope, whatever the slope orientation is. VWC and Sm records show that the instrumented soil layer gets saturated at all depths during the most intense rainfalls, while water only percolates into the shallowest layer during the low intensity ones. Comparison of time series monitored at sensors located along the same vertical profile indicates moreover an attenuation of VWC changes and suction drops with depth, which is consistent with the process of water transport in the layer.
These results can be favorably contrasted with other works on vegetation effect, which highlight the importance of root content and morphology. Since the shallow layer is quickly dried to low water content during periods without rainfall, plants are forced to develop roots at higher depths [63,65]. As root growth generates in-depth fissures and preferential paths, the hydraulic conductivity is enhanced in the corresponding layer [49,63,65,66,67], which causes a faster hydraulic response [67]. The latter is clearly illustrated in Figure 3a,b where the points corresponding to depths greater than 6 cm are located above the line of equal changes of water contents in vegetated and non-vegetated slopes.
A striking result concerns the similarity existing between VWC measurements at 6cm depth, whatever the slope is vegetated or not (see Figure 2 and Figure 3a,b). Suction has not been measured at this depth, but, since water content is related to suction by the retention curve of the soil, it is also expected that suction values, and thus hydraulic gradients between soil surface and 6 cm depth, are similar in the two types of slope covers. This reasoning supports the existence of higher soil permeability in the vegetated slopes. In fact, the higher infiltration evidenced by the quicker saturation of the vegetated layer during rainfall cannot be explained by an increase of hydraulic gradients at slope surface. This is consistent with the existence of preferential water paths through macropores created by root growth mentioned before.
A cross-comparison between vegetation and orientation effect is finally provided by Figure 3e. It depicts the correlation between changes in water content in the North vegetated and the South non-vegetated slopes. Data are mostly above the bisecting line, indicating that drying is higher in the North slope despite of its orientation. This result states the prominent effect of vegetation transpiration on slope orientation.
In conclusion, the study quantitatively confirms that vegetation globally increases the amount of water transfer between the soil and the atmosphere, regardless of the slope orientation and the period of the year. Insights provided by measurements of water content and suction variations at different depths allow moreover to forward mechanisms for the increase in water transfer: evapotranspiration in periods of drying, and enhanced permeability by in-depth root penetration in periods of infiltration. It is worth noting that the study covers a wide range of solar radiation values, as data were collected during different seasons.
3.2. Thermal Aspects
Five minute period time series of soil temperatures monitored at the SnV, SV, NnV and NV slopes are shown in Figure 4 (December 2017–April 2020), together with the maximum and minimum daily temperature measured at 9.5 cm above the surface. SVC evolution is also plotted for the vegetated slopes (Figure 4b,d). Figure 4e,f show smoothed time series at the shallower (−1 cm) and deeper (−43/56 cm) sensors in order to compare daily variations. They have been obtained using the Locally Estimated Scatterplot Smoothing (LOESS) [68] with smoothing parameter equal to 0.3.
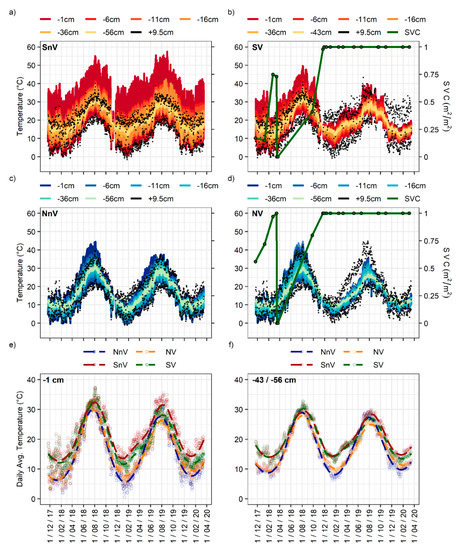
Figure 4.
Time series of temperature at all slopes partitions: (a) South non-vegetated (SnV); (b) South vegetated (SV); (c) North non-vegetated (NnV); (d) North vegetated (SV); (e,f) daily average temperature at depth 1 cm and 43/56 cm, respectively. In figures (a–d), minimum and maximum daily air temperatures measured at 9.5 cm above soil surface are plotted by black dots. Time series of daily average temperatures plotted in figures (e,f) have been obtained by LOESS local regression with smoothing parameter a = 0.3.
Curves evidence a clear superimposition of daily and seasonal variation of temperature at almost all depths. They highlight a decrease with depth of the amplitude of temperature variations. Daily variations reduce and vanish at −50 cm while seasonal variations globally decrease (Figure 4e,f). This is consistent with theoretical results on heat diffusion into a medium with periodic heat input prescribed at its upper boundary.
Another general aspect concerns the respective effect of orientation and vegetation. As shown in Figure 4e,f, highest mean daily temperatures have been measured in the SnV slope, then in the SV, NnV and NV slopes. Maximum daily average temperature at −1 cm is 15.3 °C and 6.9 °C higher in SnV and SV partitions than in NnV and NV respectively. Minimum daily temperature is only 1.3 °C higher at SnV slope and 1.5 °C higher at SV slopes, compared to the North-facing slopes. Similar conclusion about the effect of vegetation and slope orientation can be drawn in depth, but differences are less pronounced. It also applies to temperature daily variations shown in Figure 4a–d.
It is interesting to note that the highest differences between South and North slopes occurs in winter, which evidences the effect of the incidence of solar radiation on slope temperature. Heat input into the ground is due to the component of solar radiation normal to the surface. Due to the nonlinearity of the projection, the decrease of solar incidence angle in autumn and winter results in a higher relative drop of its normal component on surface experiencing low incidence angle (North). In fact, in the present experiment, the normal component totally cancels in the North slopes from November to March and heat inflow by radiation is due only to atmosphere diffraction. The variations of temperature measured in the North slopes during the winter period evidence the importance to account for the latter component in the total heat exchange balance.
Curves presented in Figure 4b,d evidence the clear effect of vegetation on ground temperature: while temperatures range between 0 and 55 °C in SnV and SV slope before vegetation growth, their variations drop between 4 and 40 °C in SV slope with SVC = 1. For the North slopes, maximum temperatures decrease from 45 °C in the non-vegetated partitions to 35 °C in the vegetated one, while minimum temperatures increase from 0 to 3 °C. Maximum daily temperatures at 1 cm depth are higher than air temperatures in non-vegetated partitions, while close to or less than them in the vegetated ones. This indicates a loss of heat input by radiation in the vegetated slopes because of cover protection effect. On the other hand, minimum daily temperatures in vegetated slopes are above or close to air temperature, indicating that vegetation also limits outflow of heat during periods of inversion of the air-soil thermal gradients (mainly during the night). This fact highlights the additional effect of vegetation to create an insulating thermal layer made of bio matter and air. Finally, Figure 4e,f evidence the low effect of vegetation on temperature variations at the seasonal scale.
Figure 5 illustrates the previous conclusions by contrasting the increments of maximum, minimum and daily average temperature in the different partitions. Maximum, minimum and average temperatures are higher in the South than in the North slopes and decrease with depth (Figure 5a,b). Maximum temperatures are the most sensitive to slope orientation. Since it limits solar radiation, the presence of vegetation has a significant effect on temperatures and lowers the effect of orientation. The presence of vegetation has an effect on both maximum and minimum temperatures, but does not modify average daily temperatures (Figure 5c,d). According to the figures, minimum temperatures are higher in the vegetated slopes than in the bare slopes, while maximum temperatures are lower.
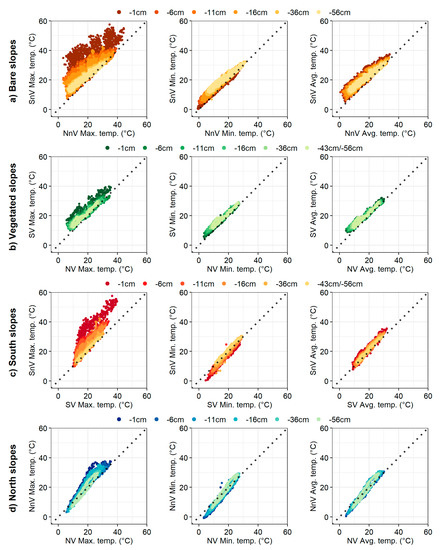
Figure 5.
Daily maximum, minimum and average temperatures comparing orientations and slope cover. Comparison of bare (a) and vegetated (b) slope cover, and South (c) and North (d) slope orientations. Note: vegetated data correspond to the period when vegetation was fully-covering the vegetated slopes, with SVC = 1 (December 2018–March 2020).
Figure 6 provides an insight into daily heat flux (Figure 6a) and temperature variations (Figure 6b) during a five days period with and without rainfall. Solar radiation is measured at 55 cm above the surface and heat flux at 8 cm depth in the slope. Temperatures are measured above and below the heat flux sensor, at 1 and 11 cm depth. During the selected period, SVC at SV and NV slopes was 0.75 and 0.90, respectively. By convention, heat flux is considered positive when entering in the soil.
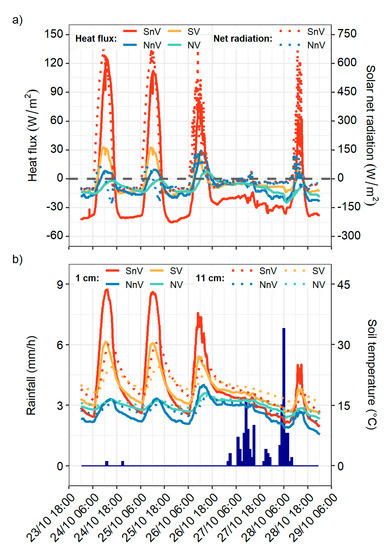
Figure 6.
Time series of solar net radiation, heat flux, soil temperature and hourly rainfall during a 5 days period in October 2018. (a) Heat flux and net solar radiation at 8 cm depth and 55 cm above soil surface, respectively. (b) Temperature at 1 cm and 11 cm depth. Hourly rainfall is also indicated. Time is given in UTC.
Daily variation of heat flux is consistent with solar radiation: heat inflows into the soil during the day with a maximum at 12:00 UTC and outflows during the night. In the North slopes, a slight delay is observed between the maxima of heat flux and solar radiation. Soil heat flux at the bare slopes represents around 20% of the incoming solar net radiation. Vegetation has a strong effect as it reduces this value by 75% at the South-facing slope. The ratio is less important for the North slopes because of lower incoming solar radiation. As shown in Figure 6b, amplitudes of temperatures consequently decrease in the vegetated slopes (by 15 °C in the South and less than 5 °C in the North slopes).
Figure 6 finally shows the effect of rainfall on soil-atmosphere heat exchange. Net solar radiation decreases almost to 0 W/m2 during the rain, which prevents soil temperature increase at soil surface and enhance outflow of heat from the soil to the atmosphere.
4. Conclusions
The paper describes results of a large-scale experiment that provides quantitative insights into the thermo-hydraulic response of slopes with two different orientations (North and South) and two vegetation covers (bare and vegetated). In addition to the hydraulic variables measured in other studies, this research combines thermal data such as soil heat flux and soil temperature at different depths, and atmospheric variables like solar radiation, air temperature and rainfall. Experiments measuring such a wide range of variables and combining soil-vegetation-atmosphere interactions over a long time-period are scarce.
For the conditions considered in the experiment, vegetation has a strong effect on all thermo-hydraulic variables: it increases suction by in-depth transpiration, enhances infiltration (and thus lowers run-off) and reduces soil-atmosphere heat exchange. On the other hand, orientation plays a fundamental role in bare slopes as a result of solar angle incidence: temperatures, and thus evaporation, are higher in the South- than in North-facing slopes. The orientation effect is however significantly diminished, when vegetation is present. Vegetation reduces by 75% the incoming heat flux in South-facing slopes, but the resulting reduction of evaporation is largely compensated by transpiration. Therefore, our results suggest that vegetation effect is more important than orientation and maintains slopes in drier states in absence of rainfall, which enhance soil strength and slope stability.
The effect of vegetation on slope-mass wasting during rainfall events is more controversial. Results from the experiment indicate a quicker saturation in the vegetated layers, which is in principle more prejudicial for slope stability and mass-wasting in general. Nevertheless, this effect should be contrasted with others not studied in this work and often cited in the literature: increase of soil strength by roots, protection against raindrop impact, sediments trap or decrease of runoff. Other studies have shown that vegetation can significantly reduce slope runoff and surficial erosion. Thus, the use of vegetation to prevent soil losses, a correct maintenance of vegetated slopes or reforestation, especially in areas with sparse or no vegetation, are highly recommended.
Due to the high number of involved variables, more research is needed to better understand all these slope-vegetation-atmosphere interactions and to promote vegetation in sustainable engineering designs. Therefore, our next research steps will focus on the determination of runoff and slope erosion rates comparing both hydrological and thermal slope response under different orientations and slope covers (bare and vegetated).
Author Contributions
Conceptualization, R.O., J.V., M.H., A.L., J.M., C.P.-P. and A.F.; Data curation, R.O.; Funding acquisition, J.V. and M.H.; Supervision, J.V. and M.H.; Visualization, R.O.; Writing—original draft, R.O.; Writing—review & editing, J.V., M.H., A.L., J.M., C.P.-P. and A.F. All authors have read and agreed to the published version of the manuscript.
Funding
This research was funded by the national researchs projects called “Slope mass-wasting under climate change (SMuCPhy, project reference number BIA 2015-67500-R)” and “Multiscale analysis of soil erosion in steep slopes (EROSLOP, project reference number PID2019-104266RB-I00) granted by the Ministry of Economy and Competitiveness of Spain and co-funded by AEI/FEDER, UE.
Institutional Review Board Statement
Not applicable.
Informed Consent Statement
Not applicable.
Data Availability Statement
The data used for the analyses in this study will be available on the research project website (https://smucphy.upc.edu/en).
Conflicts of Interest
The authors declare no conflict of interest.
References
- Boardman, J.; Poesen, J. Soil Erosion in Europe; Boardman, J., Poesen, J., Eds.; John Wiley & Sons, Ltd.: Chichester, UK, 2006; ISBN 9780470859209. [Google Scholar]
- Spiker, E.C.; Gori, P.L. National Landslide Hazards Mitigation Strategy: A Framework for Loss Reduction; U.S. Geological Survey: Reston, VA, USA, 2003. [Google Scholar]
- Guzzetti, F.; Cardinali, M.; Reichenbach, P.; Cipolla, F.; Sebastiani, C.; Galli, M.; Salvati, P. Landslides triggered by the 23 November 2000 rainfall event in the Imperia Province, Western Liguria, Italy. Eng. Geol. 2004, 73, 229–245. [Google Scholar] [CrossRef]
- Petley, D. Global patterns of loss of life from landslides. Geology 2012, 40, 927–930. [Google Scholar] [CrossRef]
- Sidle, R.C.; Bogaard, T.A. Dynamic earth system and ecological controls of rainfall-initiated landslides. Earth-Sci. Rev. 2016, 159, 275–291. [Google Scholar] [CrossRef]
- Fredlund, D.G.; Rahardjo, H. Soil Mechanics for Unsaturated Soils; John Wiley & Sons, Inc.: Hoboken, NJ, USA, 1993; ISBN 9780470172759.
- Rahardjo, H.; Lim, T.T.; Chang, M.F.; Fredlund, D.G. Shear-strength characteristics of a residual soil. Can. Geotech. J. 1995, 32, 60–77. [Google Scholar] [CrossRef]
- Vanapalli, S.K.; Fredlund, D.G.; Pufahl, D.E.; Clifton, A.W. Model for the prediction of shear strength with respect to soil suction. Can. Geotech. J. 1996, 33, 379–392. [Google Scholar] [CrossRef]
- Fourie, A.B.; Rowe, D.; Blight, G.E. The effect of infiltration on the stability of the slopes of a dry ash dump. Géotechnique 1999, 49, 1–13. [Google Scholar] [CrossRef]
- Highland, L.M.; Bobrowsky, P. The Landslide Handbook—A Guide to Understanding Landslides; U.S. Geological Survey: Reston, VA, USA, 2008; 129p, ISBN 978-141132226-4.
- Durán Zuazo, V.H.; Rodríguez Pleguezuelo, C.R. Soil-erosion and runoff prevention by plant covers. A review. Agron. Sustain. Dev. 2008, 28, 65–86. [Google Scholar] [CrossRef]
- Nearing, M.A.; Jetten, V.; Baffaut, C.; Cerdan, O.; Couturier, A.; Hernandez, M.; Le Bissonnais, Y.; Nichols, M.H.; Nunes, J.P.; Renschler, C.S.; et al. Modeling response of soil erosion and runoff to changes in precipitation and cover. Catena 2005, 61, 131–154. [Google Scholar] [CrossRef]
- IPCC. Climate Change 2013: The Physical Science Basis. Contribution of Working Group I to the Fifth Assessment Report of the Intergovernmental Panel on Climate Change; Cambridge University Press: Cambridge, UK; New York, NY, USA, 2013; ISBN 9781107661820. [Google Scholar]
- Panagos, P.; Meusburger, K.; Ballabio, C.; Borrelli, P.; Alewell, C. Soil erodibility in Europe: A high-resolution dataset based on LUCAS. Sci. Total Environ. 2014, 479–480, 189–200. [Google Scholar] [CrossRef]
- Donald, H.; Gray, R.B.S. Biotechnical and Soil Bioengineering Slope Stabilization: A Practical Guide for Erosion Control; John Wiley & Sons: New York, NY, USA, 1996; ISBN 978-0-471-04978-4. [Google Scholar]
- Jotisankasa, A.; Mairaing, W.; Tansamrit, S. Infiltration and stability of soil slope with vetiver grass subjected to rainfall from numerical modeling. In Unsaturated Soils: Research & Applications: Proceedings of the Sixth International Conference on Unsaturated Soils, UNSAT 2014, Sydney, Australia, 2–4 July 2014; CRC Press: Boca Raton, FL, USA, 2014; pp. 1241–1247. ISBN 9781138001503. [Google Scholar]
- Igwe, P.U.; Ezeukwu, J.C.; Edoka, N.E.; Ejie, O.C.; Ifi, G.I. A Review of Vegetation Cover as a Natural Factor to Soil Erosion. Int. J. Rural Dev. Environ. Health Res. 2017, 1, 21–28. [Google Scholar] [CrossRef]
- Zhao, Q.; Zhang, Y.; Xu, S.; Ji, X.; Wang, S.; Ding, S. Relationships between Riparian Vegetation Pattern and the Hydraulic Characteristics of Upslope Runoff. Sustainability 2019, 11, 2966. [Google Scholar] [CrossRef]
- Bochet, E.; Poesen, J.; Rubio, J.L. Runoff and soil loss under individual plants of a semi-arid Mediterranean shrubland: Influence of plant morphology and rainfall intensity. Earth Surf. Process. Landf. 2006, 31, 536–549. [Google Scholar] [CrossRef]
- Ali, F.H.; Osman, N. Shear Strength of a Soil Containing Vegetation Roots. Soils Found. 2008, 48, 587–596. [Google Scholar] [CrossRef]
- Chok, Y.H.; Jaksa, M.B.; Kaggwa, W.S.; Griffiths, D.V. Assessing the influence of root reinforcement on slope stability by finite elements. Int. J. Geo-Eng. 2015, 6, 12. [Google Scholar] [CrossRef]
- Maffra, C.; Sousa, R.; Sutili, F.; Pinheiro, R. The Effect of Roots on the Shear Strength of Texturally Distinct Soils. Floresta Ambient. 2019, 26. [Google Scholar] [CrossRef]
- Greenway, D.R. Vegetation and Slope Stability. In Slope Stability: Geotechnical Engineering and Geomorphology; Anderson, M.G., Richards, K.S., Eds.; John Wiley & Sons: Chichester, UK, 1987; pp. 187–230. [Google Scholar]
- Gens, A. Soil–environment interactions in geotechnical engineering. Géotechnique 2010, 60, 3–74. [Google Scholar] [CrossRef]
- Rahardjo, H.; Satyanaga, A.; Leong, E.C. Unsaturated soil mechanics for slope stabilization. Geotech. Eng. J. SEAGS AGSSEA 2012, 43, 48–58. [Google Scholar]
- Elia, G.; Cotecchia, F.; Pedone, G.; Vaunat, J.; Vardon, P.J.; Pereira, C.; Springman, S.M.; Rouainia, M.; Van Esch, J.; Koda, E.; et al. Numerical modelling of slope-vegetation-atmosphere interaction: An overview. Q. J. Eng. Geol. Hydrogeol. 2017, 50, 249–270. [Google Scholar] [CrossRef]
- Ni, J.J.; Leung, A.K.; Ng, C.W.W.; Shao, W. Modelling hydro-mechanical reinforcements of plants to slope stability. Comput. Geotech. 2018, 95, 99–109. [Google Scholar] [CrossRef]
- Coppin, N.J.; Richards, I.G. Use of Vegetation in Civil Engineering; Coppin, N.J., Richards, I.G., Eds.; Construction Industry Research and Information Association (CIRIA): London, UK, 1990; ISBN 978-086017-711-1. [Google Scholar]
- Simon, A.; Collison, A.J.C. Quantifying the mechanical and hydrologic effects of riparian vegetation on streambank stability. Earth Surf. Process. Landf. 2002, 27, 527–546. [Google Scholar] [CrossRef]
- Preti, F.; Giadrossich, F. Root reinforcement and slope bioengineering stabilization by Spanish Broom (Spartium junceum L.). Hydrol. Earth Syst. Sci. 2009, 13, 1713–1726. [Google Scholar] [CrossRef]
- Eab, K.H.; Likitlersuang, S.; Takahashi, A. Laboratory and modelling investigation of root-reinforced system for slope stabilisation. Soils Found. 2015, 55, 1270–1281. [Google Scholar] [CrossRef]
- Capilleri, P.P.; Motta, E.; Raciti, E. Experimental Study on Native Plant Root Tensile Strength for Slope Stabilization. Procedia Eng. 2016, 158, 116–121. [Google Scholar] [CrossRef]
- Sauer, T.J.; Horton, R. Soil Heat Flux. In Micrometeorology in Agricultural Systems; Agronomy Monograph no. 47; American Society of Agronomy: Madison, WI, USA, 2005; pp. 131–154. [Google Scholar] [CrossRef]
- Idso, S.B.; Aase, J.K.; Jackson, R.D. Net radiation—Soil heat flux relations as influenced by soil water content variations. Bound.-Layer Meteorol. 1975, 9, 113–122. [Google Scholar] [CrossRef]
- Oliver, S.A.; Oliver, H.R.; Wallace, J.S.; Roberts, A.M. Soil heat flux and temperature variation with vegetation, soil type and climate. Agric. For. Meteorol. 1987, 39, 257–269. [Google Scholar] [CrossRef]
- Lozano-Parra, J.; Pulido, M.; Lozano-Fondón, C.; Schnabel, S. How do Soil Moisture and Vegetation Covers Influence Soil Temperature in Drylands of Mediterranean Regions? Water 2018, 10, 1747. [Google Scholar] [CrossRef]
- Ng, C.W.W.; Woon, K.X.; Leung, A.K.; Chu, L.M. Experimental investigation of induced suction distribution in a grass-covered soil. Ecol. Eng. 2013, 52, 219–223. [Google Scholar] [CrossRef]
- Ng, C.W.W.; Garg, A.; Leung, A.K.; Hau, B.C.H. Relationships between leaf and root area indices and soil suction induced during drying-wetting cycles. Ecol. Eng. 2016, 91, 113–118. [Google Scholar] [CrossRef]
- Garg, A.; Leung, A.K.; Ng, C.W.W. Comparisons of soil suction induced by evapotranspiration and transpiration of S. heptaphylla. Can. Geotech. J. 2015, 52, 2149–2155. [Google Scholar] [CrossRef]
- Zhu, H.; Zhang, L.M. Evaluating suction profile in a vegetated slope considering uncertainty in transpiration. Comput. Geotech. 2015, 63, 112–120. [Google Scholar] [CrossRef]
- Gonzalez-Ollauri, A.; Mickovski, S.B. Hydrological effect of vegetation against rainfall-induced landslides. J. Hydrol. 2017, 549, 374–387. [Google Scholar] [CrossRef]
- Yildiz, A.; Graf, F.; Rickli, C.; Springman, S.M. Assessment of plant-induced suction and its effects on the shear strength of rooted soils. Proc. Inst. Civ. Eng.-Geotech. Eng. 2019, 172, 507–519. [Google Scholar] [CrossRef]
- Rahardjo, H.; Satyanaga, A.; Leong, E.C.; Santoso, V.A.; Ng, Y.S. Performance of an instrumented slope covered with shrubs and deep-rooted grass. Soils Found. 2014, 54, 417–425. [Google Scholar] [CrossRef]
- Leung, A.K.; Garg, A.; Coo, J.L.; Ng, C.W.W.; Hau, B.C.H. Effects of the roots of Cynodon dactylon and Schefflera heptaphylla on water infiltration rate and soil hydraulic conductivity. Hydrol. Process. 2015, 29, 3342–3354. [Google Scholar] [CrossRef]
- Garg, A.; Coo, J.L.; Ng, C.W.W. Field study on influence of root characteristics on soil suction distribution in slopes vegetated with Cynodon dactylon and Schefflera heptaphylla. Earth Surf. Process. Landf. 2015, 40, 1631–1643. [Google Scholar] [CrossRef]
- Le Bissonnais, Y.; Lecomte, V.; Cerdan, O. Grass strip effects on runoff and soil loss. Agronomie 2004, 24, 129–136. [Google Scholar] [CrossRef]
- Joshi, V.U.; Tambe, D.T. Estimation of infiltration rate, run-off and sediment yield under simulated rainfall experiments in upper Pravara Basin, India: Effect of slope angle and grass-cover. J. Earth Syst. Sci. 2010, 119, 763–773. [Google Scholar] [CrossRef]
- Huang, J.; Wu, P.; Zhao, X. Effects of rainfall intensity, underlying surface and slope gradient on soil infiltration under simulated rainfall experiments. CATENA 2013, 104, 93–102. [Google Scholar] [CrossRef]
- Vergani, C.; Graf, F. Soil permeability, aggregate stability and root growth: A pot experiment from a soil bioengineering perspective. Ecohydrology 2016, 9, 830–842. [Google Scholar] [CrossRef]
- Ni, J.J.; Leung, A.K.; Ng, C.W.W.; So, P.S. Investigation of plant growth and transpiration-induced matric suction under mixed grass–tree conditions. Can. Geotech. J. 2017, 54, 561–573. [Google Scholar] [CrossRef]
- Fraccica, A.; Romero, E.; Fourcaud, T. Multi-scale effects on the hydraulic behaviour of a root-permeated and compacted soil. E3S Web Conf. 2019, 92. [Google Scholar] [CrossRef]
- Cui, Y.J.; Gao, Y.B.; Ferber, V. Simulating the water content and temperature changes in an experimental embankment using meteorological data. Eng. Geol. 2010, 114, 456–471. [Google Scholar] [CrossRef]
- Yoshioka, M.; Takakura, S.; Ishizawa, T.; Sakai, N. Temporal changes of soil temperature with soil water content in an embankment slope during controlled artificial rainfall experiments. J. Appl. Geophys. 2015, 114, 134–145. [Google Scholar] [CrossRef]
- Bicalho, K.V.; Boussafir, Y.; Cui, Y.J. Performance of an instrumented embankment constructed with lime-treated silty clay during four-years in the Northeast of France. Transp. Geotech. 2018, 1–17. [Google Scholar] [CrossRef]
- Oorthuis, R.; Hürlimann, M.; Fraccica, A.; Lloret, A.; Moya, J.; Puig-Polo, C.; Vaunat, J. Monitoring of a full-scale embankment experiment regarding soil-vegetation-atmosphere interactions. Water (Switzerland) 2018, 10, 688. [Google Scholar] [CrossRef]
- Ng, C.W.W.; Ni, J.J.; Leung, A.K. Effects of plant growth and spacing on soil hydrological changes: A field study. Géotechnique 2019, 1–15. [Google Scholar] [CrossRef]
- Bacon, C.W. Abiotic stress tolerances (moisture, nutrients) and photosynthesis in endophyte-infected tall fescue. Agric. Ecosyst. Environ. 1993, 44, 123–141. [Google Scholar] [CrossRef]
- Elmi, A.A.; West, C.P. Endophyte infection effects on stomatal conductance, osmotic adjustment and drought recovery of tall fescue. New Phytol. 1995, 131, 61–67. [Google Scholar] [CrossRef]
- Wilman, D.; Gao, Y.; Leitch, M.H. Some differences between eight grasses within the Lolium-Festuca complex when grown in conditions of severe water shortage. Grass Forage Sci. 1998, 53, 57–65. [Google Scholar] [CrossRef]
- Zhang, M.; Chen, F.Q.; Zhang, J.X. The Temporal Dynamics of Cynodon Dactylon Soil-Root System in Soil Conservation and Slope Reinforcement. Adv. Mater. Res. 2013, 838–841, 675–679. [Google Scholar] [CrossRef]
- Chen, F.; Zhang, J.; Zhang, M.; Wang, J. Effect of Cynodon dactylon community on the conservation and reinforcement of riparian shallow soil in the Three Gorges Reservoir area. Ecol. Process. 2015, 4, 3. [Google Scholar] [CrossRef]
- Image J Web Page. Available online: https://imagej.nih.gov/ij/ (accessed on 16 December 2020).
- Guswa, A.J. Effect of plant uptake strategy on the water-optimal root depth. Water Resour. Res. 2010, 46, 1–5. [Google Scholar] [CrossRef]
- MPS-2 & MPS-6 Dielectric Water Potential Sensors Operator’s Manual (Version July 10, 2017). Available online: http://library.metergroup.com/Retired%20and%20Discontinued/Manuals/13755_MPS-2and6_Web.pdf (accessed on 16 December 2020).
- Schenk, H.J.; Jackson, R.B. The global biogeography of roots. Ecol. Monogr. 2002, 72, 311–328. [Google Scholar] [CrossRef]
- Gray, D.; Norum, D. The Effect of Soil Moisture on Infiltration As Related To Runoff and Recharge. In Proceedings of Hydrology Symposium; National Research Council of Canada Associate Committee on Geodesy and Geophysics Subcommittee on Hydrology: Otawa, ON, Canada, 1967; Volume 6, pp. 133–153. [Google Scholar]
- Song, L.; Li, J.H.; Zhou, T.; Fredlund, D.G. Experimental study on unsaturated hydraulic properties of vegetated soil. Ecol. Eng. 2017, 103, 207–216. [Google Scholar] [CrossRef]
- Cleveland, W.S. Robust Locally Weighted Regression and Smoothing Scatterplots. J. Am. Stat. Assoc. 1979, 74, 829–836. [Google Scholar] [CrossRef]
Publisher’s Note: MDPI stays neutral with regard to jurisdictional claims in published maps and institutional affiliations. |
© 2020 by the authors. Licensee MDPI, Basel, Switzerland. This article is an open access article distributed under the terms and conditions of the Creative Commons Attribution (CC BY) license (http://creativecommons.org/licenses/by/4.0/).