1. Introduction
In 2018 alone, disasters left over 400,000 people, globally, without a house [
1]. Those who were in resource-limited communities were disproportionately affected [
2]. Governments, multilateral organizations, and non-governmental organizations (NGO) respond to these disasters, often with the goal of using the “reconstruction process to improve a community’s physical, social, environmental and economic conditions” [
3] (p. 329) and reducing future disaster risk [
4]. Achieving these goals requires increasing communities’ capacity to “reduce the level of risk or the effects of a disaster” [
5] (p. 16), and may also necessitate building houses that are safer. In resource-limited communities, where housing is often the infrastructure most affected by disasters [
6], an important part of increasing a community’s capacity to reduce disaster risk is enhancing local understanding of characteristics of safe housing, including material choice and design, particularly as they relate to hazards and risk.
Local perceptions of safe housing and of the risks that threaten houses influence the decisions individuals make, such as housing material selection, and how, what, and when they build, expand, and retrofit housing. For instance, in Haiti, before the 2010 earthquake, the prevailing perception was that houses with heavy, reinforced-concrete frames and unreinforced masonry walls were safe because they had performed well in hurricanes [
7,
8]. However, when the earthquake occurred, catastrophic damage to this type of construction left over 1.3 million people homeless [
7]. In other situations, safe housing may be abandoned if it does not align with local perceptions of safety. In Sucuoğlu’s [
9] study in Turkey, households perceived that masonry walls were unsafe, leading them to abandon their apartment buildings even though engineers’ assessments found that the walls and buildings were safe. Furthermore, households will likely live in their houses for many years and make modifications to improve comfort and address their changing needs. In order to understand how households might make these modifications, we must first understand whether they perceive their houses to be safe, and how the materials and designs used by implementing organizations affect these perceptions. These examples exemplify how individual perceptions of housing safety affect what is built, maintained, and occupied over time, which, in turn, either enables or hinders disaster risk reduction.
Given the importance of perceptions of safe housing for risk reduction, we examine perceived risk related to housing safety in defined hazard events. We define housing safety as a state where a house “will not fail under foreseeable demands [for us, the hazard events of interest], leading to loss of life [or] injury” [
10] (p. 313). While previous research has offered anecdotes of what types of houses people perceive to be safe, there is a lack of understanding of the specific housing components, such as roofs and walls, people perceive to be safe or unsafe. To address this research need, we measure perceptions of safety through individuals’ perceptions of the expected level of damage to housing components that are most likely to fail and cause injury or death.
Furthermore, many households globally are exposed to more than one hazard [
11], yet only a few studies, (e.g., [
12]) have sought to understand how risk perceptions vary based on hazard. Given the need for more studies on the perceived risk in multi-hazard environments, we assess how perceptions of housing safety differ depending on hazard event. This need is particularly important given our focus on housing characteristics, which affect performance differently based upon the hazard, and because what is safe in one hazard might not be safe in another.
In addition to understanding perceptions of safety, we need to understand what influences these perceptions in order to identify root causes and reduce future risk. Housing design characteristics, such as material and size, are hypothesized to influence these perceptions [
13]. In addition to these housing design characteristics, we investigate how program, personal, and exposure factors influence safety perceptions. In our context of resource-limited communities, households are often recipients of post-disaster housing assistance, and implementing organizations may provide programs that include household training on safer construction or encourage households to participate in the planning, design, and construction of the new houses [
14]. We hypothesize that characteristics of these programs, such as participation and training, will influence perceptions of safety, but this has not previously been investigated. By understanding what households perceive to be safe or unsafe about their house and how these perceptions are influenced by housing design and post-disaster programming, organizations will be able to create programs that better enable households to construct safe houses. Post-disaster programming that addresses existing perceptions of housing safety is theorized to affect households’ building practices in the long-term. Additionally, past work has found that housing location and exposure [
15] and personal characteristics, such as prior disaster experience [
16] and socio-economic status [
17] influence perceptions of safety.
Thus, in this study, we assess perceptions of safety and investigate how housing design, post-disaster program elements, personal characteristics, and hazard type and exposure influence safety perceptions by addressing the following questions:
Research Question 1:How safe or unsafe do individuals perceive their houses to be in future earthquake and typhoon events?
Research Question 2:How do housing design choices, post-disaster program elements, personal characteristics, and hazard exposure levels, influence these perceptions of safety?
In this paper, we first present the existing literature on perceptions of housing safety, including gaps in resource-limited communities and multi-hazard environments, and discuss factors hypothesized to influence perceptions. Next, we discuss the Philippines, the study’s context and a country prone to more types of hazards than almost any other country, particularly earthquakes and typhoons. We then present our methods to answer the research questions, including the design and administration of a survey questionnaire and the analysis of the data, which included correlation analysis and lasso regression to quantify the relationships between the hypothesized factors and the observed perceptions. We present our results in three phases: (1) A summary of perceptions of housing safety; 2) the influence of individual factors on these perceptions; and 3) the explanatory model that assessed the combined influence of various factors on perceptions. Drawing from the trends in the explanatory model, we discuss why certain factors influence perceptions of housing safety and provide concluding recommendations for organizations working in post-disaster housing.
2. Literature Review
To address the need to understand perceptions of housing safety and what influences these perceptions in resource-limited, multi-hazard environments, we draw from the existing body of literature on perceptions of housing safety and factors that may influence these perceptions.
2.1. Perceptions of Housing Safety
We focus on individuals’ perceptions of what constitutes safe housing, because perceptions of hazards and risk are important predictors of individuals’ intentions, and to a lesser degree, actions taken, to mitigate their disaster risk [
18]. Most importantly, we focus on perceived risk for the outcome of housing safety, to which limited studies have attended. Perceived risk is defined as the interpretation of risk based on an individual’s subjective assessment of both the likelihood of a hazard event occurring and the likelihood of an outcome of interest as a result of the hazard event [
12,
19,
20]. While a handful of studies have generally asked whether respondents perceive their house to be safe, we have not found a study that attempted to understand what components (e.g., roofs and walls) people perceive to be safe and what design characteristics (e.g., housing material and size) influence these perceptions. For instance, work on risk perceptions of housing safety has found that people overestimate the safety of their house [
15] and that geographic areas with higher exposure perceive greater damage to their homes in future hazards [
13]. These studies provide broad insights into perceptions of housing safety, but they do not address the specific housing characteristics that drive these perceptions.
Further, the studies that have been conducted on perceptions of risk and safety have been primarily conducted in developed countries (e.g., [
21] from the USA, [
22] from New Zealand, [
23] from Japan). Few studies on risk perceptions and housing safety have focused on resource-limited communities. However, in resource-limited communities, non- or lightly-engineered houses are common, and the impacts of disasters are amplified up to ten times those of more industrialized countries [
24]. Within resource-limited contexts, the most closely related studies examined housing satisfaction rather than safety. For instance, Snarr and Brown [
13,
25,
26] longitudinally examined housing satisfaction in Honduras following Hurricane Fifi, finding that satisfaction was influenced by material and size, and was based on a comparison of their new house to their previous house. We complement these studies by assessing safety perceptions of individual housing components and design characteristics in earthquake and wind events in the Philippines.
2.2. Factors Influencing Perceptions of Housing Safety
In addition to understanding perceptions of safety, we need to understand what influences these perceptions. This will enable implementing organizations to create programs that address these factors and better enable households to construct and maintain safe houses.
Table 1 presents the factors hypothesized to influence perceived housing safety, including housing characteristics, program, personal, and exposure factors.
2.2.1. Housing Characteristics
What an individual perceives to be safe influences their decisions about construction and modifications [
27], which affects the actual safety of a house. Housing characteristics, such as material and number of stories [
28], have been found to anecdotally influence perceived safety, as does knowledge of poor construction quality [
29]. Thus, we assess perceptions of safety and how housing design characteristics, including material and size, influence perceptions of safety.
2.2.2. Program Factors
Following a disaster in resource-limited communities, it is common for government agencies and local and international NGOs to respond by providing varying forms of housing assistance, including cash, materials, training, and even new houses to selected beneficiaries. This assistance has nascent links to perceptions of housing safety. Previous studies [
14,
30] have shown that participation in planning, design, and construction of new post-disaster housing and training during reconstruction, were important for increased resilience, and we hypothesize that these factors may also be important for perceptions of safety. Additionally, we hypothesize that being relocated from one location to another will impact safety perceptions because Snarr and Brown [
13] found that people tended to prefer their new neighborhoods and houses after being relocated after Hurricane Fifi. Lastly, we expect that whether the post-disaster reconstruction program was implemented by the local government or an NGO will impact perceptions of housing safety [
30].
2.2.3. Personal Factors
In a comprehensive review of numerous studies on the perceived risk to hazards, Wachinger et al. [
16] found that prior experience, along with trust in authorities and experts, most influences perceived risk. Additional individual characteristics, such as gender, education level, and socio-economic status, were also found to influence perceived risk, but to a lesser degree than prior experience [
16]. These factors were included to control for demographic characteristics.
2.2.4. Exposure Factors
Lastly, previous studies of risk perceptions have found that increased exposure to a hazard, based on location, increases perceived risk [
15,
31,
32]. In these studies, exposure was one of the most influential factors affecting perceptions, so we also include this factor to explore location differences.
3. Methods
To assess individuals’ perceived safety of their house in typhoons and earthquakes, we conducted a survey of households living in houses constructed by governments and NGOs following disasters in Leyte and Samar, Philippines and performed statistical analyses to identify how personal, program, and housing design characteristics and hazard exposure influence these perceptions. In this study, a house is safe if it will not fail and cause injury or loss of life [
10] in the defined typhoon and earthquake events.
We chose to administer a survey to capture the perceptions of housing safety for a broad range of households. Surveys are the research tool most capable of understanding the characteristics and perceptions of a large audience and have been used extensively in risk perception literature (e.g., [
15,
17,
41]). We employed statistical analysis to identify trends in respondents’ perceptions of housing safety. Statistical analysis helps us to describe the data, explore relationships amongst our data, and ensure that the relationships we find are meaningful (i.e., significant).
In this section, we motivate the context where we conducted this study, how we designed the survey and what questions were included, how we administered the survey and collected data, and lastly how we coded responses and statistically analyzed the data.
3.1. Context
We conducted this research in ten communities affected by 2013’s Typhoon Yolanda in the Philippines. We selected the Philippines because it is one of the most hazard-prone countries in the world [
42], and as described above, there is a need to understand perceptions of housing safety in regions where multiple hazards occur. We specifically assess perceived housing safety in typhoons and earthquakes because these are two of the most frequent hazard events in the region affected by Typhoon Yolanda. Additionally, the Philippines witnessed massive governmental and international investment in recovery following Yolanda, including a variety of post-disaster housing programs. This variety of programs allow us to assess how perceptions of housing safety are influenced by house design and programming. The selected communities on the islands of Leyte and Samar (see
Figure 1;
Table 2) received various forms of housing assistance and shelter designs following the typhoon and have been affected by recent earthquakes and typhoons, allowing us to assess the impact of housing reconstruction programs on perceptions of housing safety in multiple hazards.
Typhoon Yolanda struck the Central Philippines in November 2013, killing over 6,000 people, affecting over 16 million [
43], and damaging or destroying over 1.1 million homes [
44]. The islands of the Eastern Visayas, Leyte and Samar, were particularly affected. Most houses, particularly wooden houses, on these islands were severely damaged, if not destroyed, during Yolanda. Most common failures include wall collapse and roof cover loss [
45]. The maximum three-second wind gusts experienced during Yolanda were 375 kph [
46], which are considerably greater than the design three-second gusts (310 kph for Eastern Samar and 300 kph for Leyte) specified in the National Structural Code of the Philippines [
47].
The selected communities were also located near the epicenter of the July 6, 2017, magnitude 6.5 earthquake in Ormoc City, Leyte, and are prone to future earthquakes, due to the proximity to the Central Leyte Fault and the Philippine Trench. As there have been few studies on risk perceptions in multi-hazard environments, there is a need to expand the literature and assess perceptions of housing safety in earthquakes, as well as typhoons. In the 2017 earthquake, residents of Tacloban City experienced a shaking intensity of V (out of X) on the PHIVOLCS Earthquake Intensity Scale, and those in Guiuan reported a shaking intensity of IV (out of X) [
48]. At these intensities, most people would have felt shaking, and household items would have been overturned. Two thousand houses were damaged, and 1500 were destroyed during the Leyte earthquake; the most damage was to concrete and masonry houses which experienced column failure and collapse during the earthquake [
48]. The selected communities have also been impacted by multiple recent typhoons, including December 2017’s Tropical Storm Urduja and December 2019’s Typhoon Ursula. Tropical Storm Urduja was of a lesser intensity than Typhoon Yolanda, with maximum wind gusts of only 110 kph some distance north of the selected communities, shown in
Figure 1 [
49]. Typhoon Ursula followed a similar path of Typhoon Yolanda and produced maximum wind gusts of 195 kph [
50]. Urduja damaged 35,000 houses [
49], and Ursula damaged over 428,000 houses [
51]. Recent typhoons have been more traumatic and caused considerably more damage in the studied communities than recent earthquakes.
As we were interested in perceptions of post-disaster housing, we selected communities where organizations had provided beneficiaries with new houses following Typhoon Yolanda. All communities had received a house from an NGO or the government, but the housing designs differed, as did the program provided. Each program provided similar or identical houses to many members of the same community. We selected communities to capture the full range of housing designs built after Yolanda, including one-story, two-story, wood, and concrete houses. The selected programs had varying participation and training requirements; some required sweat equity and involved households early in the reconstruction, while others did not involve households at all. Some houses were built in the same location as the original community; others were relocated. Additionally, one community was given transitional housing—where houses were intended for use for only two to five years, but that are still being used and occupied today (seven years after the typhoon). Although transitional shelters are only intended to be used for a short period of time, they are rarely truly temporary and often become households’ permanent structures of residence [
52,
53]; therefore, it is both important and appropriate to assess households’ perceptions of transitional shelters.
Figure 2 shows five of the housing designs found in the studied communities. Many of the houses had vertical systems (i.e., columns and walls) that were built with either reinforced concrete or masonry; others were made of wood (most commonly coconut lumber), and a small number were constructed with bamboo. A majority of the roof systems were wood trusses; one case had a concrete slab roof; two roofs used steel purlins and no trusses; the bamboo houses had a bamboo roof-support system.
3.2. Survey Design
We investigated respondents’ perceptions of the safety of their house in future typhoons and earthquakes, and the factors that influenced these perceptions, through a household survey. Pilot interviews were conducted in November 2017 to test questions and design the survey questionnaire. During the pilot interviews, we found that asking individuals to assess both facets of risk perception (i.e., the likelihood of a hazard occurring and specific outcomes because of that hazard) was abstract and led participants to provide broad, non-specific responses. Therefore, we focused our survey questions on only one part of perceived risk: the expected outcomes of two defined hazard events. These two events were a typhoon similar to Typhoon Yolanda, and an earthquake similar to the 2017 Leyte earthquake. By including these specific disaster events that the respondents had experienced, we provided them with an event they could recall [
54] (p. 232). Although Typhoon Yolanda was of a much greater intensity than the Leyte earthquake, the Leyte earthquake was the only recent earthquake in the region, so we used this earthquake to provide respondents with an event they could all recall.
3.2.1. Perceptions of Housing Safety
Table 3 presents the questions on perceptions of housing safety. Specifically, individuals were asked to estimate the damage to four housing components (foundations, walls, roof covering, and structures supporting the roof) in the two events. We focused on these four housing components because their failure can lead to injury or loss of life. Previous damage assessments following typhoons have shown that roof panels [
45,
55,
56,
57] and structures supporting the roof [
57,
58,
59] were the housing components most commonly damaged; their failure can lead to either roof collapse or flying roof panels, both of which can endanger safety and cause injury. Safety can also be imperiled from wall collapse [
58,
60,
61] and overturning due to foundation failure [
55,
59]. In earthquakes, walls and columns receive the most damage [
8,
62,
63], which can lead to structural collapse [
63,
64]; and foundation failure can also occur, causing collapse [
65]. In both typhoons and earthquakes, the collapse of the walls or failure of the foundation are serious safety concerns, and can lead to injury or death if residents are inside the house at the time of failure.
Individuals were asked to select the level of damage to each component from four levels of damage described in
Table 4. To assist individuals in differentiating damage levels, we provided a visual response guide with photos of minor and major damage for each housing component. To help us interpret answers, we also asked open-ended questions about what individuals expected to happen to their house in a future disaster and what they thought was most important when designing a house to withstand a future hazard.
3.2.2. Design, Program, and Personal Factors
In addition to capturing perceptions of housing safety, we also collected data on design, program, and personal factors hypothesized to influence these perceptions (see
Table 1). We recorded the design factors of each surveyed house, such as its material and the number of stories.
For the program factors, individuals indicated how much time they participated in ten activities—location selection and determination of assistance type during the planning phase; floorplan design and material selection during the design phase; and site work, construction tasks, buying materials, hiring labor, managing finances, and oversight during the construction phase—during the reconstruction of their house [
68]. We also asked whether respondents received training on how to safely design, construct, and maintain their house following Typhoon Yolanda. While previous work identified the types of training used by organizations responding to Yolanda, and found that it was a combination of training methods that best-helped individuals to learn the key “build back better” messages [
69], we did not assess the type of training received or knowledge of the key messages. Instead, we relied on individuals’ reports of whether or not they received training, and then recorded whether the house was part of a relocation site and if it was built by the local government or an NGO.
Personal factors included both individual and household characteristics. To investigate these factors, we asked respondents to provide information on their education level, socio-economic status, prior experience with design and construction, and prior experience with disasters. For the prior experience factors, specifically, we asked the respondents to rate the level to which they agree or disagree that they had prior knowledge of design and construction; whether they witnessed good or bad construction practices during the rebuilding of their home; and if they had experienced damage to their house in previous typhoons or earthquakes.
3.2.3. Hazard Exposure
We also considered variables related to exposure to wind, storm surge and earthquakes. The storm surge metric is a measure of distance from the community hall, which is generally centrally located, and the nearest shoreline. We used the available wind exposure information from the Philippine National Structural Code [
47] and a community’s combined distance to the two nearest seismic hazards—the Philippine Trench and the Central Leyte Fault [
70]—to assess wind and earthquake exposure due to the lack of location-specific hazard information for this region. After assessing each community’s wind and seismic exposure based on these measures, we found no variation within communities in Tacloban, Leyte or within Guiuan, Eastern Samar, but there was variation between Tacloban and Guiuan (due to their proximity to Tacloban, respondents living in Basey, Samar were assumed to have the same exposure as Tacloban). In particular, communities in Guiuan had more exposure to wind and earthquakes than communities in Tacloban. Therefore, a combined wind and earthquake exposure variable based on whether a respondent’s community was in Guiuan or Tacloban was used in the analysis. Additional information on the influencing factors asked can be found in
Table A1 in
Appendix A.
3.3. Data Collection: Survey Administration
We administered the survey to 451 individuals (
Table 2) across the ten communities. All data collection complied with human subject research requirements as stipulated by the Institutional Review Board (IRB) through approved data collection protocol (#17-0220). Informed consent was obtained prior to the inclusion of all respondents in this research. The survey was administered by four enumerators, who served as local research assistants, in the local language, Waray-Waray, using Qualtrics Software (Version March 2018, Qualtrics, Provo, UT, USA) on handheld tablets (iPad, Apple, Cupertino, CA, USA) from April to July 2018.
Before administering the survey, we estimated the number of surveys needed from each community for sufficient power in statistical analysis based on established survey sampling methods [
71] (p. 79). To achieve a representative response, we divided each community into geographic clusters using maps and aerial images. We determined the proportion of surveys needed from each cluster based on the proportion of houses in each cluster to the overall number of households within the community. To collect the necessary surveys from each cluster, we administered the survey to every fourth house on the initial visit (i.e., random sampling). This method was used to ensure variation in the responses and that the data collected was representative of the population. In some communities, many households were absent during the day; in this case, we administered the survey to additional households present during the site visits until we reached the needed number of surveys (i.e., convenience sampling).
While 451 participants completed the survey, some respondents did not answer every question. Where the number of respondents reported below does not equal 451, this is due to incomplete responses.
3.4. Statistical Analysis of Survey Responses
We employed descriptive and correlation analysis, and developed explanatory models using lasso regression to quantify perceptions and the relationships between the hypothesized factors and the observed perceptions. All analyses were performed in R Software (Version 3.5.3, R Core Team, Vienna, Austria).
First, we quantified perceptions of safety of individual housing components in future typhoon and earthquake events using measures of central tendencies. To do so, we transformed responses to the expected damage to individual housing components in the two hazard events into numerical values: no damage = 3, minor damage = 2, major damage = 1, and completely destroyed = 0 (see
Table 4). An individual’s perceived typhoon safety, and earthquake safety scores represent the sum of their responses of expected damage to their foundation, walls, roof covering, and structure supporting the roof, as these elements are integral to safety. Safety scores range from 0 to 12, with 0 being the least safe (i.e., an individual expects all components to be destroyed) and 12 being the safest (i.e., an individual expects no damage to any component). We assessed the reliability of the safety scores using Cronbach’s alpha [
72]: typhoon safety score (α = 0.84) and earthquake safety score (α = 0.95). We then calculated a difference in safety score by subtracting individuals’ earthquake safety scores from their typhoon safety scores, and quantified if perceptions of safety in typhoons are significantly different from perceptions of safety in earthquakes [
73].
To analyze the relationship between the hypothesized influencing factors, which are listed in
Table 5, on typhoon safety and earthquake safety, we first coded the dichotomous factors as 1 for “yes” or “agree” responses and 0 for “no” or “disagree” responses. Responses to questions about participation were scored 1 for participated and 0 for did not participate. As shown in
Table 5, we asked multiple questions to assess individuals’ participation, training, and prior experience. To make a more parsimonious and interpretable model, we used exploratory factor analysis (EFA) [
74,
75] to identify variables that could be combined into single variables, due to correlations. The EFA combined the participation, training, and prior experience questions for the survey into five variables related to participation, one variable related to training, and four variables related to prior experience, as shown in
Table 6. The original participation variables of location selection and oversight remained as single variables. The original prior experience variables of prior design knowledge, prior construction knowledge, and saw different damage levels based on design did not correlate with any of the new variables and were treated as individual variables in the subsequent analysis.
Table 6 provides new factors after EFA and their variable type, variable coding, and Cronbach’s alpha values.
We then assessed whether there were significant relationships between our hypothesized influencing factors and the typhoon and earthquake safety scores using one-way ANOVA (categorical variables) [
73], Pearson’s r (continuous or dichotomous variables), and Spearman’s rank correlation coefficients (ordinal variables) [
76]. Due to the large number of predictor variables, we used the Benjamini–Hochberg procedure to correct for the false discovery rate (FDR), which represents the likelihood that we identified a significant relationship where there was not one (i.e., committed a Type I error), and set the FDR at 5% [
77]. With this adjustment, we are confident that the relationships reported between influencing factors and typhoon and earthquake safety scores are significant. Finally, after identifying which influencing factors were significant, we employed linear regressions of each variable individually to quantify how responses for each factor affect the typhoon and earthquake safety scores.
We then used lasso regression to investigate the relationship between multiple influencing factors and the typhoon and earthquake safety scores and create an explanatory model that includes these factors together. Explanatory models have been used extensively in studies of risk perceptions (e.g., [
15,
17,
21]) to quantitatively explain how multiple factors work together to influence perceptions. We use explanatory models here to assess both which factors are most influential for perceptions of housing safety and how design, program, personal, and exposure factors collectively influence perceptions. Lasso regression seeks to produce simple, interpretable models by applying a penalty, λ, to the independent variable coefficients to identify the most important variables and which variables can be eliminated from the model [
78]. We used cross validation to determine the λ value, which resulted in the best model, based on R
2, and report the λ values in our results below. Lasso regression is well-suited for models with multicollinearity, or where predictor variables are highly correlated with each other, which is the case for our data.
4. Results
We present and discuss the analysis by first summarizing respondent demographics before presenting results regarding perceptions of housing safety; the influence of house design, program, personal, and exposure factors individually on perceptions; and finally, the explanatory models and the combined effect of these factors.
4.1. Respondent Demographics
Four hundred fifty-one individuals completed the survey;
Table 7 summarizes the respondent demographics. Household sizes ranged from 1 person to 12 people (Mean = 4.9, SD = 1.9). Based on 2015 data, the Philippines Statistics Authority reported that the poverty threshold was P444 per capita per week [
79].
4.2. Perceptions of Housing Safety
Most respondents did not perceive their current shelters to be safe for the two hazard events of interest. On average, respondents had a typhoon safety score of 3.5 and an earthquake safety score of 5.6, out of 12.
Figure 3 presents the distribution of typhoon and earthquake safety scores as well as the difference in safety scores. One hundred twenty-seven respondents expected all components to be destroyed in both the typhoon and earthquake event. When comparing individuals’ perceptions of the safety of their house in typhoons and earthquakes using the difference in safety score described above, we found that, on average, respondents perceived their house to be 3.8, out of 12, points less safe in the typhoon event than the earthquake event. This is a statistically significant difference: F(1,446) = 77.0,
p < 0.001. In these communities, there is the fear of what will happen in a future typhoon as many people expect to lose their entire house. In every community we surveyed, the most common response to the question, “If a typhoon were to occur, how do you think your house would be affected?” was that their house would be destroyed.
Supporting the observation that most individuals do not perceive their home to be safe, a total of 349 respondents (77%) indicated that they would need to leave their house in the case of a future disaster. This result is likely due to ongoing trauma from Typhoon Yolanda. Conversations with participants during the survey revealed that individuals are more aware of evacuation centers and the need to evacuate than they were before Yolanda, and during reconstruction, many organizations emphasized that households should evacuate to designated centers during future hazards. Respondents also expressed concerns with the long duration of typhoons and the tendency of the reconstructed houses to leak water when it rains. Therefore, while some individuals might feel safe in their house during normal days, they indicated they would leave their house and seek shelter at a safer location during a disaster.
Figure 4 presents the number of damage respondents expected to foundations, walls, roof covering, and roof structures in future typhoons and earthquakes. In a typhoon, individuals expected more damage to the roof covering and structure supporting the roof than either the foundations or walls. In the earthquake event, they expected slightly more damage to the foundations and walls. We examined the differences in expected damage to each housing component in the typhoon and earthquake events and found that there was not a significant difference for foundations and walls. However, respondents expected almost an entire damage state more in the typhoon event compared to the earthquake event for the roof covering (F(1,449) = 276,
p < 0.001) and the structure supporting the roof (F(1,448) = 252,
p < 0.001).
These perceptions of housing component damage align with the most common housing failures in typhoons (based on studies, such as [
59]). In typhoons, perceptions of roof damage strongly influenced overall perceptions of housing safety. When asked what they would do to improve the safety of their house in a typhoon, a majority of respondents provided answers related to strengthening the roof. For example, one respondent who expected her house to be completely destroyed in a typhoon said that adding bolts to the roof will make her house safer in a typhoon. Another respondent stated that replacing the roof panels with thicker panels would make the roof safer. Typhoons have been the most recent and damaging hazards in these communities, which likely led respondents to be able to more easily recall typhoon damage (see work from [
80,
81] on this trend), and thus, likely increased the damage they expected in a typhoon compared to an earthquake.
In addition, there was more variation in perceptions of component safety in earthquakes than in typhoons, suggesting that there is wider variation in understanding of how houses can be damaged in earthquakes. In fact, a handful of respondents, when asked, “What do you think is most important when designing a house that will withstand an earthquake?” answered “I don’t know.” Even as recently as the April 2019 earthquake on Samar Island, individuals were more concerned with the risk of a tsunami, which is similar to the storm surge experienced during Yolanda, than with buildings collapsing from the earthquake’s ground acceleration [
82]. Additionally, from our discussions with organizations who had worked in these communities, we learned that an overwhelming majority of reconstruction and training programs only discussed typhoon risk, despite the seismic hazard of these communities. Overall, given the recency and severity of typhoons in these communities, individuals were more aware of how their houses could be damaged in a typhoon than an earthquake.
4.3. Factors Influencing Perceptions of Housing Safety
In this section, we present the findings of the correlation analysis as to which house design, program, personal, and exposure factors significantly influence perceptions of housing safety.
4.3.1. Influence of House Design Factors
The material of a house’s columns and walls was a significant factor influencing perceptions of safety in both typhoons and earthquakes as determined by one-way ANOVA (Typhoons: F(2,445) = 30.8,
p < 0.001, Earthquakes: F(2,447) = 13.7,
p < 0.001). Individuals living in wood houses perceived the most damage to their house, and individuals in bamboo houses expected the least damage. For all materials, there was a significant difference between typhoon and earthquake safety scores (F(2,444) = 9.2,
p < 0.01); respondents consistently perceived their house to be safer in the earthquake event than the typhoon event.
Figure 5 shows the average typhoon and earthquake safety scores (on a scale from 0–12) for individuals living in houses built with the three different materials (wood, concrete, and bamboo). Unlike material, we found no statistically significant relationships between a house’s number of stories and perceived housing safety.
4.3.2. Influence of Program Factors
While we anticipated that program characteristics would influence perceptions of safety, we found that training on safe design and construction methods was not significantly correlated with perceived safety in either typhoons or earthquakes. Participation was only significant for perceptions of safety in earthquakes. In particular, those who participated more in the design and construction of their house perceived their houses to be safer in earthquakes. On average, participation in an additional activity in design (F(1,409) = 21.3, p < 0.001), construction labor (F(1,410) = 39.8, p < 0.001), and construction decisions (F(1,408) = 21.3, p < 0.001) led to a 2.3, 1.7, and 0.9-point increase in earthquake safety scores (which ranges from 0–12 points), respectively. Those who oversaw the construction of their house had, on average, an earthquake safety score 1.6 points greater than those who did not (F(1,410) = 10.5, p < 0.01). On the other hand, we did not find a significant relationship between participation and typhoon safety scores; we attribute this lack of relationship to individuals’ previous experience with typhoons, which was likely more influential than participation on perceptions of housing safety.
Being relocated to a new community was only significant for earthquake safety scores (F(2,447) = 6.97, p < 0.01), with those in government-implemented relocation sites perceiving their houses to be the least safe in earthquakes. On average, those in government-implemented relocation sites perceived their houses to be 2 points less safe than those in NGO-implemented relocation sites and 1.7 points less safe than those who had not been relocated. The difference in earthquake safety scores between those who had not been relocated and those living in NGO-implemented relocation sites was not significant.
4.3.3. Influence of Personal Factors
Table 8 shows the correlation between the significant personal factors and perceived typhoon and earthquake safety as identified by testing for Pearson’s r and Spearman’s rank correlation coefficients and correcting for FDR. Personal factors from
Table 5 that are were not significant after correcting for FDR are not shown in
Table 8.
As suggested by previous literature (e.g., [
16]), we found the prior experience to be one of the most significant factors in predicting perceived housing safety, particularly for earthquake safety. Individuals who had previously experienced housing damage from more disasters expected more damage to their house during a future earthquake. This supports prior literature that found that feelings of worry and dread caused by previous damage increase peoples’ perceptions of risk [
83,
84]. However, we did not find that previous experience with damage to be significantly correlated with perceived housing safety in typhoons, likely because the dominant typhoon experience for all respondents was Typhoon Yolanda, in which, as a majority of respondents described, “all types of houses were destroyed, even concrete ones”. In other words, there were no significant differences in prior experience among our respondents. Respondents who either like their current house better than the house they lived in before Yolanda, or who feel safer in their current house than they did in their pre-Yolanda house, reported higher perceptions of housing safety in both typhoons and earthquakes.
Witnessing construction practices, either good or bad, was also important for both typhoon and earthquake safety perceptions. Most respondents reported that they witnessed either only good practices or only bad practices during reconstruction, and these responses are significantly correlated with whether individuals feel safer in their house. Good construction practices were those that improve housing safety; for example, individuals described builders using appropriately sized longitudinal bars and transverse ties in concrete columns or attaching roof panels with umbrella nails. In contrast, bad practices threaten housing safety. A common example provided by individuals was that builders would use young, untreated pieces of coconut lumber, which was often not structural grade and prone to deterioration and rot.
We did not find significant relationships between gender, education level, land tenure status, social capital, or wealth and typhoon safety. However, we did find significant relationships between education level, living in the same community as pre-Yolanda, and income for earthquake safety. We hypothesize that the reason we did not find significant relationships between typhoon safety and these demographic factors was because of both the frequency of typhoons in this region and the severity of Typhoon Yolanda. All residents in the studied communities were greatly affected by Yolanda and are aware of the considerable typhoon hazard. This awareness of typhoons and shared experience with Yolanda were more important than demographic factors on perceptions of typhoon safety.
For earthquakes, however, there was not a dominant, shared experience. While households were aware of the 2017 Leyte earthquake, not all households had been severely affected, nor had all households previously experienced substantial damage from an earthquake. Therefore, demographic factors were important for predicting perceptions of earthquake safety. For earthquakes, in line with previous literature (e.g., [
37]) higher levels of education were associated with more perceived safety, or less perceived risk. Individuals who lived in the same community at the time of the survey as they did before Yolanda also perceived their houses to be safer in earthquakes than those who lived in different communities, likely because they have more social ties and are able to access more resources to modify their houses or prepare for hazard events. These ties and resources better enable households to make changes to their houses and, in emergencies, can provide households with additional places to stay during a hazard event. Additionally, those who previously lived in the same community are likely more aware of the hazards and risks present in their community as compared to households that were relocated to new communities. The combination of greater social ties, access to resources, and knowledge of the community likely encourage a greater sense of control and ability to improve their safety, which in turn, increases perceptions of housing safety. Similarly, those with higher incomes perceived their houses to be safer in earthquakes because they are more able to repair or modify their houses when needed. Unlike with Typhoon Yolanda, there was not a shared previous experience with a catastrophic earthquake that drove perceived safety in earthquakes; therefore, these individual characteristics were more important for perceptions of safety in earthquakes.
4.3.4. Influence of Exposure
We also found that living in Guiuan (the region more exposed to both wind and earthquake hazards) significantly influenced perceptions of safety in both typhoons and earthquakes. Living in Guiuan decreased perceived safety scores by 1.9 points for typhoons (F(1,446) = 20.3,
p < 0.001) and 2.6 points for earthquakes (F(1,448) = 29.2,
p < 0.001) compared to living in Tacloban. We did not find a significant relationship between storm surge exposure and perceived safety and expect this is because all communities were coastal communities, and many were highly vulnerable to storm surge. Additionally, nearly all respondents had previously experienced considerable damage from storm surge. A previous study of homeowners’ hazard mitigation status [
32] found that living in a coastal county was an important factor for increased mitigation, but once in a coastal county, there were no significant differences in mitigation actions based on proximity to the shoreline. Our findings agree with this previous finding since we did not find significant differences in perceptions of housing safety based on the distance to the shoreline because all communities were located near to the coast.
4.4. Explanatory Models for Typhoon and Earthquake Safety
We used lasso regression to create a linear explanatory model for both the typhoon safety and earthquake safety score. This explanatory model extends the analysis of the previous section to understand how the influencing factors work in combination to affect perceptions of housing safety. For the “original” explanatory model, we used only the factors we found to be significant in the previous analysis; however, we removed factors related to previous damage in typhoons and earthquakes from the earthquake safety model, which had some missing responses, in order to retain a higher n value. While the “original” models illustrate the combined influence of the significant factors from the correlation analysis, we also wanted to determine how additional design and program factors, even though they were not identified as significant, influenced perceived safety, as these factors could be directly altered by responding organizations. Thus, we conducted an additional lasso regression for the typhoon safety and earthquake safety models that included the significant factors, as well as all the design (house material and size) and program (participation in planning, design, and construction; training; and relocation) factors, and referred to these as the “full” models. The factors and their coefficients are presented in
Table 9. These models are used in the discussion to illustrate that housing material, prior experience, exposure, and other program and personal factors work together to influence perceptions of safety.
To understand the influence of the personal factors, the coefficient should be multiplied by an individual’s response to each item as described using the coding scheme in
Table 5 and
Table 6. Participation in each additional reconstruction activity led to an increase in the safety score equal to the coefficient of the program factor. To calculate the influence of housing material and living in a relocation site, multiply the coefficient values for those factors by the coding schemes listed under the factor names in
Table 9. For example, the predicted “original” earthquake safety score of an individual who both likes better and feels safer in their new house compared to their previous house, witnessed only good construction practices, attended college, participated in two design activities and one construction labor activity, and lives in a wooden house in an NGO-implemented relocation site in Guiuan would be 8.86 points on a scale from 0–12 points, see Equation (1):
5. Discussion
Overall, the most influential factors on perceptions of housing safety were housing material, witnessing construction practices (either good or bad), preferring one’s new house to one’s previous house, and exposure. Living in a relocation site and education level were important factors that affected the respondent’s perceived safety in earthquakes; whereas, if the respondent was the original occupant, this was an important factor for their perceived safety in typhoons. Witnessing good and bad construction practices are related to whether respondents are aware of the quality of their house. For example, an individual who saw poor construction techniques and materials used during the construction of their house reported, “I do not trust the quality of our house. It will be totally damaged.” Another study of the housing recovery in relocation communities in Tacloban following Yolanda also found that observing poor construction decreased confidence in the safety of one’s house [
29]. Relatedly, we expect that the reason individuals who prefer their new house to their previous house also perceived their current house to be safer in both typhoons and earthquakes was associated with housing quality: these feelings of improved safety were driven by knowing their house was built in a safer location or was constructed with better materials or practices. Witnessing construction practices and preferring one’s new house were significant predictors of perceived safety in both typhoons and earthquakes on their own, and when included in the explanatory model with other factors, they nearly always had the largest effect on perceptions of safety, reflecting the importance of prior experience on perceptions.
Being the original occupants of a house was an important factor in the “original” typhoon safety model (
Table 9), likely because original owners were more likely to observe whether poor practices or materials were used to build their house. However, being the original occupants dropped out of the typhoon safety model when we added in the additional program (participation, training, and living in a relocation site) and design (size) factors. Instead, participation in design and construction decisions remained in the model. Participation in design, which included designing the floorplan and selecting the materials of the house, increased perceptions of safety, likely because those who were able to design their own house felt they had more agency and were confident that the house was safe. Participation in construction decisions, including buying materials, led to decreased perceptions of safety. Given the importance of the material in perceived safety, those who were involved in buying materials may have known they purchased poor quality materials. For example, one individual who was involved in purchasing materials stated, “[o]ur house will be totally damaged since the quality of the materials is not that good.”
We found participation in design and construction to be more important for perceived safety in earthquakes than for typhoons. Similar to the typhoon model, the more one participated in the design, the safer they perceived their house to be in earthquakes. However, unlike the typhoon model, participation in construction labor, was an important factor impacting perceptions of safety (but not participation in construction decisions). We see the same trend for participation in construction labor as we do for participation in design: those who participated more perceive their house to be safer, likely because they have more confidence that their own work is safe. We believe that the greater sensitivity of earthquake safety scores to participation, as compared to typhoon scores, was because individuals were less aware of the earthquake risk in their communities and how this would impact their house. Thus, participating more in reconstruction processes exposed them more to information about their house, influencing how safe they perceived their house to be.
The material of the house’s structural system was one of the most important factors for typhoons, concrete or masonry was perceived to be a safer material than wood. Many individuals in wood houses stated that they would make their house safer by adding masonry walls, because they felt that concrete and masonry were safer than wood in typhoons. Nearly everyone had witnessed wooden houses collapsing in Typhoon Yolanda; therefore, people did not believe in the strength of wooden houses. The concern with wood was particularly pronounced for houses built with coconut lumber, which was perceived to be inferior and more prone to rot and decay than “good” lumber. Housing material is not as important for perceptions of safety in earthquakes in this sample, with differences only existing between those in bamboo and wooden houses. Many respondents were aware that concrete could be more dangerous in earthquakes, which is why we did not find living in a concrete house to be an influential factor on perceived safety in earthquakes.
However, we did find living in a government-implemented relocation site to be an important predictor of perceived safety in earthquakes. This is consistent with others who have documented concerns with construction quality in the government-implemented relocation communities [
29]; in our study, individuals in these communities expressed the greatest concern with the quality of the concrete used in the walls of their home. Thus, while we did not find living in a concrete house to be a significant predictor of perceived safety in earthquakes from the lasso analysis, we believe perceptions of concrete are correlated with living in a government-implemented relocation site, which we did find to be a significant factor. Additionally, during the post-Yolanda recovery period, there tended to be greater trust for international organizations than the government during the reconstruction process [
85]. As many of the relocation communities were constructed by the government and all non-relocation sites were constructed by NGOs, dissatisfaction with, or a lack of trust in, the government could also be why relocation communities had lower perceptions of safety.
Compared to perceptions of safety in typhoons, exposure was a more important factor for perceptions of safety in earthquakes. Those in the more exposed location of Guiuan expected their houses to have more damage in earthquakes than those who live in Tacloban, on average. The difference in the importance of exposure in typhoons and earthquakes was likely due to respondents’ previous experience with Typhoon Yolanda. While houses in Guiuan might be more exposed to wind, all individuals in this survey had experienced catastrophic damage from typhoons; therefore, they all were aware of the potential for wind damage to their houses regardless of their location’s exposure classification.
A house’s number of stories, factors of training and participation in location selection, and storm surge exposure were not significant factors affecting perceived safety in neither typhoons nor earthquakes based on both the correlation and explanatory model analyses. Rather, housing material, being relocated, participation in design and construction, prior experience with disasters and construction, and exposure work together to inform individuals’ perceptions of their house.
Limitations
This study advances our knowledge of perceptions of housing safety in typhoons and earthquakes, but, as with any study, it has limitations. First, to ensure enumerator safety, surveys were administered to households during the day, leading to a greater population of women respondents. Because women participated less in training and reconstruction, their perceptions might not be representative of the entire household. Additionally, while we used random sampling (as described above) wherever possible, convenience sampling was needed in a few communities where many households were not available during the day.
Second, we were unable to study participants’ trust in their local government and organizations providing housing assistance; however, given the importance of trust for perceived risk [
16], we recommend that future studies assess the influence of trust on perceptions of safety. Additionally, we recommend that future work examine the influence of self-efficacy, or a individual’s belief that their actions will influence the safety of their house, on overall perceptions of housing safety. While we asked individuals to self-report whether they previously had knowledge of safe design and construction practices and whether they received construction training, we did not assess individuals’ knowledge of “build back better” practices ourselves. Future work could include these assessments in order to understand how accurate knowledge of safe construction affects perceptions of housing safety.
Third, we asked questions about the perceived safety of houses in individual events (i.e., Typhoon Yolanda and the Leyte earthquake) because respondents struggled to provide detailed responses to open-ended questions about any hypothetical future typhoon or earthquake. While Typhoon Yolanda was a more intense event than the Leyte earthquake, we believe we would have found the same results in this particular context regardless of the event intensity used in the survey questions, due to the frequency of and concern with typhoons in Leyte and Samar. Future work should investigate perceptions of housing safety in multiple hazards of the same intensity and in different contexts, where earthquake damage may change material perceptions.
6. Conclusions
Prior literature has shown that what people perceive to be safe as it relates to their house influences what they build and the actions they take over time to reduce their disaster risk. Identifying these perceptions allows us to better understand what housing components individuals perceive to be vulnerable and how they are most likely to modify their house. With this information, organizations providing post-disaster housing and training can create programs that address these perceptions and better support households in developing their capacity to design and build safe houses. Given the limited information on perceptions of safe housing in multi-hazard, resource-limited environments and how housing design characteristics, such as material choice, along with personal and program factors influence these perceptions, we assessed 451 individuals’ perceptions of the safety of their house in typhoon and earthquake events and potential factors affecting their perceptions. We focused on post-disaster housing provided by non-governmental and governmental organizations, due to the large amount of new housing built in recent years, and the opportunity for these organizations to adjust program factors with an understanding of housing perceptions.
To address the dearth of studies focused on housing components and characteristics, we assessed which components individuals perceived to be safe or unsafe and how hazard event, housing material and the number of stories in a house affected perceptions of housing safety. In this multi-hazard environment, we found significant differences in perceived housing safety in the context of earthquakes as compared to typhoons. In the Philippines, following Typhoon Yolanda, individuals perceived their house to be much less safe in a typhoon than an earthquake, despite the high seismic risk in the surveyed communities. Although respondents were more concerned with how a typhoon would damage their house, we did find that those living in communities more exposed to wind and seismic hazards perceived their houses to be less safe than those in less-exposed communities.
We also found that, overwhelmingly, respondents perceived their roofs to be the least safe part of their house in typhoons, and in earthquakes, there was less consensus about which component would most likely be damaged. Understanding which components individuals believe to be the most vulnerable provides insights into which components they are most likely to modify. As noted above, many respondents said they would strengthen their roof to improve its safety in typhoons. While this change may improve the safety of their house, over-strengthening the roof compared to the walls could also lead a house to collapse under a typhoon’s strong winds. Importantly, housing material was one of the most important factors influencing perceptions of safety, with a majority of respondents in wood houses stating that they wished to modify their house so that it had more concrete or masonry—an action that could potentially increase the likelihood of damage during an earthquake event.
We assessed the impact of program factors, such as participation and training, on perceptions of safety, in order to understand the influence of the post-disaster context and post-disaster reconstruction programs. While program factors, such as participation, were not the most influential factor, it did affect perceptions of safety, particularly for earthquakes—the hazard individuals were less familiar with. In general, individuals who participated more during the reconstruction of their house felt safer, likely because they had more control over what was built. Additionally, agreeing with previous literature, we found that prior experience, particularly with previous housing damage and construction, influenced perceptions of housing safety. Witnessing good or bad construction practices was an important predictor for perceived safety, with individuals who witnessed good practices perceiving their house to be safer than those who witnessed bad construction practices. This finding suggests that even if individuals did not directly participate in training or the rebuilding of their house, observing the construction process influenced how they perceived their house. Moreover, this study shows that individuals’ perceptions of the safety of their house were influenced by the comparisons they made between their current house and their house before a disaster.
These findings support a number of recommendations for organizations working in a post-disaster context. Implementing organizations can use information about individuals’ perceptions of housing safety to affect the long-term safety of post-disaster housing by targeting training programs to enhance awareness of safe construction practices. These organizations should be aware of how their programs can influence perceptions of safety, and should incorporate beneficiaries into the reconstruction process and share knowledge of different housing materials and housing performance in multiple hazards. The more widely varying perceptions of earthquake safety observed in this study may be, in part, because responding organizations did not address seismic risk as much in their programming. Therefore, we recommend that organizations providing housing assistance provide information about all potential hazards, along with how those hazards could affect houses and account for these potential hazards in their housing design.
We further suggest that organizations continue to encourage participation throughout the reconstruction process, because participation in both the design and construction stages affected safety perceptions. Although we did not find training on safe design and construction practices to be significant predictors of perceptions of safety, we do recommend that organizations continue to provide training during their programs—since being aware of good and bad construction practices was an important predictor of perceived safety. For example, during training programs, we recommend that organizations provide information on how the systems of a house work together in hazard events and how different materials behave in different types of hazard events so that individuals can be more aware of the safety implications of their material choices and modifications to their houses. Specifically, we suggest adding training on the expected performance of the rebuilt houses during different types of hazards and how this performance is related to aspects of the house. By providing specific information on the expected outcomes of a hazard, we expect that individuals will have a better understanding of the safety of their house. In addition, because of comparisons individuals made with their previous house, we suggest that organizations provide information on how new housing designs compare to the previous housing in terms of hazard resistance.
Our analysis revealed that perceptions of housing safety are collectively influenced by a house’s material, it’s location and exposure, and an individual’s prior experience and participation in reconstruction. Thus, organizations should take care to address these components in post-disaster programming by discussing how material and location affect a house’s safety, relating the expected safety of new houses to the houses that existed previously in a community, and encourage households to participate in reconstruction early and often. These recommendations are intended to enhance post-disaster housing reconstruction programs so that organizations can help change perceptions of housing safety and improve awareness of what houses and housing components are safe and unsafe. We hope that this will ultimately support individuals and communities to take actions in the future that reduce their disaster risk.
Author Contributions
Conceptualization, C.V., A.J.-W., and A.B.L.; Formal analysis, C.V.; Funding acquisition, C.V., A.J.-W., and A.B.L.; Investigation, C.V.; Methodology C.V., A.J.-W, and A.B.L.; Project administration, A.J.-W. and A.B.L.; Supervision, A.J.-W., and A.B.L.; Validation, C.V., A.J.-W., and A.B.L.; Writing—original draft, C.V.; Writing—reviewing and editing, C.V., A.J.-W., and A.B.L. All authors have read and agreed to the published version of the manuscript.
Funding
This material is based in part upon work supported by the National Science Foundation Humans, Disasters, and the Built Environment Program Award #1901808, University of Colorado Research and Innovation Office (RIO) 2017 Seed Grant, the Mortenson Center in Global Engineering, and the U.S. Department of Education’s Graduate Assistantship in Areas of National Need Award #P200A150042. Any opinions, findings, and conclusions or recommendations expressed in this material are those of the authors and do not necessarily reflect the views of RIO, the U.S. Department of Education, or the National Science Foundation.
Acknowledgments
We would like to thank our research assistants, Dina Pelayo, Jennylyn Budlong, Hyacinth Raga, Angelou Cinco, Denver Evangelista, and Wilma Ranes as well as all of the respondents in this research for their participation. We also thank Dr. Aaron Opdyke and Dr. Shaye Palagi for sharing case knowledge of the studied communities.
Conflicts of Interest
The authors declare no conflict of interest. The funders had no role in the design of the study; in the collection, analyses, or interpretation of data; in the writing of the manuscript; or in the decision to publish the results.
Appendix A
Table A1.
Survey questions asked for each influencing factor.
Table A1.
Survey questions asked for each influencing factor.
| Influencing Factor | Survey Question | Survey Response Options |
|---|
| Education Level | What is your highest education level? | Primary school High school College
|
| Prior Experience | I witnessed or heard about good construction practices during the construction of houses in my barangay. | Strongly disagree Disagree Agree Strongly agree
|
| I had knowledge about safe housing design before Typhoon Yolanda. |
| I had construction knowledge before Typhoon Yolanda. |
| I witnessed or heard about bad construction practices during the construction of houses in my barangay. |
| During Typhoon Yolanda, I saw that different housing designs had different levels of damage. |
| I like this house better than the house I had before Yolanda. |
| I feel safer in this house compared to my house before Yolanda. |
| Was your house damaged during Typhoon Urduja? | |
| Have you ever lived in a house that was damaged during an earthquake? |
| Approximately, how many typhoons have you experienced? | Open-ended numeric response |
| Approximately, how many earthquakes have you experienced? |
| Place to go in a disaster | I have a place to go if there were a disaster. | Strongly disagree Disagreec Agreed Strongly agree
|
| Social capital | Where did you live before Typhoon Yolanda? | In this barangay In a different barangay
|
| How many of your neighbors do you know? | |
| How long have you lived in this barangay? | Open-ended numeric response |
| House as a business | My house is also used for business (for example, a sari-sari store). | Strongly disagree Disagree Agree Strongly agree
|
| Land Tenure Status | What is the status of your land ownership? | Own land (w/ title) Own land (w/o title) Own house, not land (w/ title) Own house, not land (w/o title) Renter (pay rent) Renter (free) Informal Government owns land
|
| Original occupants | Has your family lived in this house since it was first built? | |
| Wealth | What is your household’s weekly income? | Open-ended numeric response |
| What is your household’s weekly expenses? |
| How much does your household have in savings? |
| Participation in Planning | Who decided the location of your house? | The organization decided and did not tell anyone in my household. The organization decided but informed me of the decision. The organization asked my household for our opinion. The organization and my household worked together to decide. My household decided.
|
| Who decided the type of assistance you received? |
| Participation in Design | Who decided the floorplan or layout of your house? |
| Who decided the materials of your house? |
| Participation in Construction | How involved was someone in your house in site work tasks (removing debris, moving dirt, preparing the foundation)? | Not at all A little bit Quite a bit All the time
|
| How involved was someone in your house in construction tasks (building the walls, placing the roof)? |
| How involved was someone in your house in purchasing materials for this house? |
| How involved was someone in your household in hiring labor to build this house? |
| How involved was someone in your house in managing the finances of building this house? |
| How involved was someone in your house in overseeing construction of this house? |
| Training | I received training on how to design a house to withstand disasters. | Strongly disagree Disagree Agree Strongly agree
|
| I received training on how to construct my house. |
| I received training on how to modify my house. |
| I received training on how to maintain my house. |
References
- CRED. The International Disaster Database; Universite Catholique de Louvain: Brussels, Belgium, 2019. [Google Scholar]
- Lindell, M.K.; Prater, C.S. Assessing Community Impacts of Natural Disasters. Nat. Hazards Rev. 2003, 4, 176–185. [Google Scholar] [CrossRef]
- Mannakkara, S.; Wilkinson, S. Re-conceptualising “Building Back Better” to improve post-disaster recovery. Int. J. Manag. Proj. Bus. 2014, 7, 327–341. [Google Scholar] [CrossRef]
- Clinton, W. Lessons Learned from Tsunami Recovery: Key Propositions for Building Back Better; United Nations: New York, NY, USA, 2006. [Google Scholar]
- UNISDR. Living with Risk: A Global Review of Disaster Reduction Initiatives; United Nations: New York, NY, USA, 2004. [Google Scholar]
- Ahmed, I. An overview of post-disaster permanent housing reconstruction in developing countries. Int. J. Disaster Resil. Built Environ. 2011, 2, 148–164. [Google Scholar] [CrossRef]
- Marshall, J.D.; Lang, A.F.; Baldridge, S.M.; Popp, D.R. Recipe for disaster: Construction methods, materials, and building performance in the January 2010 Haiti earthquake. Earthq. Spectra 2011, 27, S323–S343. [Google Scholar] [CrossRef]
- Mix, D.; Kijewski-Correa, T.; Taflanidis, A.A. Assessment of residential housing in Leogane, Haiti, and identification of needs for rebuilding after the January 2010 earthquake. Earthq. Spectra 2011, 27, S299–S322. [Google Scholar] [CrossRef]
- Sucuoğlu, H. Implications of masonry infill and partition damage in performance perception in residential buildings after a moderate earthquake. Earthq. Spectra 2013, 29, 661–667. [Google Scholar] [CrossRef]
- Elms, D. Achieving structural safety: theoretical considerations. Struct. Saf. 1999, 21, 311–333. [Google Scholar] [CrossRef]
- Munich Re NATHAN World Map of Natural Hazards 2011. Available online: http://catalogue.unccd.int/Map_NATHAN%20-%20World%20map%20of%20natural%20hazards.pdf (accessed on 13 July 2019).
- Sullivan-Wiley, K.A.; Gianotti, A.S.G. Risk Perception in a Multi-Hazard Environment. World Dev. 2017, 97, 138–152. [Google Scholar] [CrossRef]
- Snarr, D.N.; Brown, E.L. User satisfaction with permanent post-disaster housing: two years after Hurricane Fifi in Honduras. Disasters 1980, 4, 83–91. [Google Scholar] [CrossRef]
- Opdyke, A.; Javernick-Will, A.; Koschmann, M. A Comparative Analysis of Coordination, Participation, and Training in Post-Disaster Shelter Projects. Sustainability 2018, 10, 4241. [Google Scholar] [CrossRef]
- Peacock, W.G.; Brody, S.D.; Highfield, W. Hurricane risk perceptions among Florida’s single family homeowners. Landsc. Urban Plan. 2005, 73, 120–135. [Google Scholar] [CrossRef]
- Wachinger, G.; Renn, O.; Begg, C.; Kuhlicke, C. The Risk Perception Paradox-Implications for Governance and Communication of Natural Hazards: The Risk Perception Paradox. Risk Anal. 2013, 33, 1049–1065. [Google Scholar] [CrossRef] [PubMed]
- Ho, M.-C.; Shaw, D.; Lin, S.; Chiu, Y.-C. How Do Disaster Characteristics Influence Risk Perception? Risk Anal. 2008, 28, 635–643. [Google Scholar] [CrossRef] [PubMed]
- Thistlethwaite, J.; Henstra, D.; Brown, C.; Scott, D. How Flood Experience and Risk Perception Influences Protective Actions and Behaviours among Canadian Homeowners. Environ. Manag. 2018, 61, 197–208. [Google Scholar] [CrossRef] [PubMed]
- Gaillard, J.-C. Alternative paradigms of volcanic risk perception: The case of Mt. Pinatubo in the Philippines. J. Volcanol. Geotherm. Res. 2008, 172, 315–328. [Google Scholar] [CrossRef]
- Sjoberg, L.; Moen, B.-E.; Rundmo, J. Explaining risk perception. An evaluation of the psychometric paradigm in risk perception research . 2004. Available online: http://www.svt.ntnu.no/psy/Torbjorn.Rundmo/Psychometric_paradigm.pdf (accessed on 12 June 2019).
- Basolo, V.; Steinberg, L.J.; Gant, S. Hurricane threat in Florida: examining household perceptions, beliefs, and actions. Environ. Hazards 2017, 16, 253–275. [Google Scholar] [CrossRef]
- McClure, J.; Doyle, E.E.; Velluppillai, J.M. A tale of two cities: Judgments about earthquake and aftershock probabilities across time windows. Int. J. Disaster Risk Reduct. 2015, 14, 15–26. [Google Scholar] [CrossRef]
- Nakayachi, K.; Nagaya, K. The Effects of the Passage of Time from the 2011 Tohoku Earthquake on the Public’s Anxiety about a Variety of Hazards. Int. J. Environ. Res. Public. Health 2016, 13, 866. [Google Scholar] [CrossRef]
- Barakat, S. Housing Reconstruction after Conflict and Disaster; Overseas Development Institute: London, UK, 2003; ISBN 978-0-85003-695-4. [Google Scholar]
- Snarr, D.; Brown, E.L. Post-Disaster Housing Reconstruction: A Longitudinal Study of Resident Satisfaction. Disasters 1994, 18, 76–80. [Google Scholar] [CrossRef] [PubMed]
- Snarr, D.N.; Brown, E.L. Attrition and housing improvements. Disasters 1982, 6, 125–131. [Google Scholar] [CrossRef]
- McClure, J.; Spittal, M.J.; Fischer, R.; Charleson, A. Why do people take fewer damage mitigation actions than survival actions? Other factors outweigh cost. Nat. Hazards Rev. 2014, 16, 1–8. [Google Scholar] [CrossRef]
- Dalisay, S.N.; De Guzman, M.T. Risk and culture: the case of Typhoon Haiyan in the Philippines. Disaster Prev. Manag. Int. J. 2016, 25, 701–714. [Google Scholar] [CrossRef]
- Maly, E. Building back better with people centered housing recovery. Int. J. Disaster Risk Reduct. 2018, 29, 84–93. [Google Scholar] [CrossRef]
- Jordan, E.; Javernick-Will, A.; Tierney, K. Post-tsunami recovery in Tamil Nadu, India: combined social and infrastructural outcomes. Nat. Hazards 2016, 84, 1327–1347. [Google Scholar] [CrossRef]
- Lindell, M.K.; Perry, R.W. Household Adjustment to Earthquake Hazard: A Review of Research. Environ. Behav. 2000, 32, 461–501. [Google Scholar] [CrossRef]
- Peacock, W.G. Hurricane Mitigation Status and Factors Influencing Mitigation Status among Florida’s Single-Family Homeowners. Nat. Hazards Rev. 2003, 4, 149–158. [Google Scholar] [CrossRef]
- Canter, D.; Rees, K. A multivariate model of housing satisfaction. Appl. Psychol. 1982, 31, 185–207. [Google Scholar] [CrossRef]
- Opdyke, A. Resilient and Sustainable Infrastructure Systems: A Comparative Analysis of Post-Disaster Shelter Coordination, Stakeholder Participation, and Training. Ph.D. Thesis, University of Colorado Boulder, Boulder, CO, USA, 2017. [Google Scholar]
- Armaş, I. Social vulnerability and seismic risk perception. Case study: the historic center of the Bucharest Municipality/Romania. Nat. Hazards 2008, 47, 397–410. [Google Scholar] [CrossRef]
- Siegrist, M.; Gutscher, H.; Earle, T.C. Perception of risk: the influence of general trust, and general confidence. J. Risk Res. 2005, 8, 145–156. [Google Scholar] [CrossRef]
- Fothergill, A.; Peek, L.A. Poverty and Disasters in the United States: A Review of Recent Sociological Findings. Nat. Hazards 2004, 32, 89–110. [Google Scholar] [CrossRef]
- Adomah Bempah, S.; Olav Øyhus, A. The role of social perception in disaster risk reduction: Beliefs, perception, and attitudes regarding flood disasters in communities along the Volta River, Ghana. Int. J. Disaster Risk Reduct. 2017, 23, 104–108. [Google Scholar] [CrossRef]
- Lindell, M.K.; Hwang, S.N. Households’ Perceived Personal Risk and Responses in a Multihazard Environment. Risk Anal. 2008, 28, 539–556. [Google Scholar] [CrossRef] [PubMed]
- Babcicky, P.; Seebauer, S. The two faces of social capital in private flood mitigation: opposing effects on risk perception, self-efficacy and coping capacity. J. Risk Res. 2017, 20, 1017–1037. [Google Scholar] [CrossRef]
- Marincioni, F.; Appiotti, F.; Ferretti, M.; Antinori, C.; Melonaro, P.; Pusceddu, A.; Oreficini-Rosi, R. Perception and communication of seismic risk: The 6 April 2009 L’Aquila earthquake case study. Earthq. Spectra 2012, 28, 159–183. [Google Scholar] [CrossRef]
- CRED. Natural Disasters in 2017: Lower Mortality, Higher Cost; CRED Crunch; Universite Catholique de Louvain: Brussels, Belgium, 2018. [Google Scholar]
- NDRRMC. Final Report Re Effects of Typhoon “Yolanda” (Haiyan); National Disaster Risk Reduction and Management Council: Quezon City, Philippines, 2014. [Google Scholar]
- Shelter Cluster. Final Analysis of Shelter Recovery; Global Shelter Cluster: Geneva, Switzerland, 2014. [Google Scholar]
- Mas, E.; Bricker, J.; Kure, S.; Adriano, B.; Yi, C.; Suppasri, A.; Koshimura, S. Field survey report and satellite image interpretation of the 2013 Super Typhoon Haiyan in the Philippines. Nat. Hazards Earth Syst. Sci. 2015, 15, 805–816. [Google Scholar] [CrossRef]
- Holden, W.N.; Marshall, S.J. Climate Change and Typhoons in the Philippines: Extreme Weather Events in the Anthropocene. In Integrating Disaster Science and Management; Elsevier: Cambridge, MA, USA, 2018; pp. 407–421. [Google Scholar]
- ASEP. National Structural Code of the Philippines; Association of Structural Engineers of the Philippines: Manila, Philippines, 2010. [Google Scholar]
- UN OCHA Philippines: Leyte Earthquake Snapshot 2017. Available online: https://reliefweb.int/report/philippines/philippines-leyte-earthquake-snapshot-19-july-2017 (accessed on 19 July 2017).
- UN OCHA Philippines: 2017 Key Displacements and Responses. 2018. Available online: https://reliefweb.int/report/philippines/philippines-2017-key-displacements-and-responses (accessed on 15 July 2019).
- Regan, H. Typhoon Phanfone kills at least 16 as it hits Philippines on Christmas Day. Available online: https://www.cnn.com/2019/12/26/asia/philippines-typhoon-phanfone-damage-intl-hnk/index.html (accessed on 22 February 2020).
- NDRRMC. Situational Report No. 20 regarding Preparedness Measures and Effects of Typhoon Ursula (Phanfone) 2020. Available online: https://reliefweb.int/report/philippines/ndrrmc-update-situational-report-no-20-re-preparedness-measures-and-effects (accessed on 15 April 2020).
- CARE. Post-Disaster Shelter in India: A Study of the Long-Term Outcomes of Post-Disaster Shelter Projects; CARE India: New Delhi, India, 2016. [Google Scholar]
- Rohwerder, B. Transitional Shelter in Post-Disaster Contexts; GSDRC, University of Birmingham: Birmingham, UK, 2016. [Google Scholar]
- Groves, R.M.; Fowler, F.J., Jr.; Couper, M.P.; Lepkowski, J.M.; Singer, E.; Tourangeau, R. Survey Methodology; John Wiley & Sons: Hoboken, NJ, USA, 2009. [Google Scholar]
- Mayo, A. Cyclone-Resistant Houses for Developing Countries; Building Research Establishment: Garston, Watford, UK, 1988. [Google Scholar]
- Prevatt, D.O. Improving the cyclone-resistance of traditional Caribbean house construction through rational structural design criteria. J. Wind Eng. Ind. Aerodyn. 1994, 52, 305–319. [Google Scholar] [CrossRef]
- Shanmugasundaram, J.; Arunachalam, S.; Gomathinayagam, S.; Lakshmanan, N.; Harikrishna, P. Cyclone damage to buildings and structures—a case study. J. Wind Eng. Ind. Aerodyn. 2000, 84, 369–380. [Google Scholar] [CrossRef]
- Ginger, J.D.; Henderson, D.J.; Leitch, C.J.; Boughton, G.N. Tropical Cyclone Larry: Estimation of Wind Field and Assessment of Building Damage. Aust. J. Struct. Eng. 2007, 7, 209–224. [Google Scholar] [CrossRef]
- Mukhopadhyay, P.; Dutta, S.C. Strongest Cyclone of the New Millennium in the Bay of Bengal: Strategy of RVS for Nonengineered Structures. Nat. Hazards Rev. 2012, 13, 97–105. [Google Scholar] [CrossRef]
- Kijewski-Correa, T.; Kennedy, A.; Prevatt, D.; Taflanidis, A. Field Reconnaissance Following the Passage of Hurricane Matthew over Haiti’s Tiburon Peninsula. In Proceedings of the 13th Americas Conference on Wind Engineering, Gainesville, Florida, FL, USA, 21–24 May 2017. [Google Scholar]
- Prevatt, D.O.; Dupigny-Giroux, L.-A.; Masters, F.J. Engineering Perspectives on Reducing Hurricane Damage to Housing in CARICOM Caribbean Islands. Nat. Hazards Rev. 2010, 11, 140–150. [Google Scholar] [CrossRef]
- Franco, G.; Stone, H.; Ahmed, B.; Chian, S.; Hughes, F.; Jirouskova, N.; Kaminski, S.; Lopez, J.; van Drunen, N.; Querembas, M. The April 16 2016 Mw 7.8 Muisne Earthquake in Ecuador—Preliminary Observations from the EEFIT Reconnaissance mission of May 24-June 7. In Proceedings of the 16th World Conference on Earthquake Engineering, Santiago, Chile, 9–13 January 2017. [Google Scholar]
- Gautam, D.; Rodrigues, H.; Bhetwal, K.K.; Neupane, P.; Sanada, Y. Common structural and construction deficiencies of Nepalese buildings. Innov. Infrastruct. Solut. 2016, 1, 1–18. [Google Scholar] [CrossRef]
- Buchanan, A.H.; Newcombe, M.P. The performance of residential houses in the Darfield (Canterbury) earthquake. Bull. N. Z. Soc. Earthq. Eng. 2010, 43, 387–392. [Google Scholar] [CrossRef]
- Build Change Post-Disaster Reconnaissance Report: Damage Assessment and Housing and Markets Survey 2013 Bohol Earthquake and Typhoon Yolanda; Build Change: Manila, Philippines, 2014.
- Moroni, M.O.; Astroza, M.; Acevedo, C. Performance and Seismic Vulnerability of Masonry Housing Types Used in Chile. J. Perform. Constr. Facil. 2004, 18, 173–179. [Google Scholar] [CrossRef]
- Naguit, M.; Cummins, P.; Edwards, M.; Ghasemi, H.; Bautista, B.; Ryu, H.; Haynes, M. From Source to Building Fragility: Post-Event Assessment of the 2013 M7.1 Bohol, Philippines, Earthquake. Earthq. Spectra 2017, 33, 999–1027. [Google Scholar] [CrossRef]
- Opdyke, A.; Javernick-Will, A.; Koschmann, M. Assessing the Impact of Household Participation on Satisfaction and Safe Design in Humanitarian Shelter Projects. Disasters 2019, 43, 926–953. [Google Scholar] [CrossRef] [PubMed]
- Opdyke, A.; Javernick-Will, A.; Koschmann, M. Household construction knowledge acquisition in post-disaster shelter training. Int. J. Disaster Risk Reduct. 2018, 28, 131–139. [Google Scholar] [CrossRef]
- PHIVOLCS. The Philippine Earthquake Model: A Probabilistic Seismic Hazard Assessment of the Philippines and Metro Manila; Philippine Institute of Volcanology and Seismology: Quezon City, Philippines, 2017. [Google Scholar]
- Dillman, D.A.; Smyth, J.D.; Christian, L.M. Internet, Phone, Mail, and Mixed-Mode Surveys: the Tailored Design Method, 4th ed.; Wiley: Hoboken, NY, USA, 2014. [Google Scholar]
- Gliem, J.A.; Gliem, R.R. Calculating, Interpreting, And Reporting Cronbach’s Alpha Reliability Coefficient for Likert-Type Scales. In Proceedings of the Midwest Research to Practice Conference in Adult, Continuing, and Community Education, Colombus, OH, USA, 8–10 October 2003. [Google Scholar]
- Judd, C.M.; McClelland, G.H.; Ryan, C.S. Data Analysis: A Model Comparison Approach to Regression, ANOVA, and Beyond, 3rd ed.; Routledge, Taylor & Francis Group: New York, NY, USA, 2017. [Google Scholar]
- Costello, A.; Osborne, J. Best practices in exploratory factor analysis: four recommendations for getting the most from your analysis. Pract. Assess. Res. Eval. 2005, 10, 1–9. [Google Scholar]
- Yong, A.G.; Pearce, S. A Beginner’s Guide to Factor Analysis: Focusing on Exploratory Factor Analysis. Tutor. Quant. Methods Psychol. 2013, 9, 79–94. [Google Scholar] [CrossRef]
- Hauke, J.; Kossowski, T. Comparison of Values of Pearson’s and Spearman’s Correlation Coefficients on the Same Sets of Data. Quaest. Geogr. 2011, 30, 87–93. [Google Scholar] [CrossRef]
- Thissen, D.; Steinberg, L.; Kuang, D. Quick and Easy Implementation of the Benjamini-Hochberg Procedure for Controlling the False Positive Rate in Multiple Comparisons. J. Educ. Behav. Stat. 2002, 27, 77–83. [Google Scholar] [CrossRef]
- Tibshirani, R. Regression Shrinkage and Selection Via the Lasso. J. R. Stat. Soc. Ser. B Methodol. 1996, 58, 267–288. [Google Scholar] [CrossRef]
- Perante, W. 3 in Every 10 Families in Eastern Visayas are Poor 2016. Available online: http://rsso08.psa.gov.ph/article/3-every-10-families-eastern-visayas-are-poor (accessed on 12 July 2019).
- Slovic, P.; Fischhoff, B.; Lichtenstein, S.; Roe, F.J.C. Perceived Risk: Psychological Factors and Social Implications [and Discussion]. Proc. R. Soc. Math. Phys. Eng. Sci. 1981, 376, 17–34. [Google Scholar] [CrossRef]
- Tversky, A.; Kahneman, D. Judgment under uncertainty: Heuristics and biases. Science 1974, 185, 1124–1131. [Google Scholar] [CrossRef] [PubMed]
- Marquez, C. Magnitude 6.5 earthquake rattles Eastern Samar | Inquirer News. Available online: https://newsinfo.inquirer.net/1109746/magnitude-6-5-earthquake-rattles-eastern-samar (accessed on 4 July 2019).
- Miceli, R.; Sotgiu, I.; Settanni, M. Disaster preparedness and perception of flood risk: A study in an alpine valley in Italy. J. Environ. Psychol. 2008, 28, 164–173. [Google Scholar] [CrossRef]
- Slovic, P.; Finucane, M.; Peters, E.; MacGregor, D.M. Risk as Analysis and Risk as Feelings: Some Thoughts about Affect, Reason, Risk, and Rationality. Risk Anal. 2004, 24, 311–322. [Google Scholar] [CrossRef] [PubMed]
- Ong, J.C.; Flores, J.M.; Combinido, P. Obliged to be Grateful: How Local Communities Experienced Humanitarian Actors in the Haiyan Response; Plan International: Woking, UK, 2015. [Google Scholar]
Figure 1.
Map of selected communities (shown with red dots) and their location relative to Typhoon Yolanda, the Leyte earthquake, Tropical Storm Urduja, and Typhoon Ursula.
Figure 1.
Map of selected communities (shown with red dots) and their location relative to Typhoon Yolanda, the Leyte earthquake, Tropical Storm Urduja, and Typhoon Ursula.
Figure 2.
Five of the housing designs observed in this study: (a) One-story reinforced concrete house, (b) one-story wood house, (c) two-story wood house, (d) loftable concrete house, and (e) one-story bamboo house.
Figure 2.
Five of the housing designs observed in this study: (a) One-story reinforced concrete house, (b) one-story wood house, (c) two-story wood house, (d) loftable concrete house, and (e) one-story bamboo house.
Figure 3.
Summaries of respondents’ (a) typhoon safety scores (from 0–12), (b) earthquake safety scores (from 0–12), and (c) difference in safety scores (from –12 to 12; a difference score of 0 means there is no difference in typhoon and earthquake safety scores).
Figure 3.
Summaries of respondents’ (a) typhoon safety scores (from 0–12), (b) earthquake safety scores (from 0–12), and (c) difference in safety scores (from –12 to 12; a difference score of 0 means there is no difference in typhoon and earthquake safety scores).
Figure 4.
Respondents’ expected damage to four housing components in (a) future typhoon and (b) earthquake events.
Figure 4.
Respondents’ expected damage to four housing components in (a) future typhoon and (b) earthquake events.
Figure 5.
Average typhoon and earthquake safety scores based on housing material.
Figure 5.
Average typhoon and earthquake safety scores based on housing material.
Table 1.
Factors hypothesized to influence perceptions of housing safety.
Table 1.
Factors hypothesized to influence perceptions of housing safety.
| Factor | Hypothesized Impact | Source |
|---|
| Housing Design Factors (Community Level 1) |
| Size | Housing characteristics influence how much individuals like or dislike their house and are hypothesized to also influence whether individuals perceive their house to be safe | [28,33] |
| Material | [13,28] |
| Program Factors (Community Level 1) |
| Participation | Participation and training lead to greater resilience, so these factors are hypothesized to also influence perceptions of housing safety | [14,30,34] |
| Training | [14] |
| Relocation | Relocating to a less-hazard prone location will increase perceptions of housing safety | [13] |
| Implementing organization (Government or NGO) | There will be differences in perceptions of housing safety between individuals living in government-built and NGO-built houses | [30] |
| Personal Factors (Individual or Household Level) |
| Gender | Women perceive greater risk than men | [35,36] |
| Education Level | Lower education levels increase perceived risk | [37] |
| Prior Experience | More experience with disasters increases perceived risk | [16,38] |
| Land Tenure Status | More secure tenure leads to greater perceived risk | [39] |
| Social capital | Less social capital or fewer social ties increases perceived risk | [40] |
| Wealth | More wealth decreases perceived risk | [17] |
| Exposure Factors |
| Exposure | Being more exposed to hazards increases perceived risk | [31,32] |
Table 2.
Summary of communities selected for this study.
Table 2.
Summary of communities selected for this study.
Case
No. | Municipality, Province | Program Type | Implementing Organization | # of Stories | Main Structural Material | # of Households in Community | # of Respondents |
|---|
| 1 | Tacloban, Leyte | New Construction | NGO | 1 | Reinforced concrete | 150 | 41 |
| 2 | Tacloban, Leyte | New Construction | NGO | 1 or 2 | Wood | 42 | 21 |
| 3 | Tacloban, Leyte | New Construction | NGO | 1 or 2 | Wood | 484 | 65 |
| 4 | Tacloban, Leyte | Relocation | Government | Loftable2 | Reinforced concrete | 1000 | 68 |
| 5 | Tacloban, Leyte | Relocation | Government | Loftable2 | Reinforced concrete | 558 | 65 |
| 6 | Tacloban, Leyte | Relocation | NGO | 1 | Bamboo | 92 | 32 |
| 7 | Basey, Samar | Relocation | NGO | 1 | Bamboo | 86 | 40 |
| 8 | Guiuan, Eastern Samar | New Construction | NGO | 1 | Reinforced concrete or wood | 63 | 45 |
| 9 | Guiuan, Eastern Samar | New Construction | NGO | 1 | Wood | 105 | 33 |
| 10 | Guiuan, Eastern Samar | Relocation, Transitional | NGO & Government | 1 | Reinforced concrete or wood | 119 | 51 |
Table 3.
Survey questions used to capture perceptions of housing safety.
Table 3.
Survey questions used to capture perceptions of housing safety.
| If a Typhoon Were to Occur, How Do You Think Your House Would Be Affected? |
If a typhoon similar to Typhoon Yolanda were to occur, what would you expect to be the level of damage (No damage, minor damage, major damage, completely destroyed) to your:
- Foundation
- Walls
- Roof covering
- Structure supporting the roof |
| If an Earthquake Were to Occur, How do You Think Your House Would Be Affected? |
If an earthquake similar to the earthquake that occurred in Ormoc in July 2017 were to occur close to here, what would you expect to be the level of damage (No damage, minor damage, major damage, completely destroyed) of your:
- Foundations
- Walls
- Roof covering
- Structure supporting the roof |
To what level do you agree or disagree (Strongly disagree, disagree, agree, strongly agree) with the following statements?
- Given the quality of construction of my house, I feel safe in my house.
- I would need to leave my house if a disaster (earthquake, typhoon, flood, etc.) were to occur. |
Table 4.
Damage states presented to survey respondents.
Table 4.
Damage states presented to survey respondents.
| Damage Level | Definition and Damage Consequences | Score for Analysis |
|---|
| No damage | no visible cracks or tilting, requiring no repairs or only minor repairs | 3 |
| Minor damage | mostly aesthetic damage, requiring “architectural repairs”; displacement of household unlikely | 2 |
| Major damage | damage to structural components, requiring considerable repairs and likely to temporarily displace residents | 1 |
| Completely destroyed | components are rendered unusable and require total reconstruction; temporary displacement of household | 0 |
Table 5.
Influencing factors and their variable type.
Table 5.
Influencing factors and their variable type.
| Level | Factor (Table 1) | Specific Factor Used in this Study | Variable Type | Variable Coding |
|---|
| House design factors | Material | Material of main structural system | Categorical | Wood, Concrete, or Bamboo |
| Size | Number of stories in house | Ordinal | One-story = 1, Loftable = 1.5, Two-story = 2 |
| Program factors | Participation | Participation in planning (location selection, determination of assistance type) | Dichotomous | Did not participate = 0, Participated = 1 |
| Participation in design (floorplan design, material selection) | Dichotomous |
| Participation in construction (site work, construction tasks, buying materials, managing finances, hiring labor, oversight) | Dichotomous |
| Training | Received training in safe design | Dichotomous | No = 0, Yes = 1 |
| Received training on construction | Dichotomous |
| Received training on maintaining a house | Dichotomous |
| Received training on modifying a house | Dichotomous |
| Relocation | Relocated to new community | Categorical | Not relocated, NGO relocation site, or Government relocation site |
| Individual level factors | Gender | Respondent’s gender | Dichotomous | Male = 0, Female = 1 |
| Education level | Respondent’s highest level of education | Ordinal | Elementary = 0, High School = 0.67, College = 1 |
| Prior experience | Witnessed good construction practices | Dichotomous | Disagree = 0, Agree = 1 |
| Had prior design knowledge | Dichotomous |
| Had prior construction knowledge | Dichotomous |
| Witnessed bad construction practices | Dichotomous |
| Saw different damage levels to different designs | Dichotomous | No = 0, Yes = 1 |
| House damaged in recent typhoon | Dichotomous |
| Has lived in a house damaged by earthquake | Dichotomous |
| Number of typhoons experienced | Continuous | |
| Number of earthquakes experience | Continuous | |
| Likes current house better than the previous house | Dichotomous | Disagree = 0, Agree = 1 |
| Feels safer in the current house than previous house | Dichotomous |
| Place to go in a disaster3 | Has a place to go in a disaster | Dichotomous |
| Social capital | Lived in the same community before Yolanda | Dichotomous | No = 0, Yes = 1 |
| Number of neighbors known | Ordinal | None = 0, Some = 1, Most = 2, All = 3 |
| Years lived in the current community | Continuous | |
| Household level factors | House as a place of business3 | House is also used for business | Dichotomous | Disagree = 0, Agree = 1 |
| Land tenure status | Land tenure (secure means household owns the title to the land or were relocated to a community constructed by the government and are making payments to earn the title) | Dichotomous | Insecure = 0, Secure = 1 |
| Original occupants3 | Original occupants of house | Dichotomous | No = 0, Yes = 1 |
| Wealth | Household has savings | Dichotomous |
| Weekly income (PHP) | Continuous | |
| Weekly expenses (PHP) | Continuous | |
| Exposure factors | Storm surge exposure | Distance from community hall to shoreline (m) | Continuous | |
| Wind/earthquake exposure | Community located in Tacloban or Guiuan | Dichotomous | 0 = Tacloban, 1 = Guiuan |
Table 6.
New participation, training, and prior experience variables after exploratory factor analysis.
Table 6.
New participation, training, and prior experience variables after exploratory factor analysis.
| New Variable | Participation in Design | Participation in Construction Labor | Participation in Construction Decisions | Training | Witnessed Construction Practices | Number of Hazards Experienced | Previous Damage from Disasters | Prefers Current House |
|---|
| Variables from Table 5 included in new variable | Participated in determining assistance type | Participated in site work | Participated in buying materials | Received training on safe design | Witnessed good construction practices | Number of typhoons experienced | House damaged in recent typhoon | Likes current house better than the previous house |
| Participated in floorplan design | Participated in construction tasks | Participated in hiring labor | Received training on construction | Witnessed bad construction practices | Number of earthquakes experienced | Has lived in a house damaged by earthquake | Feels safer in the current house than previous house |
| Participated in material selection | | Participated in managing finances | Received training on maintenance | | | | |
| | | | Received training on modifying a house | | | | |
| Variable coding | Ordinal—0 = no participation in design. Add 1 point for participation in each additional activity. 3 = participation in all design activities. | Ordinal—0 = no participation in construction labor. Add 1 point for participation in each additional activity. 2 = participation in all construction labor. | Ordinal—0 = no participation in construction decisions. Add 1 point for participation in each additional activity. 3 = participation in all construction decisions. | Ordinal—0 = no training. Add 1 point for each additional training received. 4 = received training on all topics. | Ordinal—0 = witnessed only bad practices. 0.5 = witnessed both good and bad practices. 1 = witnessed only good practices. | Continuous—sum of hazards experienced | Ordinal—0 = no house damage in any disaster. 0.5 = house damage in either typhoon or earthquakes 1 = house damage in both typhoons and earthquakes. | Ordinal—0 = likes better and feels safer in previous house. 0.5 = likes better or feels safer in the current house. 1 = likes better and feels safer in the current house. |
| Cronbach’s alpha | 0.74 | 0.89 | 0.84 | 0.93 | 0.70 | 0.69 | 0.60 | 0.64 |
Table 7.
Summary of respondent demographics.
Table 7.
Summary of respondent demographics.
| Demographic Characteristic | Number of Respondents (%) |
|---|
| Gender | |
| Male | 109 (24%) |
| Female | 342 (76%) |
| Education Level | |
| Elementary | 95 (21%) |
| High School | 230 (51%) |
| University | 126 (28%) |
| Land Tenure | |
| Secure | 343 (76%) |
| Insecure | 108 (24%) |
| Have Savings | |
| Yes | 99 (22%) |
| No | 352 (78%) |
| Income Level | |
| Above Poverty Threshold | 144 (32%) |
| Below Poverty Threshold | (68%) |
Table 8.
Correlation between significant personal factors and typhoon safety and earthquake safety scores.
Table 8.
Correlation between significant personal factors and typhoon safety and earthquake safety scores.
| Factor | Typhoon Safety Score | Earthquake Safety Score |
|---|
| Witnessed construction practices | 0.21*** | 0.31*** |
| Previous damage in disasters | NS | −0.25*** |
| Prefers current house to previous house | 0.24*** | 0.24*** |
| Original occupants of house | −0.15** | NS |
| Has a place to go in a disaster | −0.14** | NS |
| Lived in the same community before Yolanda | NS | 0.14** |
| Education level | NS | 0.12** |
| Weekly household income | NS | 0.11* |
Table 9.
Significant influencing factors and their coefficients for the typhoon and earthquake safety models.
Table 9.
Significant influencing factors and their coefficients for the typhoon and earthquake safety models.
| Factor | “Original” Typhoon Safety | “Full”
Typhoon Safety | “Original” Earthquake Safety | “Full” Earthquake Safety |
|---|
| Intercept | 2.91 | 1.18 | 0.91 | 0.94 |
| House design factors | | | | |
Live in a concrete house
(Concrete = 0.67, Wood = −0.33, Bamboo = −0.33) | 0.80 | 0.55 | – | – |
Live in a bamboo house
(Concrete = 0, Wood = −0.5, Bamboo = 0.5) | 2.71 | 2.81 | 0.76 | 0.69 |
| Number of stories | – | – | – | – |
| Program factors | | | | |
| Participated in location selection | – | – | – | – |
| Participated in house design | – | 0.31 | 1.33 | 1.30 |
| Participated in construction labor | – | – | 0.44 | 0.46 |
| Participated in construction design | – | −0.32 | – | – |
| Participated in construction oversight | – | – | – | – |
| Training | – | – | – | – |
Live in a relocation site
(Not relocated = −0.67, Relocated (NGO or Government) = 0.33) | – | – | −0.69 | −0.59 |
Live in a government relocation site
(Not relocated = 0, NGO relocated = −0.5, Government relocated = 0.5) | – | – | −0.29 | −0.23 |
| Personal factors | | | | |
| Witnessed construction practices | 1.56 | 1.48 | 1.99 | 2.02 |
| Prefers current house to previous house | 1.09 | 1.66 | 2.13 | 2.10 |
| Original occupants of house | −1.42 | – | – | – |
| Has a place to go in a disaster | – | – | – | – |
| Lived in the same community before Yolanda | – | – | – | – |
| Education level | – | – | 2.49 | 2.44 |
| Weekly household income | – | – | – | – |
| Exposure factors | | | | |
| Live in Guiuan | −0.21 | −0.03 | −1.26 | −1.22 |
| Storm surge exposure | – | – | – | – |
| Summary statistics | | | | |
| N | 445 | 404 | 407 | 407 |
| R2 | 0.27 | 0.12 | 0.17 | 0.17 |
| λ | 0.11 | 0.17 | 0.15 | 0.16 |
© 2020 by the authors. Licensee MDPI, Basel, Switzerland. This article is an open access article distributed under the terms and conditions of the Creative Commons Attribution (CC BY) license (http://creativecommons.org/licenses/by/4.0/).


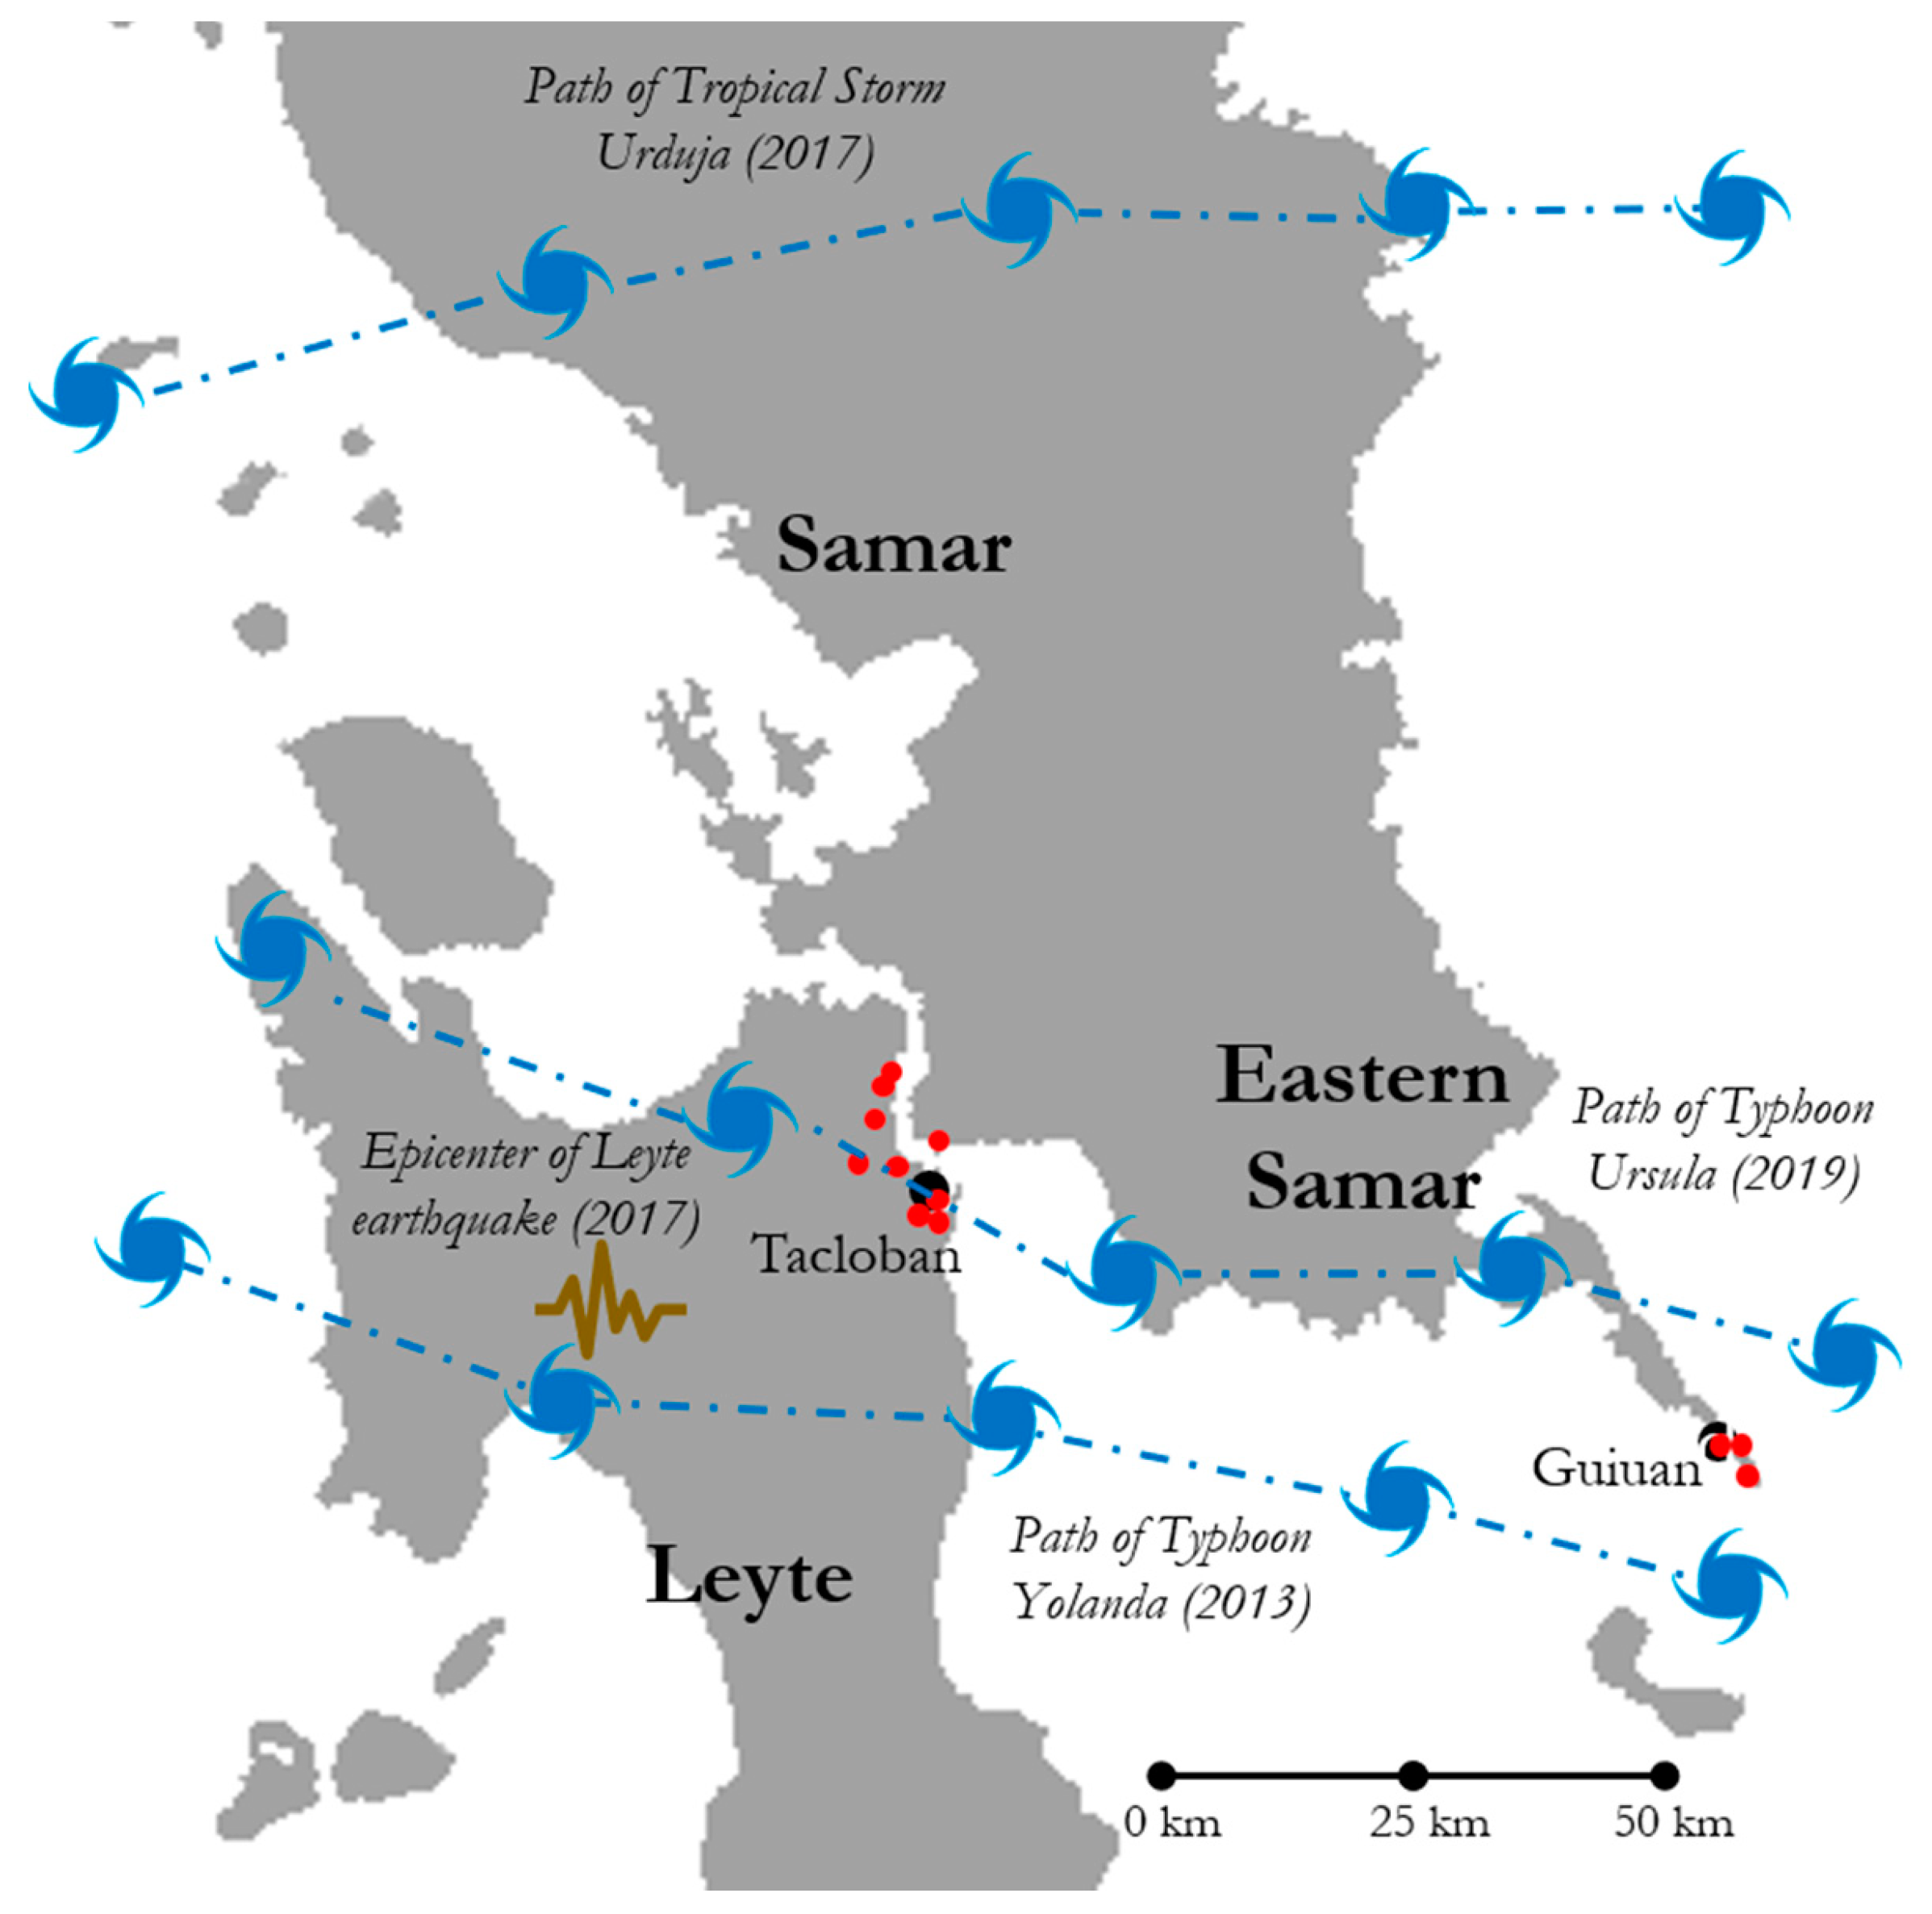
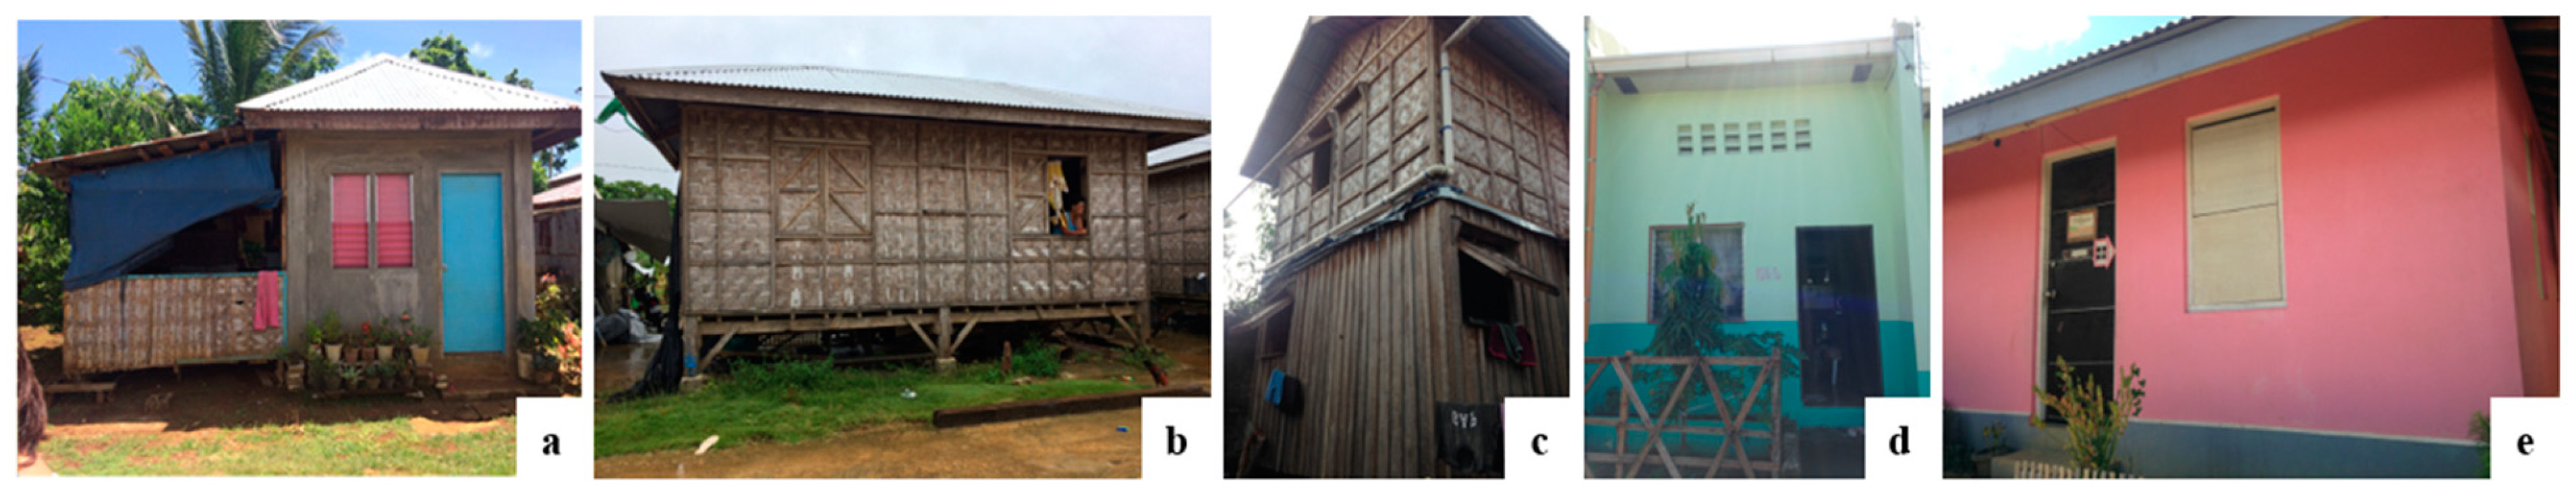
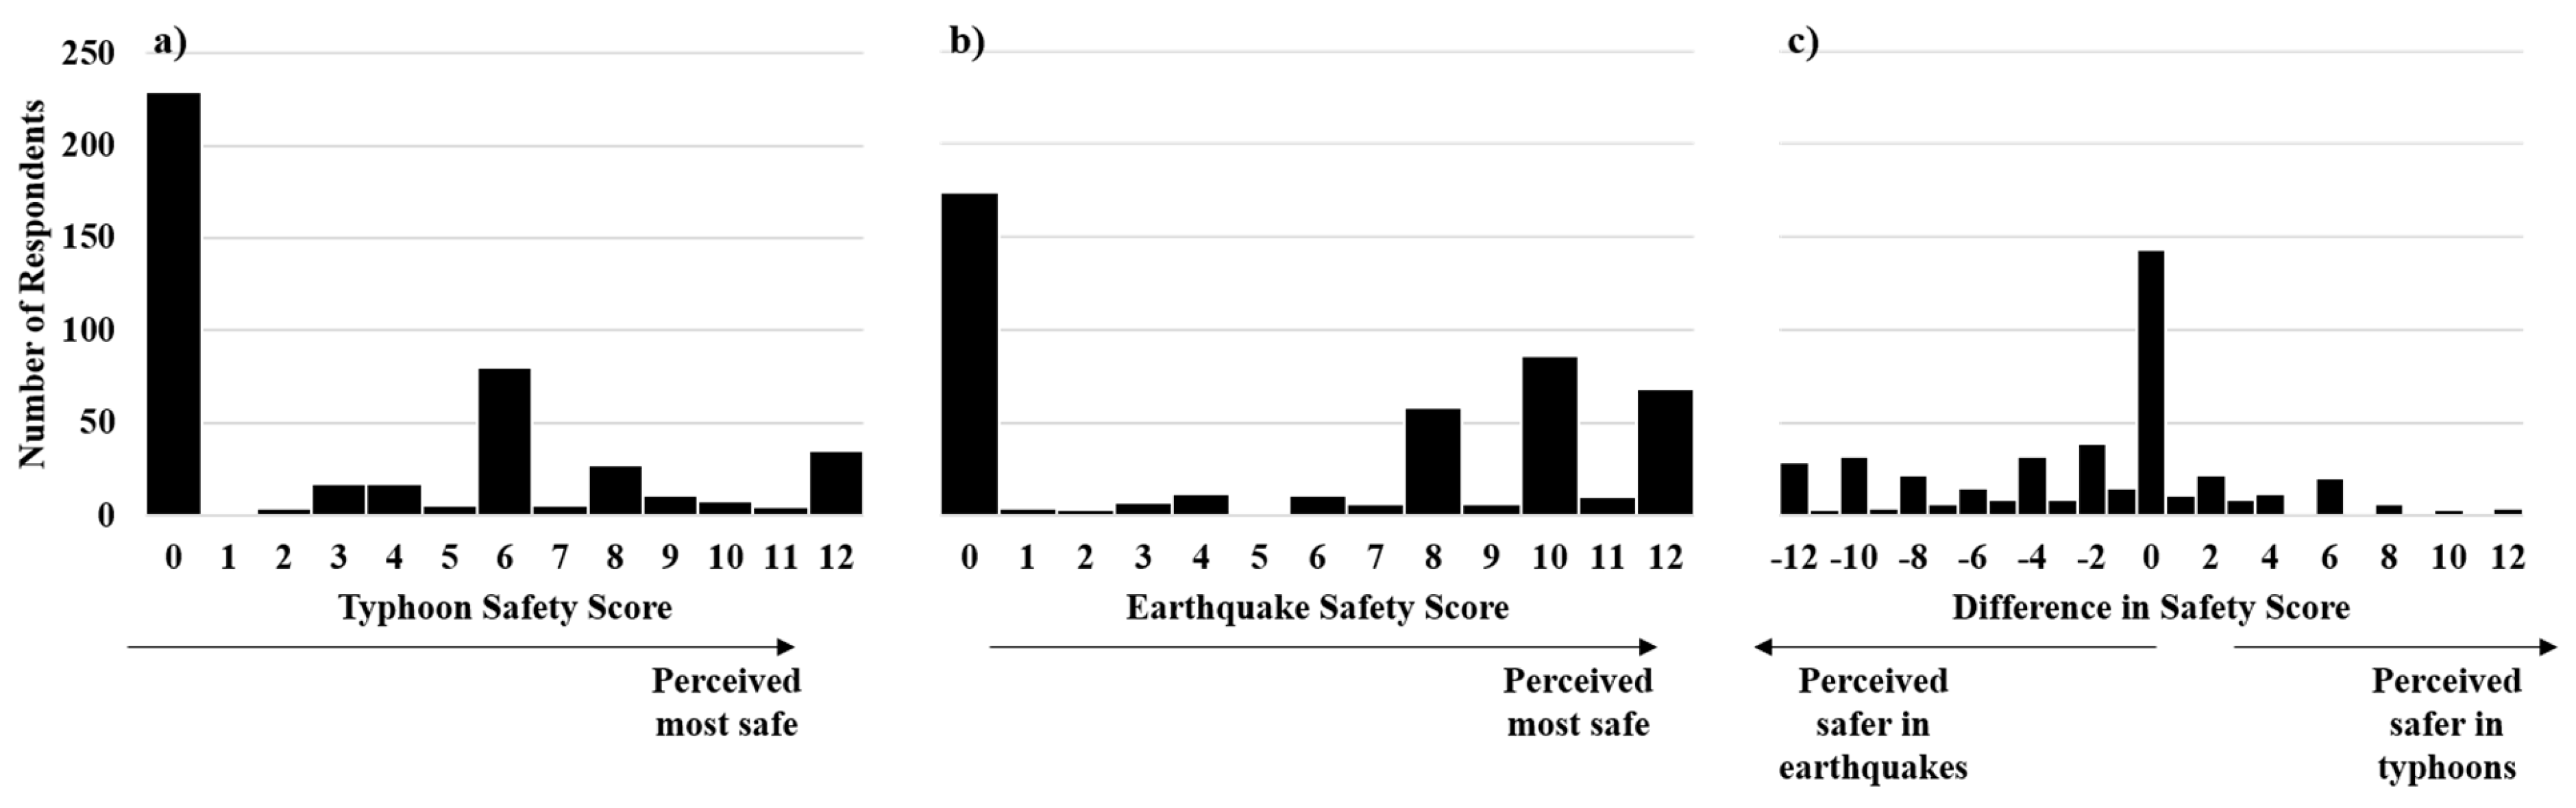
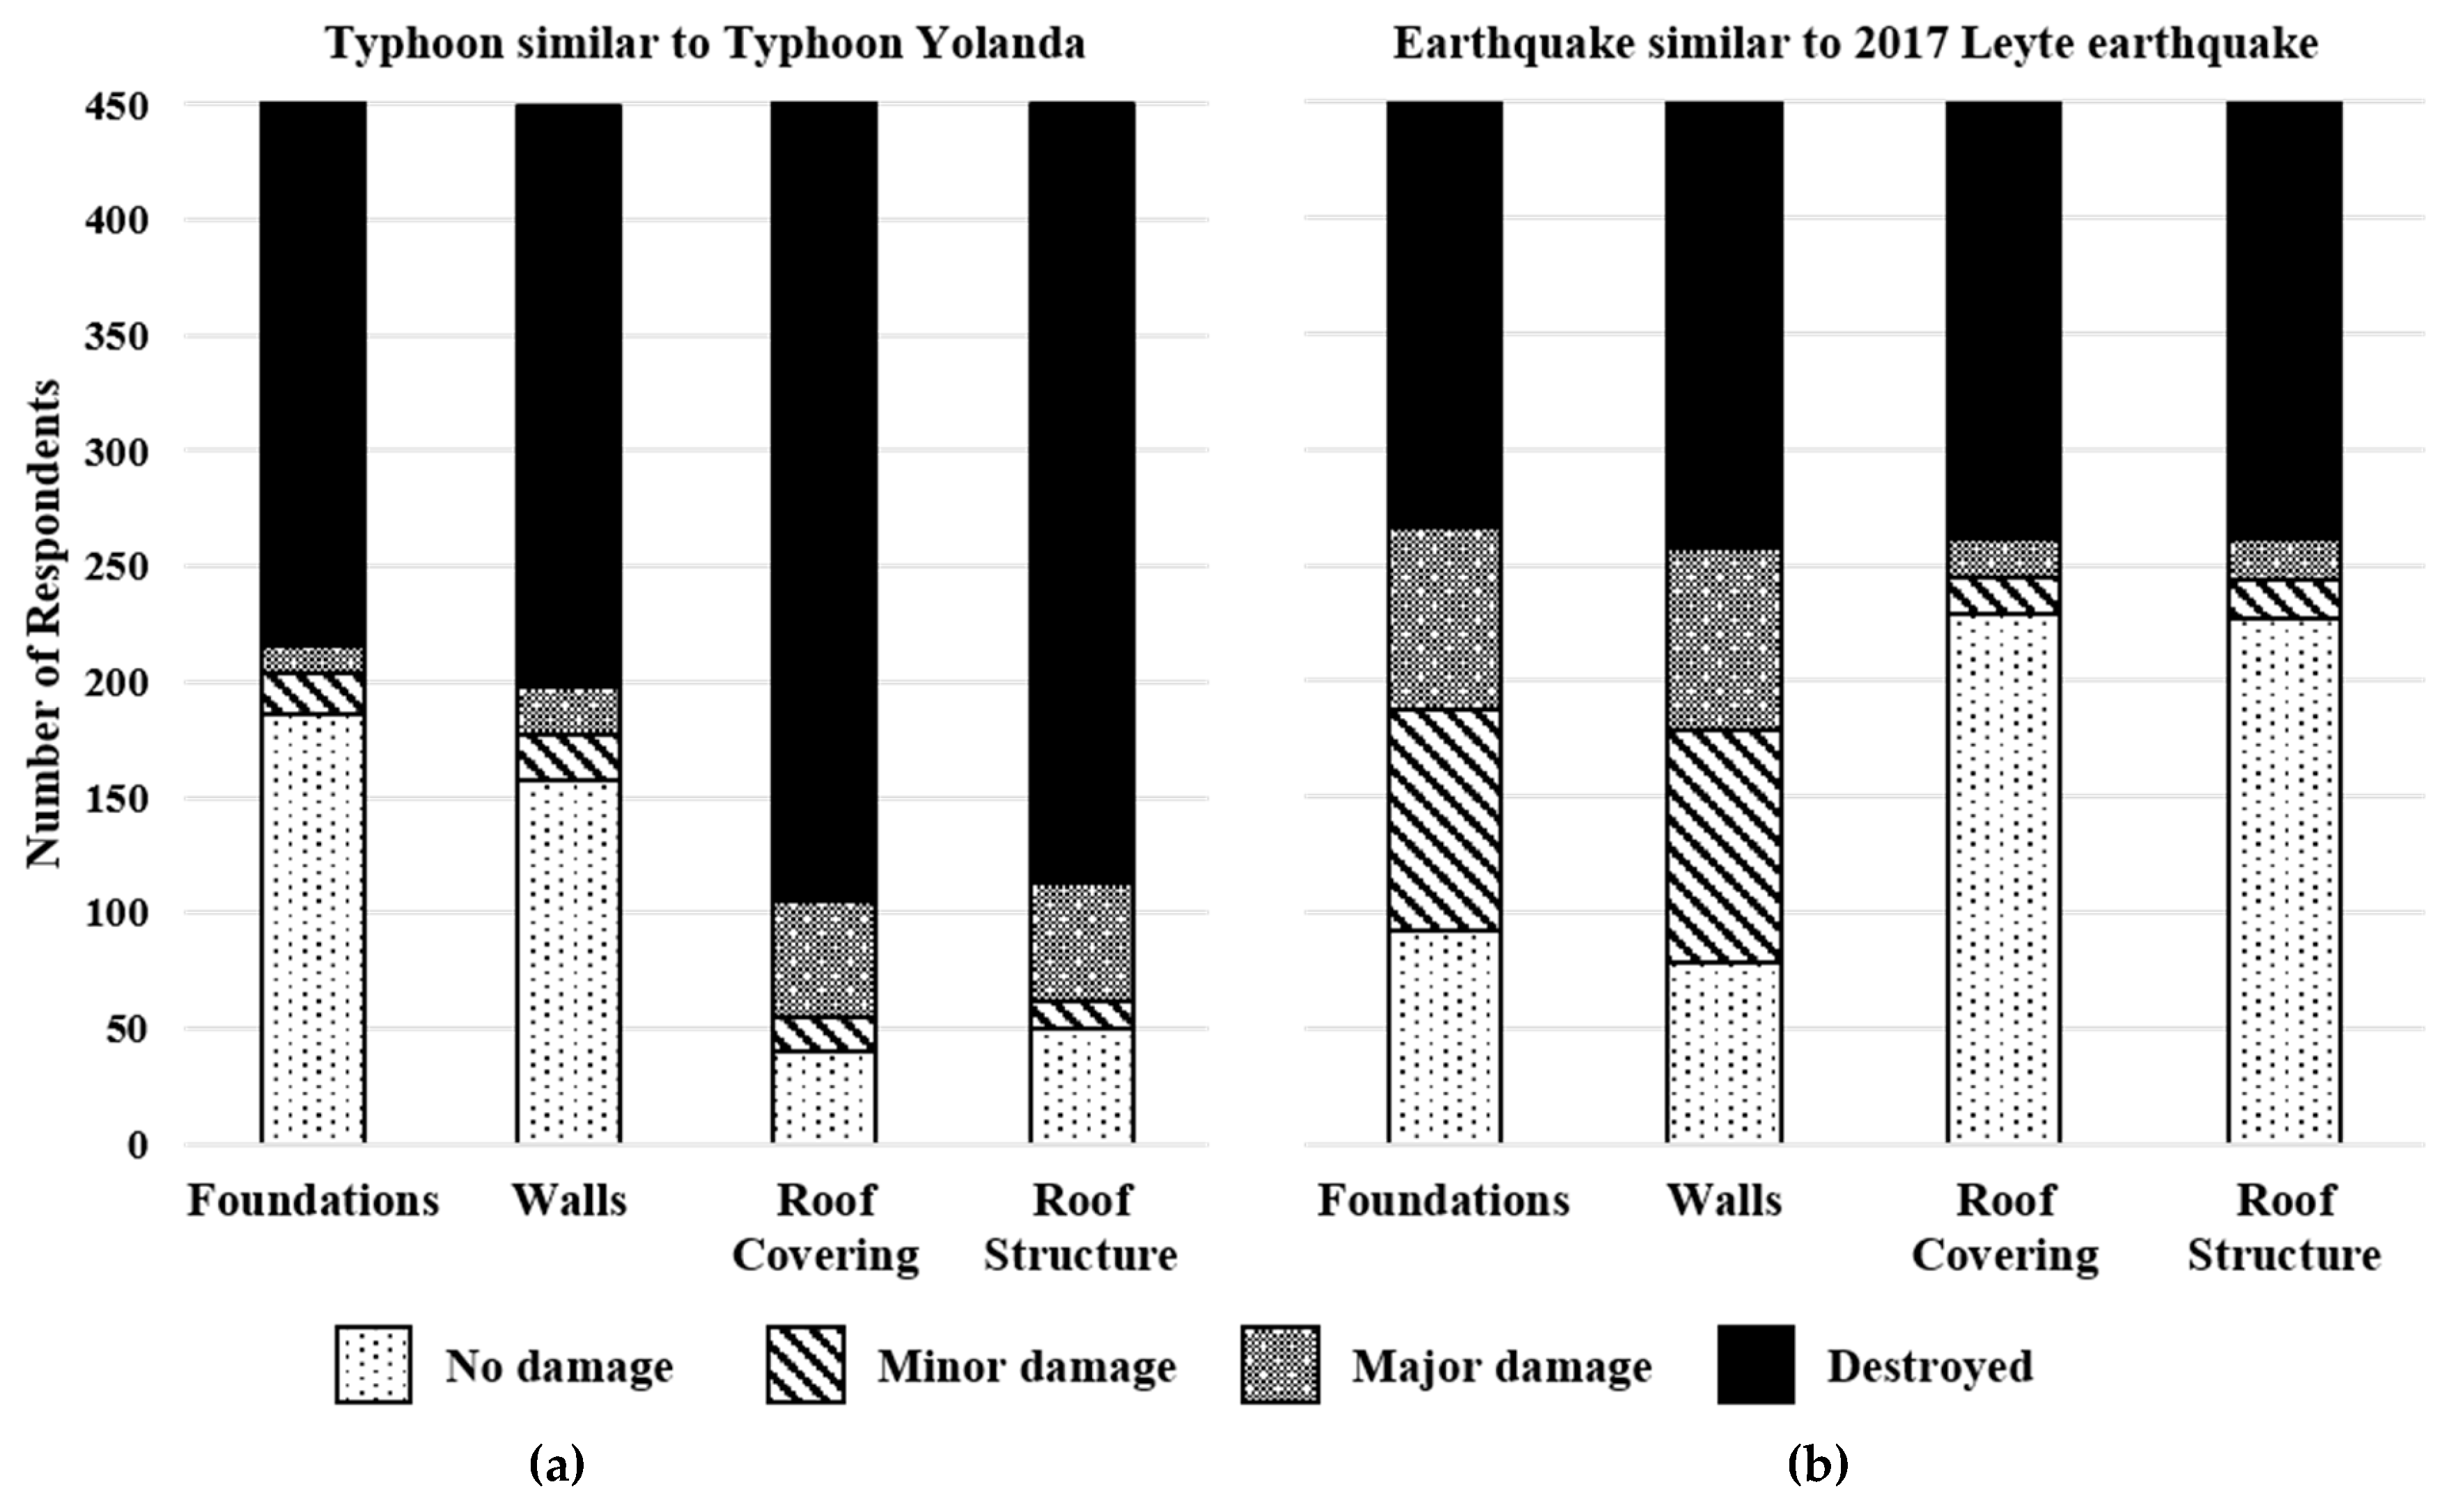
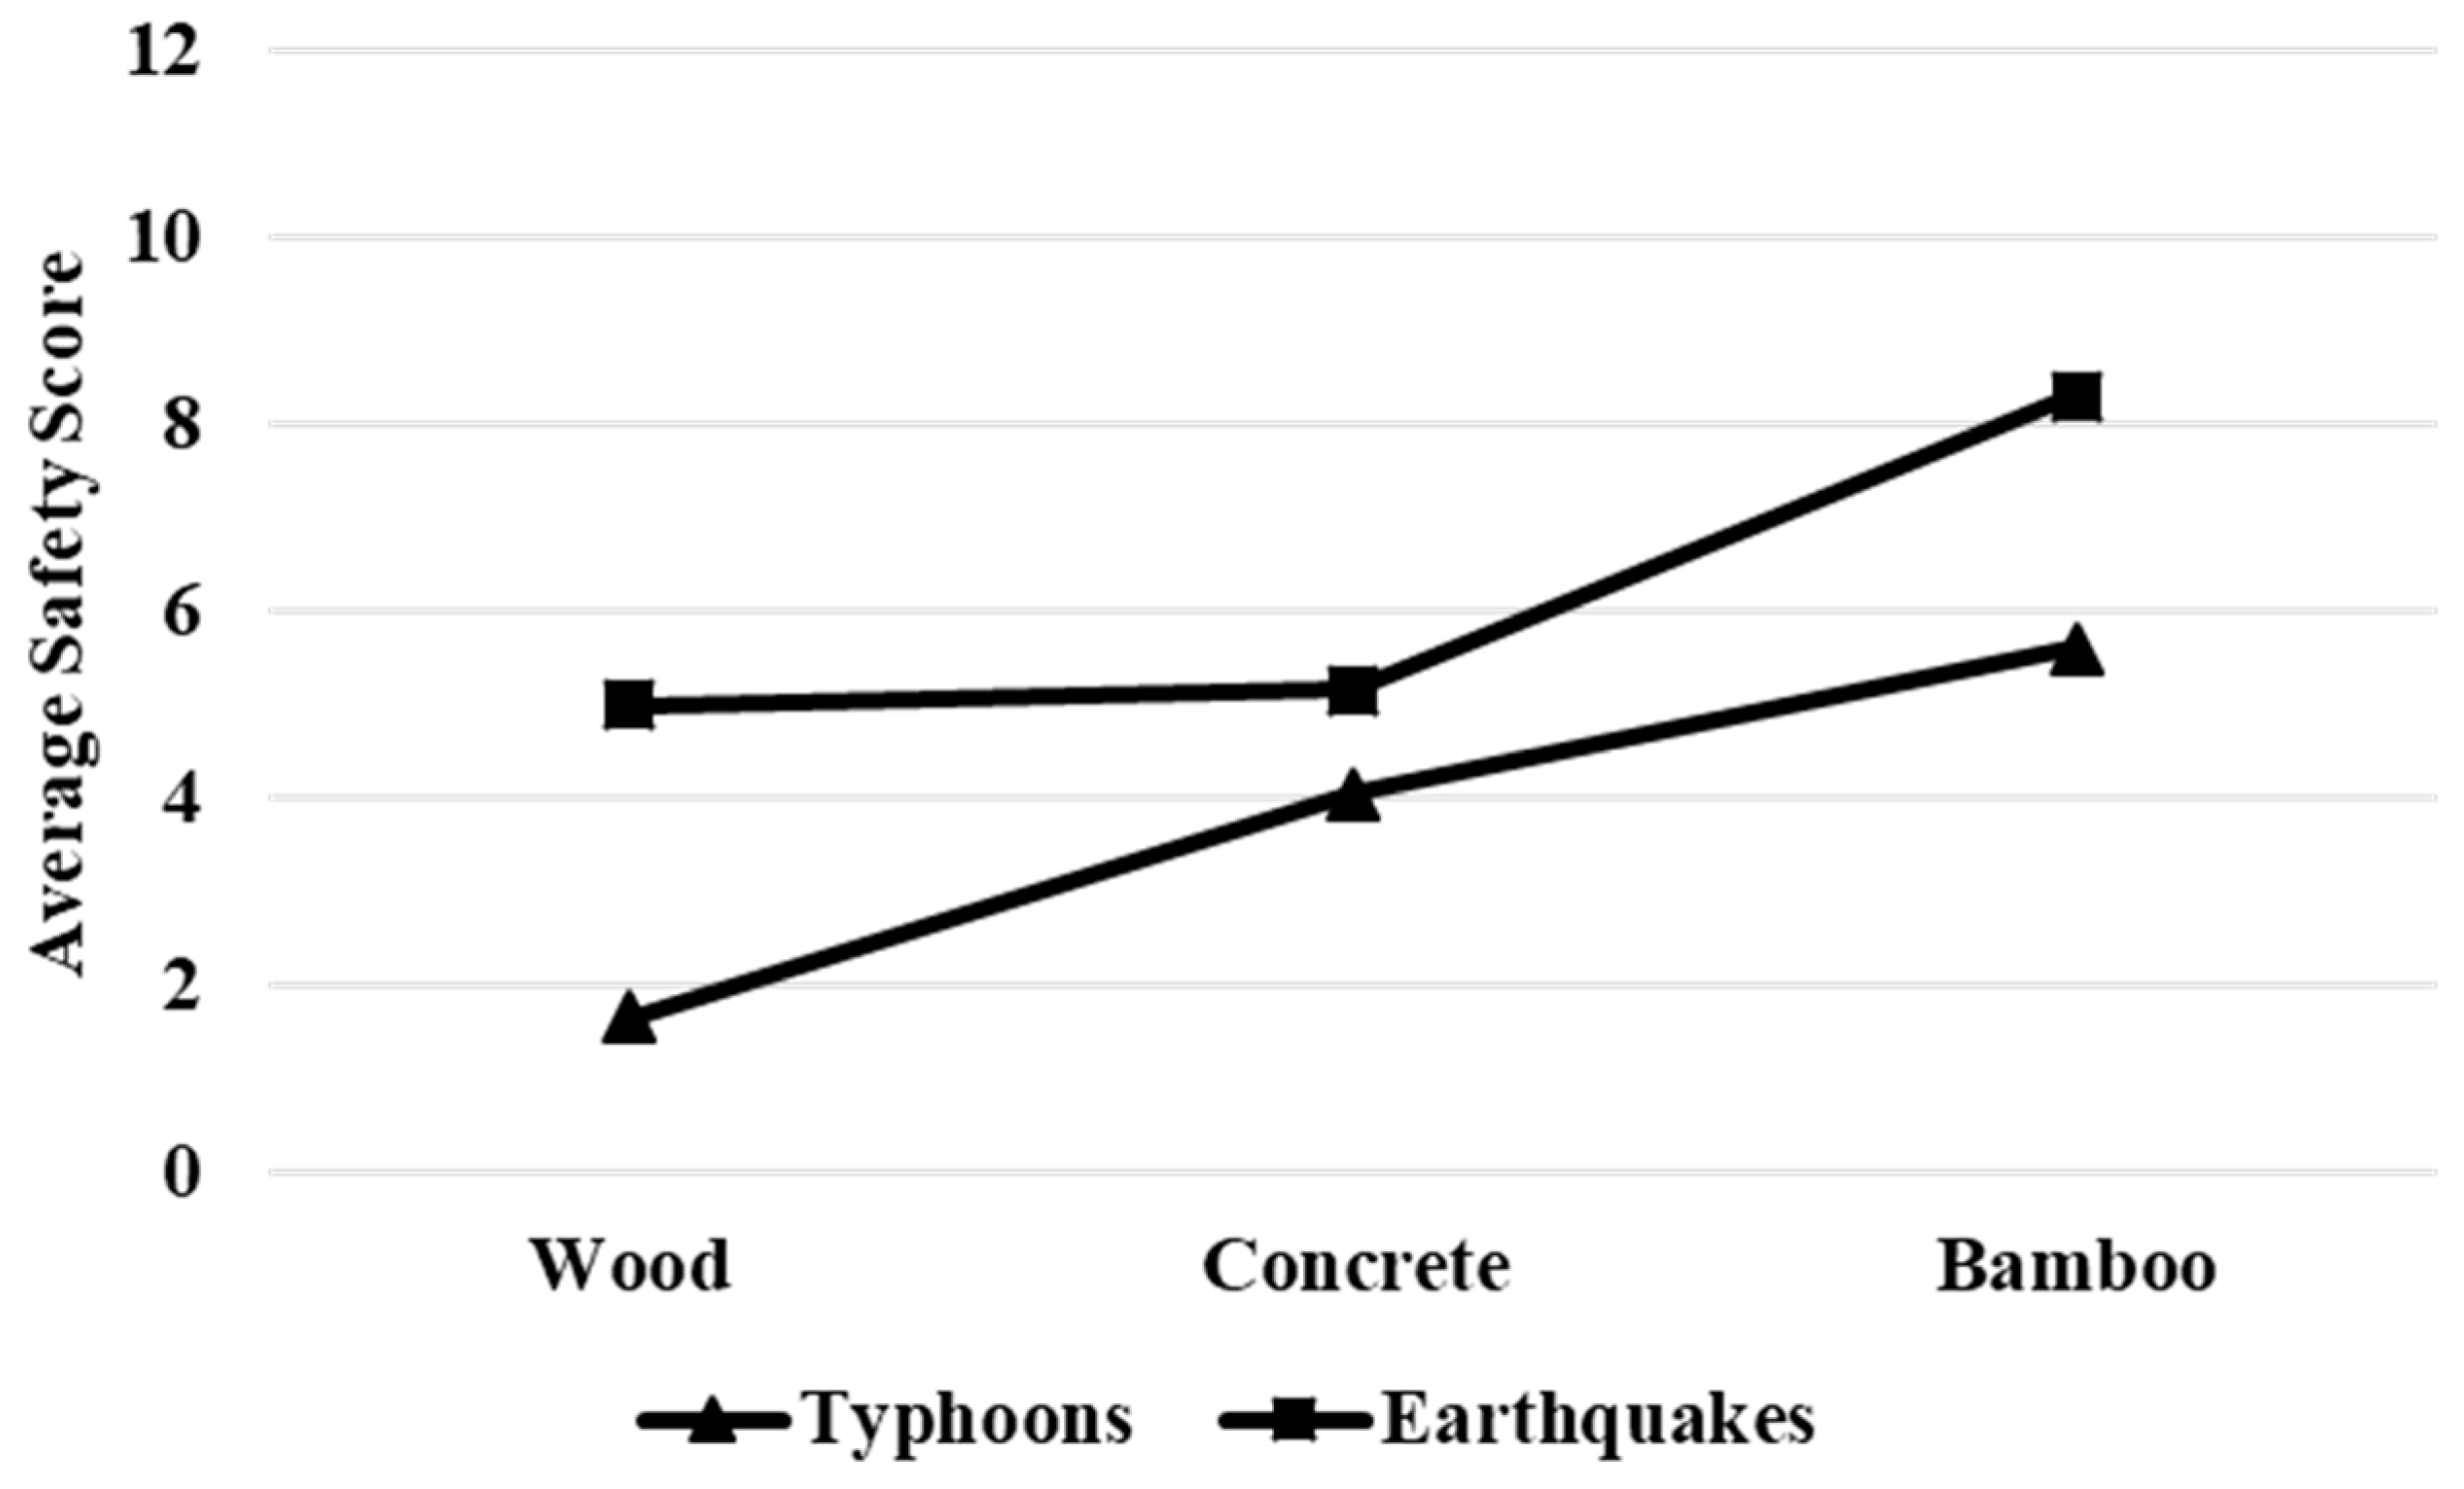


