1. Introduction
Owing to the low number of inhabitants and the low population density in rural areas, providing public transport for several small villages or hamlets is a challenge in the whole of Europe. Furthermore, traditional public transport is hardly sustainable financially, while ensuring only a low-level service. In order to enhance the efficiency of the system, several programs have been launched by the European Union (e.g., SMARTA [
1], SMACKER [
2]), which focus on presenting the best practices of certain European areas. In the examples cited in SMARTA [
1] and Pettersson [
3], hamlets are served by demand responsive traffic (DRT). These services were established with a common purpose (i.e., serving areas with low population density; establishing social cohesion; lowering operational costs), while operation parameters cover a broad spectrum (financing, pricing, availability, relationship with the traditional public transport, fleet size). While DRT services were available for only a closed circle of people at the beginning of the 1990s (e.g., for the disabled), today open-access systems are spreading.
The above views are supported by Wang et al. [
4], whose case study is presented for providing commuter services for people living in rural areas with low population density in England. A two-way approach is applied to a Dublin case by Weir et al. [
5], who aim to reduce transport performance and establish traffic policies. The development of interurban traffic in Great Britain after lowering subsidies is explored by Takeuchi et al. [
6] from an economic point of view. In the same area, the preferences of users concerning an existing DRT system were also surveyed by Davison et al. [
7], and a demand-based model was also set up. General guidelines are listed by Ellis et al. [
8] for DRT systems in areas with small villages, while Camacho Alcocer et al. [
9] analyze the possible implementation of electric vehicles.
Analytical models have been developed by Papanikolaou et al. [
10], Kim [
11], and Huang et al. [
12]. Papanikolaou et al. [
10] compare traditional bus and DRT systems, while Kim [
11] analyzes the feasibility of implementing the DRT service based on using multi-agent transport simulation for different travel fees. Huang et al. [
12] use numerical experiments. A zonal strategy is described by Wang et al. [
13] to optimize DRT with a mathematical model based on costs.
Vitale Brovarone et al. [
14] present the results of the ESPON URRUC project, aiming at enhancing vertical (i.e., between actors at the different territorial levels) and horizontal (i.e., between different policy sectors) coordination towards greater rural accessibility for four non-metropolitan regions in Europe. Xiong et al. [
15] investigate the optimal routing design problem of a community shuttle system feeding metro stations based on a demand-responsive service. Detti et al. [
16] devised and tested a multimodal system architecture, named Bonvoyage. They propose an innovative solution implementing such services and join nation-wide NoSQL databases that contain travel information by exploiting a novel telecommunication paradigm for DRT.
Zheng et al. [
17] address the problem of sustainable development of metropolises that is hindered by traffic congestion and air pollution. To mitigate these problems, a new type of demand-responsive service as an alternative to inefficient “door-to-door” DRT service is proposed. Torkjazi et al. [
18] explore the idea of allowing vehicles to pick up those unscheduled customers by the DRT service who are in close proximity to the prescheduled stops.
A review of the relevant literature reveals that earlier studies explore existing demand responsive traffic systems based on few parameters. These prove that if a DRT system is introduced as an extra service, operational problems are due to arise in the long run. Consequently, a better choice might be to transform the existing traditional public transport service into a demand responsive system, which is capable of providing a higher level of service without a rise in the costs. The present study explores a solution of this kind with a complex methodology applicable in a general manner, demonstrated by application to a Hungarian case study.
2. Methods
Before presenting the methodology applied here in detail, the differences between this system and suggestions presented in earlier studies are described. Papanikolaou et al. [
10] developed generic analytical formulations. The analytical model is based on operational and user costs (which contain journey costs of travel time, walking time etc.) for bus and DRT services, the data are presented as a function of frequency and passengers per hour. Kim [
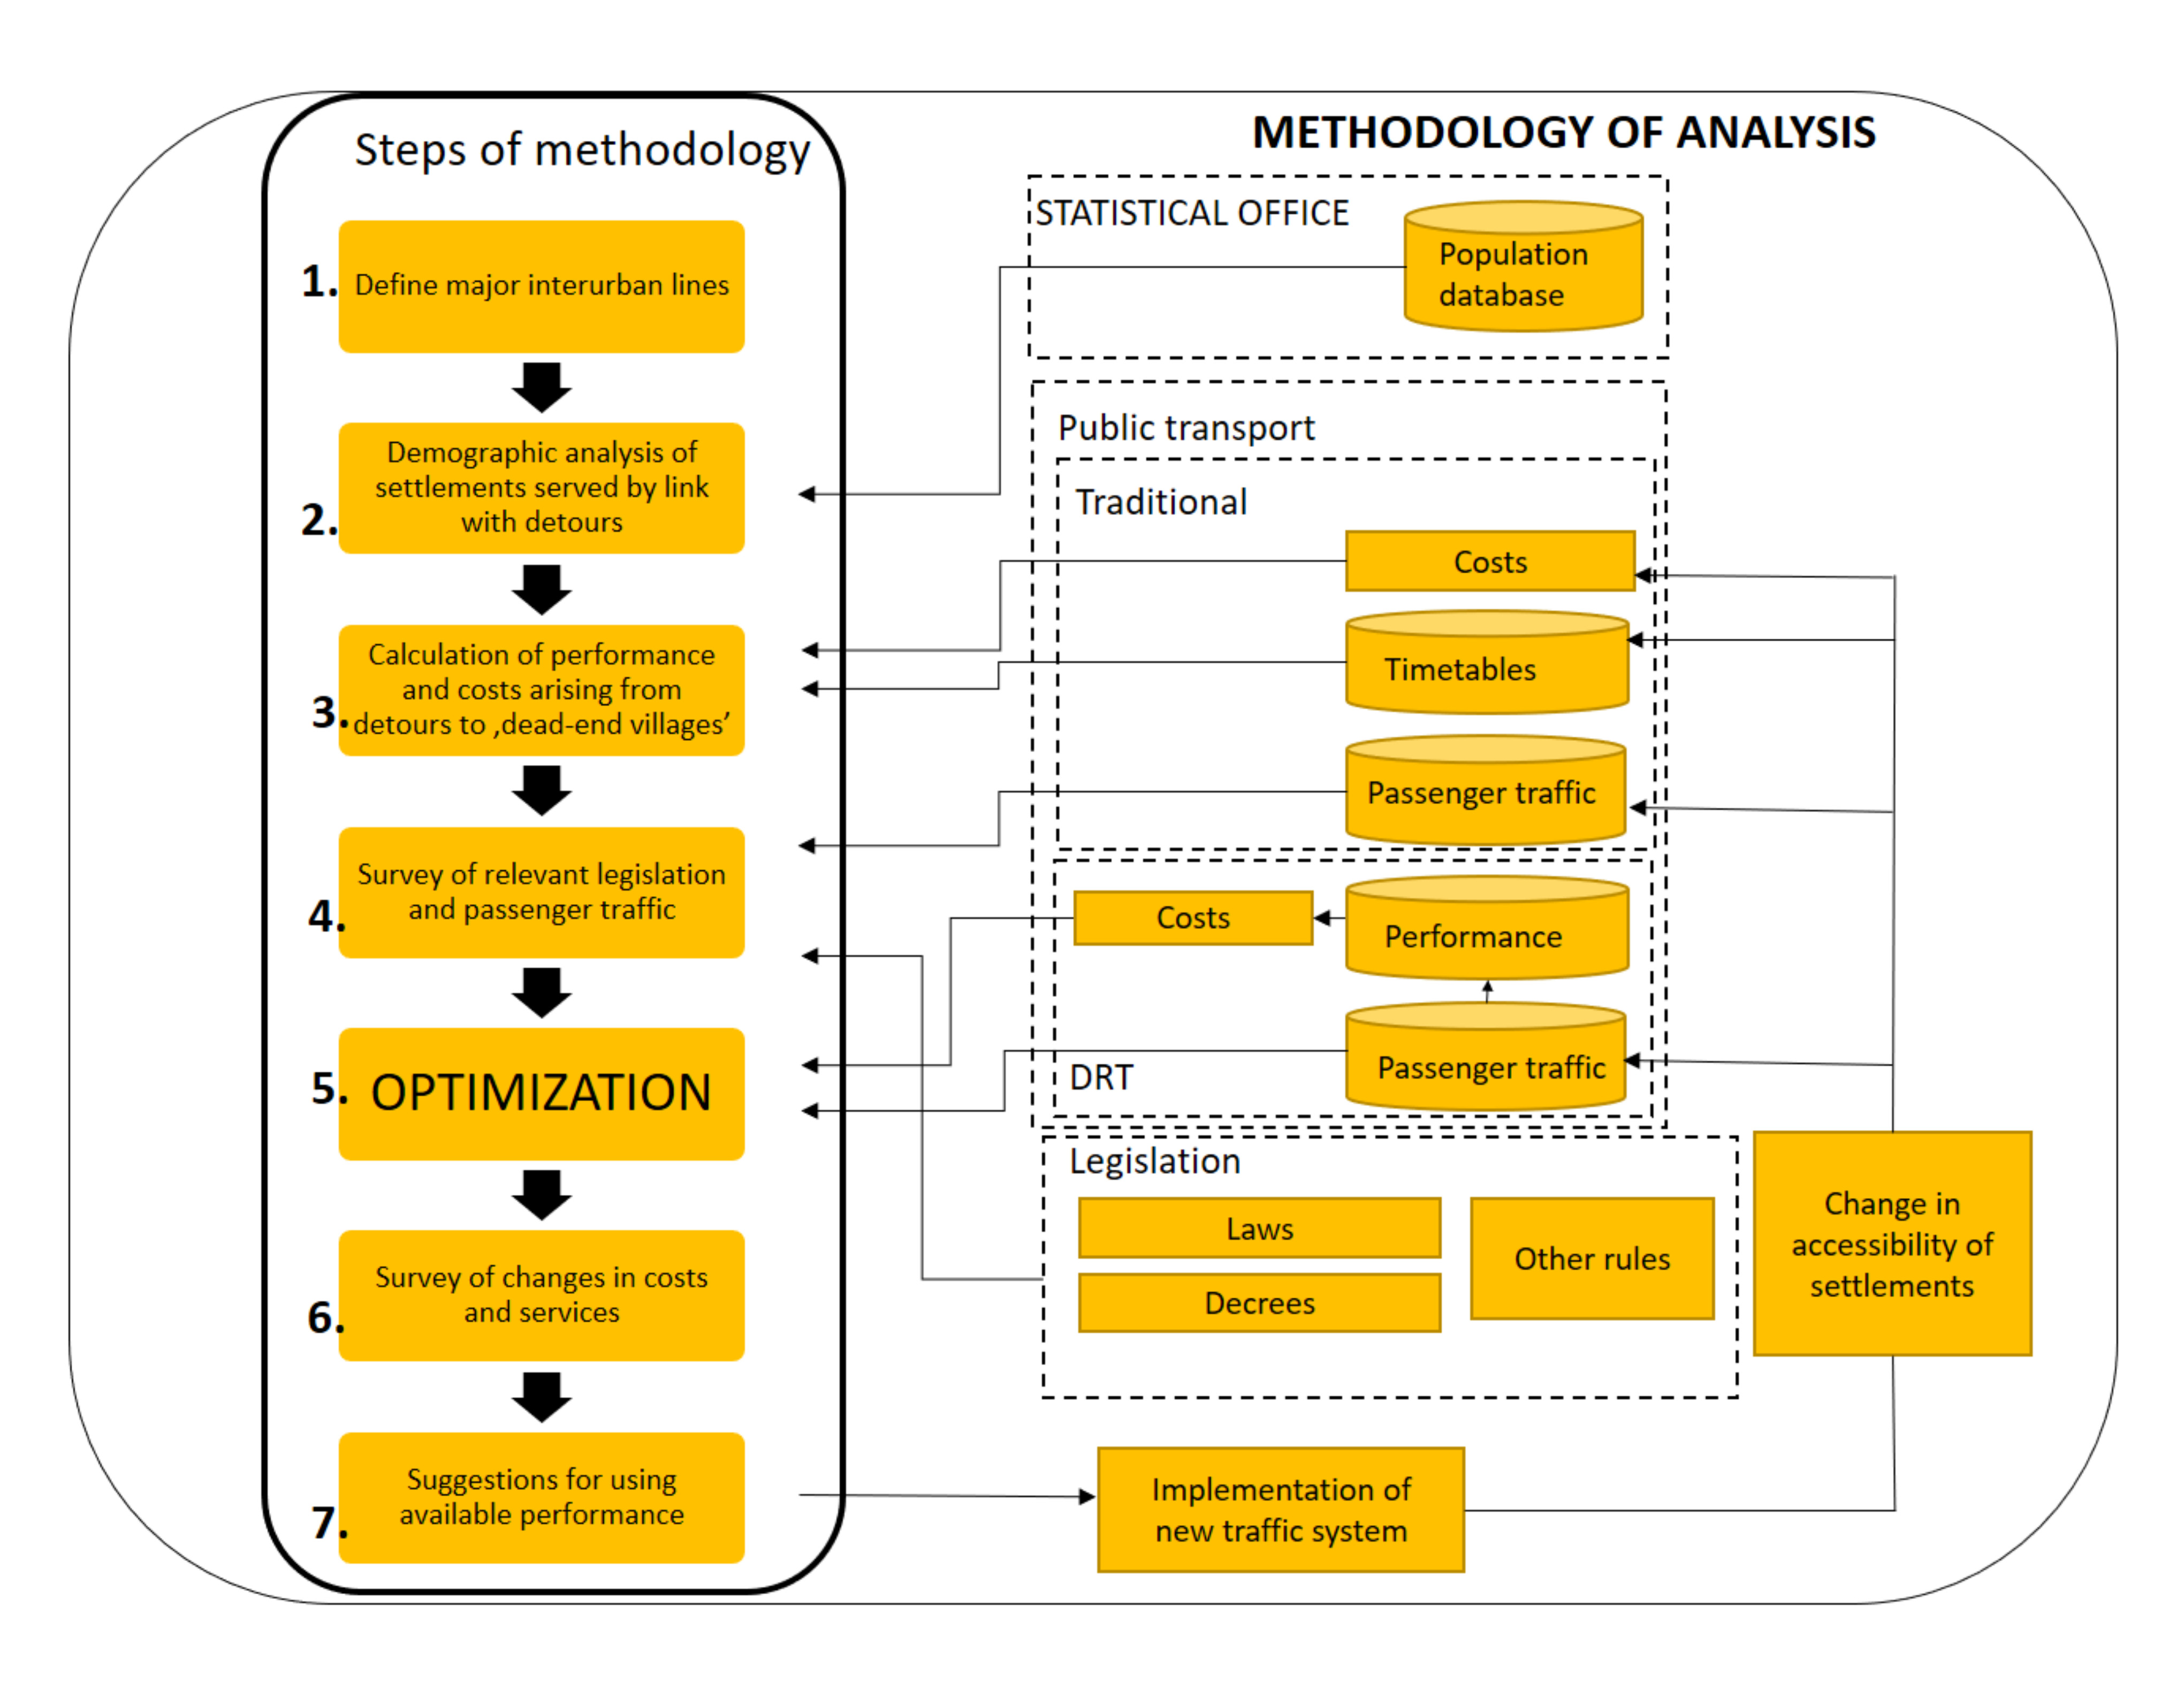
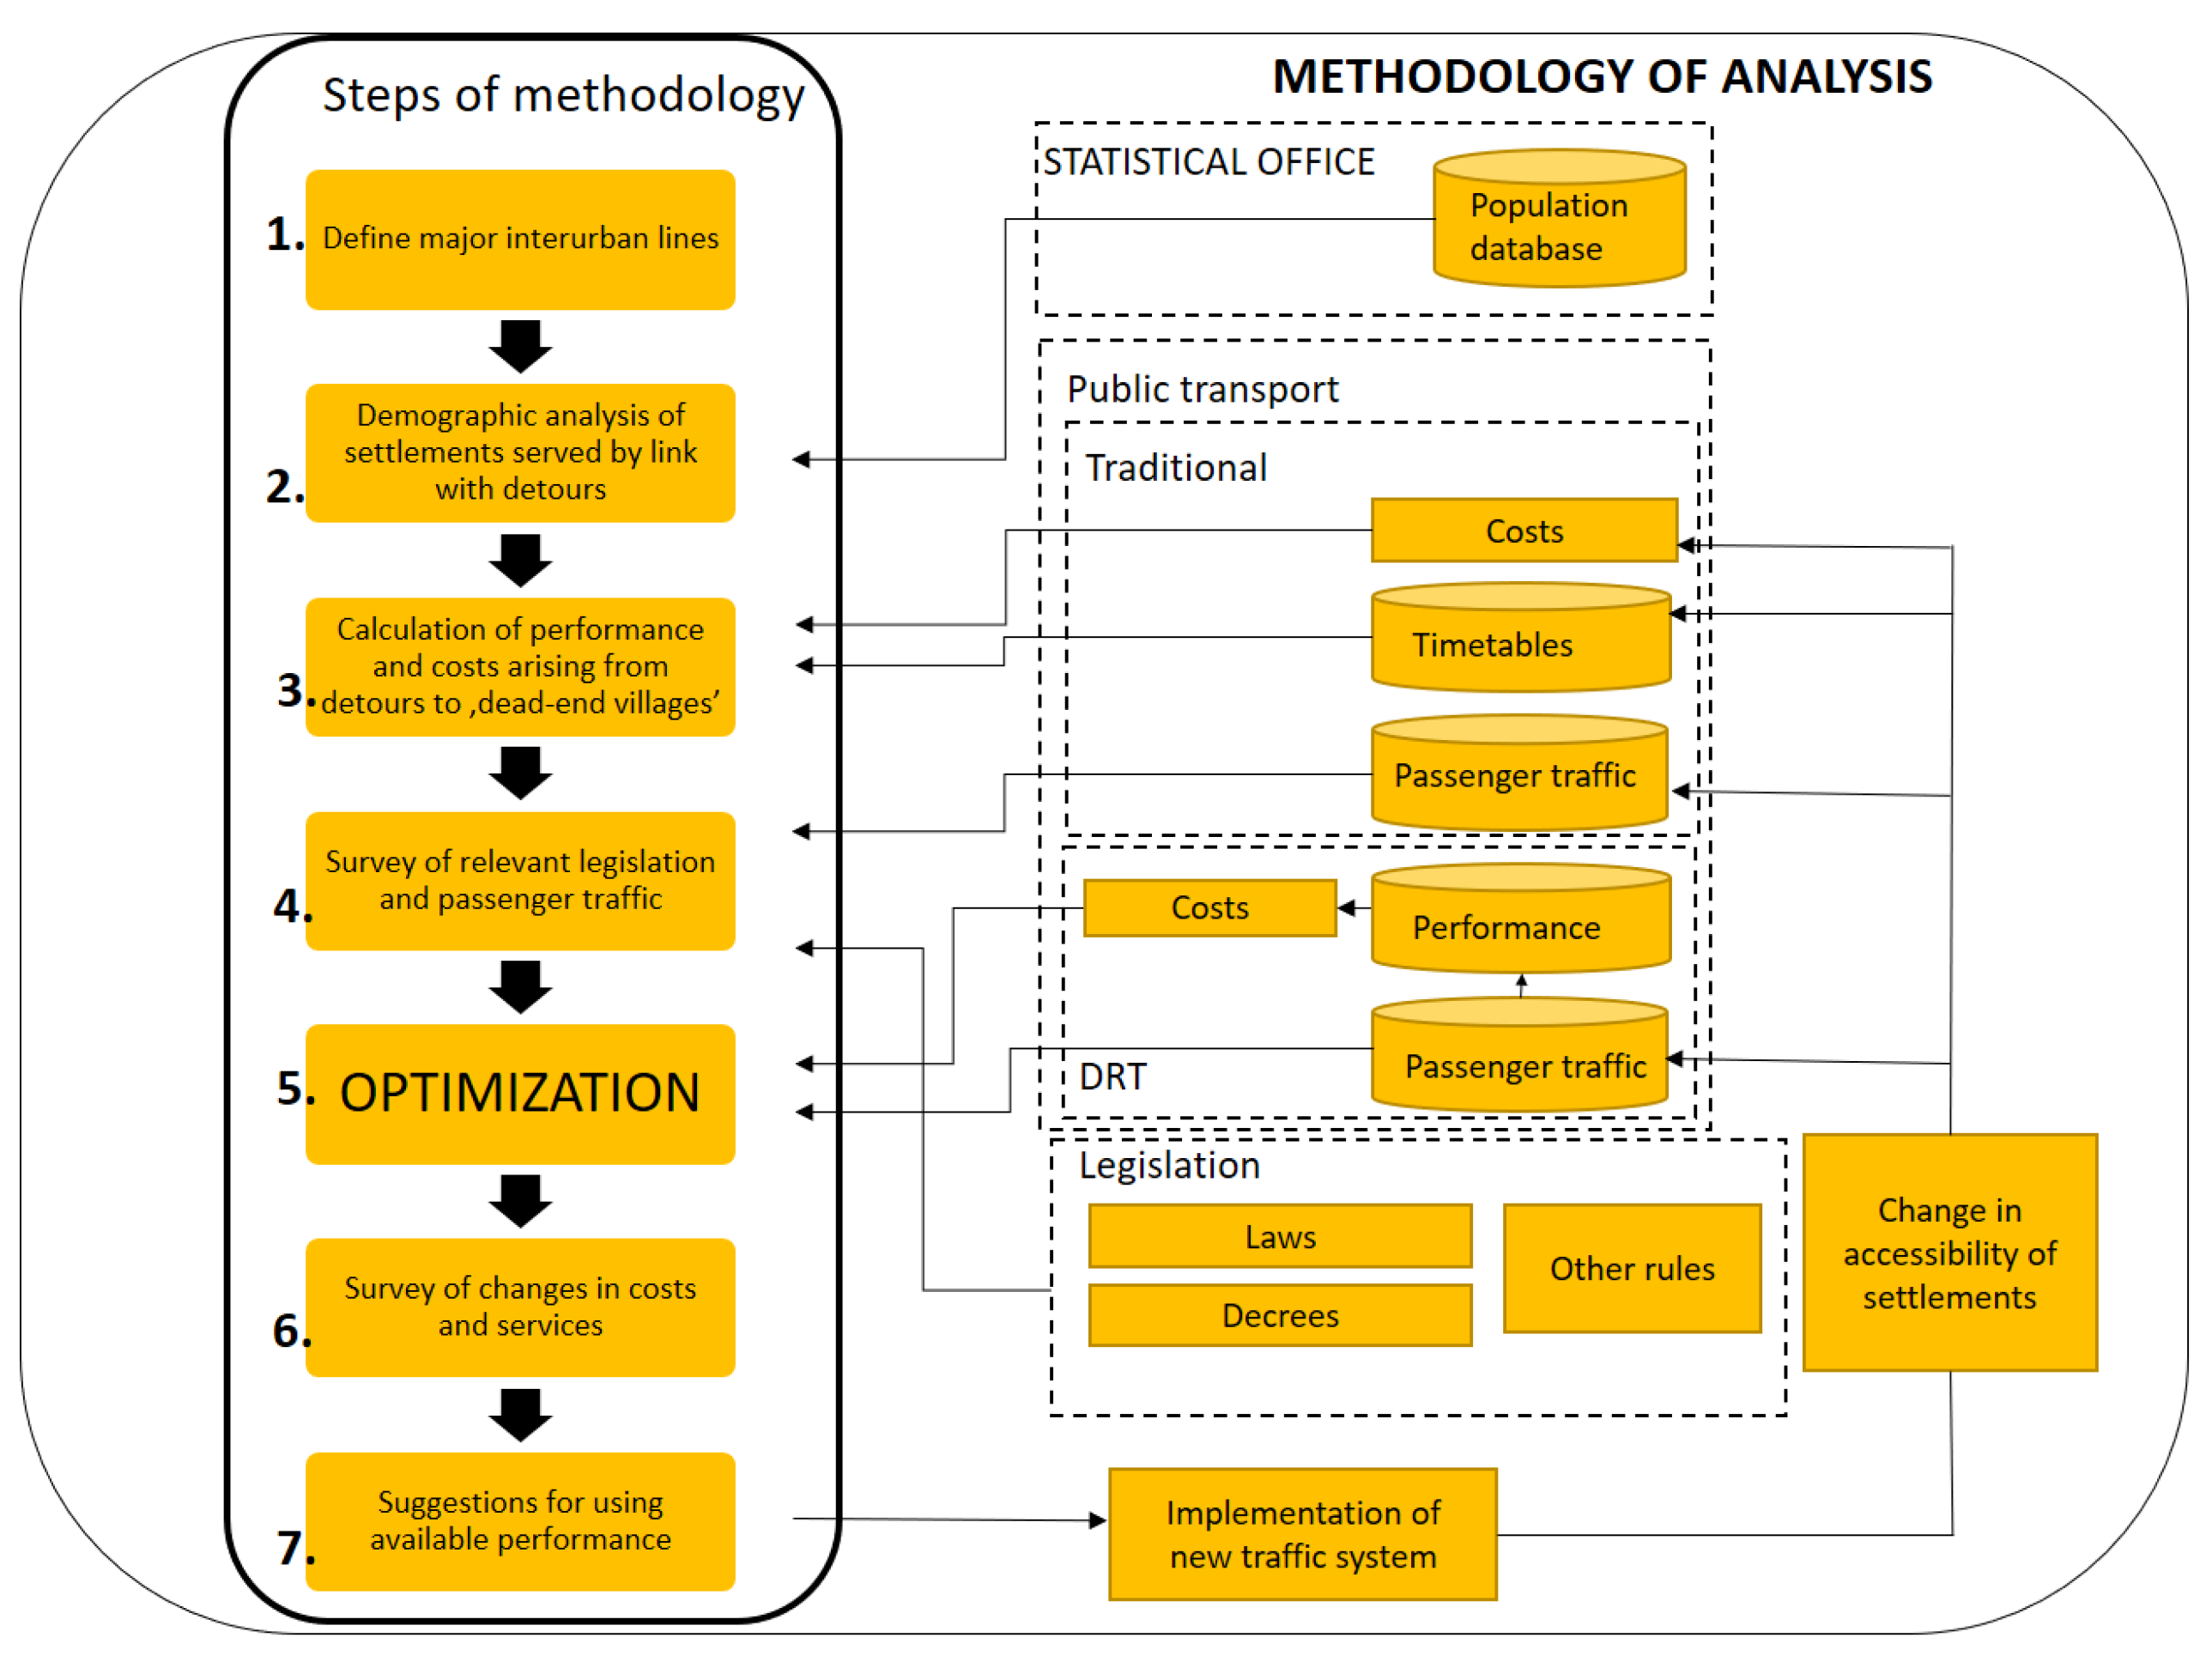
11] evaluates DRT as a function of demand density, fleet size, and the number of vehicles. The main purpose of both models is to minimize costs. In contrast, the seven-step method presented below optimizes the performance (costs, vehicles) of the traditional bus system by implementing a DRT service to improve the quality of the public transport service. As the optimized bus system operates at lower costs, the remaining budget is spent on enhancing the level of service (
Figure 1).
While Vitale Brovarone [
14] constituted a structured methodology to help stakeholders approach challenges jointly, in a process of co-production of integrated, multi-faceted policy packages, our methodology declares the problems regarding financial coordination.
Though route-planning is an important problem in public transport, in the case of rural areas (where only one road exists and the size of the village is very small), routing design is less crucial than in the research of Xiong et al. [
15], where two metaheuristic algorithms (a tabu search and a variable neighborhood search) were used to optimize a shuttle system.
Naturally, the level of air-pollution should be optimized in rural areas too, not just in metropolises as described in Zheng et al. [
17]. Our methodology minimizes the parallelism between different public transport services to reach the minimum level of air pollution.
Handling unscheduled costumers is more simplified in the methodology of this research than in Torkjazi et al. [
18], where an agent-based simulation model is established to evaluate the effectiveness of the strategy. In our methodology, unscheduled passengers have the opportunity to use the DRT service as long as free capacity is available.
Based on the statements above, this complex, innovative method can be used to plan DRT systems in rural areas.
Data on the existing service offers (i.e., the timetable) and on the number of passengers were provided by the traffic operator (Volánbusz Zrt., Budapest, Hungary), while the number of inhabitants in each settlement was taken from the database of the Hungarian Central Statistical Office (KSH). In the future, the method can be supplemented with other parameters (e.g., road infrastructure condition of bus stops etc.), which can minimize the weaknesses of the method.
2.1. Definition of Major Interurban Lines
For an analysis of this kind, it is worth choosing a bus link that connects major settlements (such as district seats), but instead of going directly between the two termini, the link also serves ‘dead-end villages’ along the main route. When the bus link is selected, the categories of ‘major’ and ‘minor’ settlements (including ‘dead-end villages’) may be set up Horváth et al. [
19]. By ‘main route’ of a bus link, the direct route between the major settlements is understood, without the detours to minor settlements.
2.2. Demographic Analysis of Settlements Served by Links with Detours
It is necessary to examine the number of permanent residents for each served settlement and the specifications of vehicles used in public transport (e.g., whether minibuses are available). It must be noted that in the past 15 years, several tenders were called by European Union to finance purchases of passenger vehicles (e.g., Government Programs such as [
20,
21]).
2.3. Calculation of Performance and Costs Arising From Detours to ‘Dead-End Villages’
Performance and costs are calculated using several variables.
Table 1 enlists the variables defined and used below.
After the above two steps (i.e., definition of lines and demographic analysis), the supply side of traditional public transport must be explored, i.e., the performance parameters and the corresponding costs. The timetable—guaranteed by the operator—reveals when the bus reaches each settlement. From these data, a matrix can be created (
X0i … X23m), broken down to hours within the service period for each direction (see
Table 2 and
Table 3).
Bidirectional supply values are calculated by adding up the relevant elements of the matrix of the required direction (1).
Based on the above, the matrix below shows the number of buses for both directions for each hour (
Table 4).
In the next step, the distance covered by each detour can be determined. Thus, the performance of the detours according to the up-to-date timetable broken down to hours can be calculated by multiplying the matrix in
Table 3 with the detour distance (2).
The performance parameters for a given settlement for any part of the day can be calculated by summing up the relevant performance parameters. The present study investigates two time periods: (i) Whole day and (ii) a low traffic period (morning off-peak hours between 9 a.m. and 1 p.m.) (3) and (4).
The performances for the whole line, including all detours, can be summarized as (5) and (6).
The cost of the detours according to the up-to-date timetable for the above-described two periods can be calculated as follows in (7) and (8).
The performance parameters for a given settlement for any part of the day can be calculated by summing up the relevant performance parameters. The present study investigates two time periods: (i) Whole day and (ii) a low traffic period (morning off-peak hours between 9 a.m. and 1 p.m.) (3) and (4).
2.4. Survey of Relevant Legislation and Passenger Traffic
The methodology presented here can be applied in a general manner. It is independent of legislative and financial conditions, as it applies cost changes arising from performance. It must be noted that in Hungary, traditional and demand responsive public transport is regulated by laws such as [
22]. However, legislation may vary from country to country.
Concerning the bus links, it is necessary to examine and evaluate the number of passengers, especially the number of passengers boarding and getting off at the given settlements in different parts of the day, and on a daily basis as well. Although these data show the number of passengers exactly, no other attributes are revealed (e.g., age of the passengers, price of the tickets—full price, half price, free tickets). Therefore, an in-depth exploration of travel habits and latent needs with stated preference technique is needed, which can be time-consuming and expensive.
This method surveys only the number of passengers, which can be a weakness of the research and can be improved in further examinations. Knowing the actual number of passengers is enough to prove our hypothesis but revealing the travel habits gives more information for planning a DRT system.
2.5. Optimization
If the step-by-step process described here is followed, optimization can be carried out. Regarding the quality of service and costs, the objective functions are the following (9)–(12). In order to minimize the proportion of parallel service between the scheduled bus service and the DRT services (
Prunning), that stop on the main route should be determined as the meeting point of the two services that is closer to the ‘dead-end village’ to be served.
Based on Equations (9)–(11), static detours in the timetable can be replaced by a demand responsive transport service, which can result in higher values of quality of service with the same or lower level of costs. For the optimization, those stops on the main route must be identified where the vehicles of DRT service connect to the main service, regarding (12). This might be at a junction in an uninhabited area.
Naturally, optimization has some limitations, as shown by Equations (13) and (14). Firstly, minibuses have a capacity of 8 passengers (+1 driver), so a passenger-limit can be defined
(Kminibus), which justifies the mentioned analysis of passenger traffic. Secondly, the number of operating vehicles
(Nminibus, op) must be enough for the DRT-service
(Nminibus, need).
In addition, travel time can be decreased in the major line, which has economic benefits (passengers spend less time travelling on the bus).
2.6. Survey of the Changes in Costs and the Level of Service
To determine the expected changes in costs and levels of service, new variables must be introduced (
Table 5).
Operational costs can be divided into two categories:
Fixed costs: Wage of human personnel, operation of passenger information service, etc.
Direct costs: Fuel costs, maintenance costs etc.
Fixed costs can be regarded as constant, as the character of the service (traditional vs. demand responsive) influences the value of total costs broken down to vehicle-kilometer only to a very slight degree. Therefore, this calculation does not take fixed costs into consideration.
In the present study, the maintenance costs of minibuses equal that of coaches, while making it possible to finance a stricter maintenance cycle than that prescribed by the producer. In consequence, the direct costs (vehicle amortization costs, the costs of insurance, vehicle registration, and passenger insurance, the costs of the regular vehicle maintenance service, the costs of vehicle maintenance, etc.) of minibuses are overestimated, allowing more margin to demonstrate economy. Therefore, out of direct costs, only the fuel consumption of different types of vehicles (minibus, rigid bus) and different fuel prices were taken into account in this analysis.
It is important to declare that owing to their fleet size, the interurban traffic service provider can purchase fuel at a price lower than the world market price as in [
25]. For companies operating a smaller fleet, this discount is not always available, i.e., in this study, the world market price is used for this fleet in the calculations.
The changes in fuel costs must be defined for the service to ‘dead-end villages’, for different time periods and for both traditional and DRT systems. Concerning the full operational period, these can be calculated by Equations (15) and (16).
The difference in fuel costs for the full-service period per day can be calculated with Equation (17).
The difference in fuel costs for the low-service period (morning off-peak hours: 9 a.m.–1 p.m.) are calculated with Equations (18) and (19).
Equation (20) gives the difference in costs between the two services for the morning off-peak period.
Using these values, the performance available for extra services in the morning off-peak hours after the optimization of the new system can be calculated using (21) and (22).
2.7. Suggestion for Using Available Performance
Owing to the DRT service of ‘dead-end villages’, a fall in performance can be witnessed at the scheduled service on the main route. At the same time, the performance of the DRT service with a high degree of freedom will fluctuate, depending on the everchanging needs. Therefore, its performance can be higher, equal to, or lower than that of the detours made by the present scheduled service. Even taking this fact into account, the costs of operation are expected to decrease compared to the current traditional service in either case, due to the specific lower operational costs (cnp > cmini).
After the introduction of the new system and the survey of passenger traffic, it is possible to rearrange the performance parameters arising due to the decreasing costs, and to expand the service on the main route (e.g., by introducing a clock-face schedule).
3. Case Study
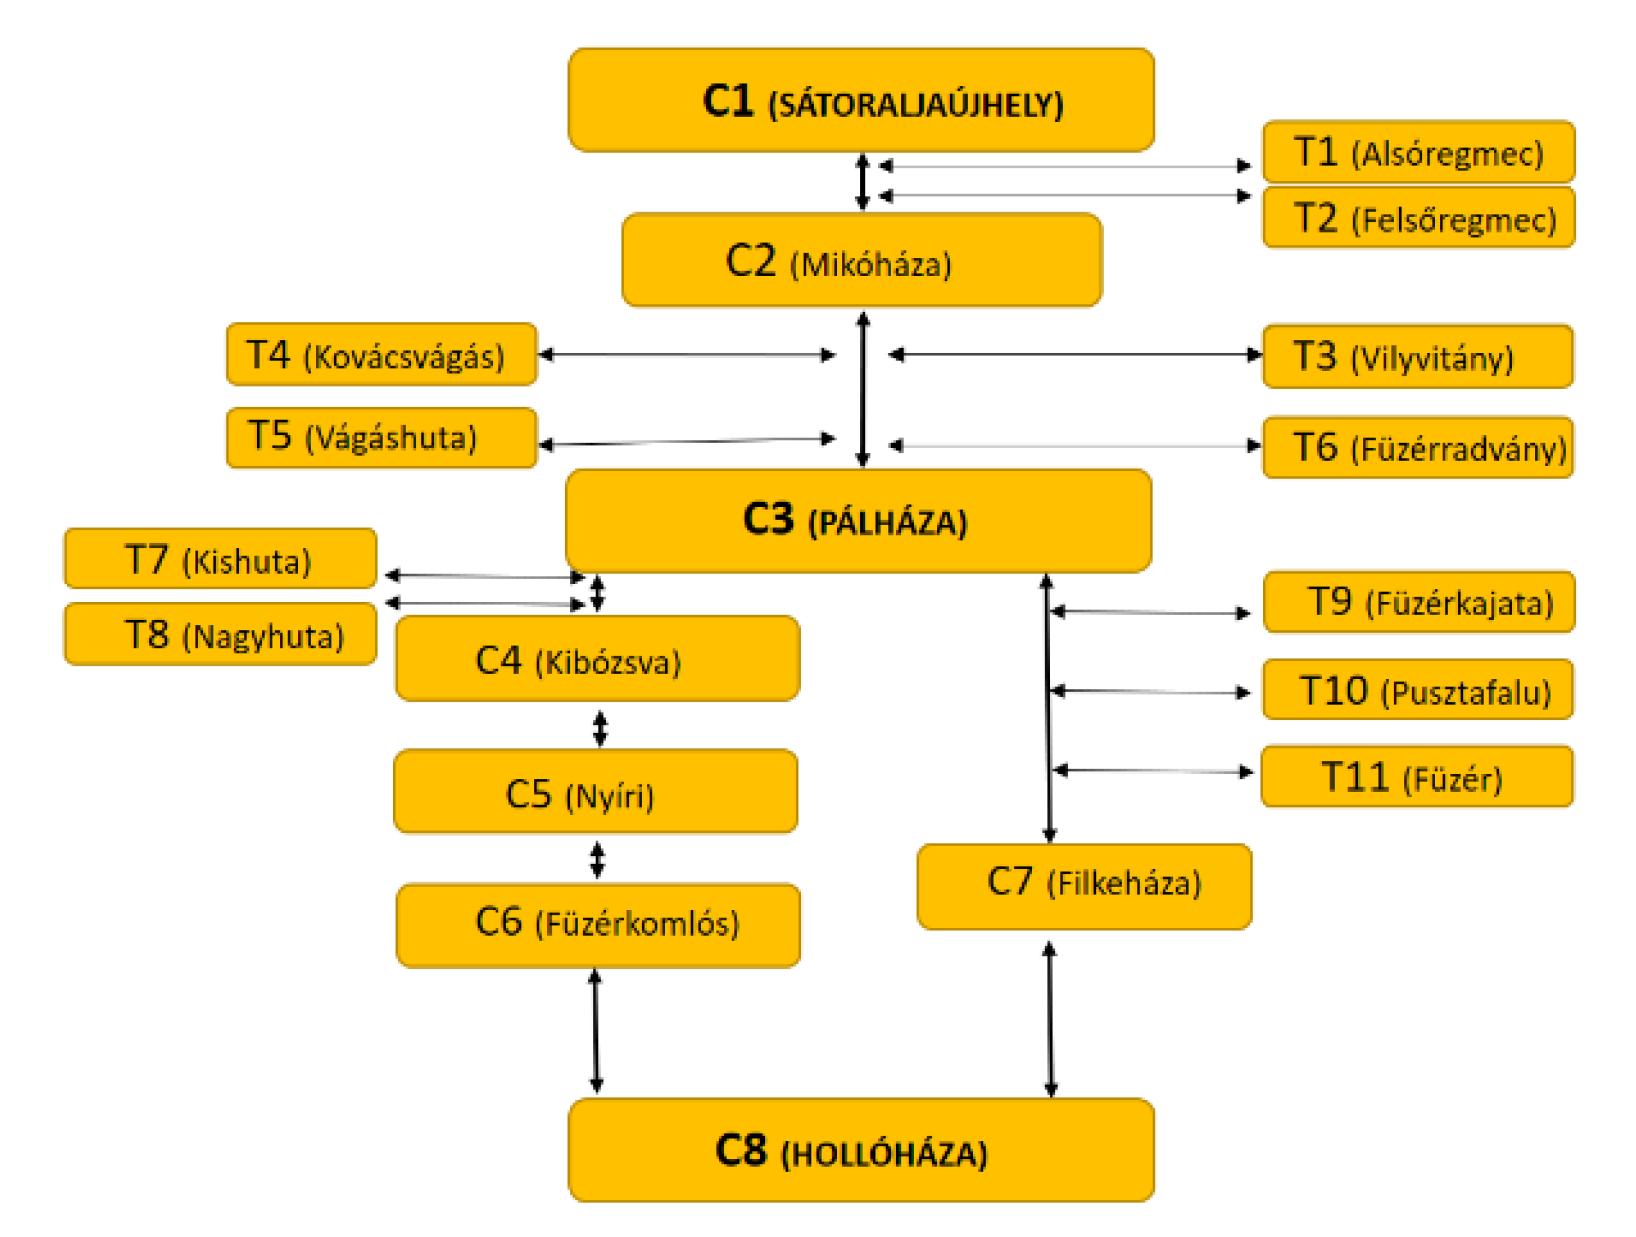
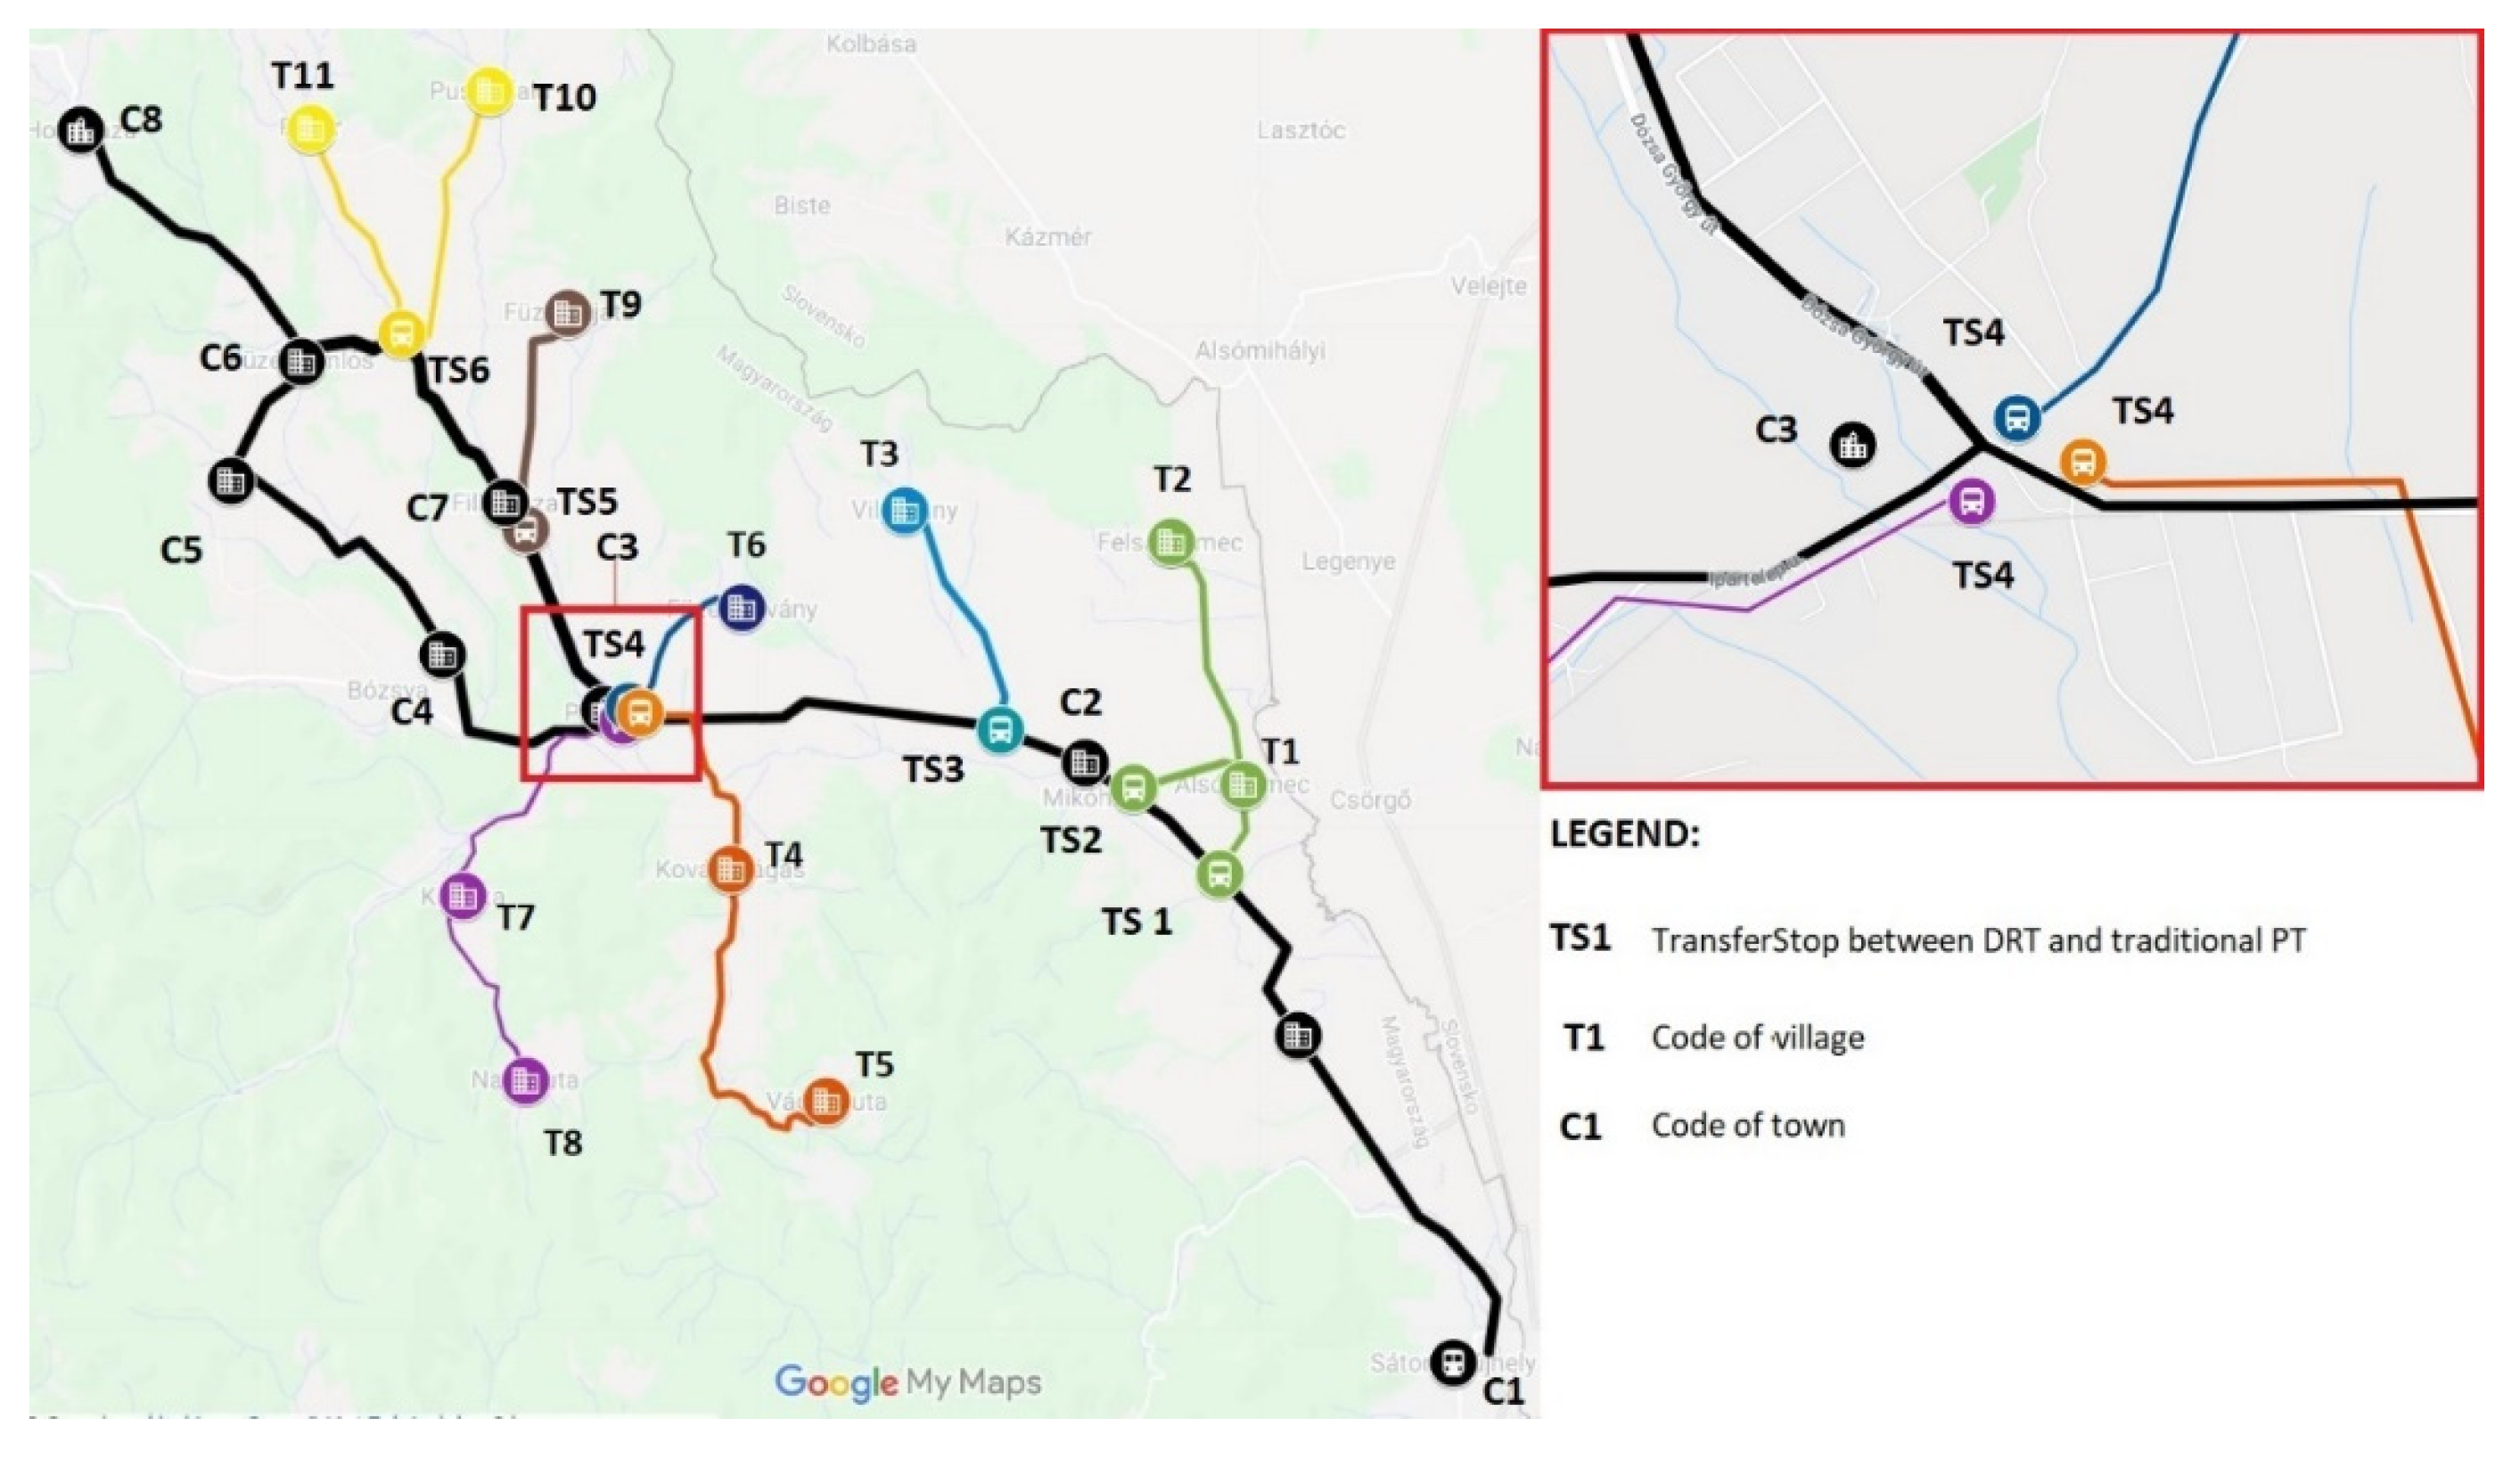
Using the above-described comprehensive methodology, the bus lines serving the following settlements in northeastern Hungary were analyzed: (i) Sátoraljaújhely–Kovácsvágás–Pálháza–Nagyhuta–Hollóháza (line 3900) and (ii) Sátoraljaújhely–Kovácsvágás–Pálháza–Nagyhuta–Nyíri–Hollóháza (line 3901). All links serving this area use the main route Sátoraljaújhely–Mikóháza–Pálháza–Filkeháza/(Kisbózsva–Nyíri–Füzérkomlós)–Hollóháza, and they serve the surrounding ‘dead-end villages’ by detours scheduled in their timetables (
Figure 2). For convenience, the different settlements’ names were replaced by codes.
With the exception of T4, the number of residents in ‘dead-end villages’ does not reach 500, and two hamlets (T5, T8) have less than 100 residents (
Table 6).
3.1. Performance
On the main route, 22 bidirectional connections are available between C1 and C3. Consequently, there is one bus per hour in each direction. This reflects the mobility need between the two towns. Based on a similar calculation, there are 18 daily connections between C3 and C8 in one direction, while there are 19 in the other direction. It must be noted that buses arriving at and departing from C1 have direct connection to most of the trains on the railway line between C1 and the capital city (Sátoraljaújhely–Budapest railway line no. 80).
Daily performance parameters and costs regarding the detours to ‘dead-end villages’ are shown in
Table 7. The detours amount to 815.4 km, and the corresponding cost is 1343 € every day. In comparison, the daily performance parameter of bidirectional connections on the surveyed two routes including the detours is only 2093 km; i.e., 39% of the daily performance is dedicated to detours.
Concerning the morning off-peak hours (9 a.m.–1 p.m.), buses on the main route are scheduled hourly. Although the number of detours is lower (every 2 h), the performance (178.2 km) and the cost (294 €) are high (
Table 8).
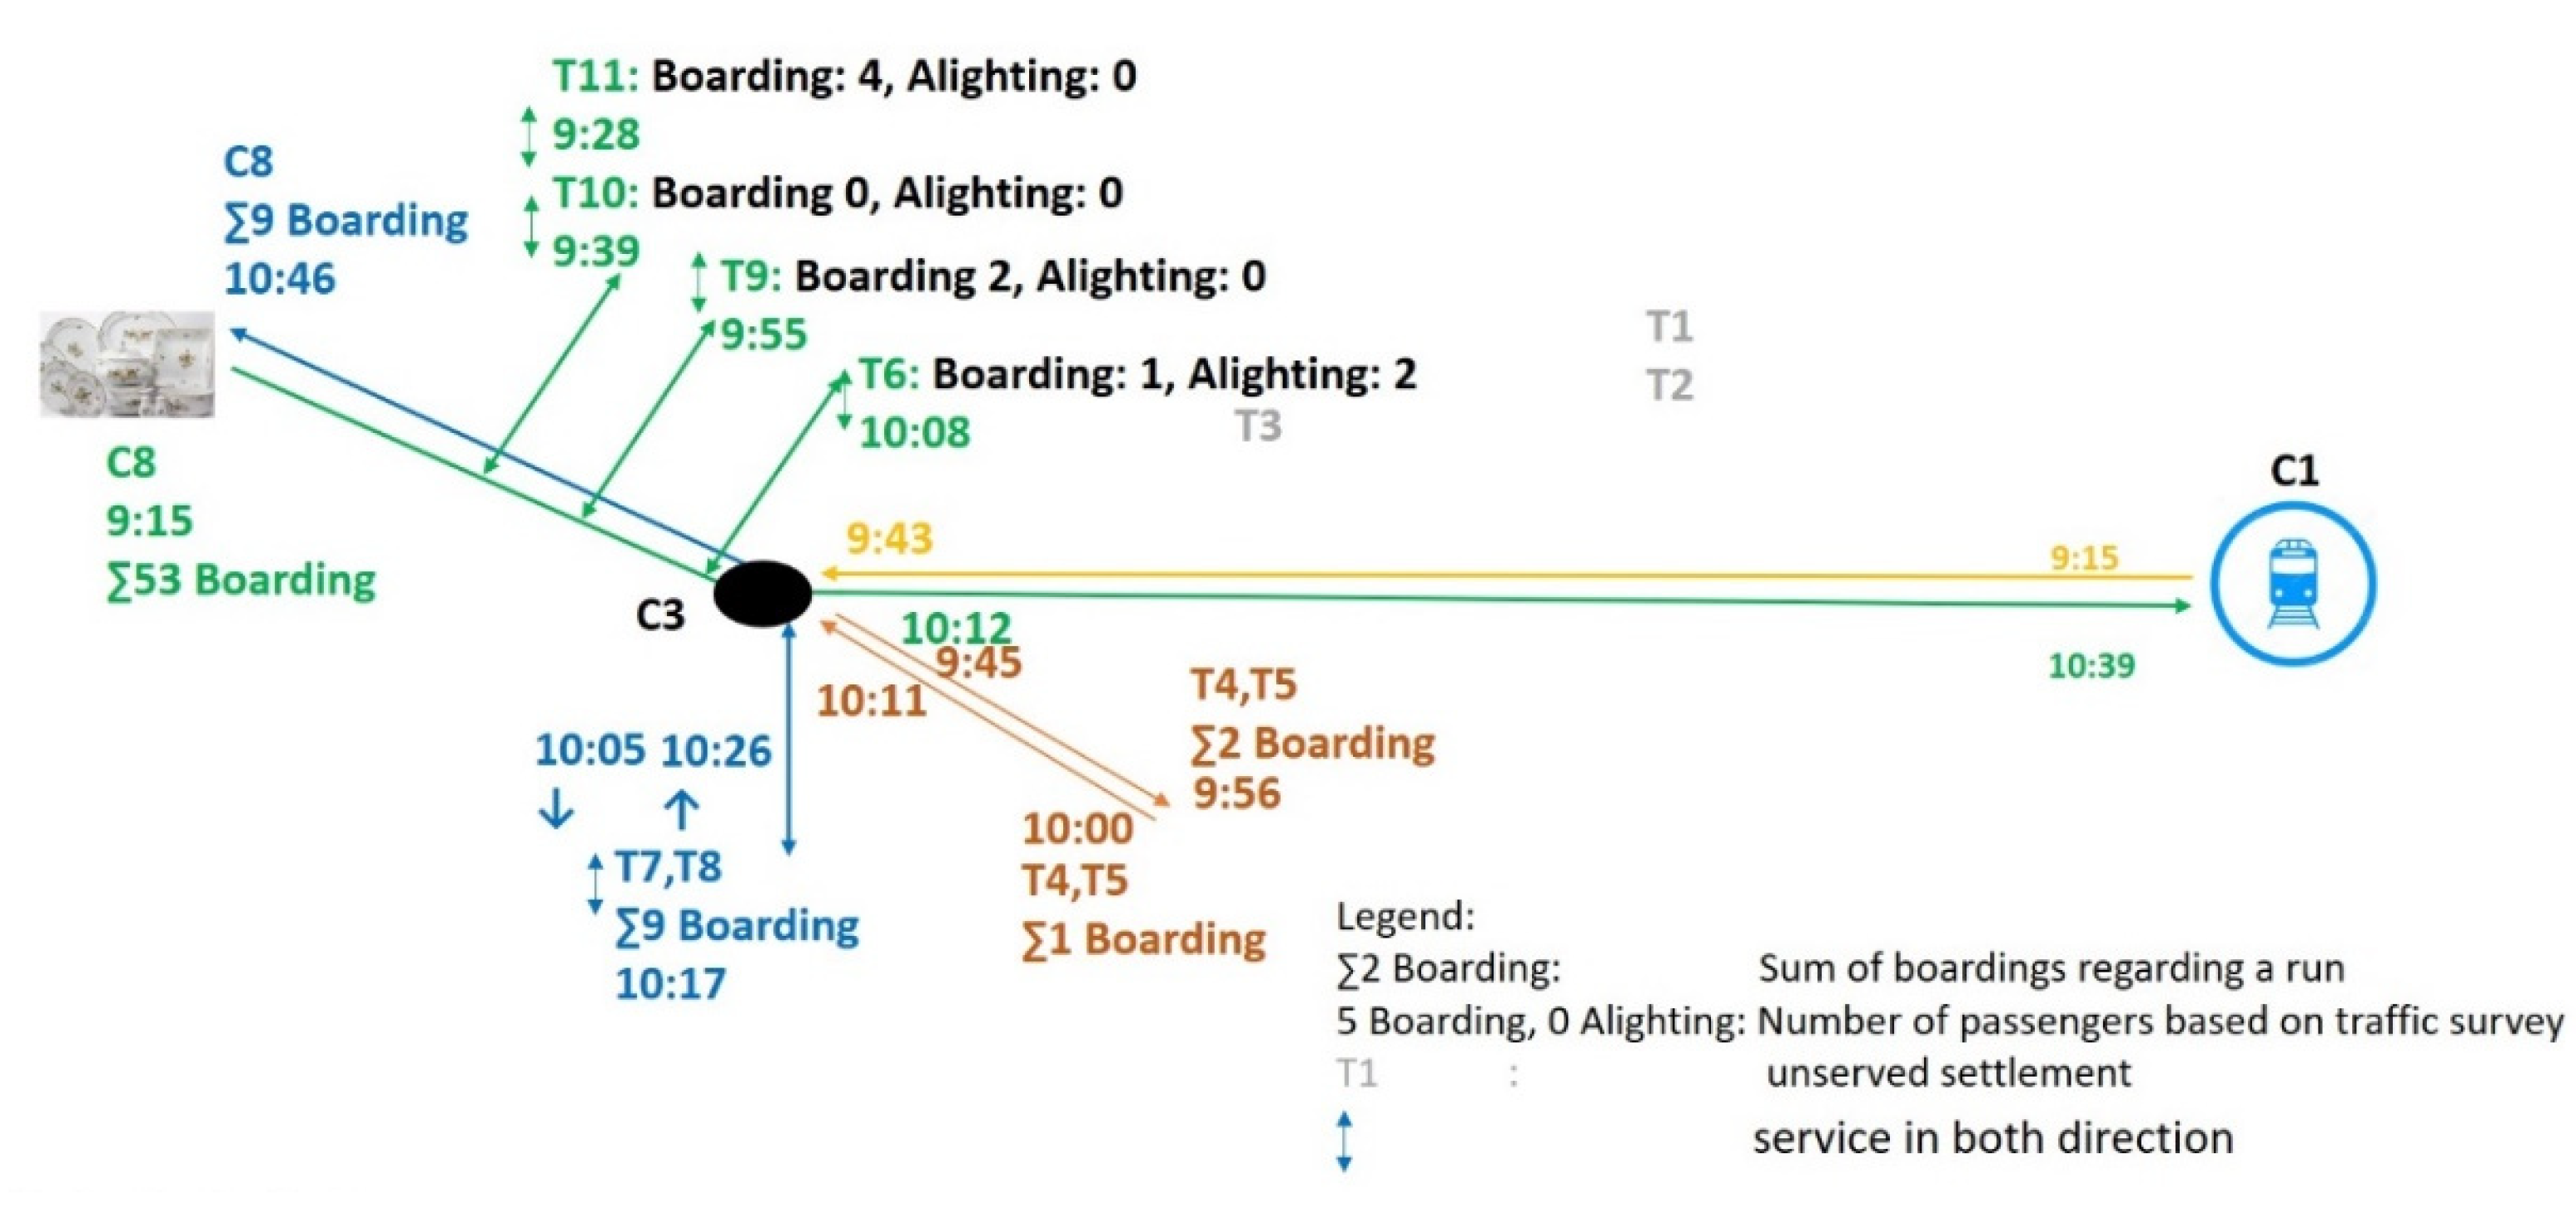
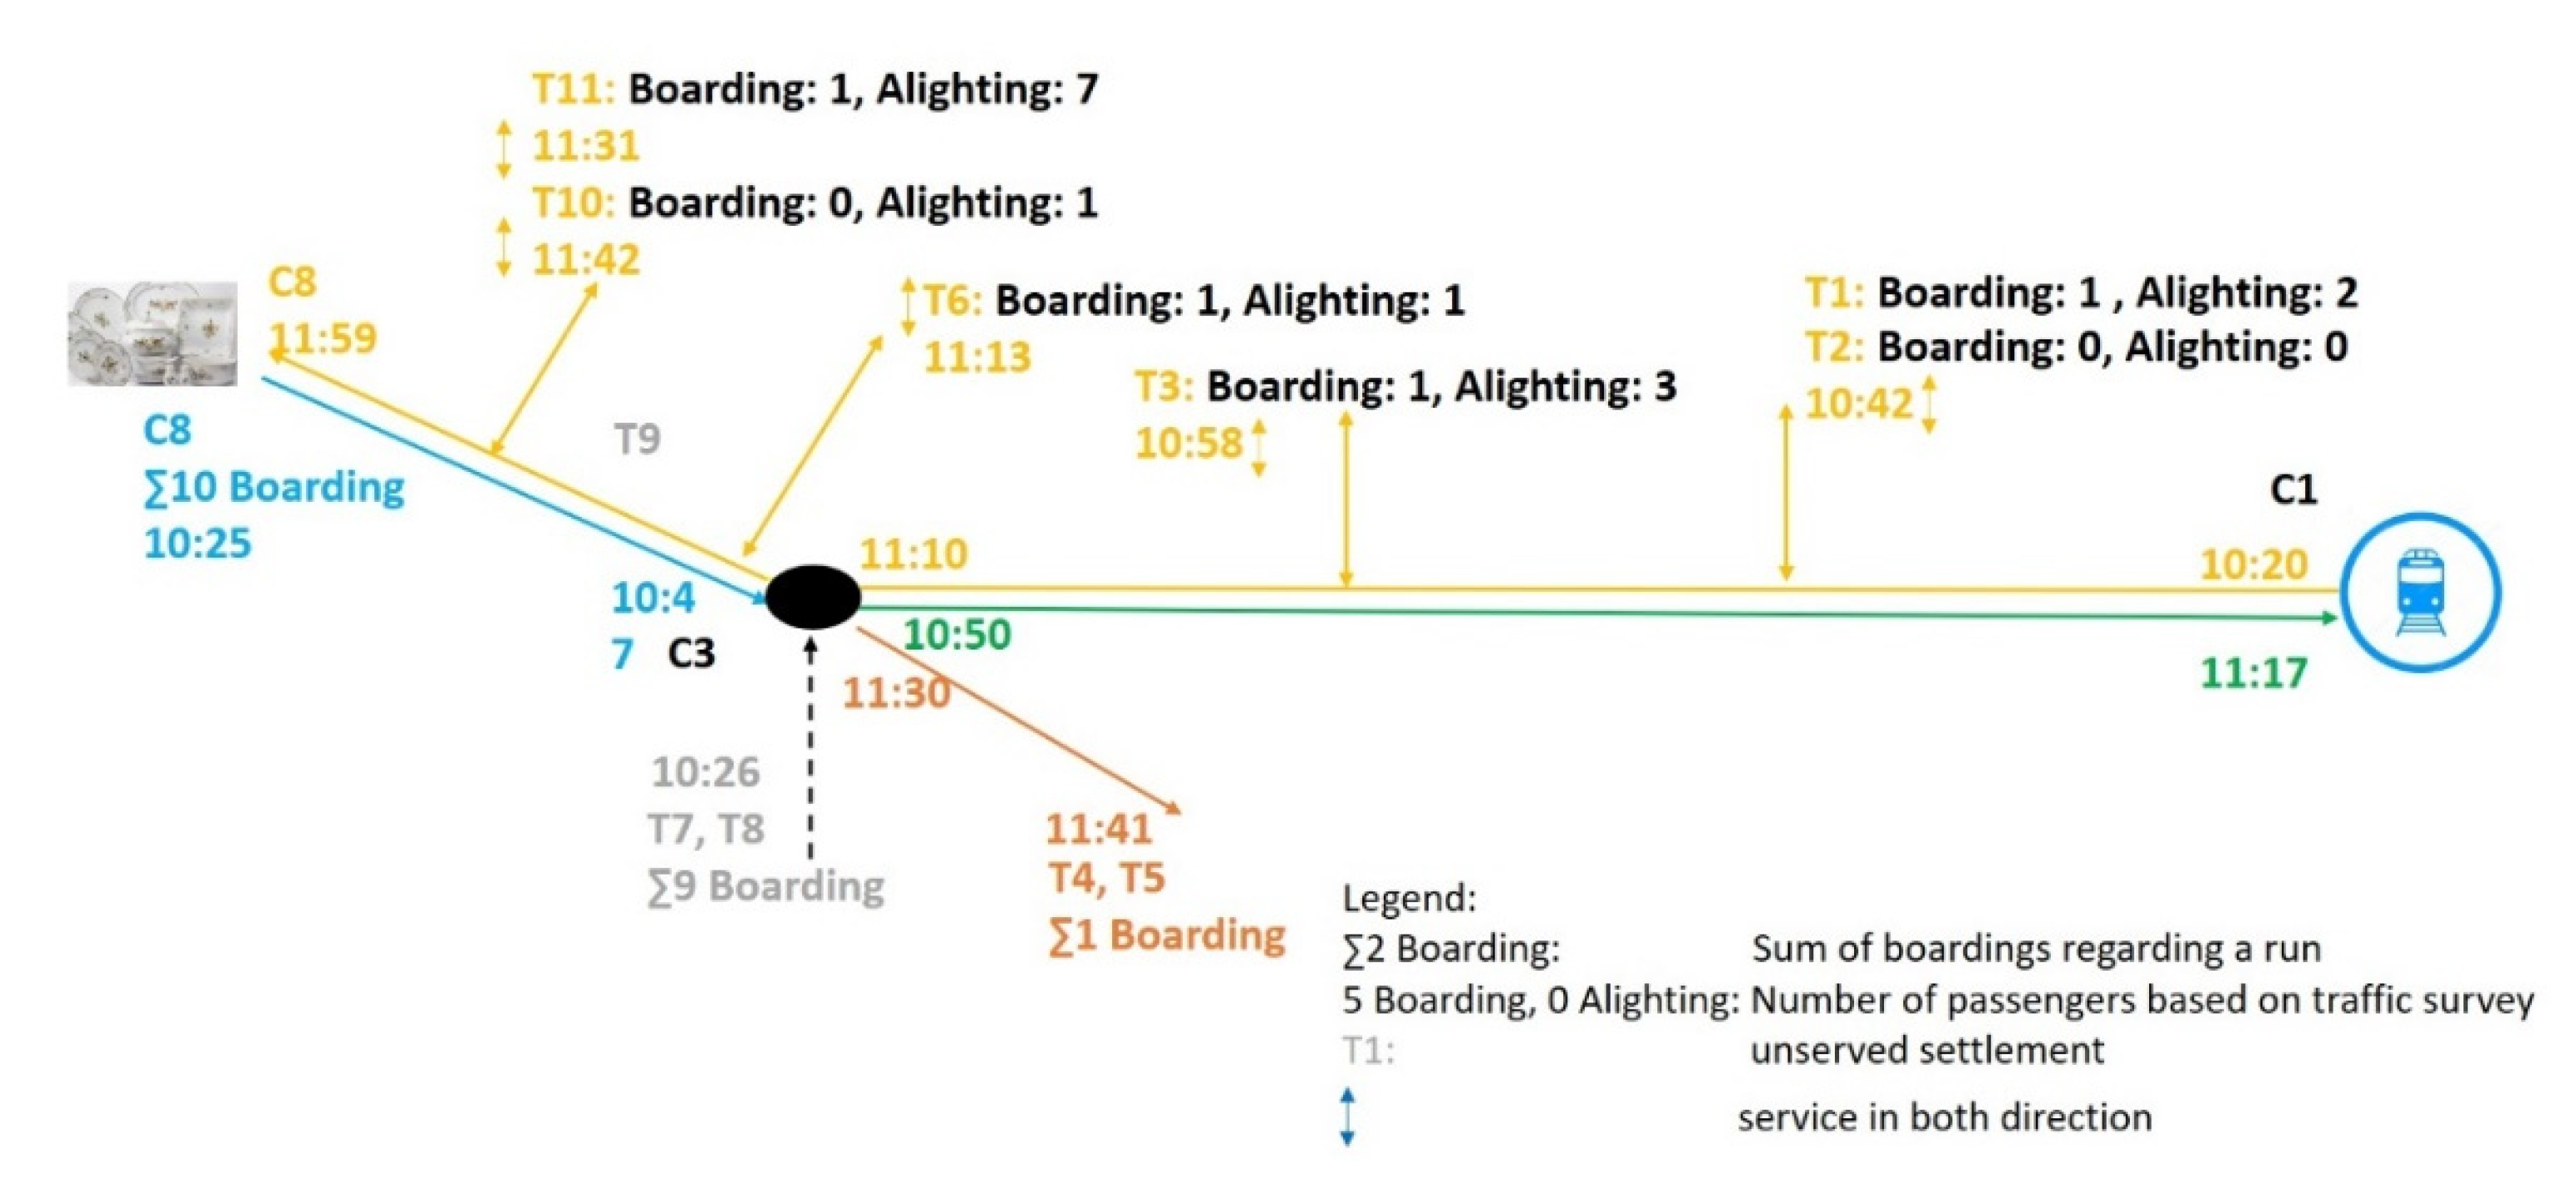
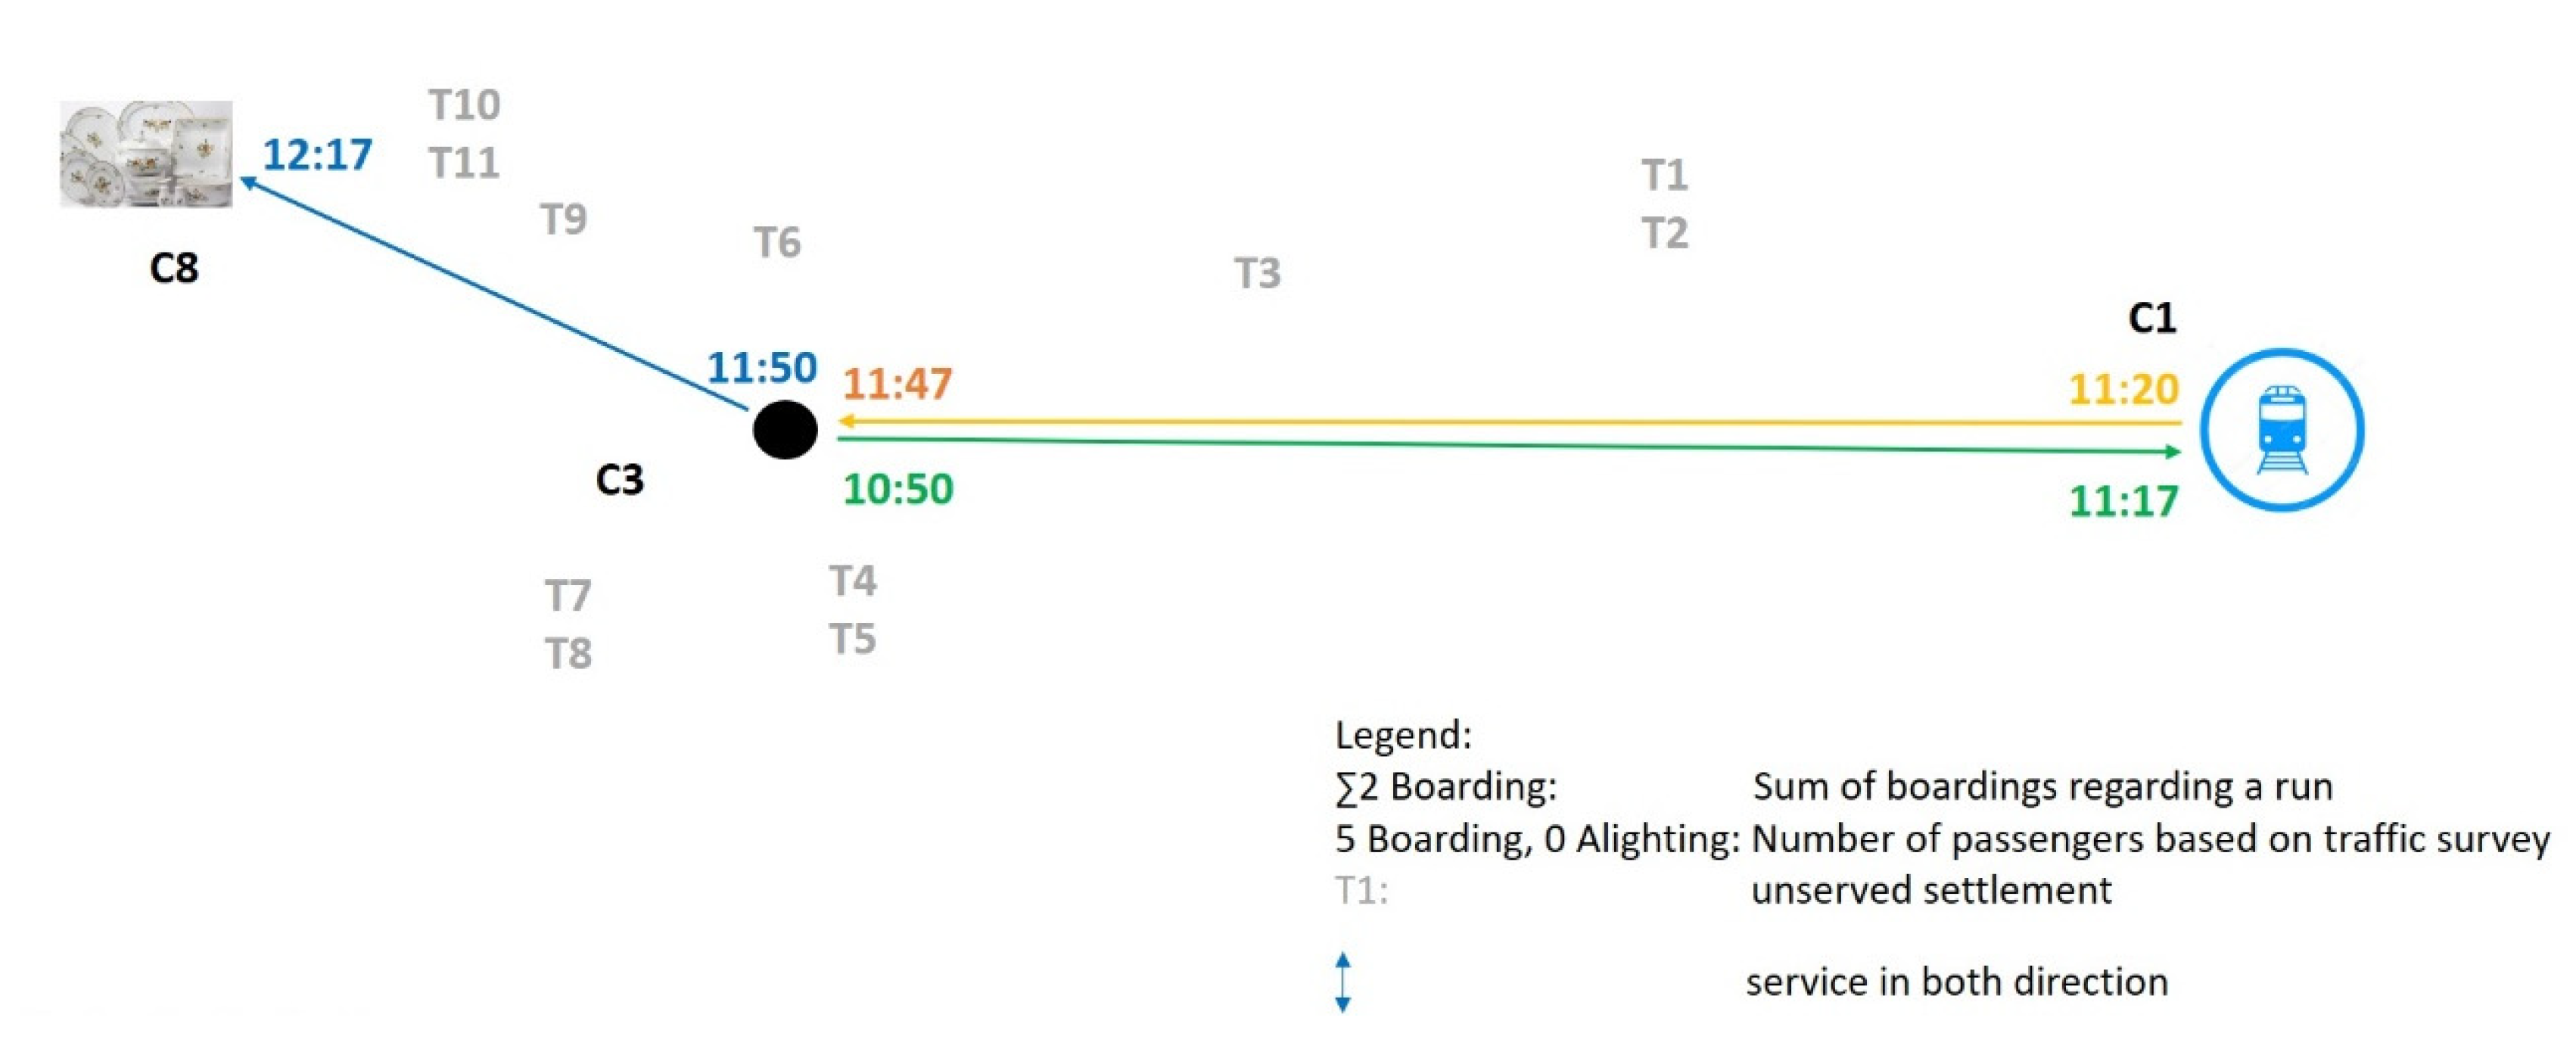
An analysis of the passenger counts provided by the Operator (the survey covers 10 days: 26 September 2019–05 November 2019) reveals that in the off peak hours the demand from settlements with less than 55 inhabitants can be served by minibuses, as the number of passengers does not exceed 8 persons per departure (
Figure 3,
Figure 4,
Figure 5 and
Figure 6). Although T4 has a higher number of residents than the 500 threshold, the mobility needs do not differ significantly from those of smaller villages (
Figure 3,
Figure 4,
Figure 5 and
Figure 6). In
Figure 3,
Figure 4,
Figure 5 and
Figure 6, the values given in the form ∑
x give the sum of people travelling on the given bus.
As the number of passengers is low, the introduction of demand related traffic is to be considered. The data reveal that in several cases, no passenger alighted or boarded the bus, but still the bus needed to go into the ‘dead-end village’ according to the timetable. Thus, the next step is optimization.
Regarding other time periods of the service period, the data are shown in
Table 9.
3.2. Optimization
Three types of intervention are suggested for optimization:
The replacement of the whole connection with demand related service;
The replacement of detours with demand related service, keeping the scheduled service on the main route;
Provision of DRT —as an extra—service to the connections that serve only the main route at present.
If the whole connection is replaced by DRT service, the level of service does not change, as the passengers must change buses if travelling between the main route and the ‘dead-end village’ even in the case of the present timetable. With the introduction of DRT service, the length of transfer time can be reduced.
If just the detour sections of the present connections are replaced with DRT service, the minibuses should work between the settlements and the nearest stop on the main route in order to optimize performance and avoid parallel service.
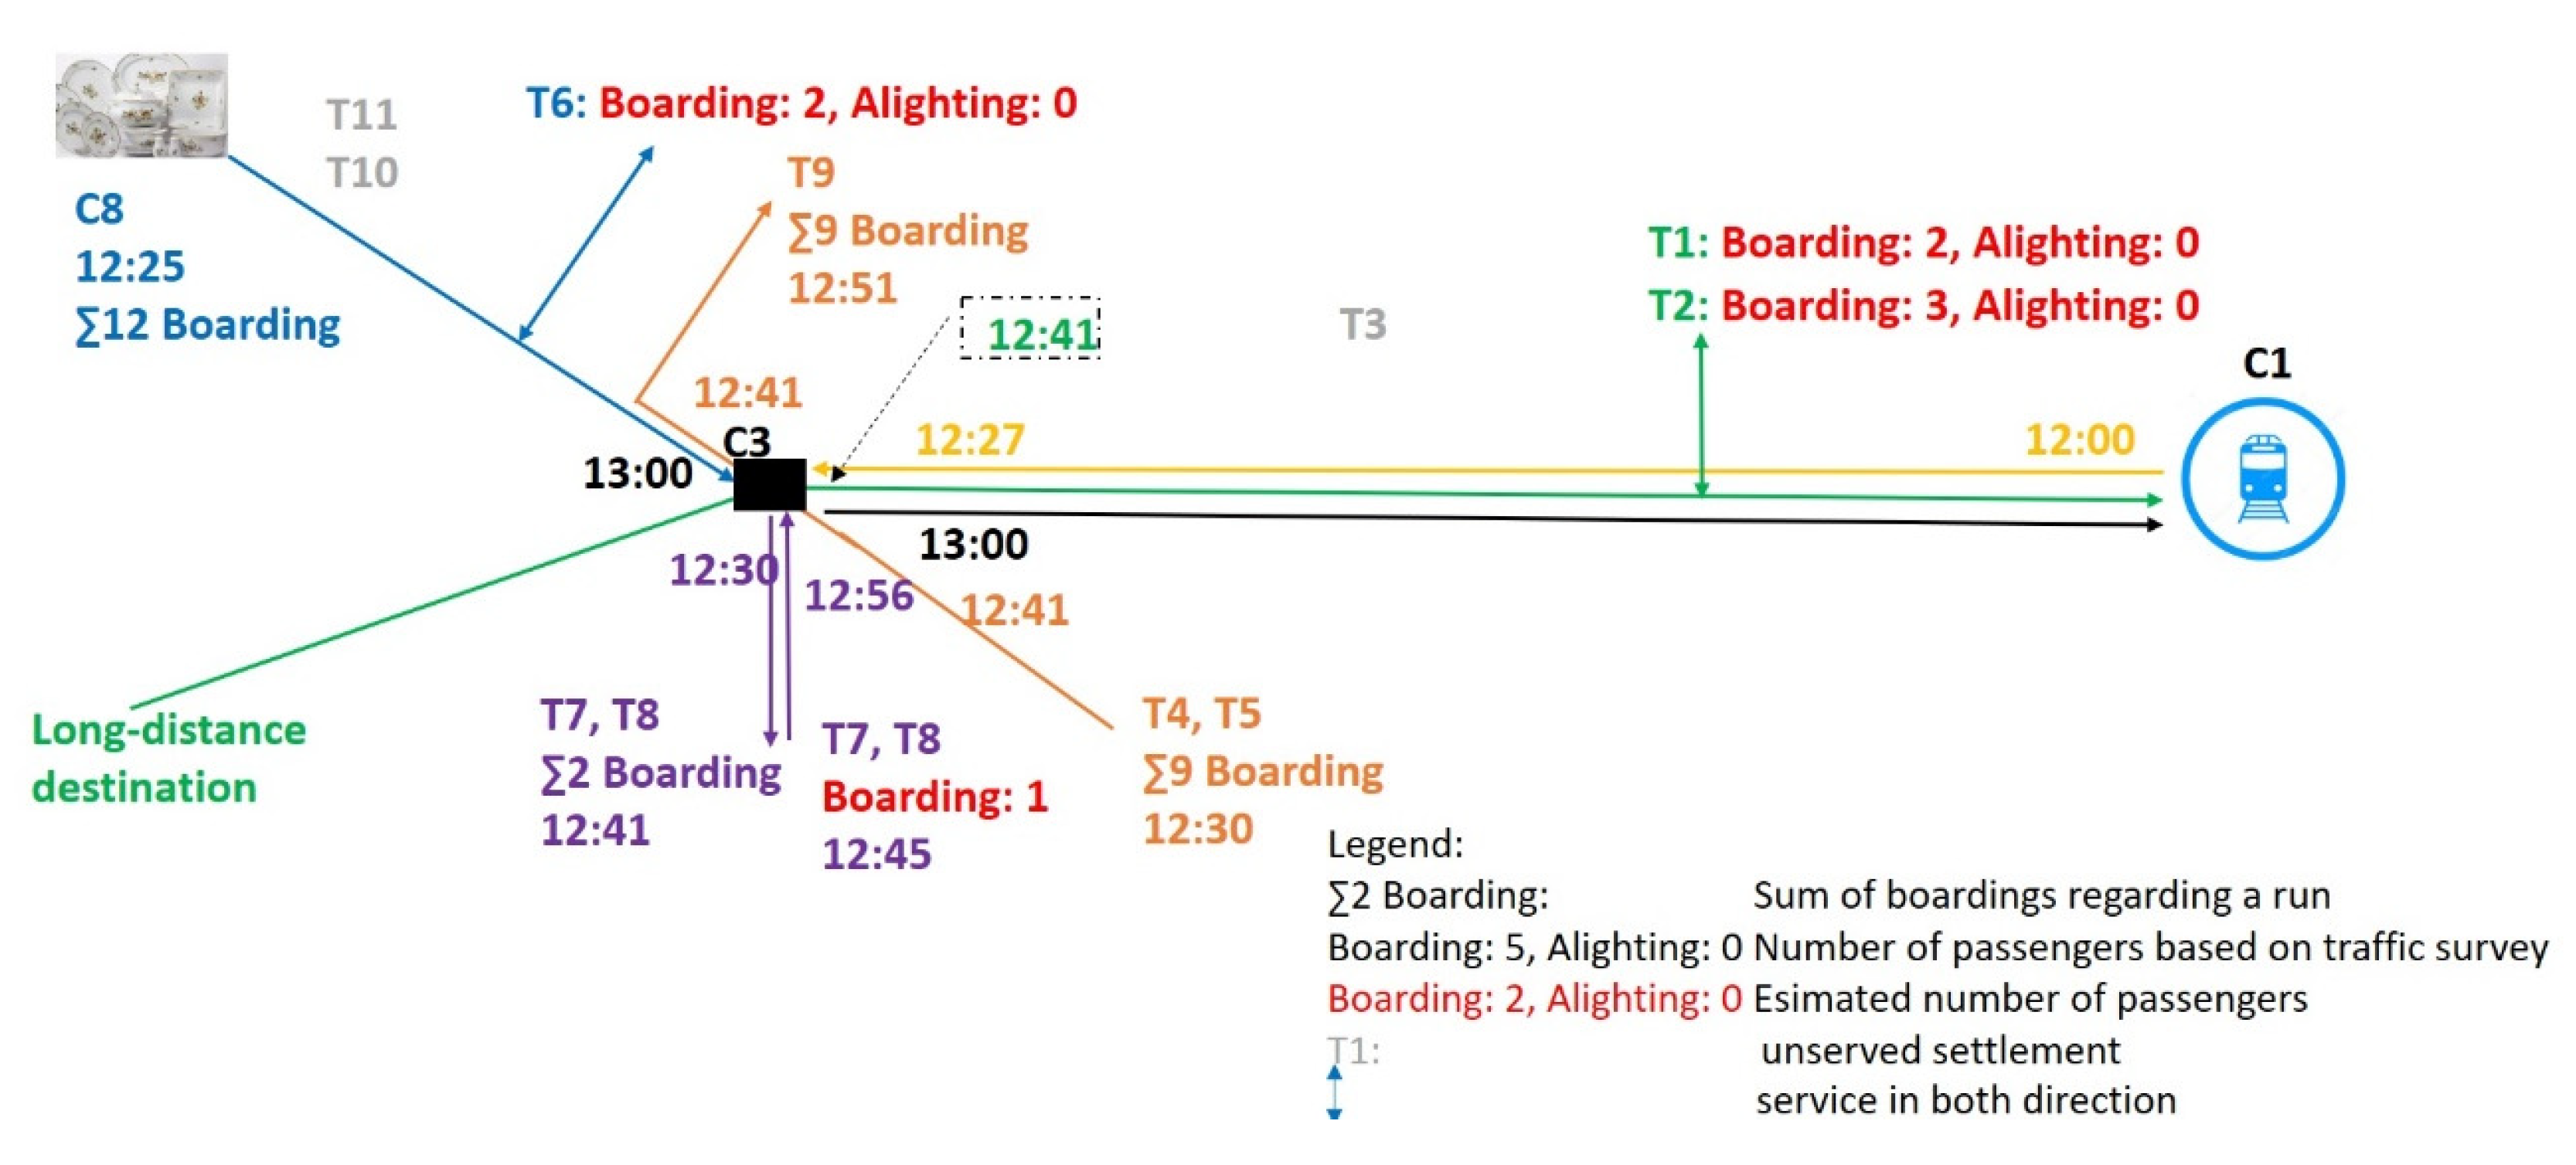
Concerning the third solution, a DRT service can be provided to carry passengers to and from the existing service running solely on the main route with the present costs. The settlements marked in grey on
Figure 3,
Figure 4,
Figure 5 and
Figure 6 should also be taken into consideration, as they can also be included in the DRT service, enhancing the level of service for them.
The suggested traffic system based on the optimization process is illustrated in
Figure 7. The black line depicts the traditional main route of traffic, while the DRT lines are depicted in different colors. As the figure shows, one vehicle can serve more than one settlement. The DRT service to replace traditional service can be accessed from the existing stops on the main route. Six transfer stops (TS) were defined for the 11 ‘dead-end villages’.
3.3. Financial Calculations
When the new system is designed, it is possible to calculate the economic parameters concerning the detours, using Equations (18)–(20) from above (23)–(25).
The above calculations prove that replacing the traditional service with DRT service can decrease the daily costs by more than 50 €
( Cop) in the morning off-peak period. Thus, keeping the level of service for the settlements, a further 408 km
(Wu,op) performance can be financed. Using Equation (21), the performance available for extra services in the off-peak period
(Wu,op) can be calculated in (26).
If we wish to implement a clock-face schedule as mentioned above, it is possible to provide a minibus service for each bus and for each ‘dead-end village’ when applying a DRT service, as proven by
Table 10.
The total of detours is 139.2 km, i.e., if little settlements are served by a DRT service, more than 250 km can be used if needed:
To improve service in other parts of the service period;
To support the social service;
To enhance the level of the main route service;
To relocate performance to other links.
If the main route service is enhanced (iii), the performance should be distributed in a way that the service to ‘dead-end villages’ should also be provided for the new connections. However, passengers may perceive this change as problematic, owing to the need for transfer from the minibus to the main route service. Although, as a consequence of the introduction of the DRT service, the accessibility of ‘dead-end villages’ will be enhanced, and the arising mobility needs can be served better.
During the optimization of daily public transport, the analysis of passenger traffic in peak hours (6–9 a.m. and 2–5 p.m.) is of special importance. Data presented in
Table 7 above show that in the peak hours, the needs of some ‘dead-end villages’ (e.g., T4, T7) can be served by two or three minibuses, owing to the limited capacity of buses. These extra needs can be served by the use of extra vehicles in peak hours, in a similar manner to traditional public transport.
Contrarily to the above, for other ‘dead-end villages’, one minibus can provide the service in all periods of the day, owing to the low number of passengers, which never exceeds the capacity of a minibus.
Daily operational costs can be calculated for minibuses and rigid buses with the Equations (15)–(17) described above (27)–(29).
As calculated by Equation (22), the performance given in (30) can be guaranteed by the introduction of a DRT system in addition to the present level of detour services, with the same operational costs.
The sum in (30) is quite high; it is of the same magnitude as the performance of the whole link, which can be used in versatile ways:
Development of social services in other fields (e.g., elderly care, canteen meals etc.);
Covering costs of business policy discounts;
Development of the computer system and software for filing the claims and controlling the system;
Financing system development on other regional links.
It must be emphasized that the contracts (and thus uniform funds) for the introduction of a DRT system are not available for every region. A solution for this may be if DRT services are offered by the public transport providers as part of the public service, and the compensation accounting for the discount tickets should also be included in the public service contract. As this problem is primarily a question for transport policy and decision makers, the present study does not discuss it in detail.
4. Results
As a result of the methodology (see
Section 2) applied to a bus link in Hungary (see case study in
Section 3), the introduction of a DRT system is suggested. To launch the service, 7 minibuses need to be operated. Note that the examined “dead-end villages” operate 11 minibuses (1 minibus/village) as a social service for elderly people (e.g., transportation to church, health care etc.).The costs of the suggested DRT system do not exceed the costs of the present traditional system, but the level of service is increased owing to the increased frequency of connections.
It is worth carrying out a SWOT (Strengths, Weaknesses, Opportunities, Threats) analysis for the changes to be introduced as a result of optimization (
Table 11), to provide a kind of summary of the above process.
The fees for the DRT service would be equal to those of the present traditional service. However, as highlighted by the SWOT analysis, the complexity of claim submission might be compensated for by business policy discounts and appropriate marketing prior to the introduction of the new service.
In sum, the application of the above described methodology allows for the creation of a sustainable public transport system for ‘dead-end villages’ as illustrated by the case study of the Sátoraljaújhely–Hollóháza bus link.
5. Conclusions
The present study explores a problem present in the whole of Europe. Providing an acceptable level of public transport services for low travel demand areas like ‘dead-end villages’ is a challenge for both the client and the operator.
The hypothesis of the present study was that replacing the current traditional public transport system with a demand responsive transport system can enhance the level of service both for the users and the providers. A universally applicable seven-step process was set up, which can be used to optimize the traffic system or only a part of a traffic system.
This methodology was applied to two existing Hungarian bus links that serve altogether 11 ‘dead-end villages’ with scheduled detours. With one exception, the served villages have less than 500 inhabitants, with a relatively high proportion of dependents and inactive people. Despite these facts, the performance (service supplied) and the operational costs are high owing to the detours in each part of the day.
If the steps of the methodology described here are followed, the system can be optimized with the introduction of demand responsive service. The above analysis proved that the detours can be served by demand responsive minibuses, both concerning the passenger traffic and operation. This was supported by data on passenger traffic, as the users of bus detours do not outnumber the capacities offered by minibuses. Furthermore, a significant decrease in operational costs can be achieved by the new system. Consequently, after changing the system, the present funding can be used for extra services (e.g., hourly minibus services from ‘dead-end villages’ connecting to the main route service instead of the present occasional system), which would enhance the accessibility of these settlements.
It is important to note that it is advisable to include the DRT service in the public service contract so that the expenses not covered by the incomes of the company could be refunded. This entails the signing of a policy contract, which might be considered a risk.
The application of the seven-step process proved our hypothesis, i.e., public transport in areas with small villages can be made sustainable both for passengers and operators by the introduction of a demand responsive transport (DRT) system. Besides this, the method presented here has limitations: It takes into account only the number of passengers as an influencing factor. However, the method can be supplemented with other parameters (e.g., road infrastructure condition of bus stops etc.) to enhance reliability.


