Article

Monitoring Air Quality and Estimation of Personal Exposure to Particulate Matter Using an Indoor Model and Artificial Neural Network

1
Department of Public Health Sciences, Korea University, Seoul 02841, Korea
2
Department of Materials Science and Engineering, Kumoh National Institute of Technology, 61 Daehak-ro (yangho-dong), Gumi 39177, Korea
3
Department of Environmental Sciences, Rutgers, The State University of New Jersey, 14 College Farm Road, New Brunswick, NJ 08901, USA
4
Andlinger Center for Energy and Environment, Princeton University, Princeton, NJ 08544, USA
*
Authors to whom correspondence should be addressed.
Sustainability 2020, 12(9), 3794; https://doi.org/10.3390/su12093794
Submission received: 9 April 2020 / Revised: 29 April 2020 / Accepted: 1 May 2020 / Published: 7 May 2020

Abstract

:
Exposure to particulate materials (PM) is known to cause respiratory and cardiovascular diseases. Respirable particles generated in closed spaces, such as underground parking garages (UPGs), have been reported to be a potential threat to respiratory health. This study reports the concentration of pollutants (PM, TVOC, CO) in UPGs under various operating conditions of heating, ventilation and air-conditioning (HVAC) systems using a real-time monitoring system with a prototype made up of integrated sensors. In addition, prediction of the PM concentration was implemented using modeling from vehicle traffic volumes and an artificial neural network (ANN), based on environmental factors. The predicted PM concentrations were compared with the level acquired from the real-time monitoring. The measured PM10 concentrations of UPGs were higher than the modeled PM10 due to short-term sources induced by vehicles. The average inhalable and respirable dosage for adult was calculated for the evaluation of health effects. The ANN predicted PM concentration showed a close correlation with measurements resulting in R2 ranging from 0.69 to 0.87. This study demonstrates the feasibility of the use of the air quality monitoring system for personal-exposure to vehicle-induced pollutant in UPGs and the potential application of modeling and ANN for the evaluation of the indoor air quality.

1. Introduction

The development of underground parking garages (UPGs) has become widespread in cities due to the increasing number of automobiles [1,2,3,4,5]. Nowadays, newly developed commercial and/or residential areas are mostly designed with UPGs equipped with ventilation systems (including natural ventilation); however, the air quality in UPGs has become an issue due to the impact of the volume of traffic on indoor air quality [1,2,5,6,7]. Pollutants such as carbon monoxide (CO), carbon dioxide (CO2), nitrogen dioxide (NO2), particulate matter (PM), and volatile carbon (quantified as total volatile carbon; TVOC) are released from automobiles in these parking garages [8,9,10,11].
Indoor air quality is affected by a constantly changing interaction of indoor and outdoor factors. Pollutants generated from automobiles may accumulate in UPGs, and/or penetrate into the indoor environment [1,8,12]. Particulate materials (PM10, PM2.5) within buildings are mostly derived from outdoor particles drawn in through HVAC systems [1,13,14,15,16,17,18]. If the ventilation system is ineffective at completely discharging vehicle-induced pollutants from enclosed underground spaces, the pollutants can accumulate in these indoor environments and cause serious health effects in human beings [2,3,6,19,20,21,22]. In urban environments, many commercial building designs have become larger due to commercialization and urbanization, and many strategies for the improvement of indoor air quality have been attempted to achieve energy conservation and reduction of the chimney effect. In the closed condition of a large building, outdoor pollutants generated by factors such as yellow dust and automobile soot can infiltrate the indoor environment.
There are few studies on how to cope with the symptoms of sick building syndrome and air pollution caused by microbial diffusion and reactions, such as severe acute respiratory syndrome (SARS) [23,24], and thus, an integrated indoor air quality management system using infiltration suppression technology based on an integrated sensor module is required for indoor building ventilation systems. To control the indoor air quality, integrated strategies should be considered [25], including managing the sources of pollutants, diluting pollutants, removing indoor pollutants from the building through ventilation systems, and using filtration to rid the air of pollutants.
Even though underground parking garages are popular in many urbanized living environments, little is known about air quality monitoring in underground parking garages. The Intergovernmental Panel on Climate Change (IPCC) has presented artificial intelligence (AI), big data, and the Internet of Things (IoT) technologies as solutions to climate change [26]. Currently, Korea is attempting weather forecasting using AI. In other words, the IoT can be used to secure accuracy and observation density in weather observation data, and digital technologies such as computer graphics can be used while collecting temperature, humidity, and wind velocity information.
Instead of indoor air quality measurement and analysis, mathematical predictive models can be a good alternative to providing reasonably accurate estimates. In this case, indoor air pollution modeling identifies the relative contributions of indoor and outdoor sources, weather, atmospheric concentration, deposition and other factors, which can contribute to indoor air quality monitoring [27]. In addition, as predicted by extreme weather, concentration prediction models, after several hours, allow effective procedures in the area of indoor air quality monitoring [28]. Moreover, artificial neural networks (ANN) are one of the preferred technologies in predictive models. Several studies on complex system prediction have proven that the performance of ANN is generally superior to traditional statistical methods and deterministic modeling systems, due to the limited need for computational efficiency, generalization ability, and prior knowledge of the modeling process structure [29,30,31].
According to the World Health Organization (WHO), the global air pollution problem extends to the majority of the countries around the world [32,33]. To protect all indoor building occupants and maintain safe and healthy indoor environments, considerations for buildings should include occupant health, sustainability, energy efficiency, and the changing outdoor air quality [34]. Controlling the indoor air quality is paramount for building the sustainable cities of the future. Some cities are using technology to reduce the harmful effects of polluted air as well as developing technology for smart city initiatives based on health vulnerability to air pollution. Since artificial neural network (ANN) significantly improve the accuracy of prediction, they have been frequently used as a non-linear tool in recent air quality forecasting [35].
Past studies have shown that ANN can be applied to forecast air pollution whereas ANN has been used little to estimate air quality associated with the health effects [36,37,38,39]. Given the lack of data on personal exposure to respirable particles by penetration into buildings, a personal indoor exposure model with the calculated PM dosage and ANN model could be proposed to predict the pollutant concentration and evaluate the health effect.
This research has the following objectives: to (1) characterize concentrations of pollutants in UPGs and indoor environments; (2) evaluate the effect of the ventilation operating rates and the influence of the seasons; and (3) estimate the modeled personal exposure to PM associated with the health effects and predict the indoor PM concentration using artificial neural network.

2. Materials and Methods

2.1. Monitoring Locations

This study was conducted in spring (3/27/2014–4/30/2014, 4/1/2015–4/28/2015), summer (6/27/2014–8/30/2014, 6/1/2015–8/2/2015) and winter (12/16/2014–2/20/2015) in two underground parking garages (UPG1, UPG2) and indoor environments (IE1, IE2) between 2014 and 2016. The sampling locations (Figure 1a) were approximately 15–20 years old and located in a commercial area close to heavy-traffic roads (4000–9000 cars/day): 250–500 cars/day for UPG1 and 200–450 cars/day for UPG2. Figure 1b shows the number of automobiles based on business-related trips obtained from the Korea Transportation Safety Authority, which was used to determine future background traffic volumes for the modelling in this study. The characteristics of the different locations selected for this study are presented in Table 1.

2.2. Pollutants Measurements and Instrumentation

During the sampling period, the inlets of the indoor sampler were located at about 1.2–1.5 m above ground level at mid-points in the sampled indoor areas. Indoor and outdoor particulate matter (PM10, PM2.5) were determined by Grimm 1.109 OPC (Grimm Technologies Inc., Douglasville, GA, USA) every 5 min, both indoors and outdoors.
For TVOC and CO, the concentrations in both UPGs and outdoors were determined by Graywolf’s portable semi-permanent VOC meter (Graywolf Sensing Solutions, LLC., Shelton, CT, USA) and CO meter (Testo SE & Co., West Chester, PA, USA), respectively. Additionally, temperature (Temp.) and relative humidity (RH) were investigated using a thermo-hygrometer (Testo SE & Co.) in indoor and outdoor locations, respectively.
The integrated sensor platform consisted of sensor modules (see Supplementary Materials Figure S1) for Temp. (T9602-3, ELT Sensor Corp., Bucheon, Gyeonggi-do, Korea), RH (Humi-01, Digi-key Electronics, MN, USA), PM (DP-100, LABCO, Korea), CO2 (M-530, ELT Sensor Corp., Korea), CO (COD-100, ELT Sensor Corp., Korea), and TVOC (AQM-100, ELT Sensor Corp., Korea).
To evaluate the efficiency of pollutant reduction, variations of PM were investigated as a function of operation conditions based on the air volume in the HVAC system: NV (natural ventilation), 20% (OP1), 50% (OP2), and 100% (OP3) for operation conditions.

2.3. Estimation of Personal Exposure Using an Indoor Model

To estimate the indoor PM10 concentrations, we used given knowledge of activities (based on indoor pollutant sources and outdoor automobiles) in IE1 (adjacent to UPG1, without a window), and an indoor model from Koutrakis et al. [40].
C in = C out + t = 1 n E i α   + D
where Cin [μg/m3] is the indoor PM10 concentration, Cout [μg/m3] is the outdoor PM10 concentration, α [h−1] is the air exchange rate, p is the dimensionless penetration efficiency factor, Ei [μg/h] is the emission rate for the ith indoor particle source, V [m3] represents the room volume, and D [h−1] is the particle deposition factor. The parameters (α, D, p, E, applied in office) for indoor environments were found from the literature [40,41]. We performed preliminary tests of particles in indoor environments based on the indoor particle model [42]. The calculated p and D ranged from 0.8 to 1.0 and from 0.35 to 0.40 h−1, respectively, and these values were similar to those reported in a past study [41]. We have applied the values measured in office environments: 1.2 h−1 for α, 0.39 h−1 for D, 1.0 for p and 1.1 μg/h for E. For the room volume, each area and height in the indoor environment were used in Equation (1).
To estimate health effects related to the PM exposure, we considered monthly input data: the physical attributes of the building (air exchange rate, penetration efficiency factor, room volume, particle deposition factor) and human activity induced indoor sources (short-term activity, automobile frequency). The PM dosage for adult was considered for output data as below:
Dose = DF   × PM × TV × f × t
where DF is the deposition fractions of PM in different parts of Human respiratory tract (HRT) [dimensionless], PM is concentration in indoors [μg/m3], TV is tidal volume [m3/breath], f is the breathing frequency [breaths/min], t is the exposure time [min]. Deposition fractions were calculated by International Commission on Radiological Protection model (ICRP) [43]. Human exposure to PM could include human factors, especially adult such as physiological (tidal volume, breathing frequency) and behavioral factors (exposure time): 0.5 L/breath for TV, 16 breath/min for f and 540 min (as working time).

2.4. Prediction of Indoor PM Concentration Using an ANN

The indoor PM concentration was predicted using an ANN, which consisted of an input layer, multi-layers (including a hidden layer), and an output layer [44]. Layers composed of multiple working neurons were connected to all neurons in a neighboring layer through adaptive synaptic weights, and they summed up all input results received from the previous layer and formed a neuron output according to the transmission function. For the transfer function in the hidden layer, the logistic sigmoid function was used and the Levenberg-Marquart (LM) [44,45] algorithm was applied to the early stopping [46].
Learning is determined by a network to change weights using a backpropagation algorithm through two phases. For the forward phase, the training data set is propagated through the hidden layer and comes out the neural network through the output layer, and the output value is compared to the actual target output value. The error between the output layer and the actual values is calculated and propagated back toward the hidden layer [44,47], while in the backward phase, for the adjustment of weight, the derivative of the network error is fed back to the network and weighted to reduce the error for each iteration, requiring the neural model to produce the desired output. The prediction of PM concentrations was conducted for two days in advance, and the predicted PM concentration for one day in advance was also used as input data for the next day’s prediction, together with other prediction data [48].
To reduce the learning error, the forward and reverse propagation of the weight were repeated, and the calculation of the error and the total error were calculated. This method continued until a predetermined threshold error. The errors of the neural network generally continued until convergence was minimized using a root mean squared error (RMSE) [35], prediction accuracy (PA), normalized absolute error (NAE), and the index of agreement (IA) [35]. To verify the accuracy of the data obtained from the ANN model, the coefficient of determination (R2) was calculated; the closer this value is to 1, the higher the accuracy. We used 80% of the input data for the learning algorithm, and the remaining 20% of data were applied to a cross-validation method that attempted to validate the indoor air quality prediction data.
The equations of performance indicators are from Karppinen et al. [49]:
RMSE = 1 N 1 i = 1 N ( P i O i ) 2
PA = i = 1 N ( P i   P ¯ ) i = 1 N ( O i   O ¯ )
NAE = i N | P i O i | i = 1 N O i
IA = 1 [ i = 1 N ( P O i ) 2 i = 1 N ( | P i   O ¯ | + | O i   O ¯ | ) 2 ]
where N is the number of samples, Oi is the concentrations of indoor PM10, Pi is the predicted indoor PM (PM10, PM2.5) and O ¯ is the mean value of measured PM (PM10, PM2.5).
In this study, one-way ANOVA was used for the PM concentrations as a function of the investigated locations (i.e., UPG1, UPG2, IE1 and IE2) and ventilation operating (NV, OP1, OP2, OP3). For significant effects, all multiple pairwise comparisons were performed using the Holm–Sidak method with Sigma Plot 2011 (version 12.3, Systat Software Inc., San Jose, CA, USA). Data normality was assessed across all replicates using the Shapiro–Wilk test, and, if needed, a nonparametric Mann–Whitney rank-sum test was used to determine significantly different pairs.

3. Results

3.1. Analysis of Variations in the Measured Particulate Matter

To investigate the variations in PM concentrations (PM10, PM2.5) as a function of the effect of the ventilation in an HVAC system, the conditions of ventilation were determined as follows: NV for natural ventilation; 20% of air volume for OP1; 50% of air volume for OP2; 100% air volume for OP3 (Figure 2).
The ventilation system mostly operated with a limited air volume (OP1: 20% and OP2: 50%), but maximum air volume (OP3: 100%) was applied in the morning and afternoon. Normally, it is operated differently for the underground parking garages’ HVAC systems. For the indoor environment, the HVAC system was operated regularly, once (for 1 h) in the morning and once (for 1 h) in the afternoon, every day, whereas the HVAC system in the underground parking garages operated continuously for 2 h at night due to heavy and/or accumulated pollutants.
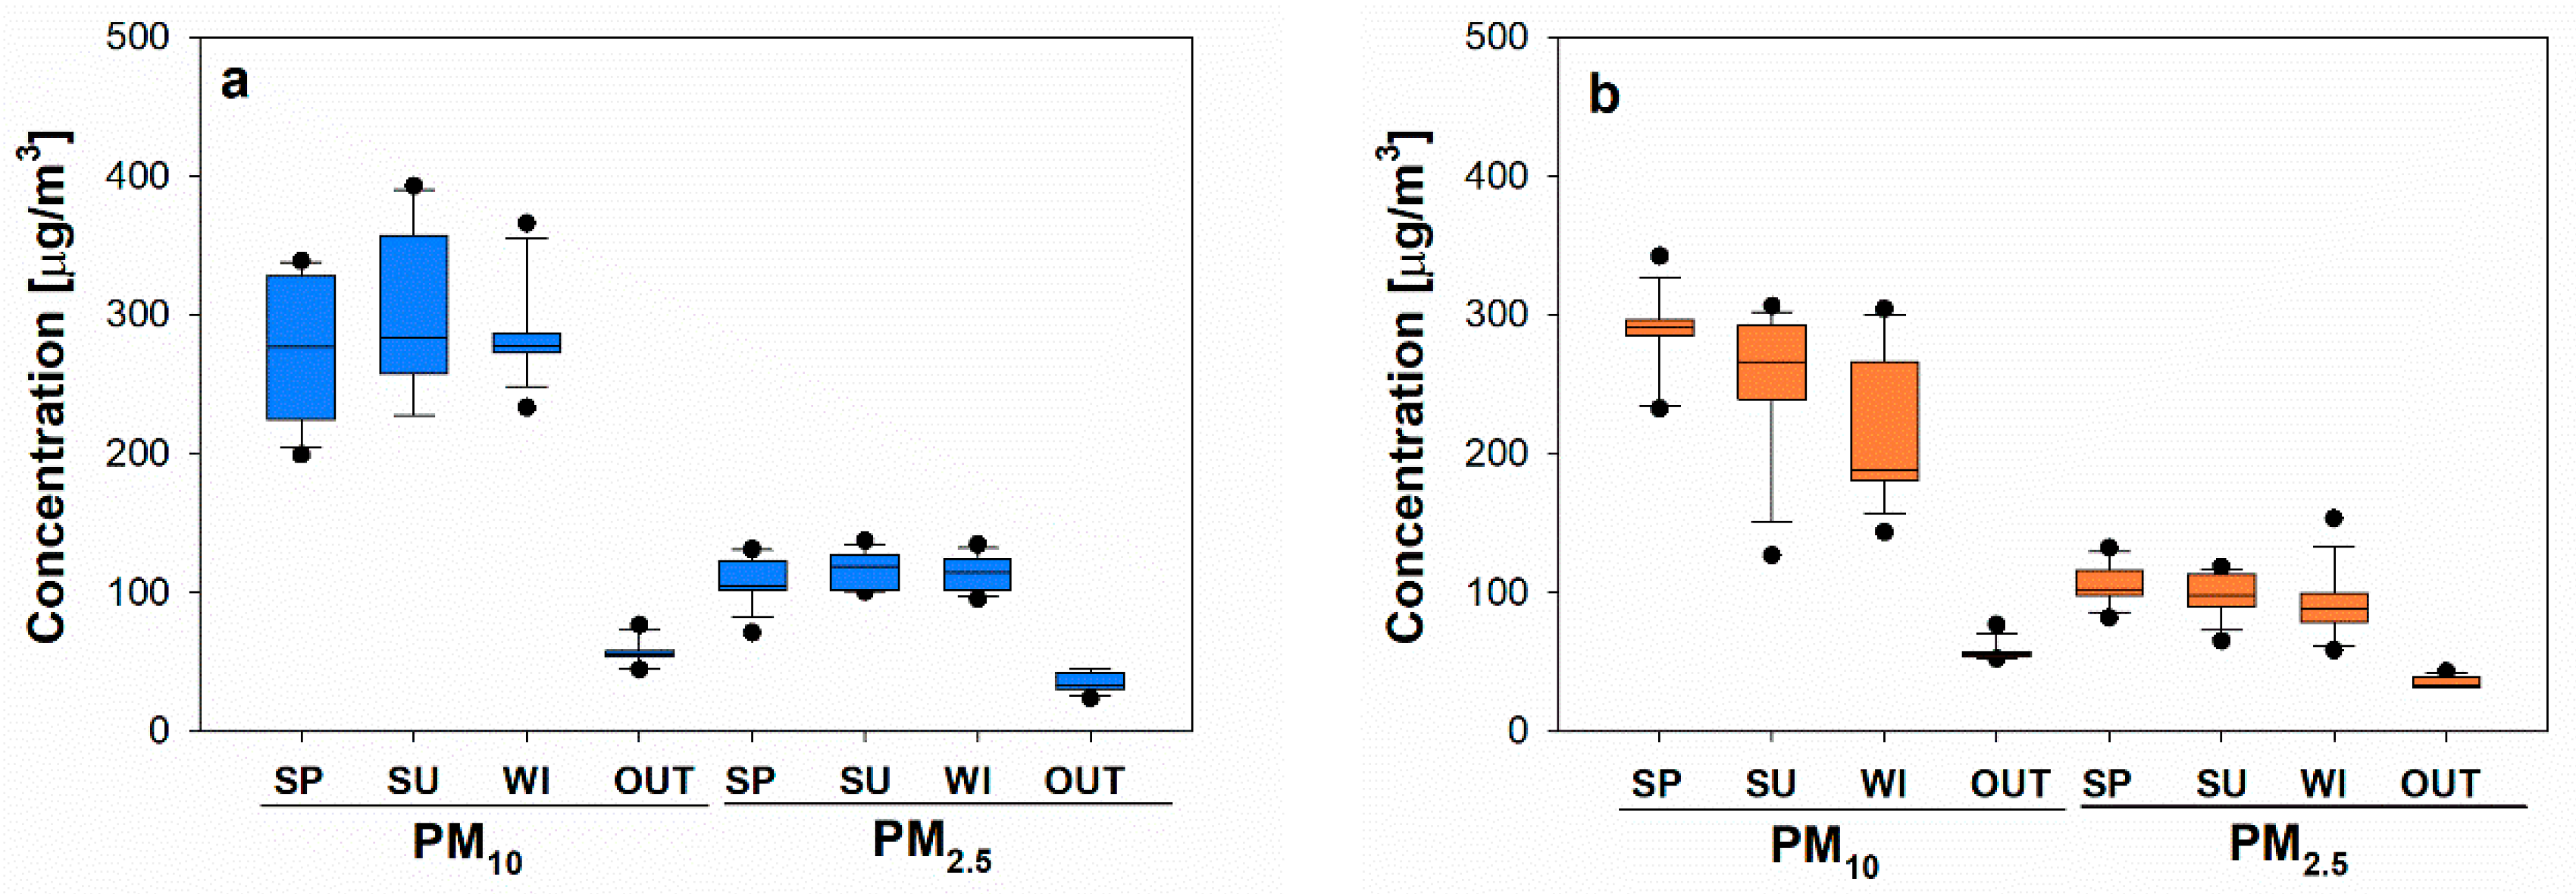
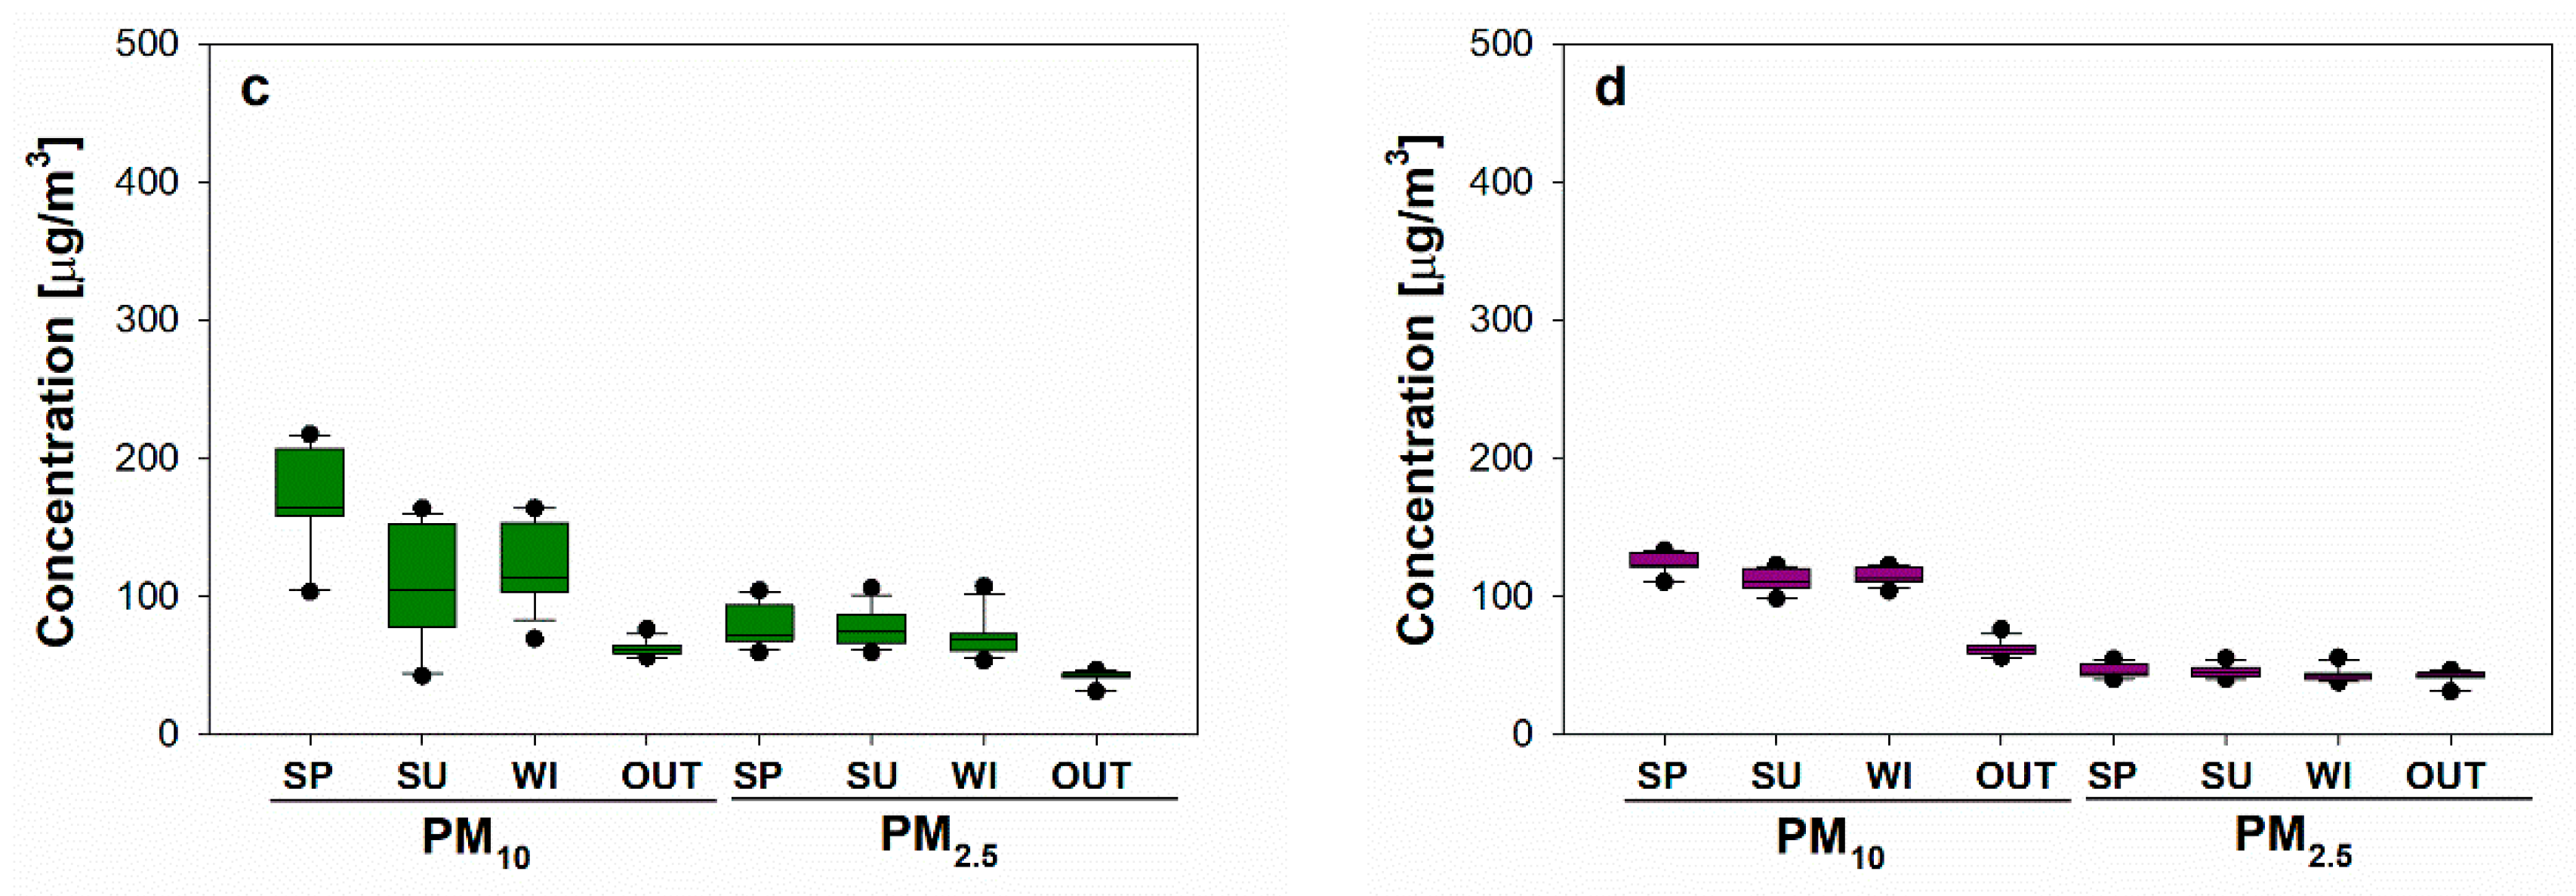
Table 2 shows the concentrations of PM as a function of ventilation system during spring (SP), summer (SU) and winter (WI) seasons.
When the HVAC system was operated at an air volume of 100% in the underground parking garage, the concentrations for PM10 and PM2.5 achieved with natural ventilation (NV, 0% ventilation operation) were 199.5 μg/m3 (SP) to 386 μg/m3 (SU) and 71.1 μg/m3 (SP) to 137.4 μg/m3 (SU), respectively. When the different ventilations were applied, the PM10 concentrations were 127.0 μg/m3 (SU) to 342.5 μg/m3 (SP) for OP1, 69.5 μg/m3 (WI) to 217.5 μg/m3 (SP) for OP2, and 99.5 μg/m3 (SU) to 133.5 μg/m3 (SP) for OP3. For PM2.5, they were 65.2 μg/m3 (SU) to 153.4 μg/m3 (WI) for OP1, 59.4 μg/m3 (WI) to 107.4 μg/m3 (WI) for OP2, and 39.9 μg/m3 (SP) to 55.8 μg/m3 (WI) for OP3.
When NV (natural ventilation) was applied during the spring, summer and winter seasons, both PM10 and PM2.5 concentrations showed minimum values in spring and maximum concentrations in summer, while when the operation rates of the HVAC system were changed, the highest PM10 concentration was found in the spring season, and for PM2.5 the value measured during the winter season showed the highest value.
Table 3 shows pairwise comparisons of PM10 concentrations by different seasons. There was a significant difference for PM10 between SP and WI (p < 0.001) for OP1 operation of the HVAC system, and when OP2 was applied there were significant differences for PM10 between SP and SU/WI (p < 0.001 for between SP and SU, p = 0.004 for between SP and WI). For OP3, there were also significant differences for PM10 between SP and SU (p < 0.001) and between SU and WI (p = 0.004). Meanwhile, there was only a significant difference for PM2.5 between SP and WI with OP1 operation of the HVAC system (p = 0.01).
As a function of the operation of the HVAC system, there were significant differences for the concentrations of PM10 between operations in the HVAC system during spring, summer and winter (except in the case of p = 0.174 between NV and OP1 for SP, and p = 0.878 between OP2 and OP3 for WI).
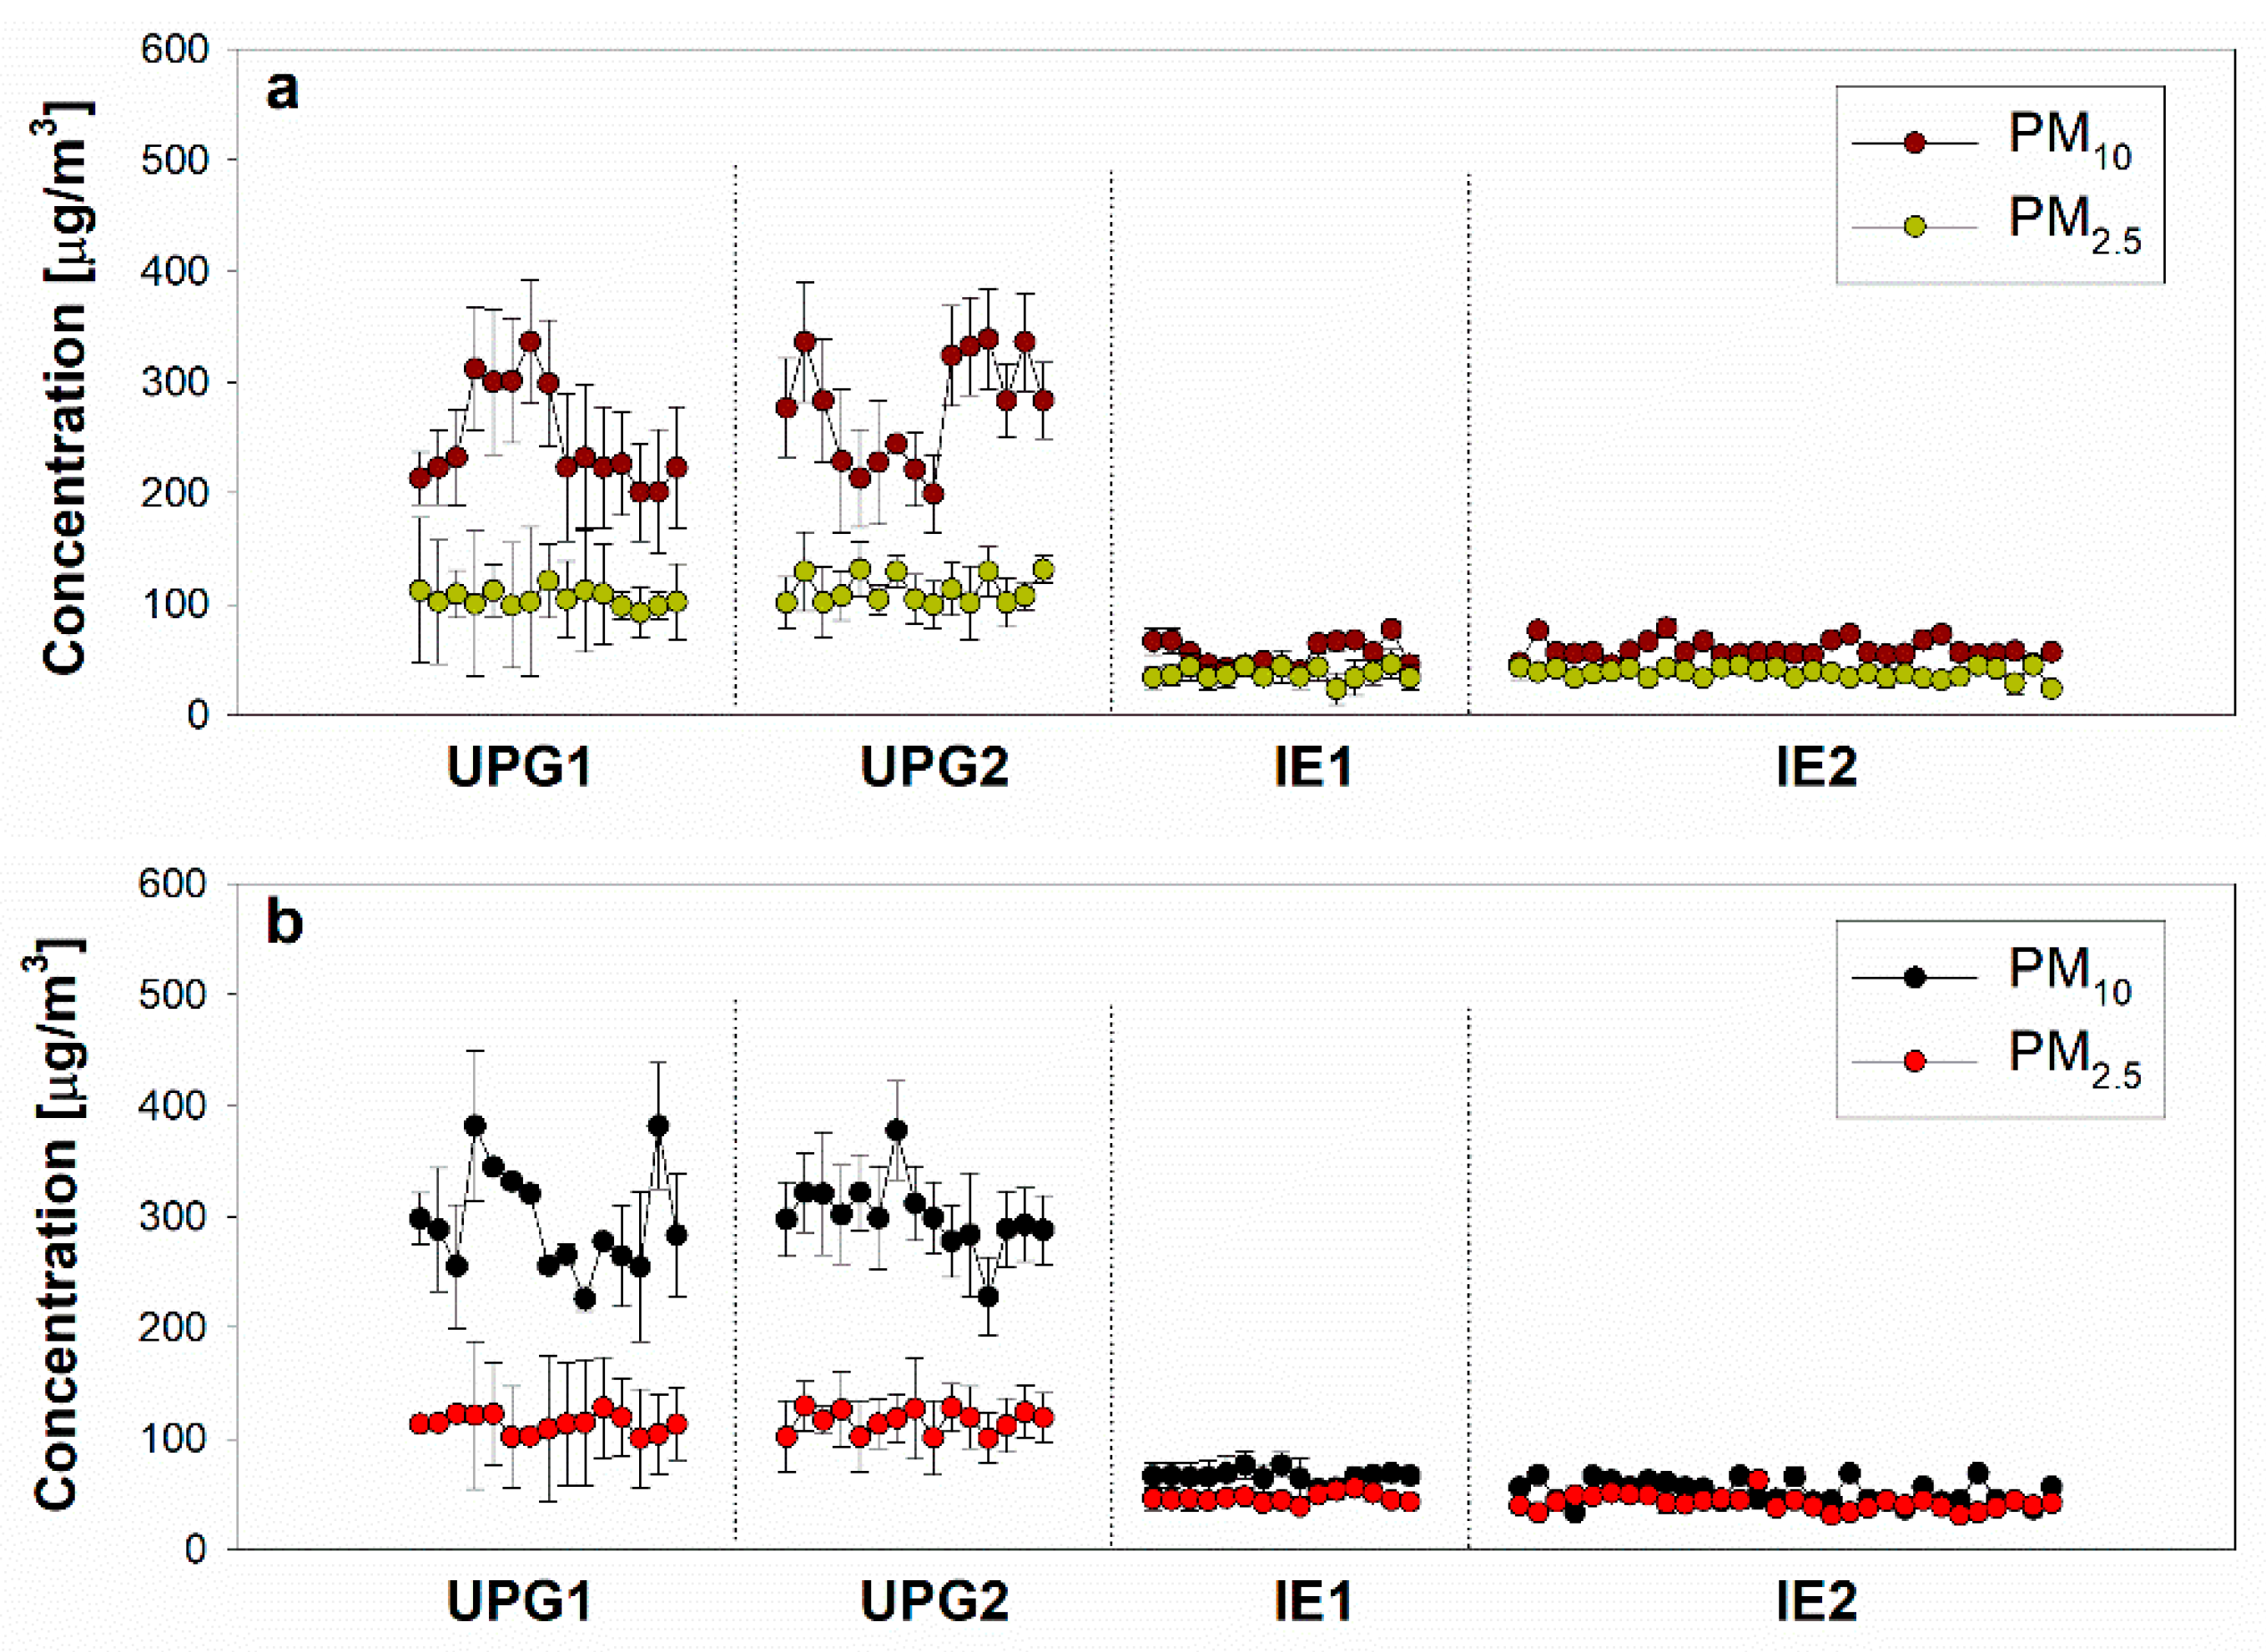
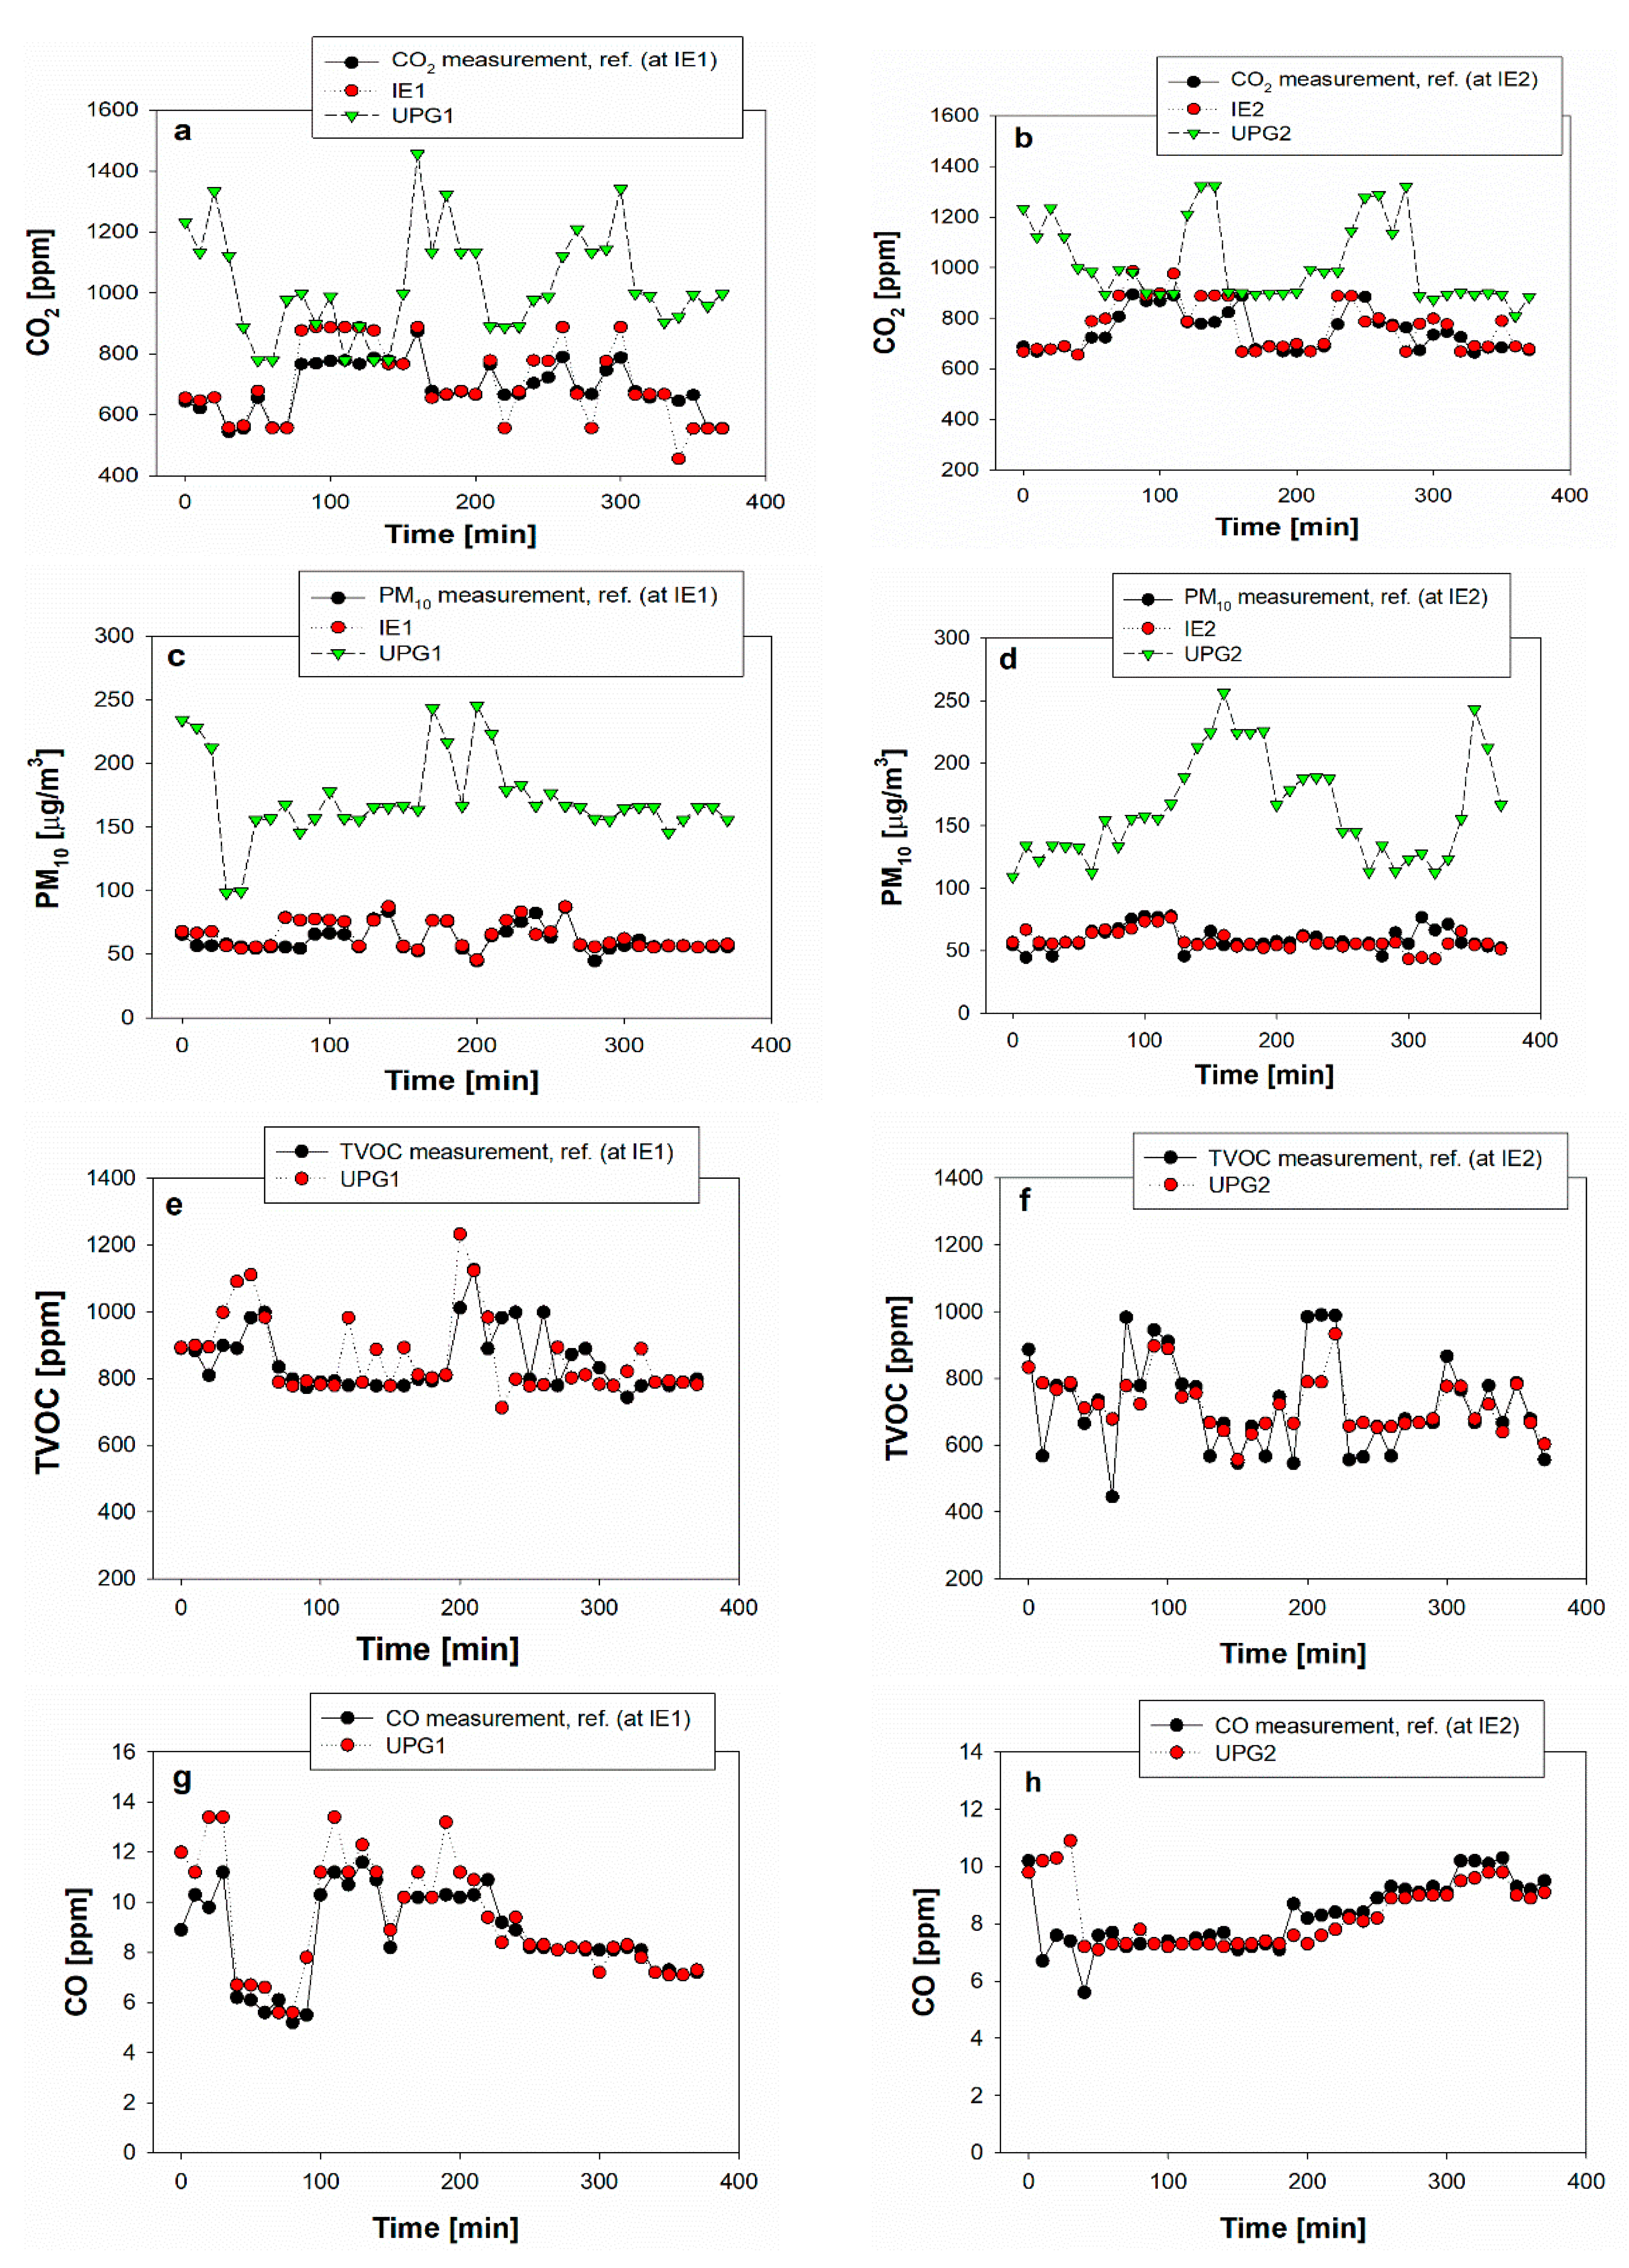
In Korea, natural ventilation is common. The results in Figure 3 were obtained by measuring the PM concentration during natural ventilation, when the HVAC system was not operating. The concentration of PM10 measured in the two underground parking garages (UPG1, UPG2) for the four seasons exceeded Korea’s regulation (indoors, for multi-use facilities: 100–200 μg/m3).
During natural ventilation, the average four-hour indoor PM10 and PM2.5 concentrations for all investigated environments (UPG1, UPG2, IE1, IE2) during spring, summer and winter ranged from 199.5 to 382.0 μg/m3 and from 92.3 to 131.4 μg/m3; from 199.5 to 336.5 μg/m3, from 255.6 to 322.0 μg/m3, and from 222.0 to 283.5 μg/m3 for PM10 during spring, summer and winter, respectively; from 92.3 to 131.4 μg/m3, from 100.3 to 126.9 μg/m3, and from 98.9 to 128.7 μg/m3 for PM2.5 during spring, summer and winter, respectively. The average concentrations for PM (PM10 and PM2.5) are shown in Table 4.

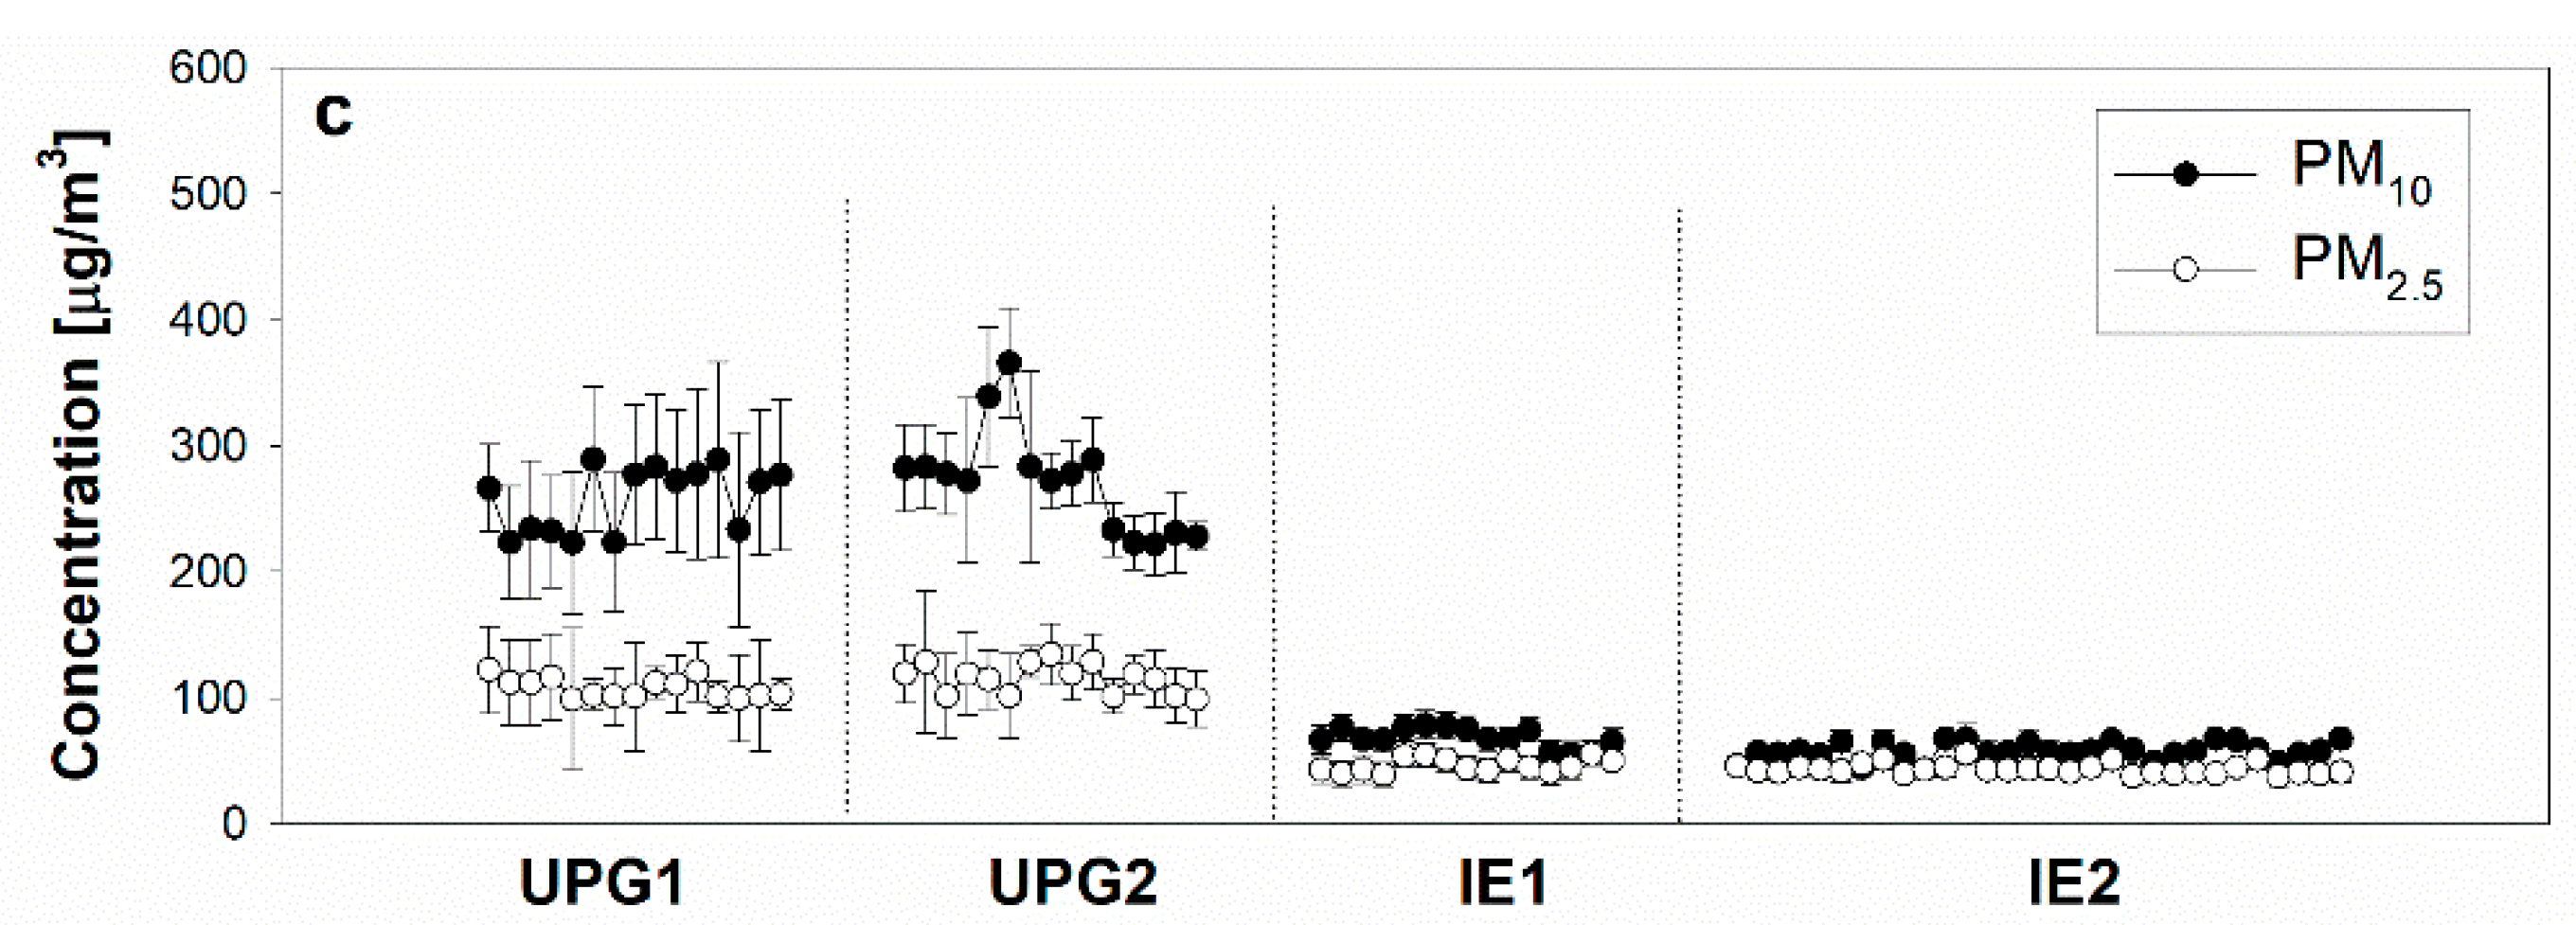
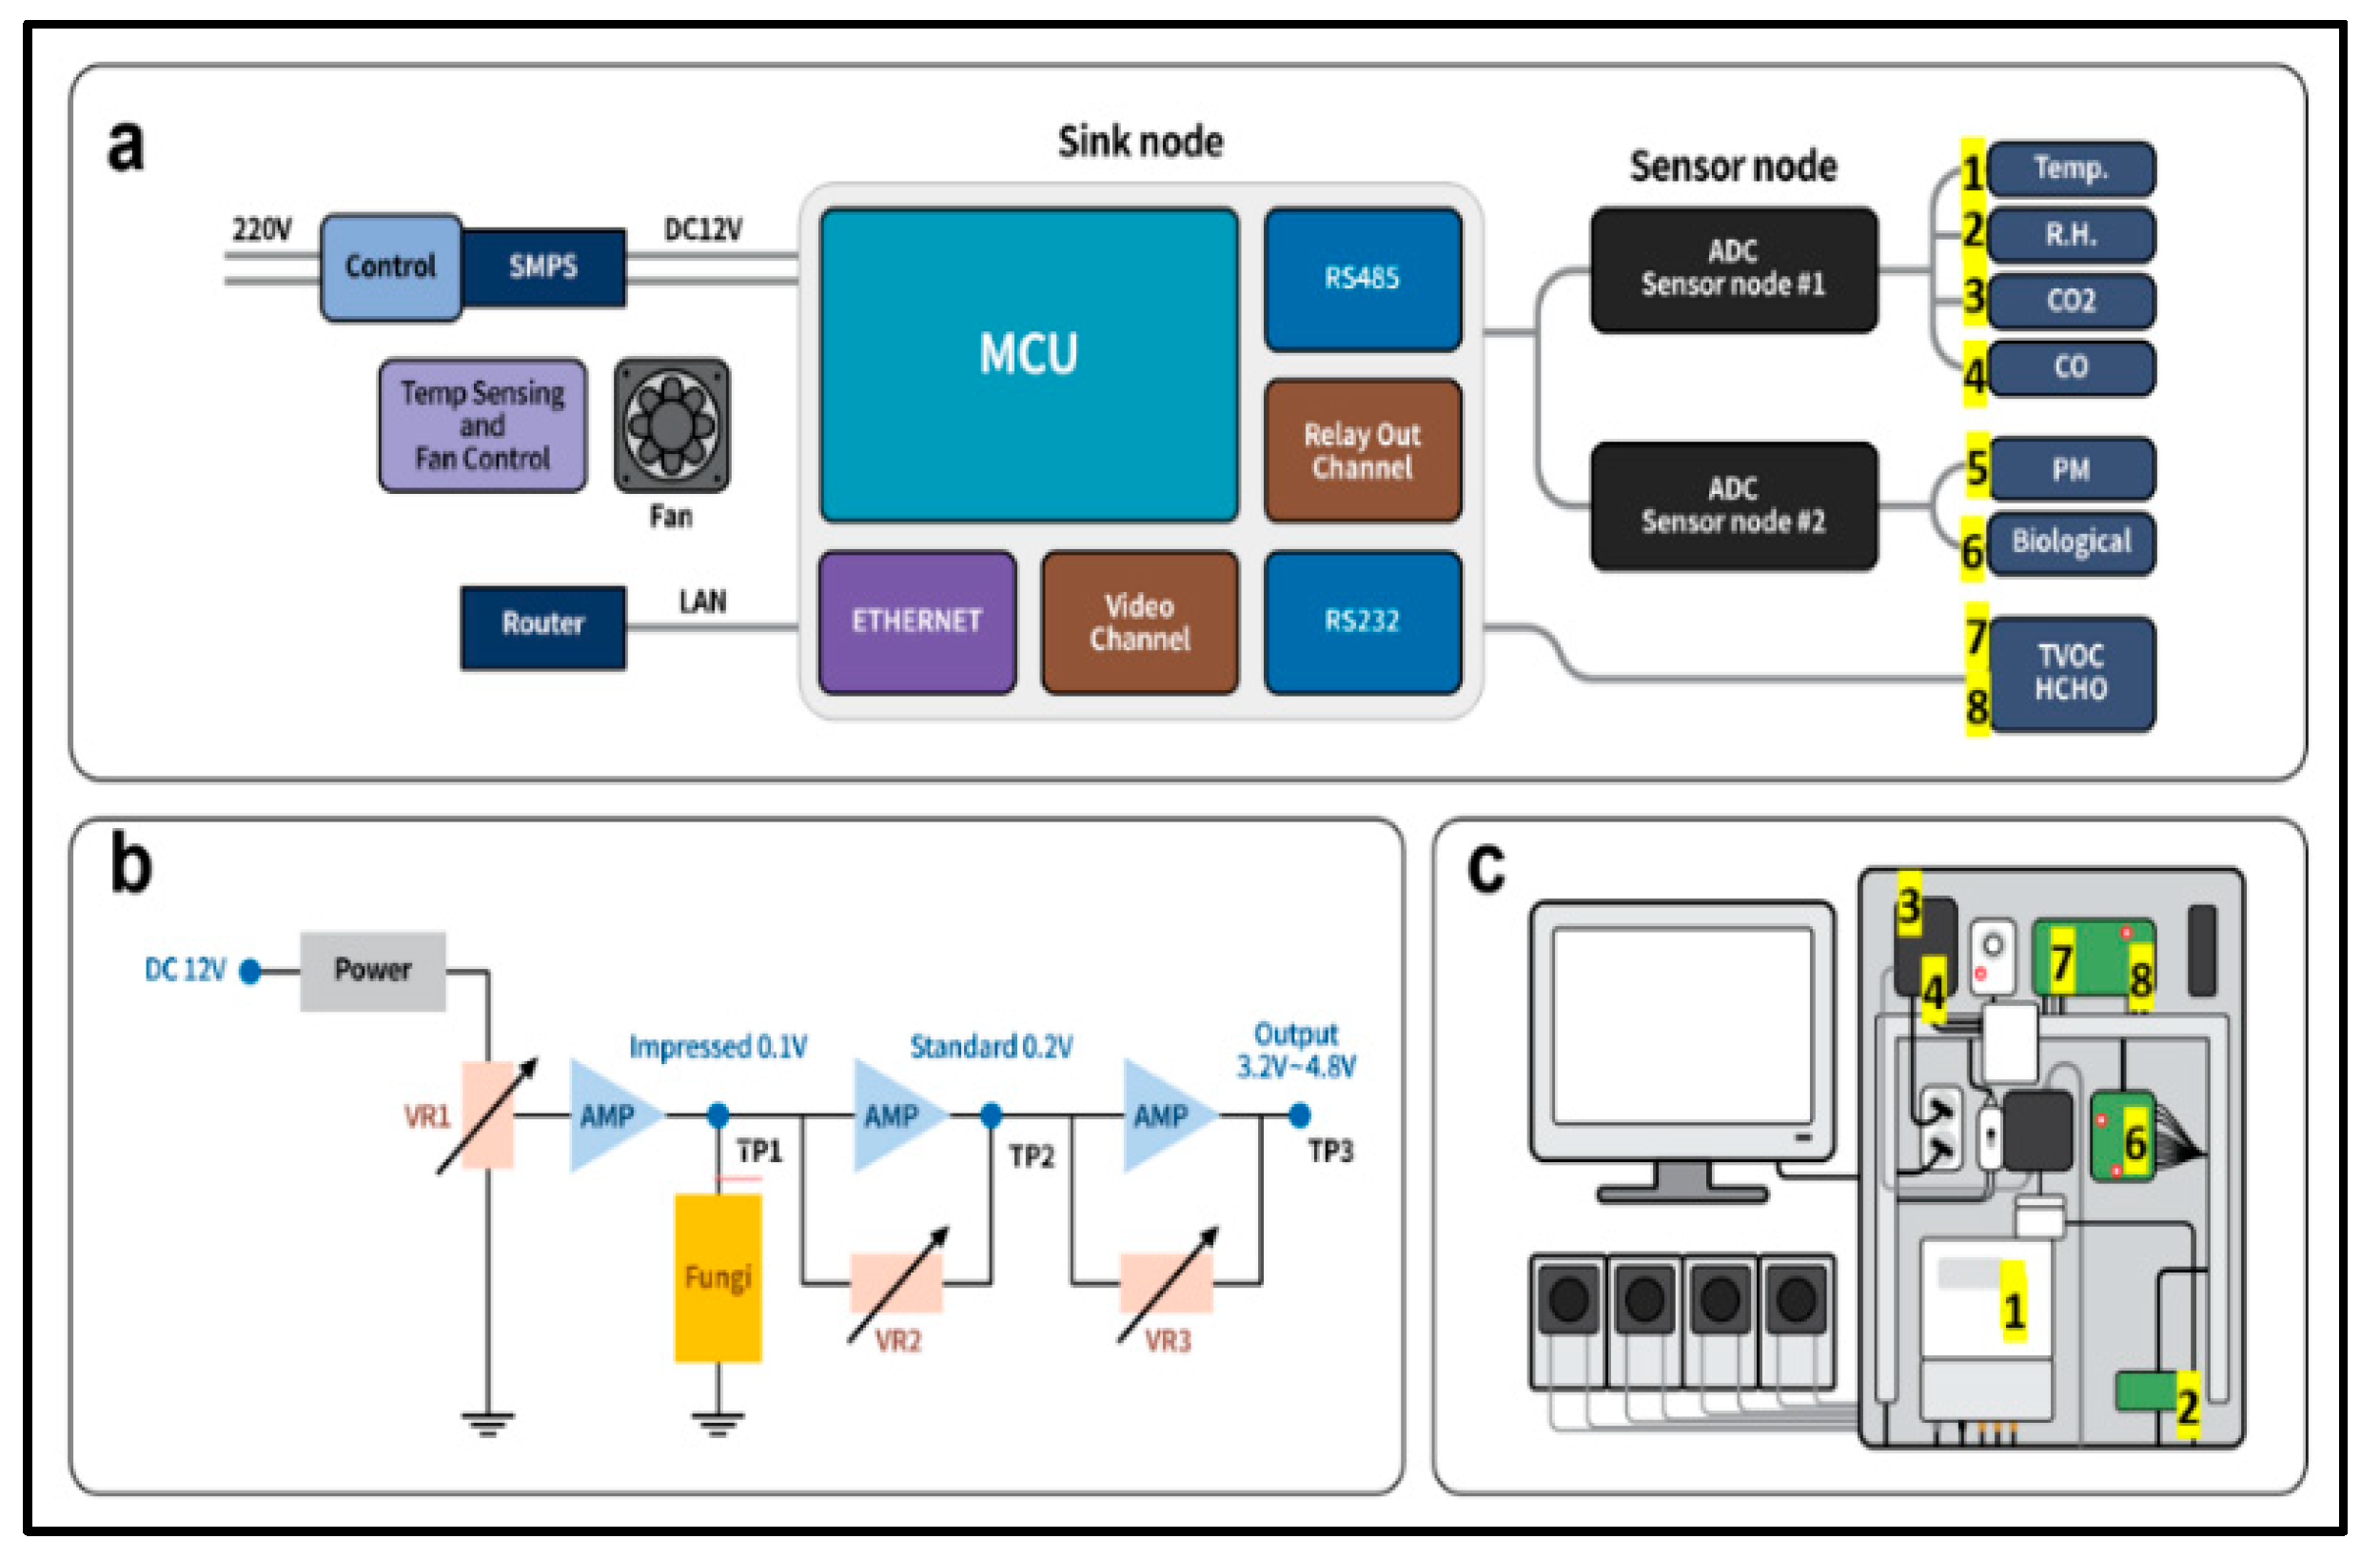
3.2. Air Quality Monitoring and Management

As shown in Figure 4, the integrated sensor platform for real-time indoor air quality monitoring is a wireless sensor module that can independently detect the concentration of each pollutant and exhibits robustness against signal model issues and fluctuations of the signal patterns received from the analog digital converter (ADC) in the micro-controller unit. The wireless network also includes video channel sensor nodes, which are triggered upon detection of a fall, in order to analyze the field-of-view.
Based on the real-time integrated sensor platform (Figure 4), real-time indoor air quality monitoring was conducted with natural ventilation for 400 min in two underground parking garages (UPG1 and UPG2) and two indoor environments (IE1 and IE2) (Figure 5). For each indoor air quality factor (CO2, PM10, TVOC, CO), the concentrations measured in UPG1, UPG2, IE1, and IE2 were monitored in the computer of an integrated-sensor platform, and measurements using each measurement reference device were monitored in one of the indoor environment locations (Figure S2): IE1 and IE2 for UPG1 and UPG2, respectively. As the results of indoor air quality monitoring with natural ventilation using an integrated sensor platform show, the CO2 concentrations over 400 minutes ranged from 556 to 887 ppm (at IE1) and from 778 to 1456 ppm (at UPG1), from 667 to 987 ppm (at IE2), and from 807 to 1322 ppm (at UPG2). The PM10 concentrations ranged from 53.4 to 87.4 μg/m3 (at IE1), from 155.6 to 245.4 μg/m3 (at UPG1), from 51.2 to 65.4 μg/m3 (at IE2), and from 109.3 to 256.3 μg/m3 (at UPG2).
For the management of air quality, the indoor air quality data were acquired with the integrated sensor unit and transmitted through the main server using the data transmission (S2) system (Supplementary material Figure S3). The main server can consolidate the data related to indoor air quality and transmit all the data being monitored. In addition, the collected data transmitted to the monitoring control room are used to determine whether the factors influencing the air quality, measured through air quality prediction (S3) (Supplementary material Figure S3), fall within the normal regulated and/or controlled range. The integrated module system uses an automatic algorithm to judge a measurement whether the HVAC system is available based on the outdoor air quality. If the values are out of the normal/regulated range, the readout is considered abnormal, and it is judged in real time whether the indoor air quality is normal by judging individual air quality influencing factors. Further, air quality prediction (S3) is performed to determine the inflow path for the factors influencing the air quality that are determined to be abnormal (S4) (Supplementary material Figure S3). Penetration estimation (S4) can be used to divide the air quality factors into particles and gases in the monitoring control room and examine the sources of the factors influencing the air quality, such as particles and gas. Further, penetration inhibition (S5) is a step for suppressing penetration of the factors influencing the air quality through the inflow path identified by penetration estimation (S4) (Supplementary material Figure S3). Each data point collected for the sensor module was linked to the Zigbee and should be linked to the (Machine to Machine) Gateway. The linked data can be collected by a gathering server based on HTTP and JSON standards. However, many sensors were installed at various measurement points for the indoor air quality measuring device (including the sensor), as the indoor and outdoor pollutant inflows are mainly caused by infiltration from the air handling unit (AHU), building interior, and elevator (escalator) in most closed buildings. Thus, sometimes, the data were obtained from a router and monitoring server in the middle of each floor, a suddenly broken corridor, and spaces at which disturbance is suspected.
Both TVOC and CO concentrations were monitored in the two underground parking garages (UPG1 and UPG2), and the concentrations of TVOC ranged from 778.3 to 1232.3 ppm and from 556.7 to 897.3 ppm in UPG1 and UPG2, respectively. The CO concentrations ranged from 5.6 to 13.2 ppm and from 7.2 to 10.9 ppm in UPG1 and UPG2, respectively. The concentrations for CO2, PM10, TVOC, and CO obtained from the integrated sensor platform fit well in the comparison of each measurement reference device (Figure 5). Table 5 shows the average concentrations for CO2, PM10, TVOC and CO investigated in UPG1, IPG2 and IE1 and IE2.

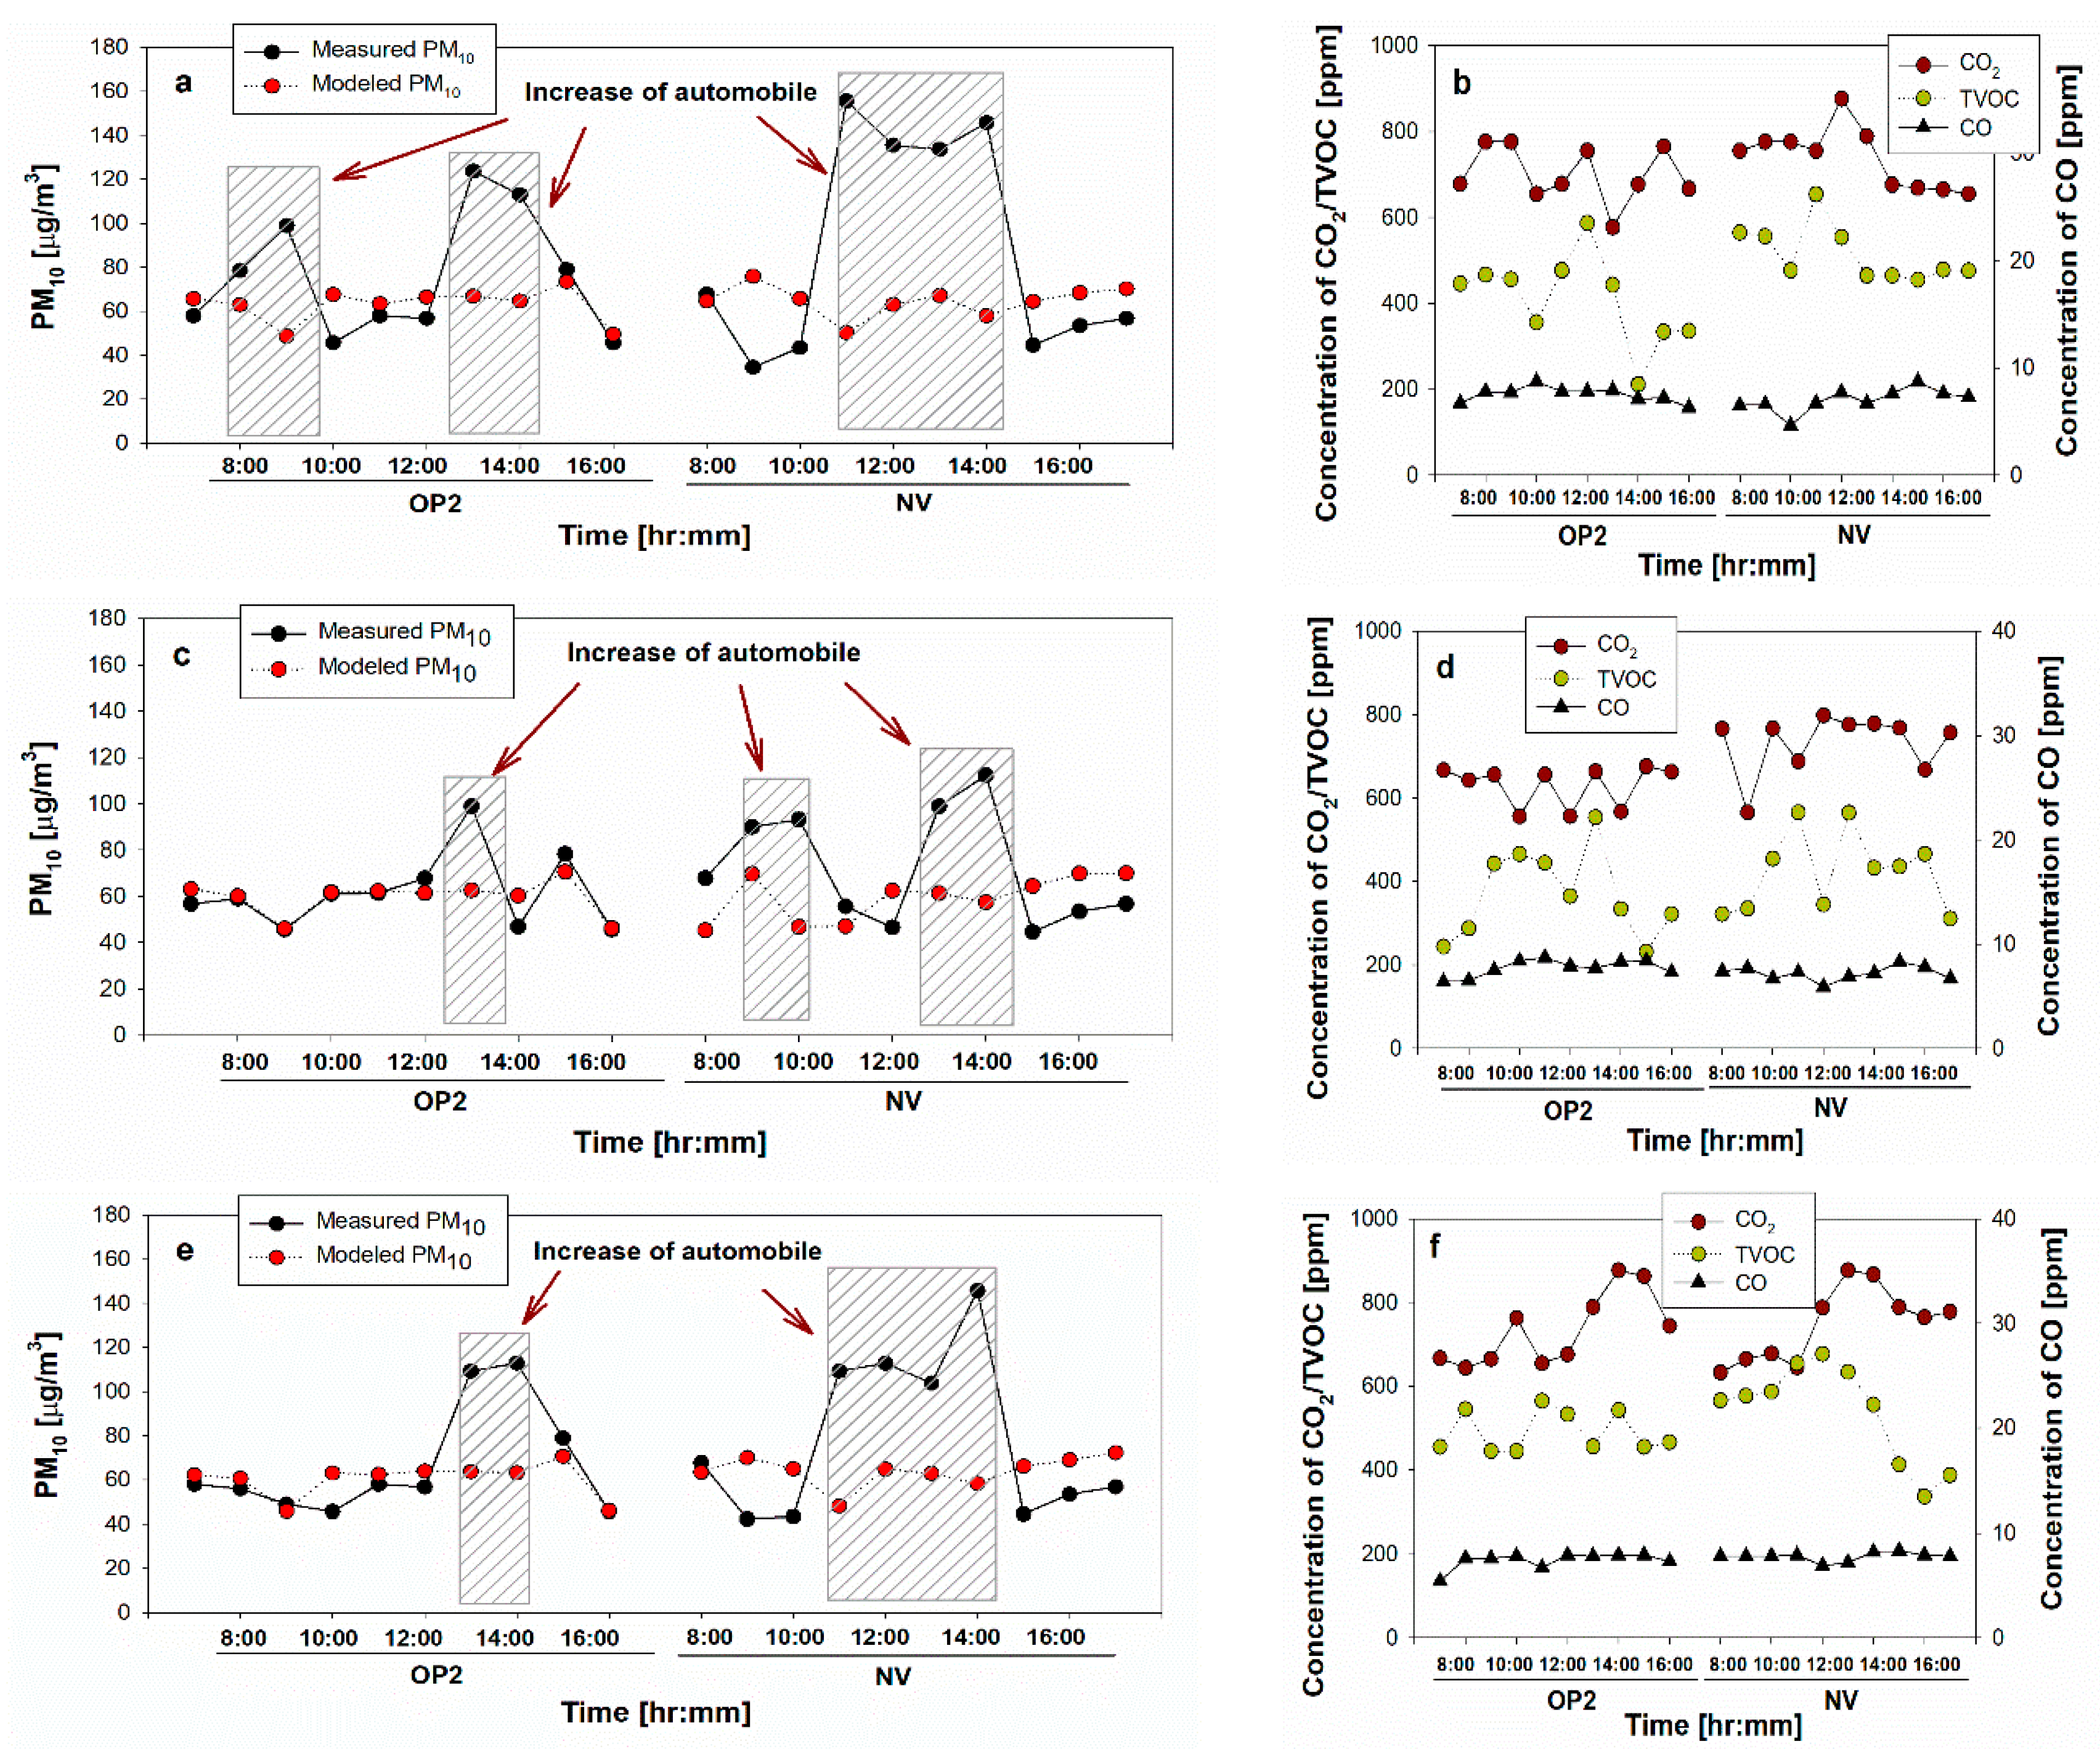
3.3. Modeled Personal Exposures in an Indoor Office and Underground Parking Garage

As shown in Figure 6, the indoor PM10 concentrations measured using the integrated sensor platform were compared to the modeled values using Equation (1). The personal PM10 exposure was estimated by using indoor and outdoor PM10 concentrations, separately. The indoor PM10 concentrations were modeled using the parameters for indoor environments taken from the literature with the measured outdoor PM10 concentrations: 1.2/h for α, 0.39/h for D, 1 for P, 0.001 μg/m3, calculated E2 based on PM10 concentrations in UPG1, 45 m3 for V.
The resulting measured exposure (for 8 h) of the 60 collected profiles (data obtained by monitoring 60 times) for (PM10, TVOC and CO) by the integrated sensor platform ranged from 34.5 to 155.6 μg/m3 (300–400 cars/day), from 33.4 to 112.3 μg/m3 (200–350 cars/day), and from 42.3 to 163.2 μg/m3 (250–400 cars/day), whereas the modeled exposure calculated by Equation (1) ranged from 42.3 to 73.5 μg/m3 (300–400 cars/day), from 36.7 to 70.6 μg/m3 (200–350 cars/day), and from 39.33 to 70.6 μg/m3 (250–400 cars/day) (Figure 5). Concentrations higher than the modeled concentrations showed a high variability over the day due to the penetrations of PM10 concentrations from UPG1. Due to the large contributions of the particle sources released from UPG1, exposure to the higher PM10 concentration of UPG1 was in most cases in a small office where an employee works all day long. The PM10 concentrations determined in IE1 were well approximated, except for the peak of PM10 due to an increase in the number of cars in UPG1.
These results show that an indoor environment is influenced by the PM10 concentrations released in UPG1. Actually, an increase in the number of cars in UPG1 meant an increase of PM10 concentrations and resulted in higher PM10 concentrations by pollutant penetration from UPG1.
With the PM10 concentrations, the concentrations of CO2, TVOC, and CO in an indoor environment (IE1) were investigated by the real-time indoor air quality monitoring system, and for HVAC ventilation, the OP2 operation was preferred based on the results of the reduction efficiency of PM10 (Figure 2). Figure 6 compares pollutant concentrations for PM10, CO2, TVOC, and CO between OP2 operation and natural ventilation. During OP2 operation in ventilation, the concentrations of CO2 were 577–776 ppm (300–400 cars/day), 557–676 ppm (200–350 cars/day), and 644–877 ppm (250–400 cars/day); the concentrations of TVOC were 211–587 ppm (300–400 cars/day), 232–466 ppm (200–350 cars/day), and 445–565 ppm (250–400 cars/day); the concentrations of CO were 6.3–8.7 ppm (300–400 cars/day), 6.4–8.7 (200–350 cars/day), and 5.4–7.9 ppm (250–400 cars/day). During natural ventilation, the concentrations of CO2 were 566–877 ppm, the concentrations of TVOC were 311–677 ppm, and the concentrations of CO were 4.6–8.7 ppm, in all investigated data (Figure 6b,d,f).

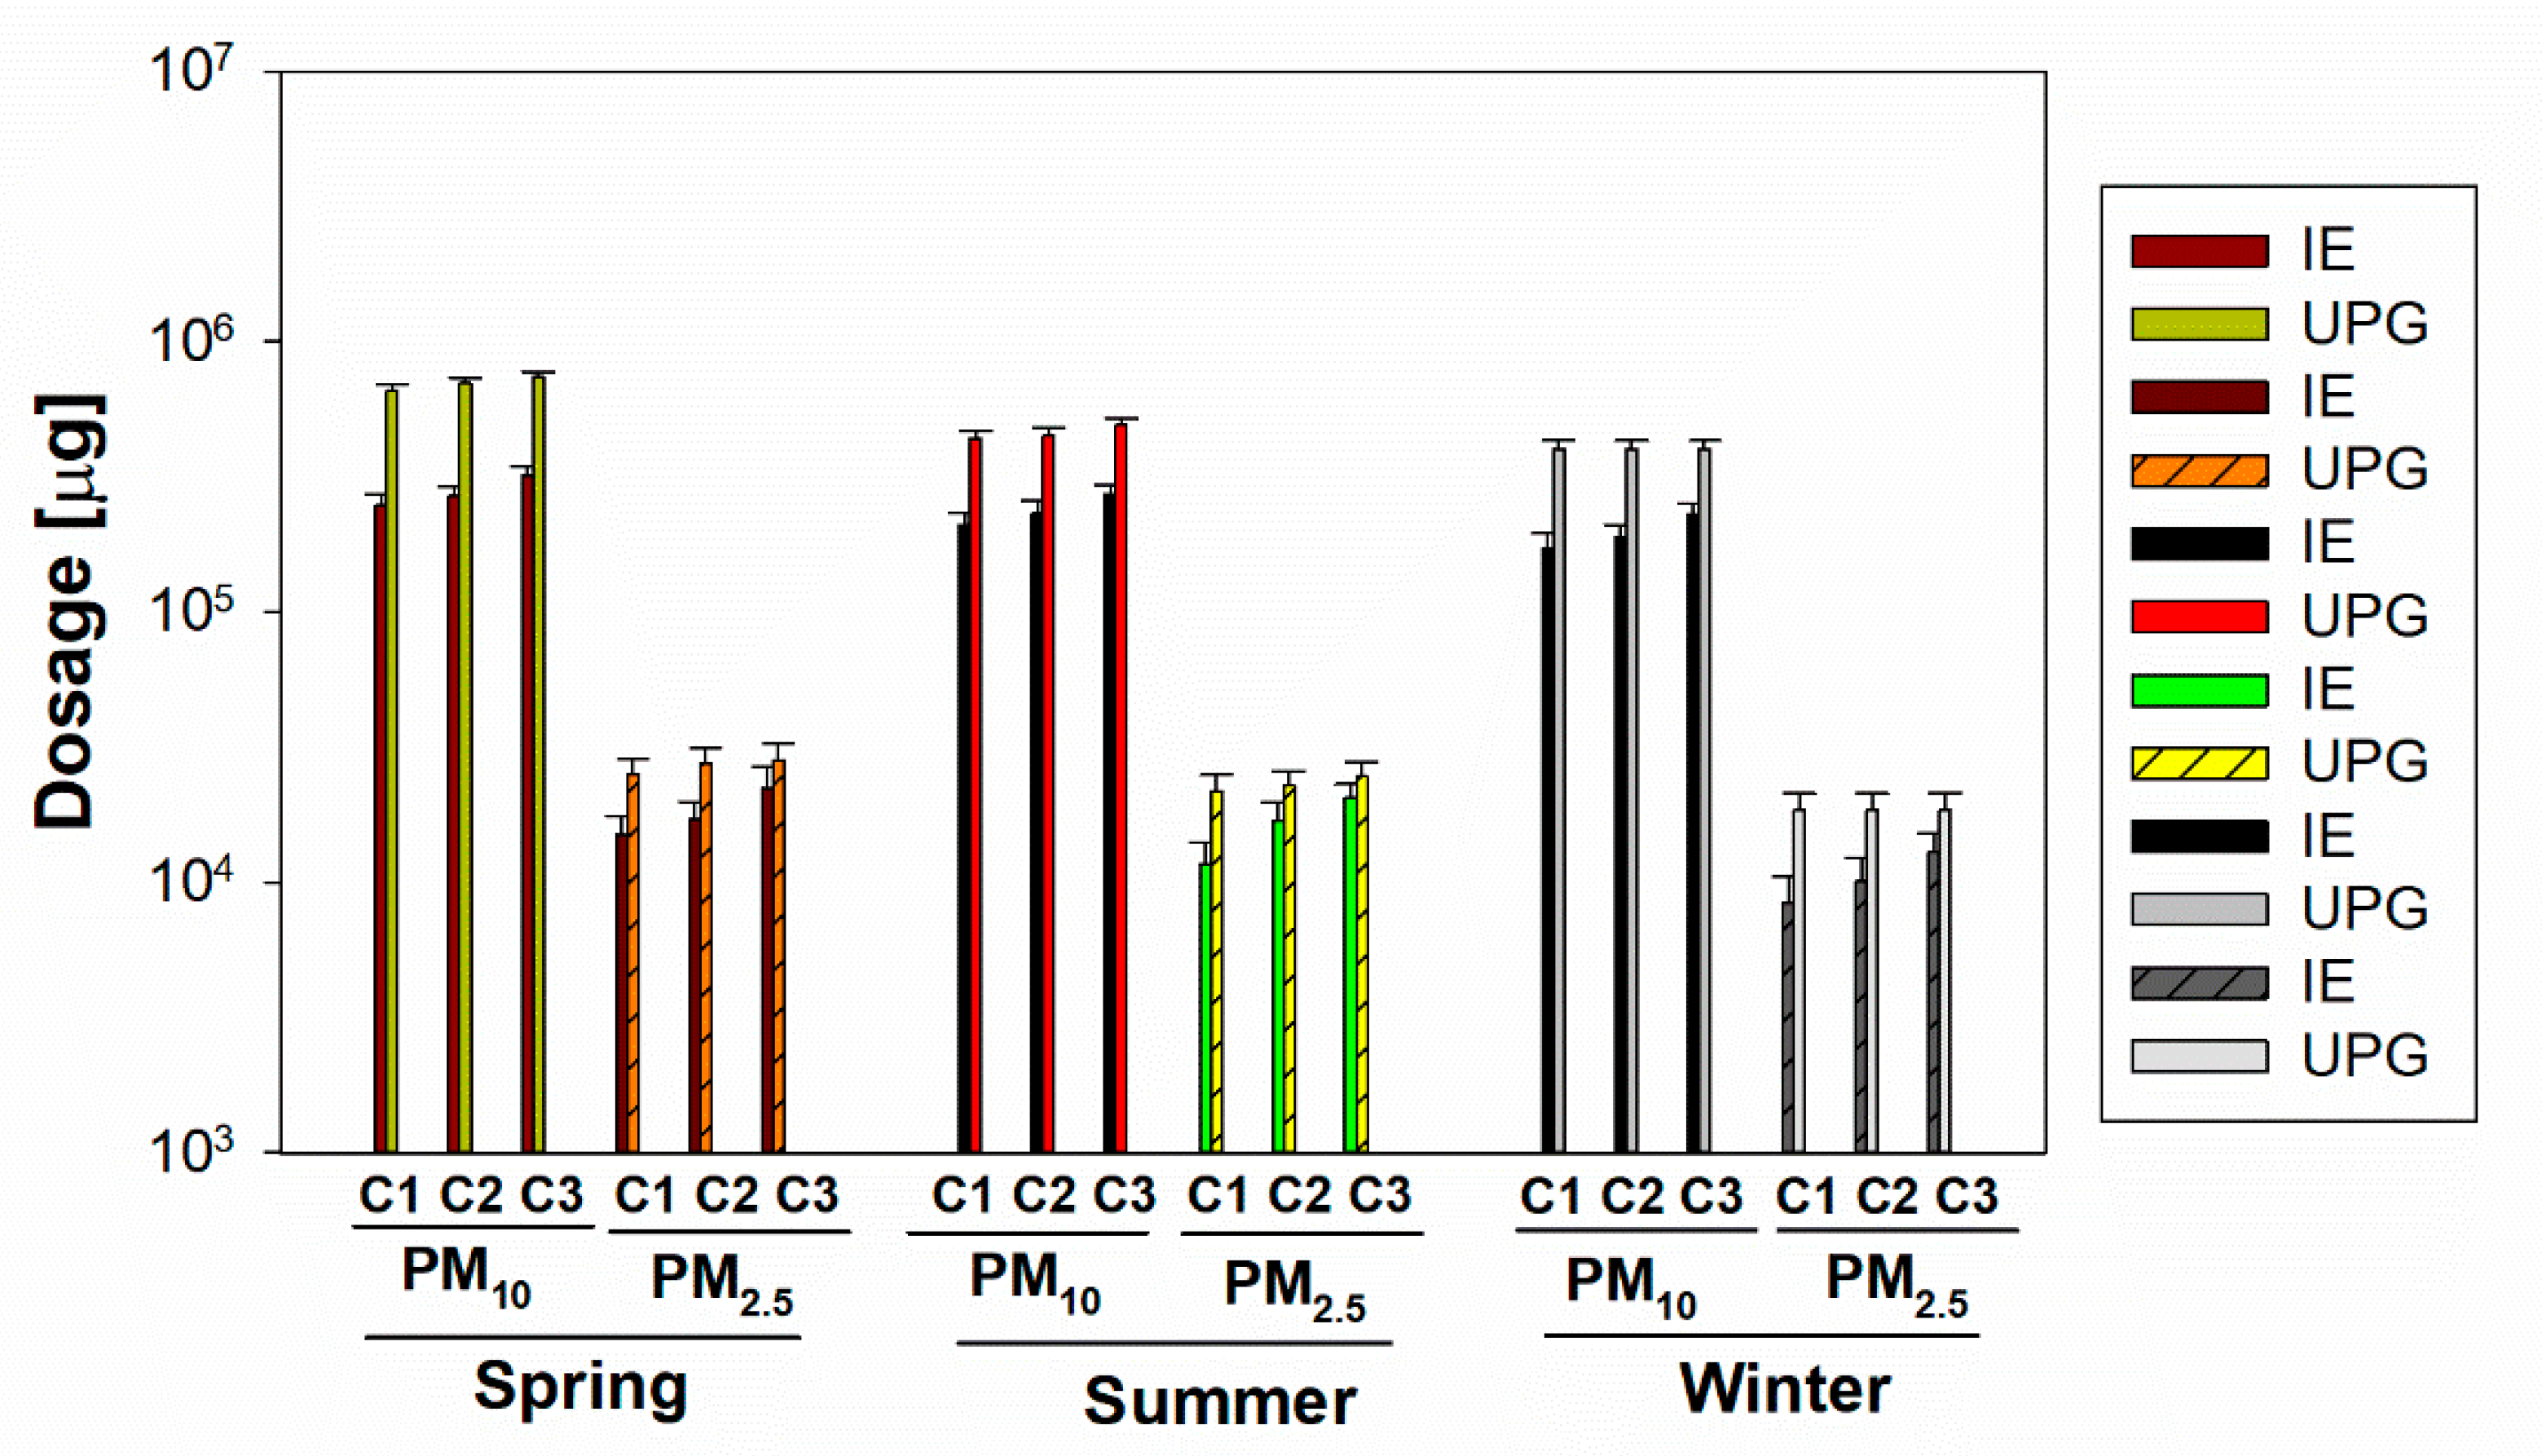
3.4. PM Dosage in Respiratory System

PM doses were calculated in indoors (IE) and UPGs (UPG) for PM10 and PM2.5 (Figure 7). For PM10, DF was calculated as the fraction of inhaled particles that deposit in the entire respiratory system: the head airways (HA), tracheobronchial region (TB), and the alveolar region (AL) and PM2.5. DF was calculated only as the PM deposited in the alveolar region (AL) [50].
For all investigated locations, 85–92% of PM deposition occurred in the entire respiratory regions while 7.0–8.5% of PM deposited in the alveolar region.
To evaluate the health effects associated with PM (inhalable and respirable PM), we have applied a model recommended by ICRP 66, which uses the dosage for PM10 and PM2.5 by considering the auto vehicle volume and season. Dosage is a common metric used for exposure assessment for predicting the health effects [51,52]. In this study, the inhalable dosage (based on PM10) and respirable dosage (based on PM2.5) were calculated using the number concentrations of PM obtained by Grimm 1.109 OPC.
As shown in Figure 7, during spring, summer and winter seasons, the calculated dosage ranged from ~×104–~×105 μg (except for PM2.5 for winter, ~×103). There are significant differences for PM10 and PM2.5 between IE and UPG (p < 0.001). However, there is no significant difference for season and auto vehicle volume.

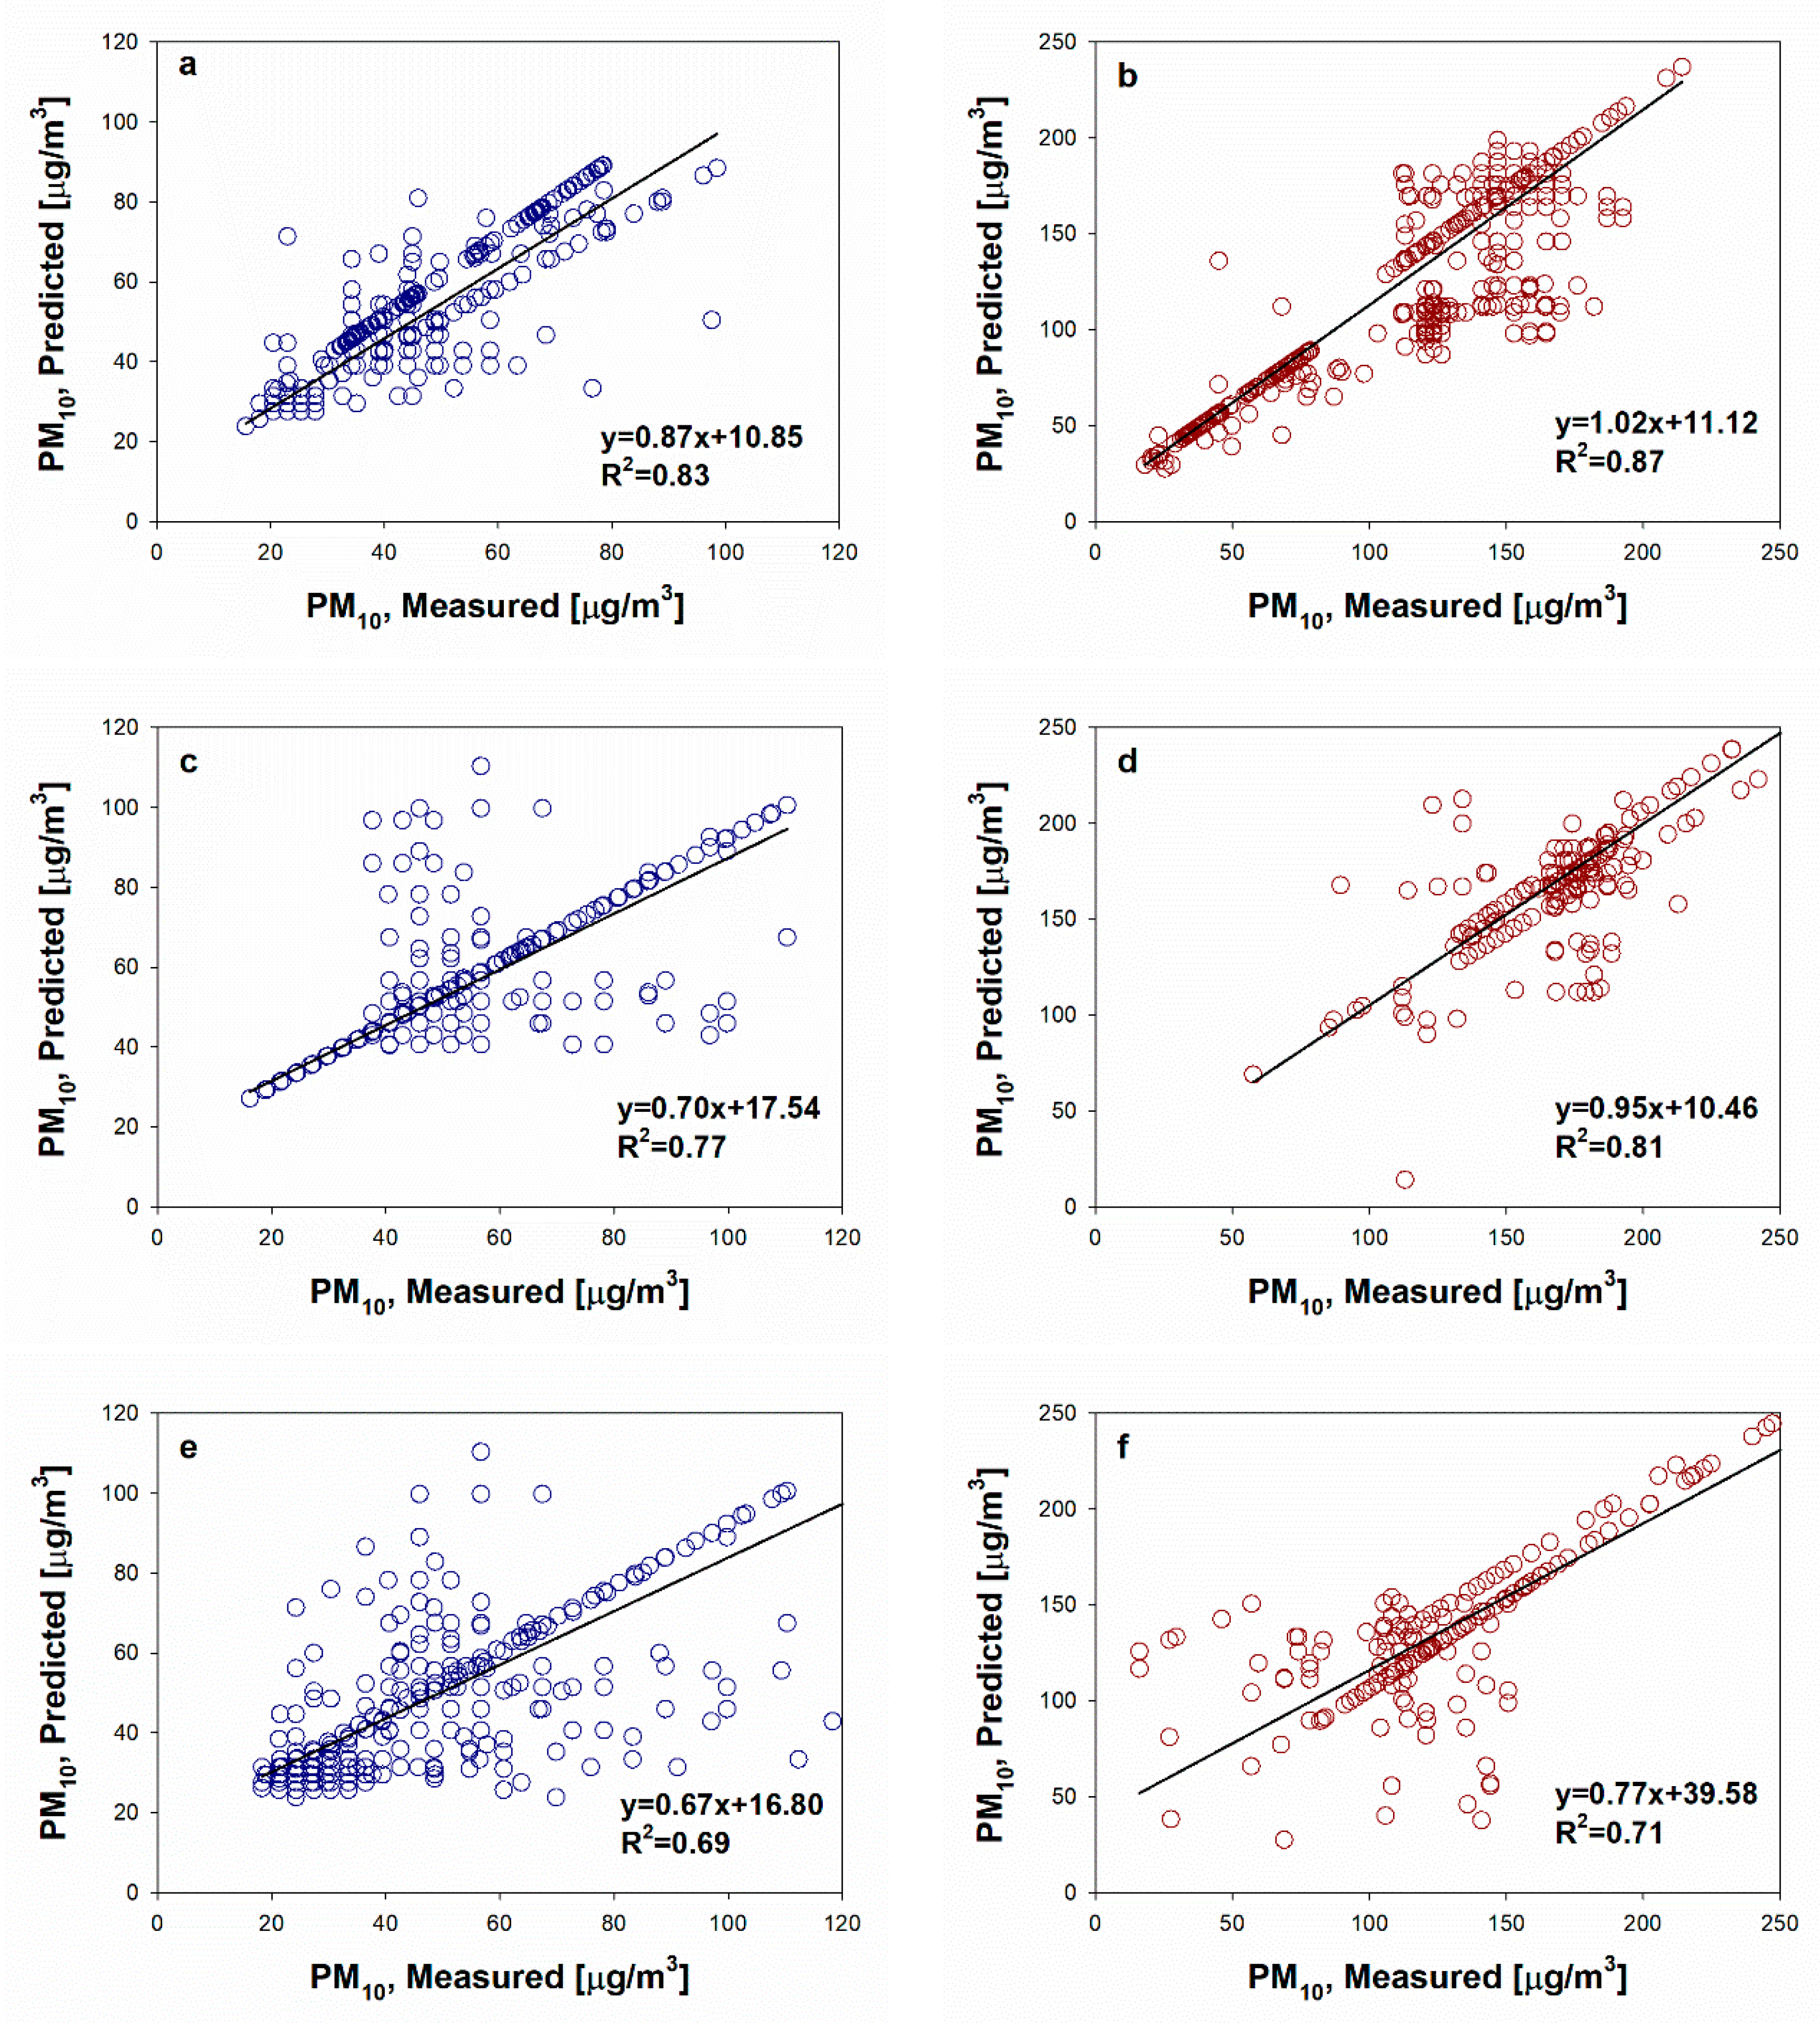
3.5. Prediction of Indoor PM Concentration Using an ANN

Based on the input variables and algorithms mentioned above, indoor air quality prediction modeling of indoor environments and underground parking garages was performed as a function of the season (spring, summer, winter) (Figure S4), and the correlation between measured and predicted values is shown in Figure 8: 0.83 (IE2, the second floor indoors) and 0.87 (the underground parking garage) for spring; 0.79 (IE2, the second floor indoors) and 0.81 (the underground parking garage) for summer; 0.69 (the second floor indoors) and 0.71 (the underground parking garage) for winter. The difference between the predicted value and the measured value depended on the season, outdoor pollution level, weather, and the vehicle traffic/frequency, with different characteristics.
During the winter, it was analyzed that the correlation with the predicted PM was lower (R2 = 0.69 and 0.71) compared to the other seasons, due to the decrease of automobile volume/frequency and the change of outdoor temperature (not shown in this study), but it showed a very high correlation (R2 = 0.83 and 0.87) during the yellow dust period in spring or when the outdoor air quality deteriorated, and there were many cars entering the underground parking garage. This can be applied to a prediction program for operating the underground parking ventilation system, and if more diverse input variables and improved algorithms are applied, the accuracy of the actual fine dust prediction results will be improved.
Feedforward backpropagation (FFBP) was evaluated using the minimum root mean (RMSE), maximum prediction accuracy (PA), normalized absolute error (NAE), and index of agreement (IA). The calculated parameters for PM ranged from 0.15 to 0.19 for RMSE, 0.83 to 0.92 for PA, 0.17 to 0.19 for NAE, and 0.88 to 0.92 for IA.

4. Discussion

This study conducted indoor air quality monitoring (Figure 3 and Figure 5) based on an integrated sensor and conducted an exposure assessment (Figure 6) based on a personal model of human exposure for evaluating human health effects in an indoor environment, rather than a simple monitoring and measurement study. For indoor air quality management while considering the operation of an HVAC system and outdoor air quality, it was possible to conduct indoor air quality monitoring and predictive research using an ANN model.
Due to energy issues, most underground parking garages use natural ventilation systems or separate ventilation units [3]. However, the high cost of separate ventilation systems results in relatively sparse monitoring, which provides accurate data but only in a few locations. Moreover, most air quality monitoring is conducted using static monitoring stations equipped with certificates; thus, it is difficult to control the pollutants released in UPGs and estimate the potential health burden.
By considering factors such as the ventilation rates in HVAC systems, this study established real-time monitoring based on an integrated sensor platform for evaluating personal exposure to pollutants, and could estimate indoor PM concentrations using an ANN by considering the outdoor air quality, weather, automobile frequency, and other factors.
As shown in Figure 3, the concentration of PM in the underground parking garage showed a concentration (max: 336 μg/m3) significantly exceeding the Korean standard value (100–200 μg/m3). It can be seen from Figure 6 that the high concentration of PM10 affects the indoor PM10 concentration of the indoor first floor office adjacent to the underground parking garage, so pollutants in the underground parking garage enter/penetrate indoor environments through various pathways, such as the entrance doors and elevators in the building, resulting in adverse of health effects. The comparison of the PM concentrations of the underground parking garage and the indoor office shows that the air quality in both the indoor spaces and underground parking garage could be improved by using the correct HVAC operation (Figure 2). However, if the outdoor air quality deteriorates, it cannot be guaranteed that the operation of the air conditioning system, due to the inflow of external air as well as natural ventilation, could improve the indoor air quality. The outdoor air quality may still deteriorate, and in this case, the operation of the HVAC system must be customized according to the outdoor air quality and, in particular, the air quality management of the underground parking garage.
Prior studies have evaluated the concentrations of VOC in parking garages, demonstrating a strong dependence on automobile sources and the activities of building occupants, even though the VOC concentration does not tend to be significantly correlated with the garage atmosphere [8,13]. Compared to the measured indoor monitoring data, the modeled data of the profiles in Figure 5 show mostly higher personal exposure to PM10, which is similar to the conclusions of the penetrations of PM10 from vehicle-induced sources. Considering the traffic volume in parking garages, the air quality must be controlled due to penetration into indoor environments with occupants. High volumes of automobiles lead to an increase in PM10 concentrations, and more importantly, the PM10 concentrations can be changed and/or decreased due to use of an HVAC ventilation system. This real-time air quality monitoring system could lead to the evaluation of the indoor air quality in UPGs associated with personal-exposure vehicle-induced pollutants, based on an integrated sensor platform which uses an M2M wireless sensor network, and we also showed the potential for indoor air quality prediction using an ANN (based on the calculated 0.69–0.87 for R2 between the measured data and predicted data), based on the variable data such as outdoor PM concentrations, weather, the frequency of automobiles in parking garage, and the developed learning algorithm.
This study is from five years ago and building design (including parking garage) and pollutant emissions from vehicles today could be different. However, an algorithm applied to this study could input different pollutant concentrations in various indoor environments and be further expanded to allow altering the algorithms that differ in weather conditions, outdoor pollutants, and input parameters such as vehicle type, vehicle fuel, and vehicle driving time based on the traffic volume. This study was an attempt to expand the monitoring system, predict pollutants, and evaluate health effects by considering the application of various factors in these algorithms applying an ANN. Although this study involved measurement and monitoring five years ago, the monitoring techniques and health impact assessment based on personal exposure to pollutants presented in this study are useful for future building design and indoor air quality monitoring. As in past studies, the ANN model provided better results than other models, especially ANN models written with non-uniform variance. Thus, the ANN model with the proposed monitoring technique and personal exposure evaluation applied the current ANN. We consider our study as more important for air quality monitoring and will be effectively applicable to all kinds of monitoring and air quality prediction, including of various other components.
Due to the increase in the exhaust emission concentrations in closed areas with insufficient ventilation, commercial underground parking garages in the city are becoming an important issue. The 2013 parking regulation in Korea has determined as 100 m2 is required per car and underground parking spaces in commercial buildings are recommended to have more spaces than the legally required number of parking spaces. Since the number of automobiles has continuously increase, various car-induced pollutants including PM accumulate in underground parking lots. Especially as underground parking lots rely on natural ventilation in a trapped structure, their pollution degree is more serious due to the low driving speed and idling the cars in these garages. In the underground parking lot regulations, the operation of the air conditioning system and the setting of the ventilation rate are calculated based on indoor and outdoor CO concentration and vehicle idling times. However, for PM, which is one of the pollutants sourced from automobile emissions, the simple concentration rule is applied only to PM10 concentration, even though it has been the subject of continuous short- and long-term pollutant exposure management.
In this study, we evaluated respirable PM and TVOC concentrations and health effects in underground parking lots, and the PM2.5 concentration was more than five times the standard value due to continuous vehicle inflow during the night without the ventilation system running. Currently, there is no regulation for PM2.5 concentration in underground parking garages, so the seriousness of automobile emissions is neglected. Vehicle-induced pollutants are accumulated indoors for a long time, and the resuspension of pollutants due to driving the vehicle results in long-term exposure to the pollutants. Although efforts have been made to improve indoor air quality, such as the operation of an air conditioning system indoors, automobile-emitted carcinogens in underground parking garages could be moved to the indoor office environment along with other pollutants through the inflow path in the building. This has the potential to be detrimental to human health, posing a challenge for designing a sustainable future. More importantly, the lack of data about the quantitative exposure to pollutants based on monitoring and health effects is one of the reasons why the development of regulations for pollutants has been delayed.
The real-time monitored PM used in our study was modeled based on the average daily PM concentration. However, in our future research, we will receive weather data in real time, connect our modeling algorithm program to predict the change, and prepare hourly concentration and prediction programs based on this. In this case, a long-term prediction model will be possible. We will attempt to adapt the algorithm to predict short-term changes such as extreme weather conditions.
To estimate PM concentration associated with health effects, we considered daily input data from 2014 to 2015 for: traffic volume, indoor and outdoor PM concentration, and season. Firstly, we aimed to predict PM concentrations due to temperature and weather events, but we found no relationship of exposure to PM in indoor environments with outdoor temperature. Therefore, we determined that the exposure to PM related to health effects is dependent on season. More monitoring and evaluation may be required for the prediction of PM due to the variation of temperature, weather conditions, and short-term pollutant events. In the future study, we will provide a modified algorithm utilizing conditions used in this study as well as weather conditions in the ANN model. The future study along with current study results will bridge the gap between exposure to pollutants and evaluation of health effects, providing the technology required toward an environmentally sustainable community.
What we need to keep in mind is that simple indoor air quality monitoring cannot contribute to human health risk assessment and indoor air quality improvement, and in order to improve indoor air quality based on monitoring, pollutant exposure evaluations based on health impact assessments must be conducted. Considering these points, this study applied exposure modeling, considering indoor pollutants and outdoor exposure factors, to enable health impact assessment. If applied together with the ANN model, it is possible to predict future indoor air quality, as well as to evaluate health effects. During the development and comparison of the personal exposure model and ANN model, this study focused only on PM10 concentration. For PM concentration, it is necessary to monitor the concentration of PM2.5, because PM2.5 further affects health. Since the regulation standard for underground parking garages in Korea is defined by the PM10 concentration, this study monitored the PM10 concentration and compared the modeling results. In the future, the monitoring of PM2.5 concentrations, along with other pollutants, will require similar predictions.

5. Conclusions

A personal exposure model and ANN model were proposed herein that are together capable of predicting indoor PM concentrations in advance. Combined with the personal exposure model for the evaluation of health effects, the core monitoring and modelling system is considered to be an effective tool to improve the control of indoor air quality.
The novel aspect of this approach is the integrated monitoring study based on indoor air pollutant factors, with estimation using the ANN model with the personal model, which together are capable of evaluating the health effects when taking into account indoor sources.
Prediction using an ANN can provide data applications for monitoring systems, to control the operation rate of HVAC systems by considering the concentration of indoor and outdoor pollutants and balancing this with energy saving. It may also provide information on the selection of operation conditions for specific air-conditioning systems in the building.
As an air quality management strategy, buildings should be equipped with a Web-based real-time monitoring system for monitoring the quality of indoor air, including information on pollutants, in order to improve the indoor environment to assure human health and quality of life by providing a safe and environmentally friendly living atmosphere.

Supplementary Materials

The following are available online at https://www.mdpi.com/2071-1050/12/9/3794/s1, Figure S1: Individual sensor module (a) and lab test for indoor pollutants (b); Figure S2: Field test using the integrated sensor platform indoors (a–c) and underground parking garage (d); Figure S3. Building air quality monitoring (S1–S5) using the integrated sensor platform. Left: block diagram, right: diagram for the indoor air quality management system with an M2M wireless sensor network.; Figure S4: Developed prediction program using an Artificial Neural Network (ANN). Initial screen (a), reverse propagation (b), prediction screen (c), and final result (d).

Author Contributions

Conceptualization, H.-J.O. and J.K.; methodology, H.-J.O. and J.K; investigation, H.-J.O.; data curation, H.-J.O. and J.K.; modelling, H.-J.O. and J.K.; writing—original draft preparation, H.-J.O.; writing—review and editing, H.-J.O. and J.K. All authors have read and agreed to the published version of the manuscript.

Funding

This research was funded by the National Research Foundation of Korea Grant, grant number NRF-2018R1A6A1A03025761 and NRF-2018R1A6A3A11048705.

Acknowledgments

We would especially like to express our gratitude to the owner of the LG Building and Ian Building. Additionally, we would like to thank Nare Trends, Inc. and Nineco for loaning their instruments to run the tests, Jong-Ryeul Sohn for donations of materials used for experiments, and Byung-Yang Lee for technical support.

Conflicts of Interest

The authors declare no conflict of interest.

References

  1. Liu, Z.; Yin, H.; Ma, S.; Jin, G.; Gao, J.; Ding, W. On-site assessments on variations of PM2.5, PM10, CO2 and TVOC concentrations in naturally ventilated underground parking garages with traffic volume. Environ. Pollut. 2019, 247, 626–637. [Google Scholar] [CrossRef] [PubMed]
  2. Martins, V.; Moreno, T.; Minguillon, M.C.; Amato, F.; de Miguel, E.; Capdevila, M.; Querol, X. Exposure to airborne particulate matter in the subway system. Sci. Total Environ. 2015, 511, 711–722. [Google Scholar] [CrossRef] [PubMed] [Green Version]
  3. Papakonstantinou, K.; Chaloulakou, A.; Duci, A.; Vlachakis, N.; Markatos, N. Air quality in an underground garage: Computational and experimental investigation of ventilation effectiveness. Energy Build. 2003, 35, 933–940. [Google Scholar] [CrossRef]
  4. Vukovic, G.; Urosevic, M.A.; Ivana, R.; Maja, K. Air quality in urban parking garages (PM10, major and trace elements, PAHs): Instrumental measurements vs. active moss biomonitoring. Atmos. Environ. 2014, 85, 31–40. [Google Scholar] [CrossRef]
  5. Oh, H.-J.; Sohn, J.-R.; Roh, J.-S.; Kim, J. Exposure to respirable particles and TVOC in underground parking garages under different types of ventilation and their associated health effects. Air Qual. Atmos. Health 2020, 13, 297–308. [Google Scholar] [CrossRef]
  6. Dhawan, S.; Sebastian, A.; Siby, J. Health risk assessment of workers in underground parking due to exposure to CO and VOC. Int. J. Eng. Sci. Technol. 2018, 5, 1388–1391. [Google Scholar]
  7. Yu, L.; Kang, N.; Wang, W.; Guo, H.; Ji, J. Study on the Influence of Air Tightness of the Building Envelope on Indoor Particle Concentration. Sustainability 2020, 12, 1708. [Google Scholar] [CrossRef] [Green Version]
  8. Assimakopoulos, V.D.; Bekiari, T.; Pateraki, S.; Maggos, T.; Stamatis, P.; Nicolopoulou, P.; Assimakopoulos, M.N. Assessing personal exposure to PM using data from an integrated indoor-outdoor experiment in Athens-Greece. Sci. Total Environ. 2018, 636, 1303–1320. [Google Scholar] [CrossRef]
  9. Mosley, R.B.; Greenwell, D.J.; Sparks, L.E.; Guo, Z.; Tucker, W.G.; Fortmann, R.; Whitfield, C. Penetration of Ambient Fine Particles into the Indoor Environment. Aerosol Sci. Tech. 2001, 34, 127–136. [Google Scholar] [CrossRef]
  10. Zhu, Y.; Hinds, W.C.; Krudysz, M.; Kuhn, T.; Froines, J.; Sioutas, C. Penetration of freeway ultrafine particles into indoor environments. J. Aerosol Sci. 2005, 36, 303–322. [Google Scholar] [CrossRef]
  11. Kim, S.R.; Dominici, F.; Buckley, T.J. Concentrations of vehicle-related air pollutants in an urban parking garage. Environ. Res. 2007, 105, 291–299. [Google Scholar] [CrossRef] [PubMed]
  12. Li, Z.; Wen, Q.; Zhang, R. Sources, health effects and control strategies of indoor fine particulate matter (PM2.5): A review. Sci. Total Environ. 2017, 586, 610–622. [Google Scholar] [CrossRef] [PubMed]
  13. Adam, N.; Kohal, J.; Riffat, S. Effect of ventilation rate on deposition of aerosol particles on materials. Build. Serv. Energy Res. Technol. 1994, 15, 185–188. [Google Scholar] [CrossRef]
  14. Andrew, J.; Chio, M.D. Biological effects of Utah Vally ambient air particles in humans: A Review. J. Aerosol Med. 2004, 17, 157–164. [Google Scholar]
  15. Carrilho da Graça, G. A technical note on simplified modeling of turbulent mixing in wind-driven single sided ventilation. Build. Environ. 2018, 131, 12–15. [Google Scholar] [CrossRef]
  16. Wang, X.; Bi, X.; Sheng, G.; Fu, J. Chemical composition and sources of PM10 and PM2.5 aerosols in Guangzhou, China. Environ. Mont. Assess. 2006, 119, 425–439. [Google Scholar] [CrossRef]
  17. Sundell, J.; Levin, H.; Nazaroff, W.W.; Cain, W.S. Ventilation rates and health: Multidisciplinary review of the scientific literature. Indoor Air 2010, 21, 191–204. [Google Scholar] [CrossRef]
  18. Geens, A.; Snelson, D.; Littlewood, J.; Ryan, J. Ventilation performance for spaces where smoking is permitted: A review of previous work and field study results. Build. Serv. Eng. Res. Technol. 2006, 27, 235–248. [Google Scholar] [CrossRef]
  19. Buonanno, G.; Marks, G.B.; Morawska, L. Health effects of daily airborne particle dose in children: Direct association between personal dose and respiratory health effects. Environ. Pollut. 2013, 180, 246–250. [Google Scholar] [CrossRef] [Green Version]
  20. Lehnert, M.; Pesch, B.; Lotz, A.; Pelzer, J.; Kendzia, B.; Gawrych, K.; Heinze, E.; Van Gelder, R.; Punkenburg, E.; Weiss, T.; et al. Exposure to inhalable, respirable, and ultrafine particles in welding fume. Ann. Occup. Hyg. 2012, 56, 557–567. [Google Scholar]
  21. Oeder, S.; Dietrich, S.; Weichenmeier, I.; Schober, W.; Pusch, G.; Jorres, R.A.; Schierl, R.; Nowak, D.; Fromme, H.; Behrendt, H.; et al. Toxicity and elemental composition of particulate matter from outdoor and indoor air of elementary schools in Munich, Germany. Indoor Air 2012, 22, 148–158. [Google Scholar] [CrossRef] [PubMed]
  22. Yang, X.; Zhao, Z.; Hua, R.; Su, X.; Ma, L.; Chen, Z. Simulation study on the influence of urban underground parking development on underlying surface and urban local thermal environment. Tunn. Undergr. Space Technol. 2019, 89, 133–150. [Google Scholar] [CrossRef]
  23. Cameron, M.J.; Bermejo-Martin, J.F.; Danesh, A.; Muller, M.P.; Kelvin, D.J. Human immunopathogenesis of severe acute respiratory syndrome (SARS). Virus Res. 2008, 133, 13–19. [Google Scholar] [CrossRef]
  24. Leung, C.W.; Chiu, W.K. Clinical picture, diagnosis, treatment and outcome of severe acute respiratory syndrome (SARS) in children. Paediatr. Respir. Rev. 2004, 5, 275–288. [Google Scholar] [CrossRef] [PubMed]
  25. Chung, J.-J.; Kim, H.-J. An Automobile Environment Detection System Based on Deep Neural Network and its Implementation Using IoT-Enabled In-Vehicle Air Quality Sensors. Sustainability 2020, 12, 2475. [Google Scholar] [CrossRef] [Green Version]
  26. Abbot, J.; Marohasy, J. The application of machine learning for evaluating anthropogenic versus natural climate change. GeoRes J. 2017, 14, 36–46. [Google Scholar] [CrossRef]
  27. Russo, A.; Lind, P.G.; Raischel, F.; Trigo, R.; Mendes, M. Neural network forecast of daily pollution concentration using optimal meteorological data at synoptic and local scales. Atmos. Pollut. Res. 2015, 6, 540–549. [Google Scholar] [CrossRef] [Green Version]
  28. Mishra, D.; Goyal, P. Development of artificial intelligence based NO2 forecasting models at Taj Mahal, Agra. Atmos. Pollut. Res. 2015, 6, 99–106. [Google Scholar] [CrossRef] [Green Version]
  29. Elangasinghe, M.; Dirks, K.; Singhal, N.; Costello, S.; Longley, I.; Salmond, J. A simple semi-empirical technique for apportioning the impact of roadways on air quality in an urban neighbourhood. Atmos. Environ. 2014, 83, 99–108. [Google Scholar] [CrossRef]
  30. Lal, B.; Tripathy, S.S. Prediction of dust concentration in open cast coat mine using artificial neural network. Atmos. Pollut. Res. 2012, 2, 211–218. [Google Scholar] [CrossRef] [Green Version]
  31. Nejadkoorki, F.; Baroutian, S. Forcasting extreme PM10 concentrations using artificial neural networks. Int. J. Environ. Res. 2011, 6, 277–284. [Google Scholar]
  32. WHO. Climate Change and Health. 2018. Available online: https://www.who.int/news-room/fact-sheets/detail/climate-change-and-health (accessed on 26 April 2020).
  33. The Intergovernmental Panel on Climate Change. Summary for Policymakers. In Climate Change 2014: Mitigation of Climate Change; IPCC: Geneva, Switzerland, 2014; pp. 1–32. [Google Scholar]
  34. EPA. Health, Energy Efficiency and Climate Change. 2017. Available online: https://www.epa.gov/indoor-air-quality-iaq/health-energy-efficiency-and-climate-change (accessed on 26 April 2020).
  35. Feng, X.; Li, Q.; Zhu, Y.; Hou, J.; Jin, L.; Wang, J. Artificial neural networks forecasting of PM2.5 pollution using air mass trajectory based geographic model and wavelet transformation. Atmos. Environ. 2015, 107, 118–128. [Google Scholar] [CrossRef]
  36. Kassomenos, P.; Petrakis, M.; Sarigiannis, D.; Gotti, A.; Karakitsios, S. Identifying the contribution of physical and chemical stressors to the daily number of hospital admissions implementing an artificial neural network model. Air Qual. Atmos. Health 2011, 4, 263–272. [Google Scholar] [CrossRef]
  37. Polezer, G.; Tadano, Y.S.; Siqueira, H.V.; Godoi, A.F.L.; Yamamoto, C.I.; André, P.A.; Pauliquevis, T.; Andrade, M.F.; Oliveira, A. Assessing the impact of PM2.5 on respiratory disease using artificial neural networks. Environ. Pollut. 2018, 235, 394–403. [Google Scholar] [CrossRef]
  38. Wang, Q.; Liu, Y.; Pan, X. Atmosphere pollutants and mortality rate of respiratory diseases in Beijing. Sci. Total Environ. 2008, 391, 143–148. [Google Scholar] [CrossRef]
  39. Kachba, Y.; Chiroli, D.M.; Belotti, J.T.; Alves, T.A.; de Souza Tadano, Y.; Siqueira, H. Artificial Neural Networks to Estimate the Influence of Vehicular Emission Variables on Morbidity and Mortality in the Largest Metropolis in South America. Sustainability 2020, 12, 2621. [Google Scholar] [CrossRef] [Green Version]
  40. Koutrakis, P.; Briggs, S.L.K. Source apportionment of indoor aerosols in Suffolk and Onondaga counties, New York. Environ. Sci. Pollut. 1992, 26, 521–527. [Google Scholar] [CrossRef]
  41. Gerharz, L.E.; Kruger, A.; Klemm, O. Applying indoor and outdoor modeling techniques to estimate individual exposure to PM2.5 from personal GPS profiles and diaries: A pilot study. Sci. Total Environ. 2009, 407, 5184–5193. [Google Scholar] [CrossRef]
  42. Chao, C. Penetration coefficient and deposition rate as a function of particle size in non-smoking naturally ventilated residences. Atmos. Environt. 2003, 37, 4233–4241. [Google Scholar] [CrossRef]
  43. ICRP. Human Respiratory Tract Model for Radiological Protection; ICRP Publication 66; Annals of the ICRP; ICRP: London, UK, 1994; Volume 24, pp. 1–3. [Google Scholar]
  44. Elbayoumi, M.; Ramli, N.A.; Yusof, N.F. Development and comparison of regression models and feedforward backpropagation neural network models to predict seasonal indoor PM2.5–10 and PM2.5 concentrations in naturally ventilated schools. Atmos. Pollut. Res. 2015, 6, 1013–1023. [Google Scholar] [CrossRef]
  45. Shepherd, A.J. Second-Order Methods for Neural Networks: Fast and Reliable Training Methods for Multi-Layer Perceptrons; Springer: New York, NY, USA, 1997. [Google Scholar]
  46. Sarle, W.S. Stopped training and other remedies for overfitting. In Proceedings of the 27th Symposium on the Interface of Computer Science and Statistics, Pittsburgh, PA, USA, 21–24 June 1995; pp. 352–360. [Google Scholar]
  47. Ul-Saufie, A.; Yahaya, A.; Ramli, N.; Awang, N.; Hamid, H. Future daily PM10 concentrations prediction by combining regression models and feedforward backpropagation models with principle component analysis (PCA). Atmos. Environ. 2013, 77, 621–630. [Google Scholar] [CrossRef]
  48. Haykin, S. Neural Networks: A Comprehensive Foundation, 2nd ed.; Prentice Hall: Upper Saddle River, NJ, USA, 1999; pp. 237–239. [Google Scholar]
  49. Karppinen, A.; Kukkonen, J.; Elolahde, T.; Konttinen, M.; Koskentato, T.; Rantakrans, E. A modelling system for predicting urban air pollution: Model description and applications in the Helsinki metropolitan area. Atmos. Environ. 2000, 34, 3723–3733. [Google Scholar] [CrossRef]
  50. Nazarenko, Y.; Zhen, H.; Han, T.; Lioy, P.J.; Mainelis, G. Nanomaterial inhalation exposure from nanotechnology-based cosmetic powders: A quantitative assessment. J. Nanopart. Res. 2012, 14, 1–14. [Google Scholar] [CrossRef] [PubMed]
  51. Elbayoumi, M.; Ramli, N.; Yusof, N.; Al Madhoun, W. Seasonal variation in indoor air schools environments and health symptoms among students in and eastern mediterranean climate. Hum. Ecol. Risk Assess. 2014, 20, 1–21. [Google Scholar] [CrossRef]
  52. Stafoggia, M.; Samoli, E.; Alessandrini, E.; Cadum, E.; Ostro, B.; Berti, G.; Faustini, A.; Jacquemin, B.; Linares, C. Short-term associations between fine and coarse particulate matter and hospitalizatios in southern europe: Results from the med-particles project. Environ. Health Perspect. 2013, 121, 1026–1033. [Google Scholar] [CrossRef]
Figure 1. Study area (a) and the number of automobiles undertaking business-related trips (b).
Sustainability 12 03794 g001
Figure 2. Concentrations of particulate matter (PM10 and PM2.5). (a): natural ventilation (NV); (bd): OP1, OP2 and OP3 for air volume, respectively. SP: spring; SU: summer; WI: winter; OUT: outdoor.
Sustainability 12 03794 g002aSustainability 12 03794 g002b
Figure 3. Concentrations of PM10 and PM2.5 as a function of location in the building in the spring (a), summer (b) and winter (c) during natural ventilation (wind velocity: 0.52–3.49 m/s).
Sustainability 12 03794 g003aSustainability 12 03794 g003b
Figure 4. Real-time integrated-module system which includes sensors (1: temperature, 2: relative humidity, 3: CO2, 4: CO, 5: Particulate Matter, 6: Bioaerosol, 7: TVOC, 8: HCHO) that can detect pollutants. (a) system configuration; (b) block diagram for the biological sensor module; (c) integrated sensor platform.
Sustainability 12 03794 g004
Figure 5. Comparison of the concentrations of CO2 (a,b), PM10 (c,d), TVOC (e,f), and CO (g,h) in UPG1 and UPG2 using the integrated sensor platform, with a comparison of each measurement device, during natural ventilation.
Sustainability 12 03794 g005
Figure 6. Concentrations of PM10 (with modeled PM10 based on the personal exposure profile), CO2, TVOC, and CO obtained by real-time indoor air quality monitoring, including the integrated sensor platform in an indoor environment (IE1) during ventilation with OP2 and natural ventilation (NV). (a,b): 200–350 cars/day; (c,d): 250–400 cars/day; (e,f) 300–400 cars/day.
Sustainability 12 03794 g006
Figure 7. Dosage of PM2.5 and PM10 in indoors (IE) and underground parking garage (UPG) during ventilation with OP2 as a function of auto vehicle volume and seasons. C1: 200–350 cars/day; C2: 250–400 cars/day; C3 for 300–400 cars/day.
Sustainability 12 03794 g007
Figure 8. Comparison between measured PM and the estimated PM concentrations. (ae): indoor environment for spring, summer and winter seasons; (be): underground parking garage for spring, summer and winter during OP2 operation of the HVAC system with 300–400 cars/day and 2.3–7.8 m/s of wind velocity.
Sustainability 12 03794 g008
Table 1. Characteristics of different locations selected for this study.
LocationNumber of SamplesArea (m2)Capacity/Number of CarsVentilation Rate
(l/s Person),
Mean (SD)
Underground parking garageUPG1122730320-
UPG2102730300-
Indoor environmentIE18630-10 (5)
IE28470-8 (50)
Table 2. Concentrations (µg/m3) of PM10 and PM2.5 as a function of ventilation system during spring, summer and winter seasons. (Mean ± Std.).
NVOP1OP2OP3
PM10PM2.5PM10PM2.5PM10PM2.5PM10PM2.5
SP270.15
± 50.85
108.67
± 16.25
287.08
± 27.43
105.95
± 13.80
173.58
± 38.02
78.37
± 14.74
124.72
± 7.60
46.12
± 4.91
SU302.88
± 58.17
117.02
± 12.57
251.96
± 49.73
98.85
± 14.92
107.85
± 40.64
76.64
± 13.32
111.57
± 8.13
45.55
± 4.44
WI286.65
± 32.63
113.26
± 12.60
214.54
± 52.25
90.93
± 22.90
121.27
± 28.50
70.48
± 114.77
114.25
± 5.70
43.49
± 4.92
OUT56.44
± 8.16
35.83
± 6.63
57.12
± 6.27
35.20
± 4.11
62.50
± 5.49
41.88
± 4.53
62.25
± 5.49
41.88
± 4.53
Note: NV, OP1, OP2, and OP3: natural ventilation, operation 1, 2, and 3 in HVAC system, respectively; SP, spring; SU, summer; WI, winter; OUT: outdoor.
Table 3. Pairwise comparisons of PM10 concentrations by different seasons. Only pairs with statistically significant differences (p < 0.05) are shown.
Particle TypeHVAC OperationSeasonp-Value
PM10OP1SPWI0.0012
OP2SPSU0.001
WI0.004
OP3SPSU0.001
SUWI0.004
PM2.5OP1SPWI0.01
Note: OP1, OP2, and OP3: operation 1, 2, and 3 in HVAC system, respectively; SP, spring; SU, summer; WI, winter.
Table 4. Concentrations (µg/m3) of PM10 and PM2.5 in UPG1, UPG2, IE1 and IE2 during spring, summer and winter seasons. (Mean ± Std.).
UPG1UPG2IE1IE2
PM10PM2.5PM10PM2.5PM10PM2.5PM10PM2.5
SP249.97
± 45.59
105.08
± 7.54
275.47
± 50.13
113.02
± 213.13
55.78
± 11.86
37.33
± 5.88
59.16
± 8.32
37.93
± 5.13
SU259.59
± 47.31
113.29
± 8.50
300.87
± 31.48
115.93
± 10.49
66.32
± 5.90
46.59
± 4.40
52.36
± 10.65
42.24
± 6.69
WI158.31
± 26.22
107.77
± 8.01
272.13
± 41.46
115.52
± 11.95
68.51
± 7.93
46.63
± 5.56
58.00
± 7.03
43.60
± 4.23
Note: UPG1 and UPG2: underground parking garage 1 and 2, respectively; SP, spring; SU, summer; WI, winter.
Table 5. Concentrations (µg/m3) of CO2, PM10, TVOC and CO in UPG1, UPG2, IE1 and IE2 using the integrated sensor platform and each measurement device during natural ventilation. (Mean ± Std.).
IE1UPG1IE2UPG2
MDISPMDISPMDISPMDISP
CO2
(ppm)
687.68
± 81.65
702.76
± 127.46
NM1022.55
± 172.06
747.13
± 79.39
767.34
± 98.59
NM1014.53
± 158.06
PM10
(µg/m3)
61.43
± 10.24
65.02
± 10.88
NM171.95
± 32.44
59.57
± 9.10
57.78
± 7.53
NM162.75
± 41.34
TVOC
(ppm)
849.38
± 91.17
NMNM865.41
± 118.80
721.60
± 145.64
NMNM722.12
± 82.66
CO
(ppm)
8.69
± 1.80
NMNM9.28
± 2.28
8.28
± 1.16
NMNM8.32
± 1.11
Note: UPG1, UPG2, IE1 and IE2: underground parking garage 1 and 2, indoor environment 1 and 2, respectively; MD, measurement device; ISP, integrated sensor platform; NM: Not measured.

