Article

Work Standardization and Anthropometric Workstation Design as an Integrated Approach to Sustainable Workplaces in the Manufacturing Industry

by
Arturo Realyvásquez-Vargas
1,*,
Karina Cecilia Arredondo-Soto
2,
Julio Blanco-Fernandez
3,
Joanna Denisse Sandoval-Quintanilla
4,
Emilio Jiménez-Macías
5 and
Jorge Luis García-Alcaraz
6,*
1
Department of Industrial Engineering, Tecnológico Nacional de México/Instituto Tecnológico de Tijuana, Calzada del Tecnológico S/N, Tijuana 22414, Baja California, Mexico
2
Chemical Sciences and Engineering Faculty, Universidad Autónoma de Baja California, Calzada Universidad #14418, Parque Industrial Internacional, Tijuana 22390, Baja California, Mexico
3
Department of Mechanical Engineering, University of La Rioja, 26004 La Rioja, Spain
4
Department of Industrial Engineering, Tecnológico Nacional de México/Instituto Tecnológico te Tijuana, Tijuana 22414, Baja California, Mexico
5
Department of Electrical Engineering, University of La Rioja, 26004 La Rioja, Spain
6
Department of Industrial and Manufacturing Engineering, Autonomous University of Ciudad Juarez, Chihuahua 32310, Mexico
*
Authors to whom correspondence should be addressed.
Sustainability 2020, 12(9), 3728; https://doi.org/10.3390/su12093728
Submission received: 11 March 2020 / Revised: 25 April 2020 / Accepted: 28 April 2020 / Published: 4 May 2020
(This article belongs to the Special Issue Human Factor in Lean Production)

Abstract

:
Poor workstation designs represent a risk factor for operators in assembly production lines. Anthropometric design of workstations facilitates the sustainable development of the workplace. This paper proposes a novel integrated approach about work standardization and anthropometric workstation design as a strategy to increase human factor performance as well as the productivity index in manufacturing companies. The integrating approach is presented through a case study in a publishing press company with operators who perform manual and mechanical tasks in production lines in the box assembly department. Currently, the company’s production capacity is below demand, and in order to satisfy customers’ requirements, the company pays a lot of overtime to operators. In order to solve this problem, the integrated approach was applied. The findings indicated that inefficient movements and body postures in operators decreased from 230 to 78, and the standard time was reduced from 244 to 199 s for each assembled box. In addition, the production rate increased by 229 units per assembly line per day, and overtime was eliminated. Therefore, the novel integrated approach allows the increase of sustainability in the company and the operators’ well-being by making a better use of the human factor, eliminating overtime, and increasing production capacity.

1. Introduction

Nowadays, the level of competition in the global marketplace requires that manufacturing companies efficiently adopt a sustainable workplace. However, there is a variety of production-related problems, such as late deliveries, line stoppages, bottlenecks, unbalanced production lines, hours of production, overtime, inefficient material handling equipment, risky body postures for employees, and high production costs, among others.

1.1. Problems for Sustainable Workplaces

In the case of late deliveries, Peng and Lu [1] report an analysis regarding the impact of delivery performance on customer transactions, which affects the customers’ transaction amounts and the price units. On the other hand, Fazlollahtabar [2] reports a case study applied to an assembly line in which late deliveries of products were the source of poor performance in the manufacturing system, and he proposed a parallel line of autonomous assembly of guided vehicles. Late deliveries reflect a low-quality logistics infrastructure, which represents a barrier for sustainability [3].
In the case of unbalanced production lines and bottlenecks, different authors have confirmed that they decrease the manufacturing systems’ productivity and diminish the capacity in the production system [4,5] because bottlenecks can cause line stoppages [6,7], which in turn adversely affect performance. For example, Ren et al. [4] and Zupan and Herakovic [8] present case studies in which unbalanced bottlenecks and production lines cause a low level of productivity in an assembly area, which was solved by balancing the production lines and redesigning their distribution. In addition, Gu et al. [6] claim that maintenance problems cause bottlenecks in complex manufacturing systems, which result in the loss of production. In other words, unbalanced production lines create organizational problems, decrease the supply chain performance, and increase production costs. Therefore, the appropriate balance in a production line is a traditional production strategy that helps reduce bottlenecks in manufacturing systems.
Furthermore, regarding production line stoppages, these are responsible for production losses [9] and for production cost increases [10,11], especially when they occur unexpectedly; consequently, they affect subsequent manufacturing operations [12]. According to Hossen et al. [13], losses due to inactivity and equipment downtime and failures represent 89.3% of total losses due to downtime in a production system. Nevertheless, Peng and Zhou [10] mention that mixed-model assembly lines are currently widely adopted in the automotive industry to achieve an ongoing customization, since it is not allowed to have a material shortage because it is extremely expensive to afford due to the stoppages from the resulting production lines.
Similarly, Sonmez et al. [9] state that production line stoppages due to broken machinery cause production loss in manufacturing systems, and Zhao et al. [14] present a preventive maintenance (PM) modeling based on delay times for manufacturing systems in a steel industry. Specifically, line stoppages are a consequence of raw material shortage. Finally, Peng and Zhou [11] investigate a problem of programming multiple servers in an automotive assembly line, where the supply of parts just in time (JIT) is a critical and costly problem.
Regarding overtime, Hansson et al. [15] report a study to determine if the batch preparation process affects work efficiency when it is compared with only preparing one batch, and found that the kitting process is associated with overtime as a result of the material batching and feeding process. In addition, they conducted two experiments and discovered that the preparation of a single batch took longer than the batch preparation, which represented a higher production cost. Similarly, several studies argue that overtime is a specific aspect of certain tasks or departments associated with manufacturing systems. For example, Wang et al. [16] indicate that poor process planning make operators work longer, which translates into higher production costs.
Moreover, El-Namrouty and Abushaaban [17] mention that the material handling process and inefficient body movements or postures do not add value to a product, generate a long production cycle time, or make inefficient the implementation of human resources. Regarding body movements and postures, they imply an inadequate implementation of ergonomics in the production system, since operators will perform hazardous tasks, such as stretching, bending, or lifting, when it is not required. For example, Kamat et al. [18] and Gómez-Galán et al. [19] mention that uncomfortable body postures, as well as repetitive movements, represent a risk factor for employees, since they can cause musculoskeletal disorders and negatively affect employees’ health and performance, altering their well-being. In the same way, Yeow et al. [20] showed that repetitive movements may cause fatigue and loss of concentration while performing a task, which increases the probability of making mistakes, negatively affecting their performance. These problems may be generated by a poor design of workstations, which generates uncomfortable postures, causes musculoskeletal disorders, and consequently, affects work performance and well-being [21], as well as causing high production costs [17].
In conclusion, all of these problems cause high costs, a lack of competitive advantage, and a weak market position, which, along with the times of work shifts, lack of human resource performance, and well-being, represent a barrier for sustainable workplaces [3,22].

1.2. Sustainability Strategies

According to the literature, there are eight sustainability strategies. These strategies are classified into two perspectives: Strategies adopted by project organizations, and strategies adopted by project hosts [23]. One of these strategies is setting strategic and tactical sustainability goals. This strategy is focused explicitly on sustainability issues when developing project strategies, paying special attention to instances where sustainability issues align with other aspects [24]. Another strategy is influencing the sustainability of project practices, which consists in supporting the incorporation of sustainability into project practices and technical systems through, e.g., construction tools, prefabrication, and waste management systems [25]. Table 1 summarizes the eight sustainability strategies provided by the literature.
As can be observed in Table 1, none of these strategies are focused on achieving sustainable workplaces by integrating standardized work and anthropometry. That is why this research proposes an integrative approach of standardized work and anthropometry as a strategy to achieve sustainable workplaces and well-being for operators.
In order to solve the previous issues, multiple strategies are implemented in manufacturing systems. For example, in the supplier selection process, companies are focused on attributes related to delivery time and performance [1], since they avoid having technical stoppages due to a lack of raw material [1]. For example, a business-to-business (B2B) study indicates that those that have an appropriate delivery performance can have higher prices on their products, as well as gaining more customers due to their price flexibility [32]. Another example of a competitiveness strategy is the Fulfillment by Amazon (FBA) service, which provides a greater flexibility in their sales practices and manages the full compliance of a product from external suppliers after it has been purchased. In addition, a recent survey reported that 73% of FBA users have obtained increases in unit sales over 20% [33]. On the contrary, the low performance of deliveries causes a decrease in sales and even sale losses.
In addition, standardized work (SW) is a fundamental tool for solving manufacturing problems because it offers almost immediate results for the organizational performance, since it increases productivity and reduces delivery times [34]. Similarly, SW is a set of specific instructions that are required for assembling a product in the most efficient way, since it allows definition of the best methods and sequenced tasks needed for each production process and employee; consequently, it helps to reduce waste [34,35,36] and increase the well-being and performance of the human factor. In addition, SW is probably the most reliable method for performing any manufacturing task, since it is one of the safest and most efficient tools for meeting timely, orderly, and quality deliveries [37].
Likewise, SW defines how each operator must perform each task or job in the production system; as a result, random tasks that reduce life cycle times are avoided [34,38]; in fact, SW uses takt-time to meet the customer demand [39]. Specifically, the main objective of SW involves eliminating Mura [40]; this is a general term for unevenness or irregularity in physical materials or in human condition, which is a key concept for performance improvement systems, since it is one of the three forms of waste that can be found in manufacturing systems (Muda, Mura, and Muri) [41]. Hence, SW does not mean that a work routine will be changed; instead, it implies that “it is the best method to know how to perform a task better” [38,42]. In addition, SW consists of three elements [34]: Uptime, work sequence, and standard inventory.
SW applications in productive systems are found in the work of Nallusamy [43], who applied line balancing and SW in the Computer Numerical Control (CNC) industry to reduce activities that did not add value to a product by 17%, while its production increased by five units per day with two employees, and up to seven units by day with a single employee. Similarly, Nallusamy and Saravanan [44] implemented these two tools in a manufacturing company to reduce cycle time and increase productivity. In addition, Mor et al. [34] implemented SW, obtaining a 31.6 s reduction in cycle times and 6.5% increase in production. Finally, Ordieres-Mere and Villalba-Diez [45] implemented SW in the inter-communication processes in the automotive industry to increase the optimization of the total performance by 4%.
In summary, SW helps to increase the competitiveness of companies because it is not only focused on controlling production processes, but it also minimizes costs and maximizes efficiency [46]. Specifically, in small and medium enterprises (SMEs), SW represents a tool that compensates for the lack of advanced manufacturing technology (AMT) in production processes; however, SW is often poorly implemented or misunderstood [34].
Lee et al. [47] define anthropometry as a measurement of the human body, which is necessary for the design of workstations, and multiple cases are reported; for example, Colim et al. [48] studied a furniture assembly workstation where most employees were continually exposed to risk factors for musculoskeletal disorders; they redesigned workstations by considering anthropometric data from employees and, as a result, body posture was improved and the risk of suffering skeletal muscle disorders was eliminated. Likewise, Kibria and Rafiquzzaman [49] indicate that working for long periods in a sitting position in front of a computer causes several types of pain, discomfort, and health problems in university teachers; therefore, workstation designs with an anthropometric approach were proposed. Finally, Lee and Cha [50] report that console operators in nuclear power plants face human–computer interaction problems due to inappropriate console design; consequently, they redesigned the consoles by considering anthropometry. In conclusion, based on the previous examples, the correct use of anthropometry in workstation redesign improves the well-being, health, comfort, and safety of operators [51].
Workstation design influences the postures and movements that operators perform during task execution [52]. The most basic movements are named Therbligs, which were introduced by Frank B. Gilbreth, who, in his early work in the study of movement, developed certain subdivisions or events that he considered common to all kinds of manual work. The term refers to 17 elemental subdivisions or basic movements. According to Palit and Setiawan [53], Therbligs can be effective or ineffective. On the one hand, effective Therbligs directly advance work progress and can often be shortened, but generally cannot be removed entirely. On the other hand, ineffective Therbligs do not advance the progress of the job and should be removed if possible. Some of the 17 Therbligs, along with their symbols, are Reach (RE), Move (M), Grasp (G), Assemble (A), and Disassemble (DA), to mention few. A complete view of the 17 Therbligs (effective or ineffective), their definitions, and their symbols can be seen in Palit and Setiawan [53] and Freivalds and Niebel [54]. According to Jia et al. [55], the Therblig is one of the basic concepts in the study of movement, and is defined as a basic energy demand unit. The basic idea of the study of movement is to divide the worker’s operation into simple motion elements, which are Therbligs [55].
Concerning the relationship between anthropometry and sustainability, the literature mentions that a poor workplace design is a major risk factor responsible for the uncomfortable conditions that operators on assembly lines are exposed to, especially when operators are working multiple hours a day, decreasing their well-being [56]. As mentioned above, this poor design generates uncomfortable postures, causing musculoskeletal disorders. The anthropometric design of the workstations facilitates the sustainable development of the workplace and, therefore, of the operators [56].
Different authors, such as Kim et al. [57] and Nadadur and Parkinson [58], mention that anthropometry is essential to improve the sustainability and physical suitability of a workplace design. In addition, these authors suggest that anthropometry positively impacts sustainability by reducing the consumption of raw materials, increasing the useful life of products (including workstations), and considering the variability among the user population. Therefore, anthropometric design allows improvement of global sustainability by efficiently using available resources, prolonging the time of use of products, and increasing their versatility by satisfying different user populations.
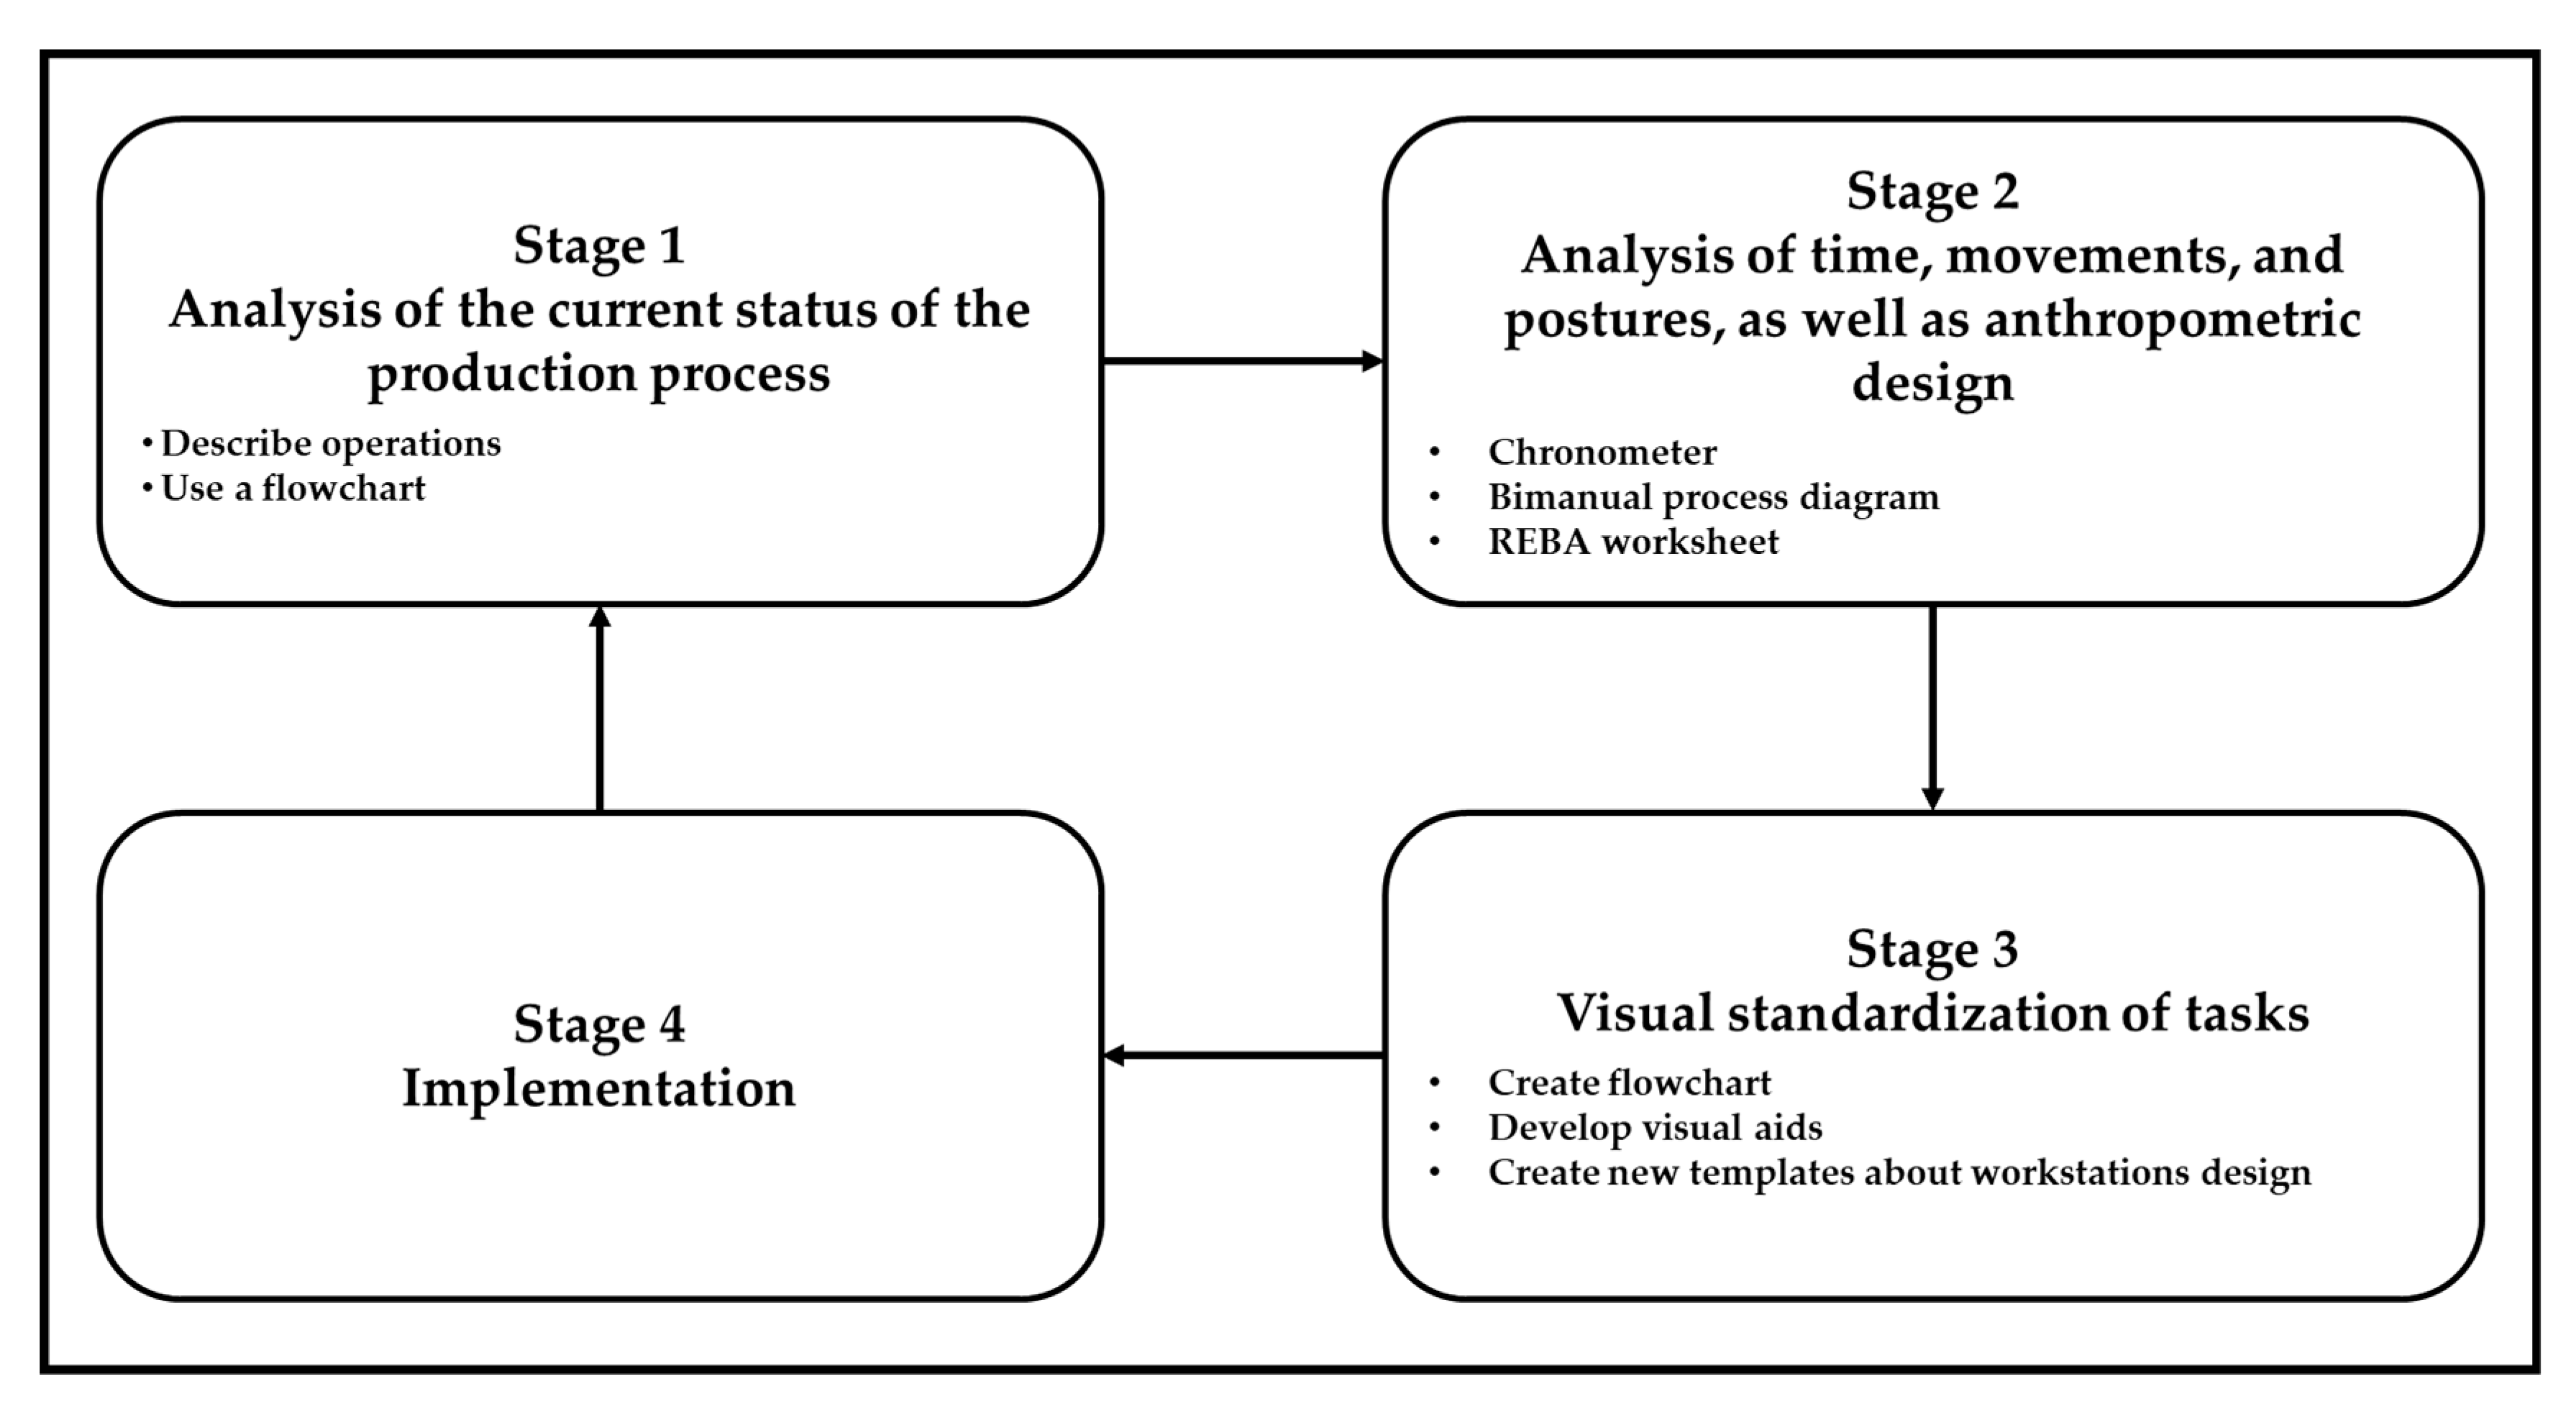
The uniqueness of this research is that it proposes and integrates an approach by combining SW and the anthropometric design of workstations in the production processes in order to improve sustainability in manufacturing companies and well-being in operators. The integrated approach is illustrated in a real case study as a response to an industrial problem.

2. Methodology

The methodology presented in this research has a similar structure to that of Realyvásquez-Vargas et al. [59]; it includes the four stages presented in Figure 1.
In the next sections, each stage is explained in detail.

2.1. Stage 1. Analysis of the Current Status of the Production Process

This stage consists of obtaining information on the current status of the production process, as well as performing a preliminary analysis. The following activities are performed: Describing workstations, creating diagrams about the current production process in the company, checking and analyzing the production process, identifying critical production process indicators, and providing an improvement production project for managers.
In general terms, the deficiencies of the current production process are summarized; the proposal based on SW and on the anthropometric design is described, highlighting the benefits of a standardized process, where workstations are focused on the capabilities and limitations of operators. Specifically, the production process is analyzed along with the operators’ assistance, because they have a better knowledge about the production process and they check the production tasks constantly to identify potential opportunities for improvement. Next, a production process flow chart is designed to visually represent the precise sequence of required tasks that operators must perform, which are described in detail at each workstation.

2.2. Stage 2. Analysis of Times, Movements, and Postures, as well as Anthropometric Design

In this stage, a management permission is granted to apply SW in anthropometric design and in the production process in workstations. The activities are focused on analyzing the production process by carrying out studies of times, movements, and postures adopted by the operators in the workstations. The activities are as follows: Study of times, study of movements, ergonomic evaluation of postures, balancing of production lines, and anthropometric redesign of workstations.
These tasks seek to discover and eliminate the inefficiencies of time and movement when performing an activity, and thus to measure operators’ performance [60] and improve their safety and well-being, as well as the interaction of the operator–workstation system [61]. In the time analysis, the number of cycles to be observed [54], the average time observed (OT) for each work cycle, and the normal time (NT) for each task are obtained; these are defined according to four performance factors of the System of Westinghouse rating [54,62]. The standard time (ST) is obtained by assigning constant clearances and variables that the International Labor Organization (ILO) established. In addition, normal time and standard time are taken by applying Equations (1) and (2) [54].
N T = (   P e r f o r m a n c e   f a c t o r s   +   1 ) × O T
S T =   ( C o n s t a n t   a n d   v a r i a b l e   a l l o w a n c e s   +   1 ) × T N
In the movement analysis, effective and ineffective Therbligs are identified and analyzed, and the bimanual process diagram is constructed, eliminating ineffective Therbligs and the uncomfortable postures that may cause bottlenecks. According to Fieivalds and Niebel [54], this diagram shows all movements and delays made by the right and left hands, as well as the relationships among them. These authors mention that the main purpose of this diagram is to identify inefficient movement patterns and observe violations of the principles of motion economy. The bimanual process diagram has the advantage that it facilitates changing work methods; consequently, there is a balanced two-handed operation and a smoother and more rhythmic cycle that keeps both delays and operator fatigue to a minimum, which can be achieved [54].
Specifically, the movement analysis helps to determine which types of hand tools employees use the most in order to place these tools closer to redesigning the workstation [54]. In the posture analysis, the Rapid Entire Body Assessment (REBA) is applied [63,64], since it determines which level of risk operators are exposed to. [65].
The balancing of production lines refers to the balanced assignment of activities in an assembly line to meet the required production demand [66], where a unit cost analysis is performed to achieve it: First, the tasks from each work cycle are described and the cycle time is converted into a decimal format; second, the number of employees required in each workstation is defined and the total number of employees who are required per line is estimated. In addition, the time on the line, the percentage of equilibrium for each production line, the adjusted work cycle, and the production per hour, shift, and department are estimated. Third, the number of items that are manufactured by each operator and the production costs per unit are estimated. Subsequently, a possible work sequence is defined for the tasks that can be performed to maintain similar cycle times in each workstation, which allows the determination of the efficiency and the time of activities in each line. Then, the number of employees needed in each production line to meet the customer demand is estimated as well. Finally, Equations (3)–(9) are applied to perform this analysis [67].
B a l a n c i n g   p e r c e n t a g e = T o t a l   o p e r a t o r   t i m e T i m e   i n   l i n e × 100
A d j u s t e d   w o r k   c y c l e = C o n t r o l   c y c l e B a l a n c i n g   p e r c e n t a g e × 100  
P r e d u c t i o n   p e r   h o u r = 60   m i n u t e s A d j u s t e d   w o r k   c y c l e  
P r o d u c t i o n   p e r   s h i f t = U n i t s H o u r × H o u r s S h i f t
P r o d u c t i o n   p e r   d e p a r t m e n t = P r o d u c t i o n   p e r   s h i f t × N u m b e r   o f   a s s e m b l y   l i n e s
U n i t s o p e r a t o r s = U n i t s   p e r   s h i f t T o t a l   o p e r a t o r s
C o s t   p e r   u n i t = T o t a l   o p e r a t o r s × D a i l y   s a l a r y U n i t s   p e r   s h i f t
Similarly, the workstations are redesigned using the bimanual process diagram developed in Stage 1. Therefore, an anthropometric study is carried out among the operators to define the minimum and maximum range areas, where the 5th percentile of the forearm, the 5th percentile of the extended arm, and the 95th percentile of the shoulder width are required [68]. In addition, workstations are adjusted considering the minimum and maximum range areas, and the locations of hand tools are determined according to their frequencies of use. The final measurements of the workstations were obtained by applying Equation (10) [68].
P k = X ¯ + σ Z
In Equation (10), Pk represents the length obtained for the percentile k, X ¯ is the average of the data of the measurements for a certain part of the body, σ represents the standard deviation of the data, and Z represents the value of the normal distribution for the percentile k. Finally, experimental runs are performed on production lines with the original and proposed methods to compare the times, movements, and postures that are used, as well as the cost of production per unit.

2.3. Stage 3. Visual Standardization of Tasks

The objective of this stage is to provide a visual support for the proposed method; therefore, the principal tasks to carry out are: Creating flowcharts about the adjusting process, developing visual aids for employees, and creating new templates about the design of workstations.
Specifically, flowcharts help to illustrate the sequence of tasks that must be performed, since they are established in a bimanual process diagram. Therefore, the required visual aids are prepared for each workstation with photographs taken of the tasks in order to highlight the most important points and indicate the necessary hand tools. Visual aids are developed seeking clarity, visibility, and simplicity. Finally, the templates are designed in real size using workstation images and a bimanual process diagram, to remain fixed in the corresponding workstation. These images should display the locations of hand tool and help employees to locate them quickly.

2.4. Stage 4. Implementation

In this stage, the new methods and standardized work are implemented in the production lines. In addition, the results obtained are compared with the objectives initially set to determine if they are achieved. In the case that the new methods are effective, production lines are adjusted with the new production methods, and the adjusted workstations are established, including the designed visual aids and templates.

3. Results

3.1. Context of the Case Study and Research Objective

A publishing press with 150 employees has mechanical and manual tasks in its production process. The mechanical tasks are prepress, printing, spine gluing, bending, printing, gluing, and cutting, while manual tasks include bending, collating, crimping, and box-build assembly. The principal offered services are box packaging and assembly, as well as printing and publication of manuals, which represent 70% of its operations. The 30% left includes the manufacture of file folders, labels, books, magazines, and catalogs. The company is organized in six departments: Prepress, Printing, Machine Assembly, Manual Assembly, Edition, and Box Assembly.
The present research is particularly carried out in the Box Assembly Department, where the product packaging is not included. The production process is integrated by four assembly lines: Five operators, one quality inspector, and one packing operator oversee each production line, which is shown in Figure 2.
There are currently multiple opportunities for improvement in the production process, such as increased production process, on-time deliveries, inventory management, elimination of work risks, increased work performance, and implementation of visual aids, to mention a few. In addition, the most common box assembly model that is manufactured is the X model.
Currently, the daily demand is 650 units for the X model, but the assembly line produces only 350 units; therefore, extra time must be used (see Table 2), which implies a higher production process cost, and employees are sometimes fatigued or get back pain or a type of pain in their arms or feet due to the long working hours, where body postures are adopted from the workstations (during the June–August 2019 period, at least 20 cases were reported). Figure 3 shows the positions adopted by operators.
In a preliminary analysis, it was determined that one or more of the following undesirable processes is experienced in the Box Assembly department: Bottlenecks, production delays, late deliveries, overtime, unnecessary body movements, uncomfortable body posture costs, and high costs due to unbalanced production lines. Due to this situation, production costs increase; consequently, the corporate reputation is negatively affected because the customer demand is not achieved. In addition, there are risks of absenteeism or resignation by operators if the workstation design is not improved to eliminate unnecessary body postures.
As a matter of fact, the general objective of this research is to increase the production rate of the assembly line of box X through the standardization of the production process and to anthropometrically redesign the workstations in it. In order to achieve the previous objective, it is sought to increase production levels by 20%, reduce standard time by 15%, and reduce unit cost by 40%.
This case study is used because, from the perspective of critical realism, generalizing empirical and theoretical findings is not enough, as Tsang [69] indicates, since fallibilism implies that once a theory is developed, it needs to be tested empirically, and case studies are an appropriate way to accomplish this. Similarly, Easton [70] proposes critical realism as a coherent, rigorous, and novel philosophical position, which supports the research of a single case as an investigative approach, but provides useful implications for a theoretical framework.

3.2. Results at Stage 1

A flowchart was created using the company’s current manufacturing system for the box model X, which is shown in Figure 4. In addition, a description was made about the operations that are required in order to have an appropriate understanding about the production process.
At station 1, operators pick the box from the right side and place it in front, where a strip of double-sided adhesive tape is placed on the back of the box; a label with the customer’s name will be included as well. Then, operators place four strips of double-sided adhesive tape on the contour of a quadrangular aperture, which are subsequently removed from the box, leaving the rubber on display. Finally, it is sent to station 2.
At station 2, operators place next to the box a strip of double-sided adhesive tape that bends. Subsequently, a strip of a double-sided mustard adhesive tape and a quadrangular piece of clear plastic are placed on the rubber, which must expose the adhesive tape strips that were placed at station 1. Then, operators must clean the clear plastic using an alcohol-dipped ball of cotton to erase any fingerprints, and the box is sent to station 3.
At station 3, operators take the box and remove the face of the double-sided label adhesive tape that was placed at station 1; then, the customer’s name tag is placed, as well as another double-sided folding tape. In addition, two magnets are placed in the space that is in the quadrangular plastic; then, the magnets are coated with black adhesive tape strips, and the box is sent to station 4.
At station 4, operators take the box and remove the remaining mustard adhesive tape, as well as the double-flex adhesive tape, and countermeasures are inserted—one at the bottom and one at the top of the box. Then, the box is assembled by pasting the lid of the box, and it is sent to station 5. Finally, operators at station 5 take the box and place double-sided adhesive tape in the base of the box, and then place double-sided adhesive tape on one of the box tabs and remove it. Then, a box tab is stuck to the other side of the box to shape it. In the end, the box is transferred to the quality supervision station.

3.3. Results at Stage 2

Table 3 shows information on the allowances and performance factors that are assigned to each original station. For instance, in the performance factor case, the effort clearance factor for station 1 (operator 1) was 0.03; this indicates that the operator had an appropriate effort. Regarding the consistency factor, a clearance of −0.02 was obtained; this indicates that the operator had an acceptable consistency. The same happened with the other slacks from the other factors for each station. Finally, slack scores were added to each station, one was added, and the total was obtained. In fact, the same procedure was applied to obtain the constant and variable allowances.
Table 4 shows the estimated OT, NT, and ST. The STs in stations 3 and 4 presented a difference of 17 and 35 s with respect to the shortest ST (station 5). The total ST was 4.07 min for the original production lines.
Furthermore, Table 5 shows the results from the movement analysis for each of the operations included in the flowchart (Figure 4). In fact, 230 inefficient Therbligs were obtained, of which 33 were detected in task 9 (that is, placing the plastic adhesive tape); thus, this was the task with the most inefficient Therbligs. In addition, for the evaluation of postural load, a score of 8 was obtained with the REBA method; therefore, the risk of suffering from musculoskeletal disorders turned out to be high, and changes in the design of workstations are required [71]. In addition, Table 6 shows the anthropometric measurements obtained from the operators for the redesign of workstations.
Table 7 presents the results from the production line balance as well as the unit cost analysis, which is related to the original method that is performed by five operators in the production line. It is observed that the total cycle time of the model X is 4.12 min. In the same way, the control cycle of the model X corresponds to the highest time between operating times, which is 1.18 min. The average time in the production line is 5.92 min, which represents the outcome of multiplying the control cycle in the production process by the number of operators who are assigned to the production line, which is five employees in this case. Therefore, the assembly lines are balanced by about 70%, and the unit cost is 1.39 Mexican pesos (that is, 0.072 USD).
Based on this analysis, it is established that the 1st, 7th, 8th, 9th, 10th, and 11th tasks from Table 5 can be performed at the same time before the other tasks. In the same way, it is shown that all 13 tasks must be performed before the 14th task is completed. The present results are used, along with the report regarding the positional weight rank for each task, in order to create a new distribution of the box assembly process in only four workstations, as is shown in Table 8. Specifically, this means that the production line length is reduced when the assembly line is balanced due to the cycle time of new operations [67]. In addition, with this type of distribution in the box assembly process, the largest cycle time difference between two operations is 8 s, which has a difference of 27 s when it is compared with the original distribution of the production process.
Figure 5 shows the redesigned workstations from an anthropometric approach: The image in A) illustrates the general proposed model, while the images in B), C), D), and E) represent the individual redesigns for the stations 1, 2, 3, and 4, as well as their assigned locations to place the required items and hand tools. After an anthropometric redesign of the workstations, the postural load score with the REBA method was 3; therefore, the risk of suffering musculoskeletal disorders was low [71].
The results show the estimated standard time (ST) in the production line, which is 3.32 min; that is, 45 s less when it is compared with the original standard time in the production line (18% less). Table 9 presents the cycle time from each redesigned station, for which it is determined that the estimation time difference between two stations is not over 6 s.
Regarding the analysis of the time in the redesigned process, only 78 inefficient Therbligs were detected, which represents a reduction of 66.1% when compared with the original production process. In addition, Table 10 displays the results that were obtained from this analysis; the most inefficient movements were retrieved from Operation 1.
Furthermore, Table 11 presents the results of the unit cost as well as the analysis of the production line balance in the adjusted production process. Specifically, the production line balance increased from 70% to 97%, indicating the smooth flow of the production process where any bottleneck was presented. In addition, the unit cost decreased by 58.27%, from 1.39 to 0.58 Mexican pesos (0.072 to 0.030 USD). In addition, it can be observed that the number of operators per assembly line decreased from five to four.

3.4. Results at Stage 3

In this stage, the visual aids and templates for redesigning workstations were developed; headings of visual aids include the following aspects: Name of the department, number of the production line, number of the station, name of the task, model of the box, number of the page, and date of issue and of the latest revision. Particularly, the right side of the visual aid addresses aspects concerning a specific task, which reminds operators about the importance of each detail in every task. In the instruction section, a list of the hand tools that are necessary is presented; therefore, operators should ensure that the materials and tools required are arranged before starting to work. Finally, in the materials section, some aspects are included that must be reported by the personnel who produce the visual aids.
In fact, six visual aids were created; one for the workstations 1 and 2, as well as two for workstations 3 and 4. Figure 6 and Figure 7 portray some examples about the visual aids that were created. Specifically, visual aids include an image and a brief description about the steps to follow in each task. In addition, each step is numbered to provide an accurate and logical sequence for the tasks in order to avoid errors or confusion.
Similarly, Figure 8 presents a flowchart about the redesigned production process, in which it is mentioned that the new methodology proposes a process of 16 tasks with a cycle time of 144 s. Note that the fourth and fifth tasks are performed before the box assembly process or when there is no customer demand for the X model, which enables operators to be prepared with several items (i.e., labels or corresponding adhesive tape) before starting the box assembly process. In addition, in Figure 8, the tasks of workstations 1, 2, 3, and 4 are separated by green lines, in which a cycle time of 197 s was retrieved; 15 s were subtracted from the fourth and fifth tasks. Therefore, the average Observed Time (OT) was 182 s, a value that is close enough to the value that is shown in Table 9 (i.e., 186 s).

3.5. Stage 4. Implementation

After the production process was standardized, three production lines were monitored by four operators in each production line, together with a fourth line with five operators that was supervised for a week, in order to estimate the increase in the production process. The three production lines worked by applying the redesigned production process, while the fourth line worked by applying the original production method. A significant increase in production was detected in the three production lines, where 2942, 2963, and 2971 units were produced, respectively. On the other hand, in the fourth production line, only 1813 units were produced with the original process method.
Since the five production lines worked completely under the redesigned process, the company reported a 42.62% increase in production. In addition, by having five production lines instead of four, the company increased its production process by 45.9%. In addition, the company average increased the daily production from 1400 to 3050 units, representing an increase of 1650 units; the results of this analysis are presented in Table 12.
Finally, it is worth mentioning that after five months of monitoring the proposed method, there were no injuries or any type of discomfort reported by operators from the Box Assembly department. In addition, the anthropometric redesign of workstations and the redesign of the production process had a positive impact on the operators’ health and safety. On the one hand, the anthropometric design of the workstations prevented operators from adopting uncomfortable body postures [72]; on the other hand, the redesigning of the production process method eliminated unnecessary movements, since uncomfortable body postures and repetitive movements are the cause of musculoskeletal disorders (MSD) [72]. Therefore, implementing the redesigned process method will prevent operators from suffering MSD or any type of physical fatigue because overtime is not required.

4. Conclusions

This paper has shown the development of a new and reliable strategy to achieve sustainable workplaces in manufacturing industries. The strategy is an integrated approach consisting of work standardization (as a lean manufacturing tool), basic industrial engineering tools (time and movement studies), and human factor tools (anthropometric design). This integrated approach can have a significant impact, first, on the sustainability of operators and manufacturing companies, and then on their performance. This impact is manifested by removing barriers to sustainability, such as high costs, as well as with the improvement in the use of resources by the company. Moreover, the integrated approach helps increase productivity, punctually meet demand, increase competitiveness, minimize waste (such as over-processing), and decrease the number of ineffective Therbligs in the production process. Thus, the integrated approach helps improve sustainability.
In the present case study, ineffective Therbligs decreased by 66% (from 230 to 78), and the Standard Time (ST) decreased from 244 to 199 s; in other words, it was reduced by 18.44%. In addition, the results demonstrate that when a specific task is standardized, fewer employees are required in production lines; as a result, an opportunity for companies to optimize the human factor by installing redesigned production lines with other types of operators is presented; consequently, the production of the company will increase. In this case study, the number of operators was reduced from five to four in each production line, which is 20%; therefore, the company installed a redesigned production line. Similarly, the results show that the integrated approach of standardization of work and the anthropometric design of workstations has a positive impact on the percentage of the production line balance, which helps reduce the unit cost of production as well as the compliance rate of demand increases. In the present case study, the percentage of the production line balance increased from 70% to 97%, while the production process increased by 63.2%, which represents 229 daily units per assembly line.
All of the specific results obtained in the present case study are indicators that the manufacturing company improved the management of its resources (raw materials, time, and human resources); consequently, it improved its sustainability. Similarly, within the company, operators improved their quality of life and well-being, since they did not have to adopt undesired postures or perform uncomfortable hand movements. Outside the company, operators improved their quality of life and well-being, since the overtime was eliminated, they did not arrive at home tired, and they spent more time with their families.
The integrated approach applied and the results obtained have the practical value of being used as an improvement reference by manufacturing companies in mass production in which there is a single production process for specific products that are offered; consequently, the work can be standardized. The present case study has the limitations that it was applied in a small company and only in four production lines. Then, the sample of participants for obtaining anthropometric data was relatively small. In big manufacturing companies, collecting anthropometric data can be time-consuming, which can represent a disadvantage of the integrated approach.
As the integrated approach was implemented only in the production process of the box model X, future practical work should be directed at applying this approach in other box models, types of products (books and stamping, to mention few), and departments within the company. Similarly, there is an opportunity to apply this approach in other companies, whether they belong to the manufacturing sector or to another sector, regardless of their size. Future theoretical work should be directed at proposing and experimenting with the integration of more and different types of tools that are applied in manufacturing systems, as well as their impact on sustainability.

Author Contributions

Conceptualization, A.R.-V. and J.D.S.-Q.; Data curation, A.R.-V. and K.C.A.-S.; Formal analysis, J.B.-F., J.L.G.-A., and E.J.-M.; Funding acquisition, A.R.-V. and K.C.A.-S.; Investigation, J.D.S.-Q.; Methodology, J.B.-F., J.L.G.-A., and E.J.-M.; Project administration, J.D.S.-Q.; Validation, J.L.G.-A.; Visualization, E.J.-M.; Writing—original draft, A.R.-V. and K.C.A.-S.; Writing—review and editing, J.B.-F., J.L.G.-A., and E.J.-M. All authors have read and agreed to the published version of the manuscript.

Funding

The present research received no external funding.

Acknowledgments

The authors would like to thank the National Technological Institute of Mexico, the Tijuana Institute of Technology, the Autonomous University of Ciudad Juarez, and the University of La Rioja for allowing them to use their facilities and resources to develop this paper. In addition, the authors would like to thank the Mexican National Council of Science and Technology (CONACYT) and PRODEP for the support in this research.

Conflicts of Interest

The authors have declared that there is no conflict of interest.

References

  1. Peng, D.X.; Lu, G. Exploring the Impact of Delivery Performance on Customer Transaction Volume and Unit Price: Evidence from an Assembly Manufacturing Supply Chain. Prod. Oper. Manag. 2017, 26, 880–902. [Google Scholar] [CrossRef]
  2. Fazlollahtabar, H. Parallel autonomous guided vehicle assembly line for a semi-continuous manufacturing system. Assem. Autom. 2016, 36, 262–273. [Google Scholar] [CrossRef]
  3. Álvarez-Jaramillo, J.; Zartha-Sossa, J.W.; Orozco-Mendoza, G.L. Barriers to sustainability for small and medium enterprises in the framework of sustainable development—Literature review. Bus. Strateg. Environ. 2018, 28, 512–524. [Google Scholar]
  4. Ren, C.; Barlotti, C.; Cohen, Y.; Frangipane, B.; Garofalo, M.; Cozzari, G.; Metz, C. Re-layout of an assembly area: A case study at Bosch Rexroth Oil Control. Assem. Autom. 2015, 35, 94–103. [Google Scholar] [CrossRef]
  5. Roser, C.; Nakano, M. A Quantitative Comparison of Bottleneck Detection Methods in Manufacturing Systems with Particular Consideration for Shifting Bottlenecks. In Advances in Production Management Systems: Innovative Production Management Towards Sustainable Growth. APMS 2015. IFIP Advances in Information and Communication Technology; Umeda, S., Nakano, M., Mizuyama, H., Hibino, H., Kiritsis, D., von Cieminski, G., Eds.; Springer: Cham, Switzerland, 2015; pp. 273–281. [Google Scholar]
  6. Gu, X.; Jin, X.; Ni, J. Prediction of Passive Maintenance Opportunity Windows on Bottleneck Machines in Complex Manufacturing Systems. J. Manuf. Sci. Eng. 2015, 137, 031017. [Google Scholar] [CrossRef]
  7. Kuo, C.-T.; Lim, J.-T.; Meerkov, S.M. Bottlenecks in serial production lines: A system-theoretic approach. Math. Probl. Eng. 1996, 2, 233–276. [Google Scholar] [CrossRef]
  8. Zupan, H.; Herakovic, N. Production line balancing with discrete event simulation: A case study. IFAC-PapersOnLine 2015, 48, 2305–2311. [Google Scholar] [CrossRef]
  9. Sonmez, V.; Testik, M.C.; Testik, O.M. Overall equipment effectiveness when production speeds and stoppage durations are uncertain. Int. J. Adv. Manuf. Technol. 2018, 95, 121–130. [Google Scholar] [CrossRef]
  10. Zhou, B.; Peng, T. Scheduling the in-house logistics distribution for automotive assembly lines with just-in-time principles. Assem. Autom. 2017, 37, 51–63. [Google Scholar] [CrossRef]
  11. Peng, T.; Zhou, B. Scheduling multiple servers to facilitate just-in-time part-supply in automobile assembly lines. Assem. Autom. 2018, 38, 347–360. [Google Scholar] [CrossRef]
  12. Coffey, D.; Thornley, C. Automation, motivation and lean production reconsidered. Assem. Autom. 2006, 26, 98–103. [Google Scholar] [CrossRef]
  13. Hossen, J.; Ahmad, N.; Ali, S.M. An application of Pareto analysis and cause-and-effect diagram (CED) to examine stoppage losses: A textile case from Bangladesh. J. Text. Inst. 2017, 108, 2013–2020. [Google Scholar] [CrossRef]
  14. Zhao, F.; Wang, W.; Peng, R. Delay-time-based preventive maintenance modelling for a production plant: A case study in a steel mill. J. Oper. Res. Soc. 2015, 66, 2015–2024. [Google Scholar] [CrossRef]
  15. Hanson, R.; Medbo, L.; Johansson, M.I. Order batching and time efficiency in kit preparation. Assem. Autom. 2015, 35, 143–148. [Google Scholar] [CrossRef]
  16. Wang, Z.; Liu, R.; Sparks, T.; Liu, H.; Liou, F. Stereo vision based hybrid manufacturing process for precision metal parts. Precis. Eng. 2015, 42, 1–5. [Google Scholar] [CrossRef] [Green Version]
  17. El-Namrouty, K.A.; Abushaaban, M.S. Seven wastes elimination targeted by lean manufacturing case study “gaza strip manufacturing firms”. Int. J. Econ. Financ. Manag. Sci. 2013, 1, 68–80. [Google Scholar]
  18. Kamat, S.R.; Rayme, N.S.; Zula, N.E.N.M.; Shamsuddin, S.; Hassan, K. The Ergonomics Body Posture on Repetitive and Heavy Lifting Activities of Workers in Aerospace Manufacturing Warehouse. In IOP Conference Series: Material Science and Engineering; IOP Publishing: Kuala Lumpur, Malaysia, 2017; pp. 1–12. [Google Scholar]
  19. Gómez-Galán, M.; Pérez-Alonso, J.; Callejón-Ferre, Á.-J.; Sánchez-Hermosilla-López, J. Assessment of Postural Load during Melon Cultivation in Mediterranean Greenhouses. Sustainability 2018, 10, 2729. [Google Scholar] [CrossRef] [Green Version]
  20. Yeow, J.A.; Ng, P.K.; Tan, K.S.; Chin, T.S.; Lim, W.Y. Effects of Stress, Repetition, Fatigue and Work Environment on Human Error in Manufacturing Industries. J. Appl. Sci. 2014, 14, 3464–3471. [Google Scholar] [CrossRef] [Green Version]
  21. Kushwaha, D.K.; Kane, P.V. Ergonomic assessment and workstation design of shipping crane cabin in steel industry. Int. J. Ind. Ergon. 2016, 52, 29–39. [Google Scholar]
  22. Bhanot, N.; Rao, P.V.; Deshmukh, S.G. An integrated approach for analysing the enablers and barriers of sustainable manufacturing. J. Clean. Prod. 2017, 142, 4412–4439. [Google Scholar]
  23. Aarseth, W.; Ahola, T.; Aaltonen, K.; Økland, A.; Andersen, B. Project sustainability strategies: A systematic literature review. Int. J. Proj. Manag. 2016, 35, 1071–1083. [Google Scholar] [CrossRef]
  24. Martens, M.L.; Carvalho, M.M. The challenge of introducing sustainability into project management function: Multiple-case studies. J. Clean. Prod. 2016, 117, 29–40. [Google Scholar] [CrossRef]
  25. Jaillon, L.; Chi-Sun, P. Design issues of using prefabrication in Hong Kong building construction. Constr. Manag. Econ. 2010, 28, 1025–1042. [Google Scholar] [CrossRef]
  26. Shi, Q.; Zou, J.; Zillante, G. Exploring the management of sustainable construction at the programme level: A Chinese case study. Constr. Manag. Econ. 2012, 30, 425–440. [Google Scholar] [CrossRef]
  27. Zhong, Y.; Wu, P. Economic sustainability, environmental sustainability and constructability indicators related to concrete- and steel-projects. J. Clean. Prod. 2015, 108, 748–756. [Google Scholar] [CrossRef]
  28. Block, T.; Paredis, E. Urban development projects catalyst for sustainable transformations: The need for entrepreneurial political leadership. J. Clean. Prod. 2013, 50, 181–188. [Google Scholar] [CrossRef] [Green Version]
  29. Sánchez, M.A. Integrating sustainability issues into project management. J. Clean. Prod. 2015, 96, 319–330. [Google Scholar] [CrossRef]
  30. Genus, A.; Theobald, K. Roles for university researchers in urban sustainability initiatives: The UK Newcastle Low Carbon Neighbourhoods project. J. Clean. Prod. 2015, 106, 119–126. [Google Scholar] [CrossRef]
  31. Yunus, R.; Yang, J. Improving ecological performance of industrialized building systems in Malaysia. Constr. Manag. Econ. 2014, 32, 183–195. [Google Scholar] [CrossRef] [Green Version]
  32. Mewborn, S.; Murphy, J.; Williams, G. Clearing the Roadblock to Better B2B Pricing. Available online: http://www.bain.com/publications/ar%0Aticles/clearing-the-roadblocks-to-better-b2b-pricing.aspx (accessed on 4 May 2015).
  33. Faggiano, M. Fulfillment by Amazon: What Amazon doesn’t tell third-party sellers. Available online: https://venturebeat.com/2014/01/08/fulfillment-by-amazon-what-amazon-doesnt-tell-third-party-sellers/ (accessed on 15 January 2020).
  34. Mor, R.S.; Bhardwaj, A.; Singh, S.; Sachdeva, A. Productivity gains through standardization-of-work in a manufacturing company. J. Manuf. Technol. Manag. 2018, 30, 899–919. [Google Scholar] [CrossRef]
  35. Mor, R.S.; Singh, S.; Bhardwaj, A. Learning on lean production: A review of opinion and research within environmental constraints. Oper. Supply Chain Manag. Int. J. 2016, 9, 61–72. [Google Scholar] [CrossRef] [Green Version]
  36. Mor, R.S.; Bhardwaj, A.; Singh, S. Benchmarking the interactions among performance indicators in dairy supply chain: An ISM approach. Benchmarking Int. J. 2018, 25, 3858–3881. [Google Scholar] [CrossRef]
  37. Martin, T.D.; Bell, J.T. New Horizons in Standardized Work: Techniques for Manufacturing and Business Process Improvement; CRC Press: New York, NY, USA, 2016. [Google Scholar]
  38. Wigglesworth, M.; Wood, T. (Eds.) Management of Chemical and Biological Samples for Screening Applications; Wiley: Weinheim, Germany, 2012. [Google Scholar]
  39. Womack, J.P.; Jones, D.T. Lean Thinking: Banish Waste and Create Wealth in Your Corporation, 2nd ed.; Simon & Schuster: London, UK, 2013. [Google Scholar]
  40. Arezes, P.; Carvalho, D.; Alves, A.C. Threats and Opportunities for Workplace Ergonomics in Lean Environments. In Proceedings of the 17th International Annual EurOMA Conference-Managing Operations in Service Economics, Porto, Portugal, 6–9 June 2010. [Google Scholar]
  41. Jin, S.; Ji, C.; Yan, C.; Xing, J. TFT-LCD mura defect detection using DCT and the dual-γ piecewise exponential transform. Precis. Eng. 2018, 54, 371–378. [Google Scholar] [CrossRef]
  42. Duggan, K.J. Creating Mixed Model Value Streams: Practical Lean Techniques for Building to Demand; Productivity Press: New York, NY, USA, 2013. [Google Scholar]
  43. Nallusamy, S. Efficiency Enhancement in CNC Industry using Value Stream Mapping, Work Standardization and Line Balancing. Int. J. Perform. Eng. 2016, 12, 413–422. [Google Scholar]
  44. Nallusamy, S.; Saravanan, V. Enhancement of Overall Output in a Small Scale Industry through VSM, Line Balancing and Work Standardization. Int. J. Eng. Res. Africa 2016, 26, 176–183. [Google Scholar] [CrossRef]
  45. Villalba-Diez, J.; Ordieres-Mere, J. Improving Manufacturing Performance by Standardization of Interprocess Communication. IEEE Trans. Eng. Manag. 2015, 62, 351–360. [Google Scholar] [CrossRef]
  46. Wang, G.; Wang, J.; Ma, X.; Qiu, R.G. The effect of standardization and customization on service satisfaction. J. Serv. Sci. 2010, 2, 1–23. [Google Scholar]
  47. Lee, J.; Cho, N.; Yun, M.H.; Lee, Y. Data-Driven Design Solution of a Mismatch Problem between the Specifications of the Multi-Function Console in a Jangbogo Class Submarine and the Anthropometric Dimensions of South Koreans Users. Appl. Sci. 2020, 10, 415. [Google Scholar] [CrossRef] [Green Version]
  48. Colim, A.; Carneiro, P.; Costa, N.; Arezes, P.M.; Sousa, N. Ergonomic Assessment and Workstation Design in a Furniture Manufacturing Industry—A Case Study. In Studies in Systems, Decision and Control; Springer International Publishing: Cham, Switzerland, 2019; Volume 202, pp. 409–417. [Google Scholar]
  49. Kibria, G.; Rafiquzzaman, M. Ergonomic Computer Workstation Design for University Teachers in Bangladesh. Jordan J. Mech. Ind. Eng. 2019, 13, 91–103. [Google Scholar]
  50. Lee, H.; Cha, W.C. Virtual Reality-Based Ergonomic Modeling and Evaluation Framework for Nuclear Power Plant Operation and Control. Sustainability 2019, 11, 2630. [Google Scholar] [CrossRef] [Green Version]
  51. Hitka, M.; Sedmák, R.; Joščák, P.; Ližbetinová, L. Positive Secular Trend in Slovak Population Urges on Updates of Functional Dimensions of Furniture. Sustainability 2018, 10, 3474. [Google Scholar] [CrossRef]
  52. Gaudez, C.; Gilles, M.A.; Savin, J. Intrinsic movement variability at work. How long is the path from motor control to design engineering? Appl. Ergon. 2016, 53, 71–78. [Google Scholar] [CrossRef] [PubMed] [Green Version]
  53. Palit, H.C.; Setiawan, Y. Methods Improvement for Manual Packaging Process. In Proceedings of the 3rd International Forum Conference on Logistic and Supply Chain Management (LSCM), Denpasar, India, 27–29 June 2013; pp. 291–302. [Google Scholar]
  54. Freivalds, A.; Niebel, B.W. Niebel’s Methods, Standards, and Work Design, 13th ed.; McGraw-Hill: New York, NY, USA, 2014. [Google Scholar]
  55. Jia, S.; Tang, R.; Lv, J. Therblig-based energy demand modeling methodology of machining process to support intelligent manufacturing. J. Intell. Manuf. 2014, 25, 913–931. [Google Scholar] [CrossRef]
  56. Samuel, O.; Israel, D.; Moses, F. Anthropometry Survey of Nigerian Occupational Bus Drivers to Facilitate Sustainable Design of Driver’s Workplace. Sustain. Energy Build. Res. Adv. 2016, 5, 1–10. [Google Scholar] [CrossRef] [Green Version]
  57. Kim, J.Y.; You, J.W.; Kim, M.S. South Korean Anthropometric Data and Survey Methodology: Size Korea. Ergonomics 2017, 60, 1586–1595. [Google Scholar] [CrossRef] [PubMed]
  58. Nadadur, G.; Parkinson, M.B. The role of anthropometry in designing for sustainability. Ergonomics 2013, 56, 422–439. [Google Scholar] [CrossRef] [PubMed]
  59. Realyvásquez-Vargas, A.; Arredondo-Soto, K.C.; Carrillo-Gutiérrez, T.; Ravelo, G. Applying the Plan-Do-Check-Act (PDCA) Cycle to Reduce the Defects in the Manufacturing Industry. A Case Study. Appl. Sci. 2018, 8, 2181. [Google Scholar] [CrossRef] [Green Version]
  60. Faccio, M.; Ferrari, E.; Gamberi, M.; Pilati, F. Human Factor Analyser for work measurement of manual manufacturing and assembly processes. Int. J. Adv. Manuf. Technol. 2019, 103, 861–877. [Google Scholar] [CrossRef]
  61. Stern, H.; Becker, T. Concept and Evaluation of a Method for the Integration of Human Factors into Human-Oriented Work Design in Cyber-Physical Production Systems. Sustainability 2019, 11, 4508. [Google Scholar]
  62. Rungreunganun, V.; Sriwasut, T. Productivity improvement for heating ventilation and air conditioning unit assembly. Songklanakarin J. Sci. Technol. 2018, 40, 219–230. [Google Scholar]
  63. Shirzaei, M.; Mirzaei, R.; Khaje-Alizade, A.; Mohammadi, M. Evaluation of ergonomic factors and postures that cause muscle pains in dentistry students’ bodies. J. Clin. Exp. Dent. 2015, 7, e414–e418. [Google Scholar] [CrossRef] [Green Version]
  64. Suman, N.; Orchi, B.; Debamalya, B. Analysis of Posture of Rickshaw Pullers Using REBA and Suggestion for Change in Design. Ergon. Rural Dev. 2015, 406–412. [Google Scholar]
  65. López-Aragón, L.; López-Liria, R.; Callejón-Ferre, Á.-J.; Gómez-Galán, M. Applications of the Standardized Nordic Questionnaire: A Review. Sustainability 2017, 9, 1514. [Google Scholar] [CrossRef] [Green Version]
  66. Abdullah Make, M.R.; Rashid, M.F.F.; Razali, M.M. A review of two-sided assembly line balancing problem. Int. J. Adv. Manuf. Technol. 2017, 89, 1743–1763. [Google Scholar] [CrossRef] [Green Version]
  67. IngenieriaIndustrialOnline.Com Balanceo de Línea—Ingeniería Industrial. Available online: https://www.ingenieriaindustrialonline.com/herramientas-para-el-ingeniero-industrial/producción/balanceo-de-línea/ (accessed on 9 September 2019).
  68. Realyvásquez, A.; Hernández-Escobedo, G.; Maldonado-Macías, A.A. Ergonomic Bench to Decrease Postural Risk Level on the Task of Changing Forklift’s Brake Pads: A Design Approach. In Handbook of Research on Ergonomics and Product Design; Hernández-Arellano, J.L., Maldonado-Macías, A.A., Castillo-Martínez, J.A., Peinado-Coronado, P., Eds.; IGI Global: Hershey, PA, USA, 2018; pp. 28–47. [Google Scholar]
  69. Tsang, E.W.K. Case studies and generalization in information systems research: A critical realist perspective. J. Strateg. Inf. Syst. 2014, 23, 174–186. [Google Scholar] [CrossRef]
  70. Easton, G. Critical realism in case study research. Ind. Mark. Manag. 2010, 39, 118–128. [Google Scholar] [CrossRef]
  71. Hignett, S.; McAtamney, L. Rapid Entire Body Assessment (REBA). Appl. Ergon. 2000, 31, 201–205. [Google Scholar]
  72. Parvez, M.S.; Rahman, A.; Tasnim, N. Ergonomic mismatch between students anthropometry and university classroom furniture. Theor. Issues Ergon. Sci. 2019, 20, 603–631. [Google Scholar] [CrossRef]
Figure 1. The integrated approach of standardized work (SW) and anthropometry workstation design.
Sustainability 12 03728 g001
Figure 2. Current layout distribution of production lines in the Box Assembly department.
Sustainability 12 03728 g002
Figure 3. Postures adopted by operators.
Sustainability 12 03728 g003
Figure 4. Flowchart for the current production process of the box model X.
Sustainability 12 03728 g004
Figure 5. Workstations’ anthropometric redesigns: (A) Overall design of workstations, (B) station 1, (C) station 2, (D) station 3, and (E) station 4.
Sustainability 12 03728 g005
Figure 6. Visual aid for the redesigned station 3.
Sustainability 12 03728 g006
Figure 7. Visual aid for the redesigned station 4.
Sustainability 12 03728 g007
Figure 8. Process flowchart of the redesigned process.
Sustainability 12 03728 g008
Table 1. Sustainability strategies according to the literature. Adapted from Aarseth et al. [23].
Sustainability strategies adopted by project organizations
StrategyDescriptionReference
Developing sustainable supplier practicesSupporting suppliers in implementing sustainable practices such as, e.g., use of ecological materials and prefabrication.Shi et al. [26]
Setting strategic and tactical sustainability goalsFocusing explicitly on sustainability issues when developing project strategies, paying special attention to instances where sustainability issues align with other concerns.Martens and Carvalho [24]
Emphasizing sustainability in project designIncorporating sustainability issues in early phases of projects and explicit project design documents. The methods are based on development of performance indicators (which may be used throughout the project life cycle) and appraisal techniques, such as lifecycle assessments and value management.Zhong and Wu [27]
Sustainability strategies adopted by project hosts
StrategyDescriptionReference
Influencing sustainability of project practicesSupporting the incorporation of sustainability into project practices and technical systems through, e.g., construction tools, prefabrication, and waste management systems.Jaillon and Chi-Sun [25]
Setting sustainability policiesDefining sustainable project policies that include the development of laws and regulations, norms, plans, and guidelines to support sustainability on the project level, as well as executing governmental and regulatory tasks in a manner that emphasizes and promotes sustainability in projects carried out in the host region.Block and Paredis [28]
Mutual sustainability strategies
StrategyDescription (project perspective)Description (host perspective)Reference
Sustainability emphasis in project portfolio managementThis relies on either using a framework for project selection or actively including sustainability as a dimension in early-phase appraisals.Emphasizing sustainability issues when deciding which projects to fund and approve.Sánchez [29]
Inclusion of sustainability-promoting
actors in project organization
Selection and inclusion of actors that bring sustainability-promoting skills, capabilities, and roles to the project.Inclusion of different authorities and NGO representatives to act as legitimacy actors in project organization, supporting multidisciplinarity in project organization.Genus and Theobald [30]
Developing sustainability competenciesExpanding competencies and skill sets of project managers, e.g., by investing in formal training programs.Facilitation of local decision-making and engagement of local stakeholders in the project’s decision-making through, e.g., guidelines, norms, or financial incentivesYunus and Yang [31]
Table 2. Difference in production as well as equivalence in overtime from one production line.
ProductionDemandDifference in ProductionEquivalence in Extra Work Hours Equivalence in Extra Workdays
Day35065030033.333.7
Week175032501500194.4421.6
Month700013,0006000777.7786.41
Table 3. Constant and variable allowances and performance factors in original stations.
Constant and variable allowances
PersonalBasic fatigueStanding allowanceFine workTotal
Station 10.050.040.02 1.11
Station 20.050.04 0.021.11
Station 30.050.04 1.09
Station 40.050.040.02 1.11
Station 50.050.04 1.09
Performance Factors
SkillEffortConsistencyConditionsTotal
Station 10.060.03−0.02−0.031.04
Station 20.030.020.01−0.031.03
Station 30.020.03−0.0301.02
Station 40.030.02−0.03−0.021.0
Station 50.030.02−0.02−0.031.0
Table 4. Time estimated in original stations.
StationTime in Each Station (sec)
Observed Time (OT)Normal Time (NT)Standard Time (ST)
Station 1373843
Station 2363741
Station 3484953
Station 4646471
Station 5363636
Table 5. Ineffective Therbligs from the original production method for the box assembly process.
No of TaskOperation NameUse of the Left HandUse of the Right HandTherbligs
1Placing the double-sided adhesive tape8917
2Placing the window of the box718
3Cleaning the window of the box12618
4Placing a countermagnet in the upper side of the box055
5Placing the black adhesive tape13619
6Placing another countermagnet in the bottom side of the box448
7Placing the bias adhesive tape121224
8Placing the mustard adhesive tape121224
9Placing the clear plastic adhesive tape102333
10Removing the flap adhesive tape101525
11Placing the label adhesive tape 8513
12Placing the label of the customer10414
13Securing the magnetic closure in the box437
14Assembling the box9615
Total230
Table 6. Anthropometric measurements to redesign the production process in workstations.
OperatorFore Arm (cm)Extended Arm (cm)Back (cm)
1507440
2426443
3477139
4447441
5457042
6376040
7406438
8406635
9497139
10446640
11416640
12437240
13416034
14497638
15396638
16416443
17426535
18426536
19386138
20406239
Average (cm)436739
Table 7. Unit cost–production line balance analysis from the original production method for the box assembly process.
StationOperation NameAverage Cycle Time Min Operators
0:01:00
1Placing the double-sided adhesive tape0:00:420.71
2Placing the box window, the mustard adhesive tape, and the bias adhesive tape 0:00:410.681
3Placing a countermagnet in the upper side of the box, the bias adhesive tape and label, and cleaning the box window 0:00:530.881
4Placing another countermagnet in the bottom side of the box to close the box0:01:111.181
5Placing the flap adhesive tape and the clear plastic adhesive tape to assemble the box0:00:400.671
Total operator time0:04:074.125
Total of the control cycle1.18
Operators5
Average time in the production line5.92
Percentage balanced in the assembly line 70%
Adjusting of the cycle time1.7
Total of production per hour35
Total of production per shift318
Total of production per department1588
Total of units/operators required64
Unit cost (Mexican peso)$1.39
Table 8. Redesign of the box assembly process operations.
Station 1Station 2Station 3Station 4
Placing the double-sided adhesive tape(16)Placing the window adhesive tape(43)Placing the window of the box(31)Placing another countermagnet in the bottom of the box(8)
Placing the mustard adhesive tape(8)Placing the plastic adhesive tape(8)Placing a countermagnet in the upper side of the box(8)Securing the magnetic closure of the box(35)
Placing the flap adhesive tape(7) Placing the clear plastic adhesive tape(8)Assembling the box(16)
Placing the label adhesive tape(8) Cleaning the window of the box(4)
Placing the label of the customer(14)
Total53 51 5159
Note: The unit in each parenthesis indicates the cycle time (sec) from each operation.
Table 9. Estimations of time from the redesigned production method for the box assembly process.
WorkstationTime Per Workstation (sec)
Observed Time (OT)Normal Time (NT)Standard Time (ST)
Station 1484751
Station 2434246
Station 3484751
Station 4474751
Total186183199
Table 10. Ineffective Therbligs from the redesigned production method for the box assembly process.
StationOperation NameUse of the Left HandUse of the Right HandTherbligs
1Placing the double-sided adhesive tape20929
Placing the mustard adhesive tape
Placing the flap adhesive tape
Placing the label adhesive tape
Place the label of the customer
2Placing the window tape17724
Placing the clear plastic adhesive tape
3Placing the window of the box6915
Placing a countermagnet in the upper side of the box
Placing the clear plastic adhesive tape
Cleaning the window of the box
4Placing another countermagnet in the bottom side of the box8210
Securing the magnet closure
Assembling the box
Total512778
Table 11. Unit cost–production line balance analysis of the redesigned production method for the box assembly process.
StationOperation nameAverage cycle timeMinOperators
00:01:00
1Placing the mustard adhesive tape, the double-sided adhesive tape, the flap adhesive tape, the label adhesive tape, and the label of the customer00:00:510.861
2Placing the window adhesive tape as well as the clear plastic adhesive tape00:00:460.761
3Placing the window of the box, one countermagnet in the upper side of the box, and the clear plastic adhesive tape, as well as cleaning the window of the box00:00:510.861
4Placing and securing the magnet closure with the second countermagnet, as well as assembling the box00:00:510.861
Total operator time00:03:193.324
Total time per operator3.32
Total of the control cycle0.86
Operators4
Average time in the production line3.44
Percentage balanced in the assembly line97%
Adjusting of the cycle time0.89
Total of production per hour67
Total of production per shift606
Total of production per department3030
Total of units/operators required152
Unit cost (Mexican peso)$0.58
Table 12. Analysis of the production process increase.
Original Process MethodRedesigned Production Process Production IncreaseIncrease Percentage
Production line350610+260+42.62%
Total production14003050+1650+45.9%

