1. Introduction
With population growth and expansion of urban areas after World War II, and in light of the dominance of vehicles for urban mobility in the U.S., congestion has become a common phenomenon that threatens the sustainability of the cities. Traditional road widening and expansion strategies are losing their desirability due to physical and funding constraints, which add to the popularity of travel management strategies. Congestion pricing is one of the strategies aimed at curbing traffic demand and relieving traffic congestion [
1]. London, Singapore, and Stockholm have implemented this strategy, not only to reduce congestion, but also to reduce the concentration of traffic-related pollutions, and overall improve the quality of the air [
2,
3,
4].
There are different approaches to implement congestion pricing; some are roadway tolling, High-Occupancy Toll (HOT) lanes, area-wide charges, and cordon pricing [
5]. The most general form of pricing systems is pricing entire roadway facilities, in which users should pay for using transportation facilities such as freeways, tunnels, and bridges. The toll values at key traffic bottlenecks might be variant based on the period (peak/off-peak) or vehicle type. HOT lanes are the most common type of congestion pricing in the United States since they can improve the congested highway throughput during peak hours. By charging specific vehicles, which do not meet defined High Occupancy Vehicle (HOV) requirements, the policy can result in a less congested and more reliable network. For instance, HOT lanes on State Route 91 in Los Angeles, California, have doubled the highway throughput from 800 vehicles per hour to 1600 vehicles per hour, while increasing average travel speed from 20 mph to 65 mph [
6].
Another pricing approach is zone-based pricing, which involves putting surcharges for a specific congested area. Users are charged for either driving within, into, or out from the area. For instance, London central business district (CBD) pricing resulted in a 15 percent reduction in traffic in central London [
6]. Zone-based pricing strategies such as area-wide charges and cordon pricing might be more challenging in obtaining public and political acceptance [
5].
Previous studies mainly assert that cordon pricing, which charges drivers for utilizing the roadways within a targeted zone, has certain practical advantages borne from execution simplicity [
7]. It is also straightforward for drivers once they cross the cordon line. In the case of transport modeling, it is easier for modelers to apply cordon pricing by adding new charging fees to the links intersecting the cordon region in the network. Compared to cordon pricing, area-wide charges are more complex, since all vehicles within the area have to be monitored and charged based on their time and route history [
8].
Before and after analyses are key elements for evaluating the impacts of congestion pricing. Olszewski and Xie [
9] studied the reaction to the Singapore Electronic Road Pricing (ERP) system that charges users for entering the CBD based on the time of day and the vehicle type. They employed multinomial logit models (MNL) with the choice set of rescheduling and rerouting. Their models were calibrated by using traffic volume data, collected before and after the introduction of ERP, and indicated that variable pricing could be efficient in controlling traffic congestion. Congestion pricing has also been implemented in London to reduce traffic congestion, to make freight shipping more efficient, and to improve bus operations [
10]. Preliminary findings of London‘s congestion pricing show a significant reduction in traffic volumes and an increase in travel speed, which resulted in a 30% decrease in traffic congestion (minutes per vehicle-kilometer compared to the free-flow network) in the first year [
3]. Analyzing demand elasticity shows net economic benefits of around
$78 million for the first year; a notable percentage of which was allocated to improve the bus network by adding routes and more frequent services.
Moreover, congestion pricing in Stockholm and Gothenburg reduced CBD traffic volume by approximately 20% and 12%, respectively; however, the increase in charging fees was not welcomed by the public [
4]. Commuters’ modal shift to public transportation and changes to the destination of discretionary activities are the main reasons for traffic volume reduction in these cities [
11].
De Vos [
12] studied the outcomes of a pilot project in Belgium, which charged users on selected roads; the results indicated that reduction in kilometers traveled outweighs the reduction in car usage. A review of secondary impacts of congestion pricing, including environmental and health benefits, can be found in [
13].
Prior studies have mainly focused on either the demand side or the network delineation by studying congestion pricing impact. For instance, some researchers proposed algorithms for designing an optimal charging area by considering different network equilibrium models [
14,
15,
16,
17], while some evaluated commuters’ willingness to pay by employing stated preference methods [
18,
19,
20,
21,
22]. Since public acceptability is playing an undeniable role in congestion pricing efficiency [
23], recent research has also focused on equity analysis to provide a more reliable picture of pricing policies [
24,
25,
26,
27,
28].
User’s responses to transport pricing are not clear and straightforward. Changes in travel behavior are derived from public reaction to pricing strategies. Price increase for daily travels may persuade people to change their travel patterns by altering their routes, shifting their modes, rescheduling their trips, choosing different destinations, increasing vehicle occupancy, or even canceling the trip. The existing studies, however, have not yet sufficiently answered the question about changing travel patterns as a continuous process, without which it is impossible to holistically evaluate impacts of pricing strategies on traffic performance, environment, and public health. Despite recent attention to the contribution and effectiveness of congestion pricing, there is little evidence in the literature on the impacts of pricing on changing the OD matrices for different modes. Therefore, a comprehensive, continuous, and precise analysis is necessary to simulate the outcome of the pricing policy in terms of demand variation, network performance, and traffic emissions.
This ex-ante study aims at analyzing how pricing strategies in New York City impact on transportation demand, network assignment, and traffic emissions by studying the public reaction to cordon pricing through changes in their activity patterns. We study cordon-pricing by implementing a dynamic feedback loop in an activity-based travel demand model of the New York metro area. Applying the activity-based model can address the growing complexity in travel patterns and enable a more credible analysis of responses to policies that are generally influential in transport planning and policy-making [
29]. Such models, which are more sensitive to scenarios, could potentially allow for a variety of activity patterns such as mode and destination choices simultaneously [
19]. Manhattan, as the second-largest CBD in the world and first in the U.S. based on the number of trip attractions and job opportunities [
30], is selected as the case study. The New York Best Practice Model (NYBPM) and the Post Processing Software for Air Quality (PPS-AQ) are employed to analyze the cordon pricing impacts on trip generation, origin–destination (OD) trip matrices, network performance measures, and vehicle emissions.
The rest of this paper is organized as follows.
Section 2 describes the study area, and
Section 3 presents the methodology, including cordon pricing scenarios, the structure of the activity-based model, and the air quality model.
Section 4 shows the results of each scenario and the impacts of cordon pricing on the trip generation and OD matrices for different modes.
Section 5 and
Section 6 present impacts on network and environment, respectively. The paper concludes with a summary of findings and outlines future research directions.
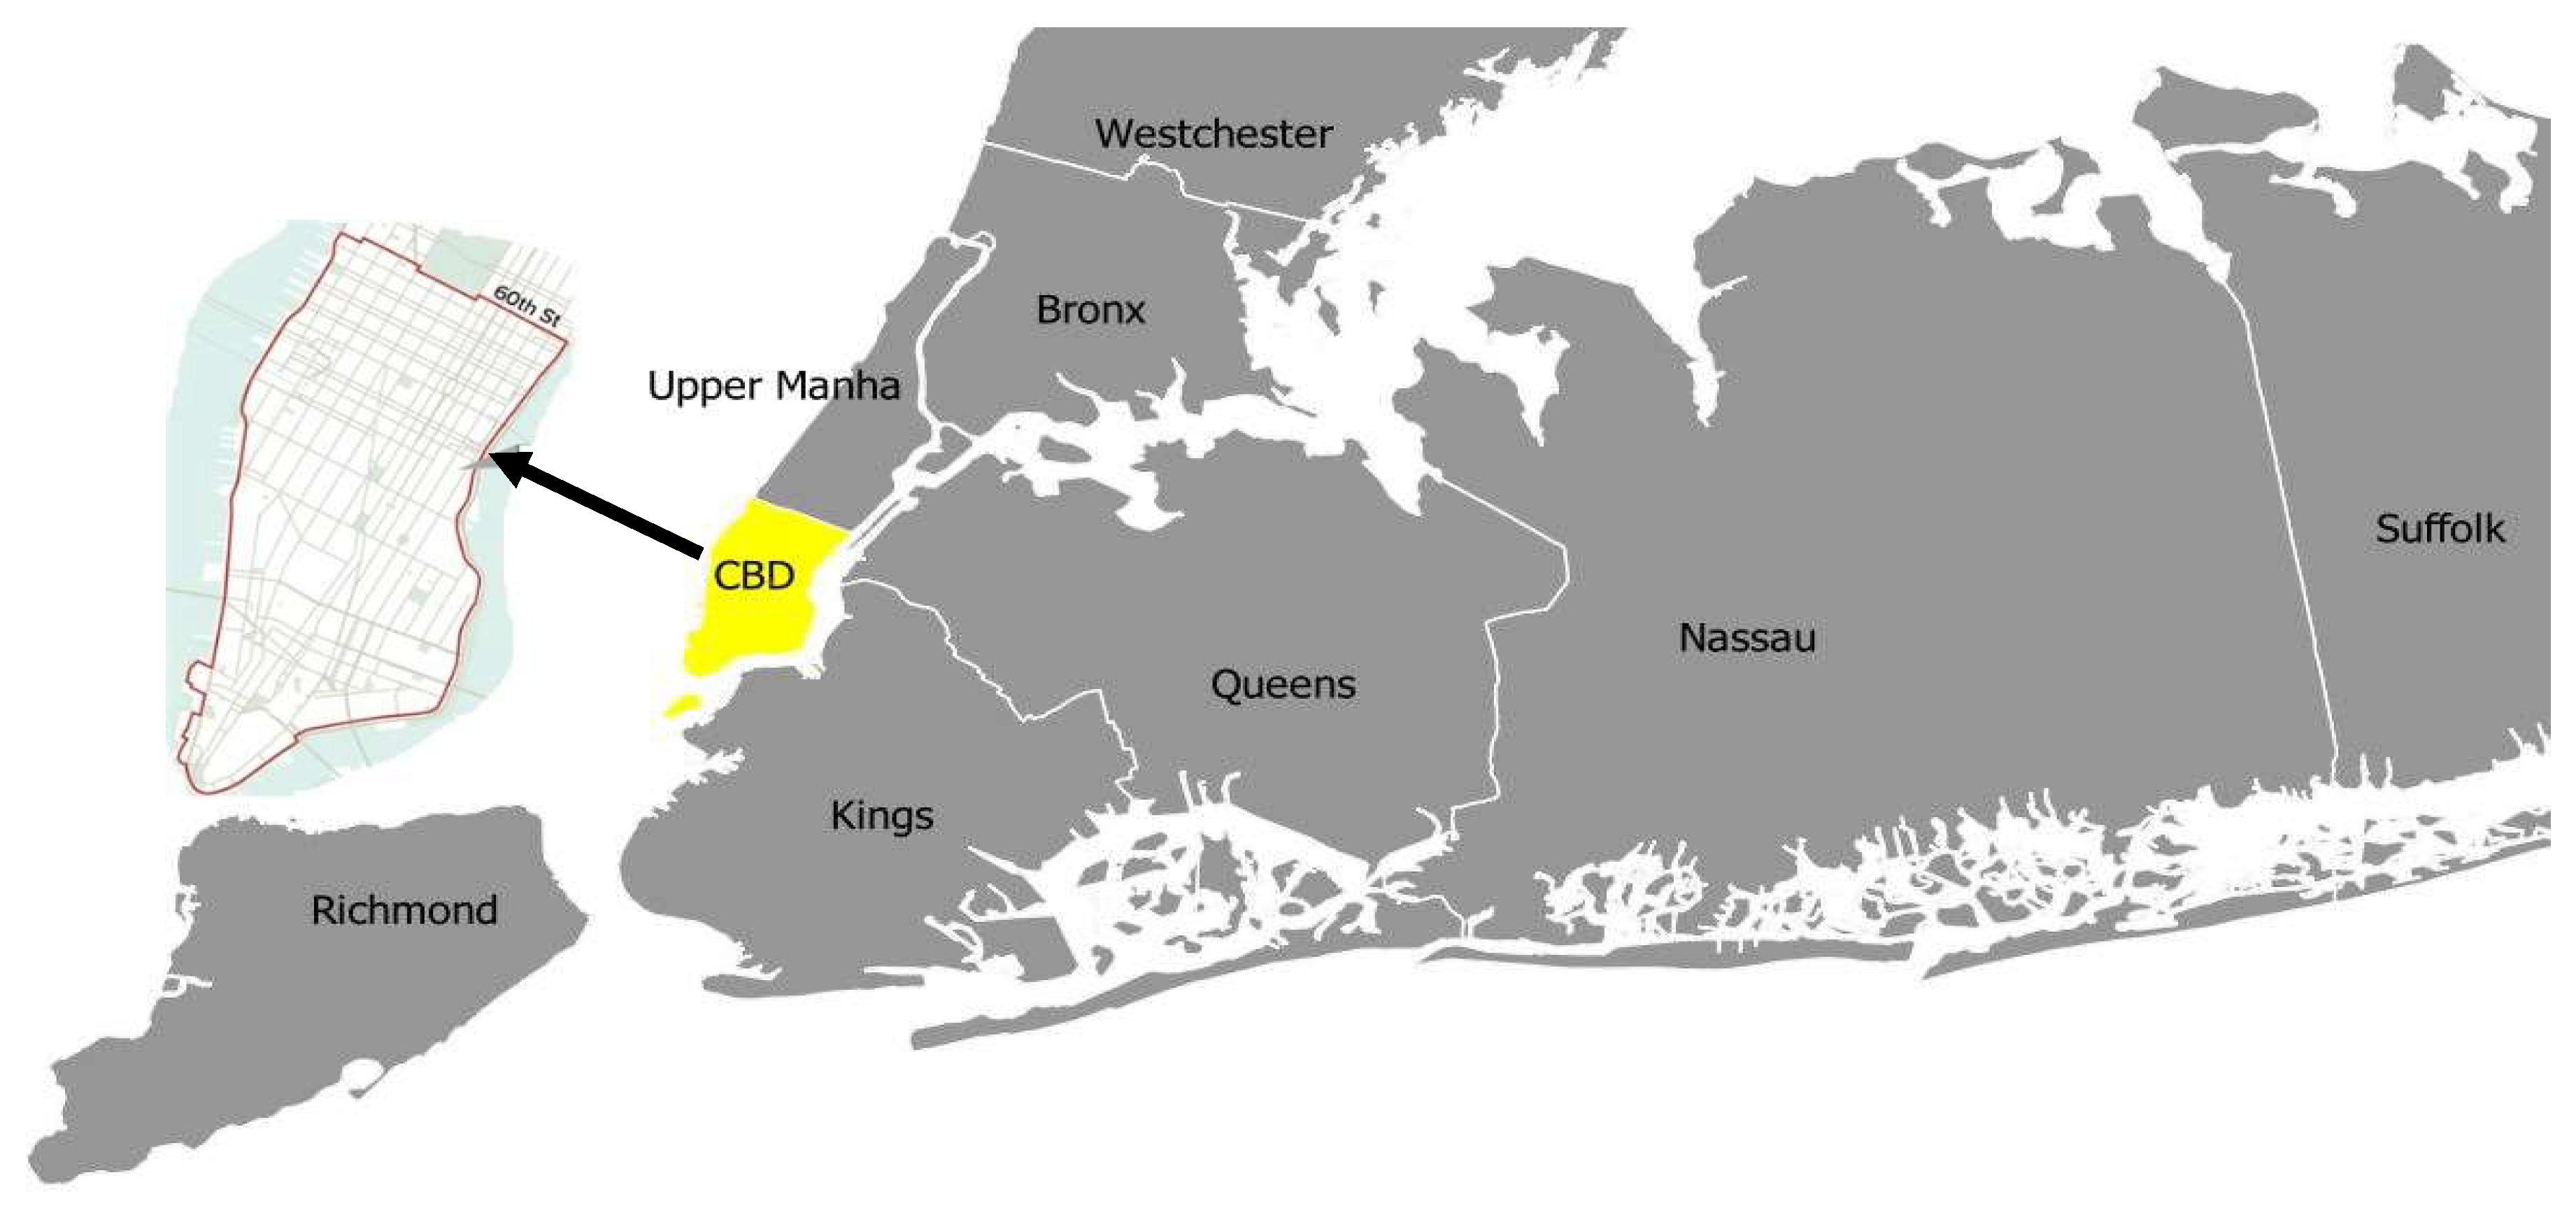
2. Study Area
New York County (Manhattan Island) is selected as a testbed to study the effects of cordon pricing on travel patterns. Manhattan’s daytime population (area of 22.96 square-mile) is approximately 3.94 million people and consists of approximately 41% daily commuters, 37% residents, 10% out-of-town visitors, 9% local day-trip visitors, and 3% hospital patients and students (those who are living in off-campus residences outside Manhattan) [
31]. Traffic congestion in New York City (all five boroughs: Manhattan, The Bronx, Queens, Brooklyn, and the Staten Island) has long been a defining feature, and ranks the city as the second worst in the United States and the third-worst worldwide [
2].
The share of public transportation ridership in New York City is much higher than any other region in the United States. Other factors like the region’s unique topography, multiple transportation hubs, hosting large events, tourist attraction and recreational landmarks, wide-spread use of for-hire vehicles, and large quantities of goods movement, makes this city unique in several aspects, and therefore the complexity of its transportation system is not an exception. Overcrowded facilities, undesirable travel times, excessive fuel consumption, and air pollution are among many other undesirable experiences faced by its residents [
32]. On the supply side, road capacities are also reduced by the introduction of dedicated bike lanes, bus lanes, and pedestrian plazas, which are forcing decision-makers to constantly search for countermeasure solutions.
In recent years, a few congestion pricing plans have been proposed by different administrations, all of which selected the Manhattan central business district (CBD) as a target area for charging vehicles [
2]. The initial plan dates back to April 2007, when Michael Bloomberg introduced congestion pricing in New York City as a part of his comprehensive sustainability plan [
33]. According to the proposed plan, drivers traveling in the Manhattan core area (including the Midtown and lower Manhattan central business districts) on weekdays between 6 a.m. and 6 p.m. would pay
$8 daily fees. The analysis indicated the reduction in vehicle miles traveled and travel time in the Manhattan core by 6.8% and 30%, respectively [
34]. The proposal was supported by the public by 67% to 27% margin, provided that the revenues were to be allocated to transit improvements [
35]. Despite gaining widespread public support, political issues ultimately blocked those proposals [
33]. The concerns were mostly inaccessibility to the efficient transit system to the CBD, and also unfairness of the toll offsets. Comparing the pricing system in London and New York, Peters and Gordon pointed out that local conditions and the approval process should not be neglected in designing a pricing policy [
36]. Currently, the road pricing in New York City is applied only on toll facilities for crossing bridges and tunnels. The Metropolitan Transportation Authority and Port Authority are charging vehicles from
$2 to
$147 over nine bridges and tunnels based on the vehicle types, time of day, and method of payment.
Therefore, in this study, we focus on analyzing traffic and emission impacts of New York cordon pricing strategies, consistent with the set of actions planned for NYC and the availability of data. Conducting a more precise analysis was limited at the time of this study due to data availability.
3. Materials and Methods
In this section, the pricing scenarios, the activity-based model, and the air quality model are presented. It is followed by explanations on how these analyzing tools are utilized to quantify the impacts on the Manhattan CBD.
3.1. Pricing Scenarios
We implement pricing scenarios by allocating monetary charges to all the links intersecting the cordon using the NYBPM, discussed in the next section.
Figure 1 presents the study area and the cordon line, which is in line with the majority of the previous proposals [
2,
33,
37]. This section of Manhattan, known as the central business district, is connected to other areas only via tunnels and bridges, except in the north section, along 60th Street. The current paper evaluates four pricing scenarios for the two types of vehicles—passenger car and truck—in 2020 as the base year.
The suggested pricing scenarios are presented in
Table 1. Vehicles that cross the cordon line between 6:00 to 20:00 will be charged by vehicle types. Although the suggested toll values are also applied to trucks crossing the region, this paper focuses on passenger car usage and transit ridership, since it considers changes in the travel behavior of passengers only. It should be noted that the suggested toll values in this paper are set based on the previous congestion pricing proposals for New York City [
2].
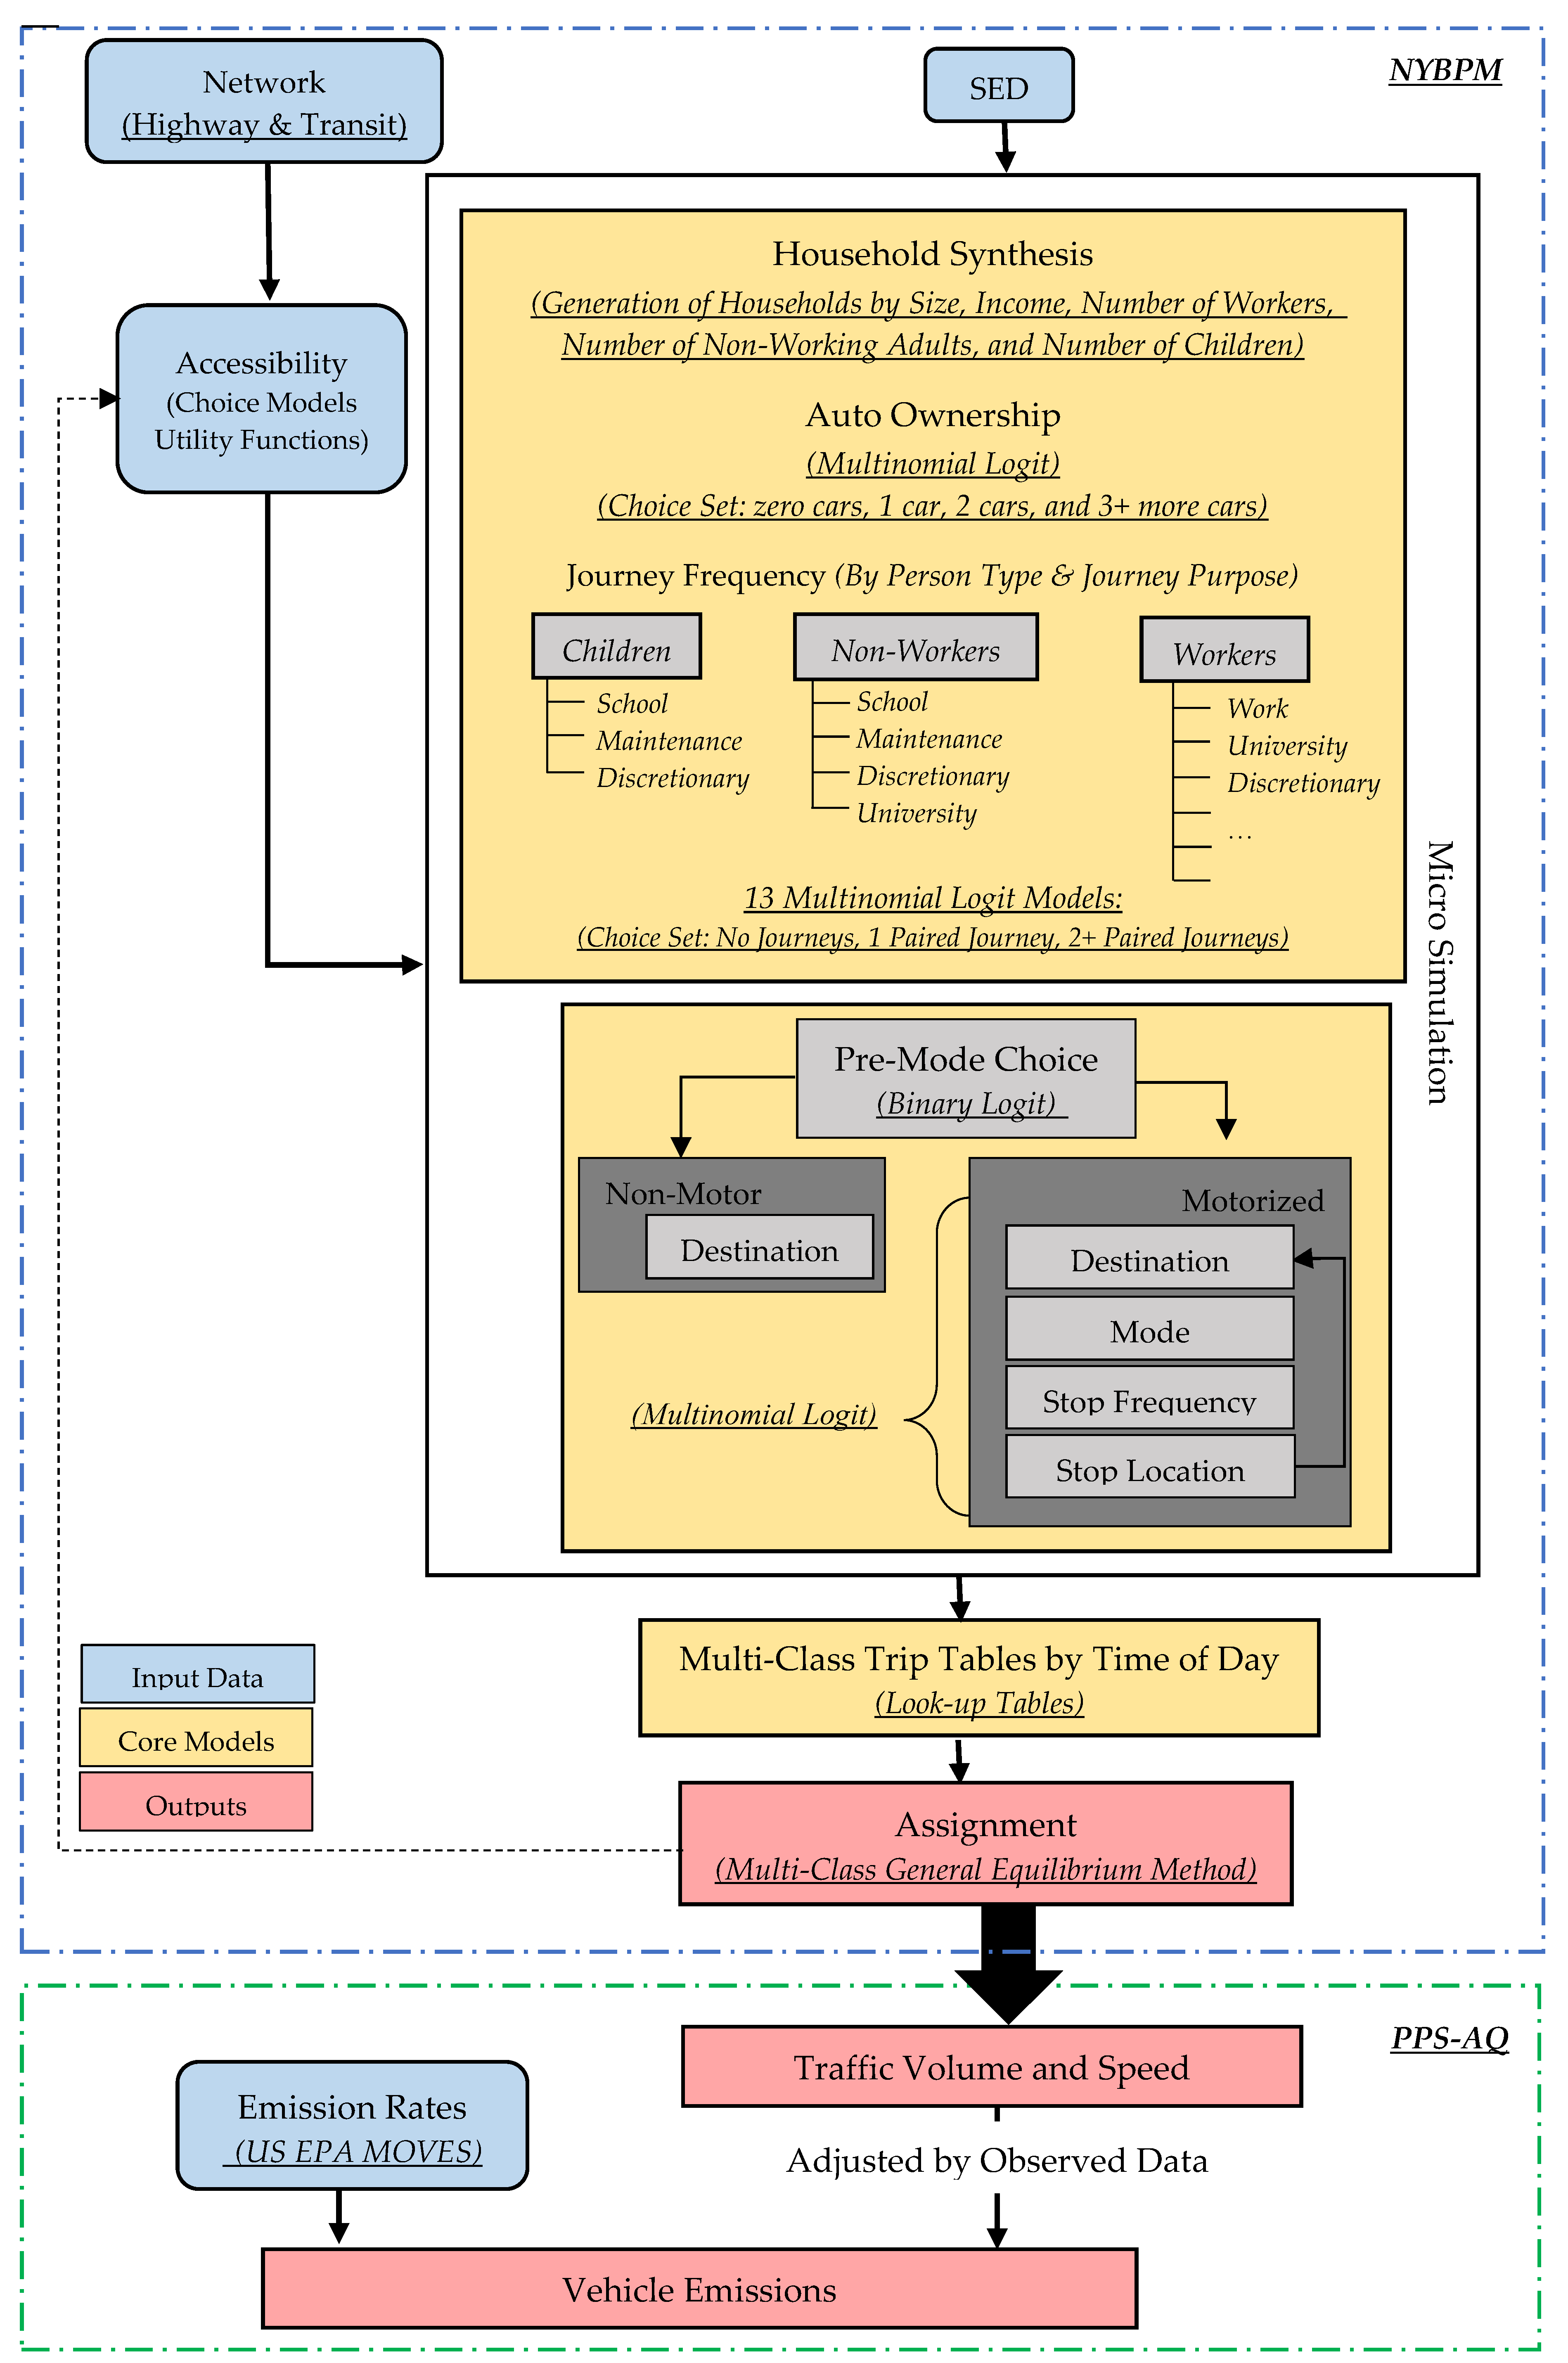
3.2. The New York Best Practice Model (NYBPM)
In recent decades, transportation planning has experienced a shift from classical four-step models to activity-based models. The essence of the activity-based model is that people travel to participate in activities [
38]. It is argued that these models can provide better estimations of travel behavior response to new policies such as parking restrictions and congestion pricing [
17,
29]. In this paper, we use the NYBPM, which is an activity-based travel demand forecasting model on the TransCAD version 6.0 platform [
39], to evaluate a range of planning and policy alternatives.
The NYBPM covers 28 counties in three states of New York, New Jersey, and Connecticut (an aggregate population of approximately 22 million). The model estimates origin–destination matrices for 4629 travel analysis zones (TAZs) by employing socioeconomic and demographic forecasts compiled based on 2010 Census data, traffic volumes at screen-line locations, and transit ridership values [
32]. The overall structure of the NYBPM and its components are simplified and shown in
Figure 2.
Socio-Economic and Demographic (SED) data and transportation networks (highway and transit) are the main inputs of NYBPM. The NYBPM takes into account the travel pattern at a disaggregated level by using the micro-simulation method, which consists of household synthesis, auto ownership, journey frequency, mode/destination choice, and stops frequency and locations. The household synthesis model creates the list of households by size, income, number of workers, number of non-working adults, and number of children for each traffic analysis zone. The auto ownership model estimates the probabilities of having a certain number of cars in a household as a function of the household size, income, and the residential urban environment by employing the multinomial logit model. The multinomial logit model is a discrete choice model, which assumes a Gumbel distribution for error terms of the utility function [
40]. In this model, the probability of selecting alternative
i by individual
q is presented by:
where
is the observed term of the utility function of alternative
i for individual
q, and
A(
q) is the choice set for an individual.
The journey frequency model generates activity participation numbers for different categories (work, university, school, maintenance, discretionary, and at work), and different groups of people (workers, non-workers, and children), resulting in a total of 13 groups by eliminating the unreasonable combinations. For example, children don’t attend work activity, or they are too young to go to college. It then develops a multinomial logit model for each group. Individuals’ activity participation behaviors depend on the decisions made by the other members of the households. In fact, the addition of variables like income and automobile ownership, or the presence of children in the household is necessary. The model poses some logical constraints in the generation of the activities. As an example, it makes sure that a child is always in the company of at least one adult.
The mode destination stop choice model starts with a binary choice model, dividing journeys into two groups of motorized and motorized. Binary logit model contains only two choice alternatives and choice probability, and is calculated by Equation (2) [
41]:
The process of choosing a destination, mode, and stops are also based on different multinomial logit models. Another assumption here is that nonmotorized model adjustments are based on origins only, rather than based on both origin and destination, since it occurs before the destination choice. Then, journeys are broken into trip tables by time-of-day periods to prepare the specific OD matrices for highway and transit assignments. The assignment step employs the multi-class general equilibrium procedure [
39].
In the original format, the total cost of traveling for each origin–destination pair, as one of the primary independent variables in the process of mode and destination choice, is calculated by using different parameters such as vehicle operating costs $0.22/mile and value of time that ranges from $0.29/min per minute for nighttime travels to $0.35/min for trips during midday time. The costs of traveling for transit and taxi trip also include the fare term, and the applicable toll values.
For the NYBPM 2010 Update, tolls are considered as one of the link attributes, coded in the highway networks database. To model the pricing schemes in NYBPM travel demand model, we add the charging fees to the boundary links of the cordon area. Therefore, the generalized cost for each origin–destination trip crossing the pricing zones is increased.
3.3. Air Quality Model (PPS-AQ)
Air quality analysis aims to measure the amount of pollutants in the air using emission factors, which define the relationship between the amount of emissions and the amount of activity of vehicles. Total emission inventory from vehicles consists of two parts: The amount of activity and emission intensity. While the amount of activity can be estimated by travel demand models, emission intensity is predicted by emission simulator models. Emission models have been developed by collecting vehicle emission data through real-world sampling or from laboratory experiments, and they relate to driving conditions such as vehicle power, travel speed, and acceleration/deceleration mode. These emission models then simulate driving conditions of an input scenario and match its condition with a desired condition from its library to estimate the emission rates in gram per mile. Multiplying emission rates by vehicle activity, the model then estimates total emission.
The Post Processing Software for Air Quality (PPS-AQ), developed by Cornell University [
42], is used to estimate the emission inventories after cordon pricing is applied. The lower section of
Figure 2 presents the air quality estimation process. Link volume and speed from NYBPM and emission rates from the US Environmental Protection Agency (US EPA) and Motor Vehicle Emission Simulator (MOVES) are integrated to estimate emission inventory. MOVES is a microscopic emission model that generates emission rate information for regional conformity analysis based on an extensive database obtained from millions of vehicle laboratory test runs, inspection/maintenance, on-board measurement, and remote sensing data from millions of vehicles. MOVES works based on a “discrete binning” approach to predict emissions for a variety of driving patterns. MOVES uses the combination of speed distribution and Vehicle Specific Power (VSP) to select specific drive cycles, and then determines the operating mode. Using the operating mode, MOVES then assigns the emission rates in grams per mile format to each driving mode. MOVES covers national, regional, and project level scale analysis, and for different vehicle emission processes: Running emissions, start emissions, evaporative emissions, extended idle emissions, crankcase emissions, tirewear, and brakewear. MOVES can report emission results by different attributes including vehicle type, fuel type, speed range, vehicle ages, emission processes, county, and year-month-day-hour.
In our modeling framework, model outputs from NYBPM are reconciled by observed volume data, and emission rates from MOVES are tailored by local data, including road type distribution, source type population, inspection-maintenance program, fleet age distribution, average speed distribution, fuel characteristics, and meteorology data. The final product is the aggregated emissions on all roadway segments of the network, which is the estimation of county emission inventory.
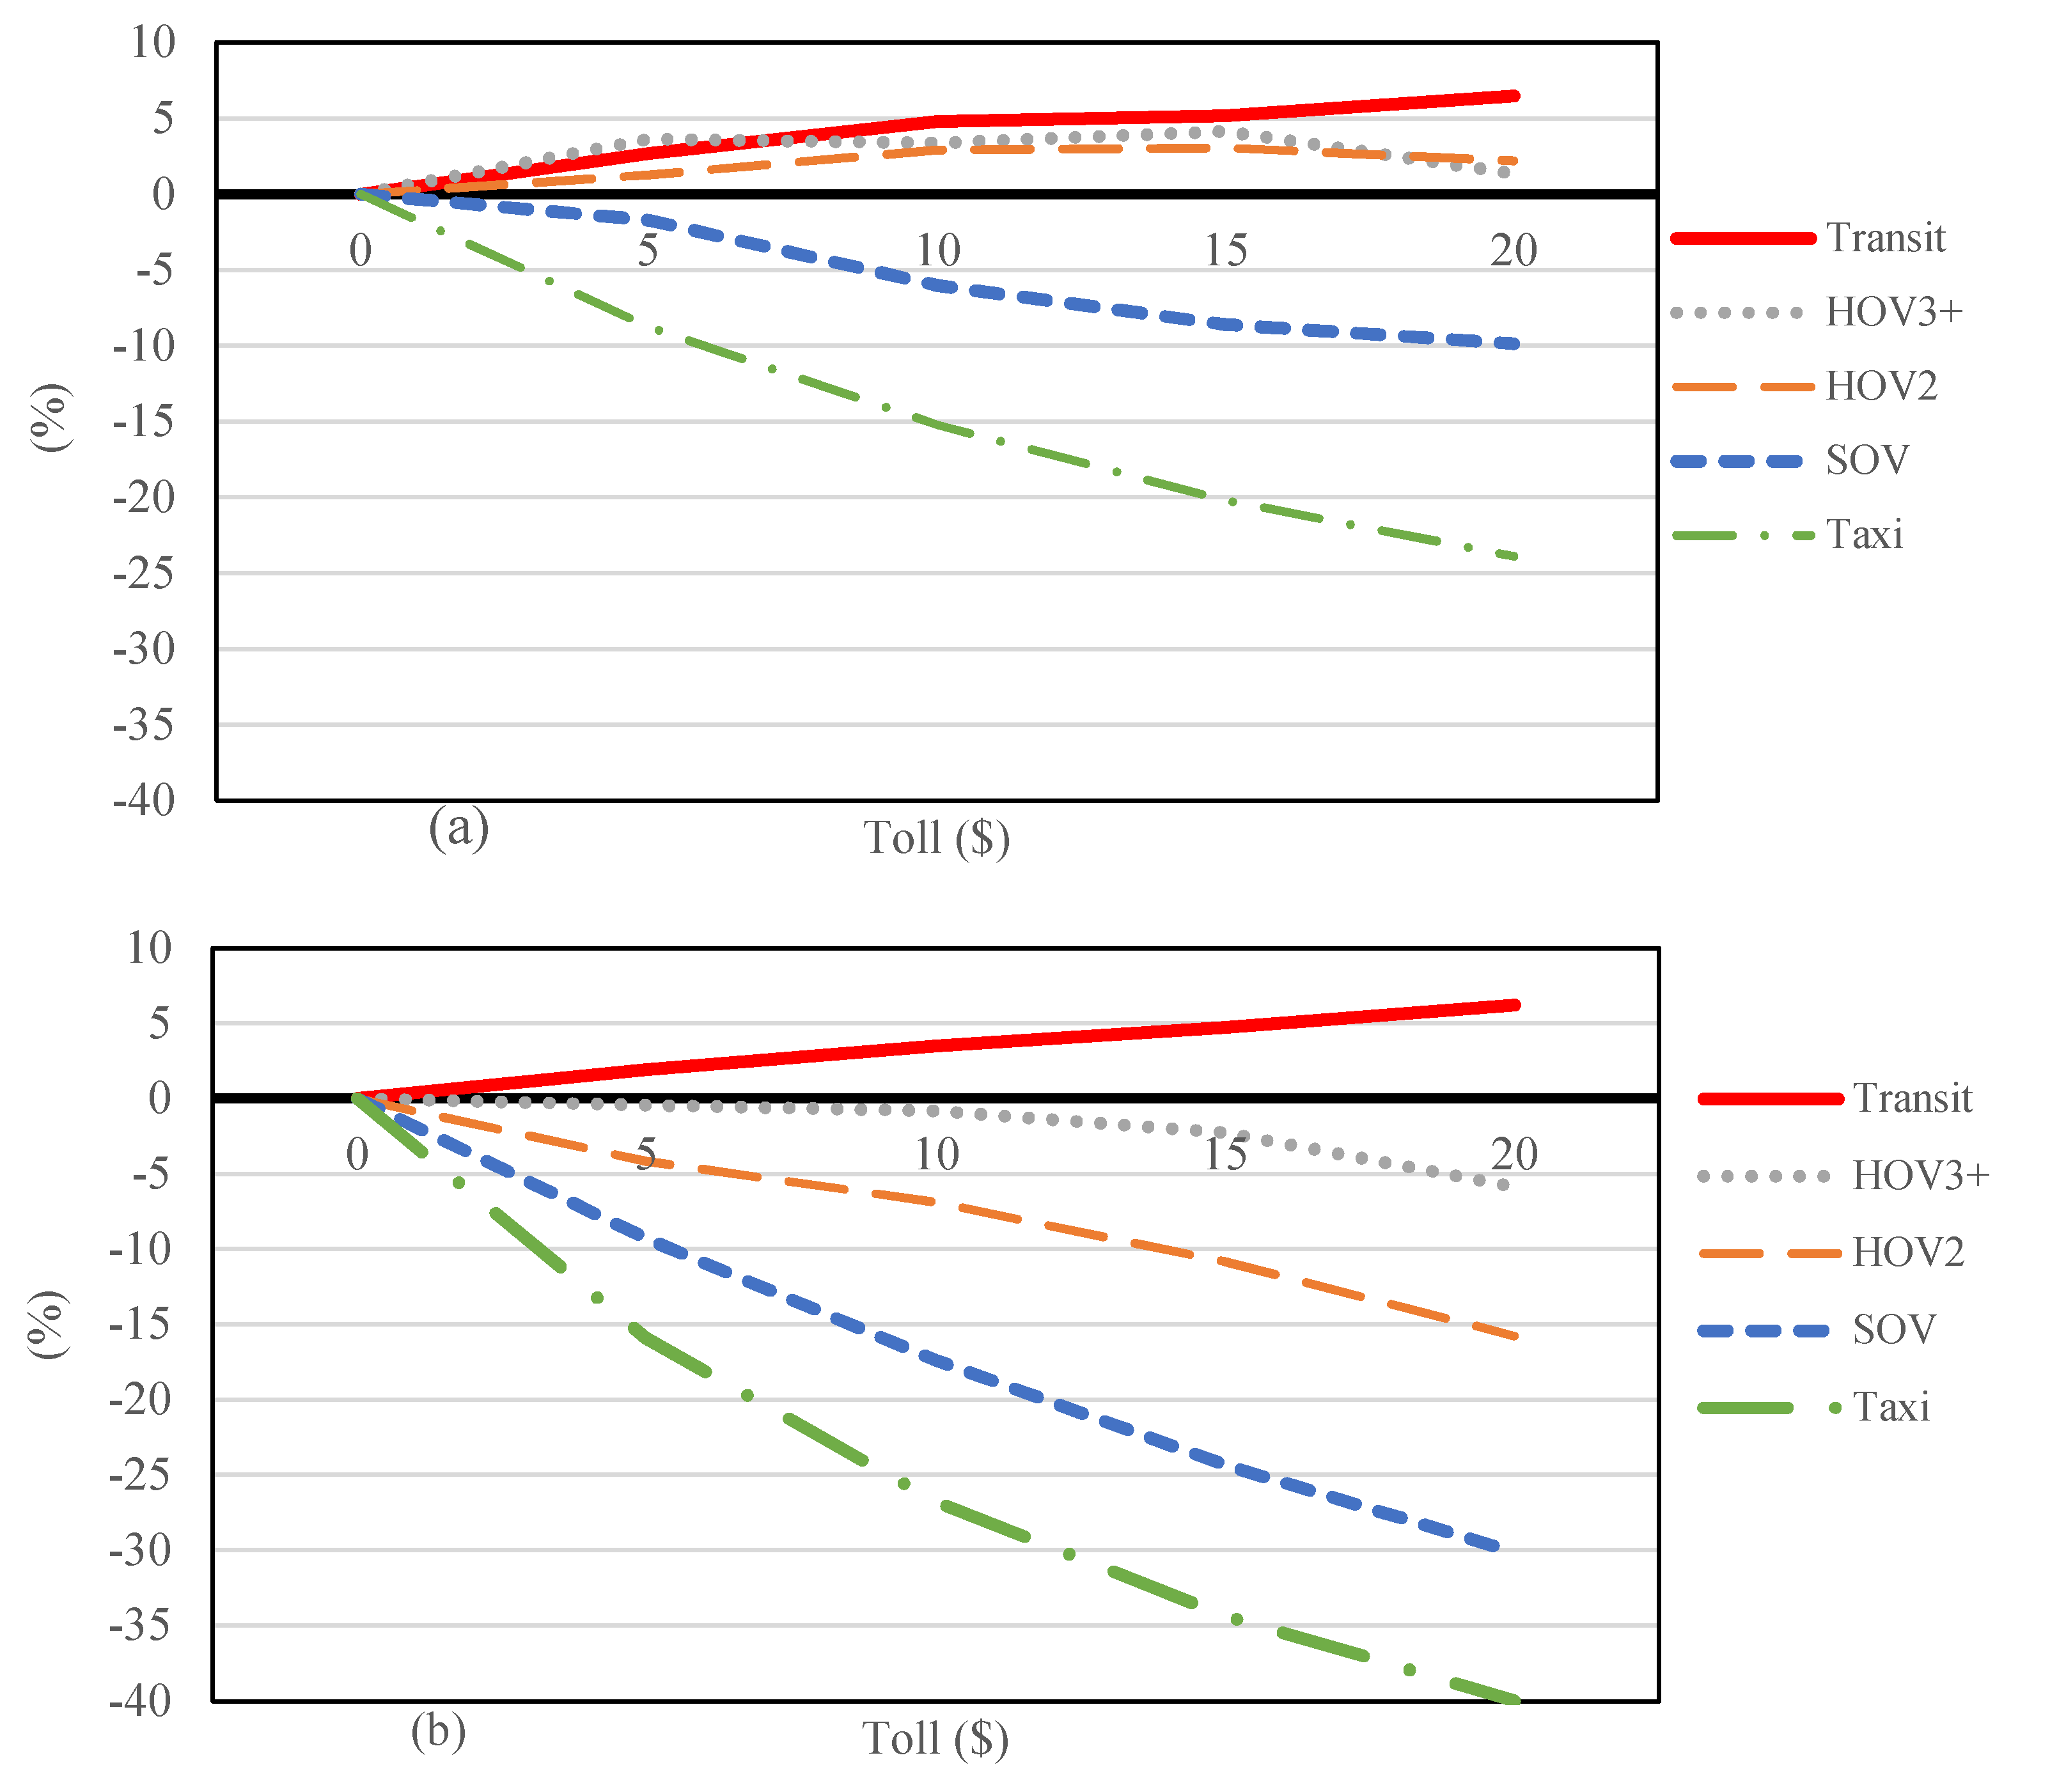
5. Pricing Impact Analysis in the Network Level
In addition to the influence on demand, cordon pricing impacts can be studied through network assignments to quantify the variant responses such as mode/destination change, rerouting, and rescheduling that can emerge in network volumes.
Figure 7 indicates percentage changes in Manhattan network measures including Vehicle-Hours of Delay (VHD), Vehicle-Miles Traveled (VMT), Lane-Mile Congested (LMC), and Average Travel Speed (ATS) for restricted and unrestricted access. Restricted access includes freeways and expressways, while unrestricted access considers urban arterials, collectors, and local streets. The delay on each link is computed by taking the difference of the average travel time output by the model and the free flow time of that link. Based on the results, the network performance can be highly affected by pricing scenarios. As indicated in
Figure 7, VHD and LMC dramatically decrease by 33% at the highest toll value (
$20). Moreover, VMT reduction ranges from 5% to 14% in different scenarios, impacting fuel consumption and vehicle emissions. On the other hand, speed increase would be more significant at restricted access roads than unrestricted ones. In other words, cordon pricing might not be effective on the speed of the urban arterials and local streets since the average speed in the base scenario is less than 10 miles/hour.
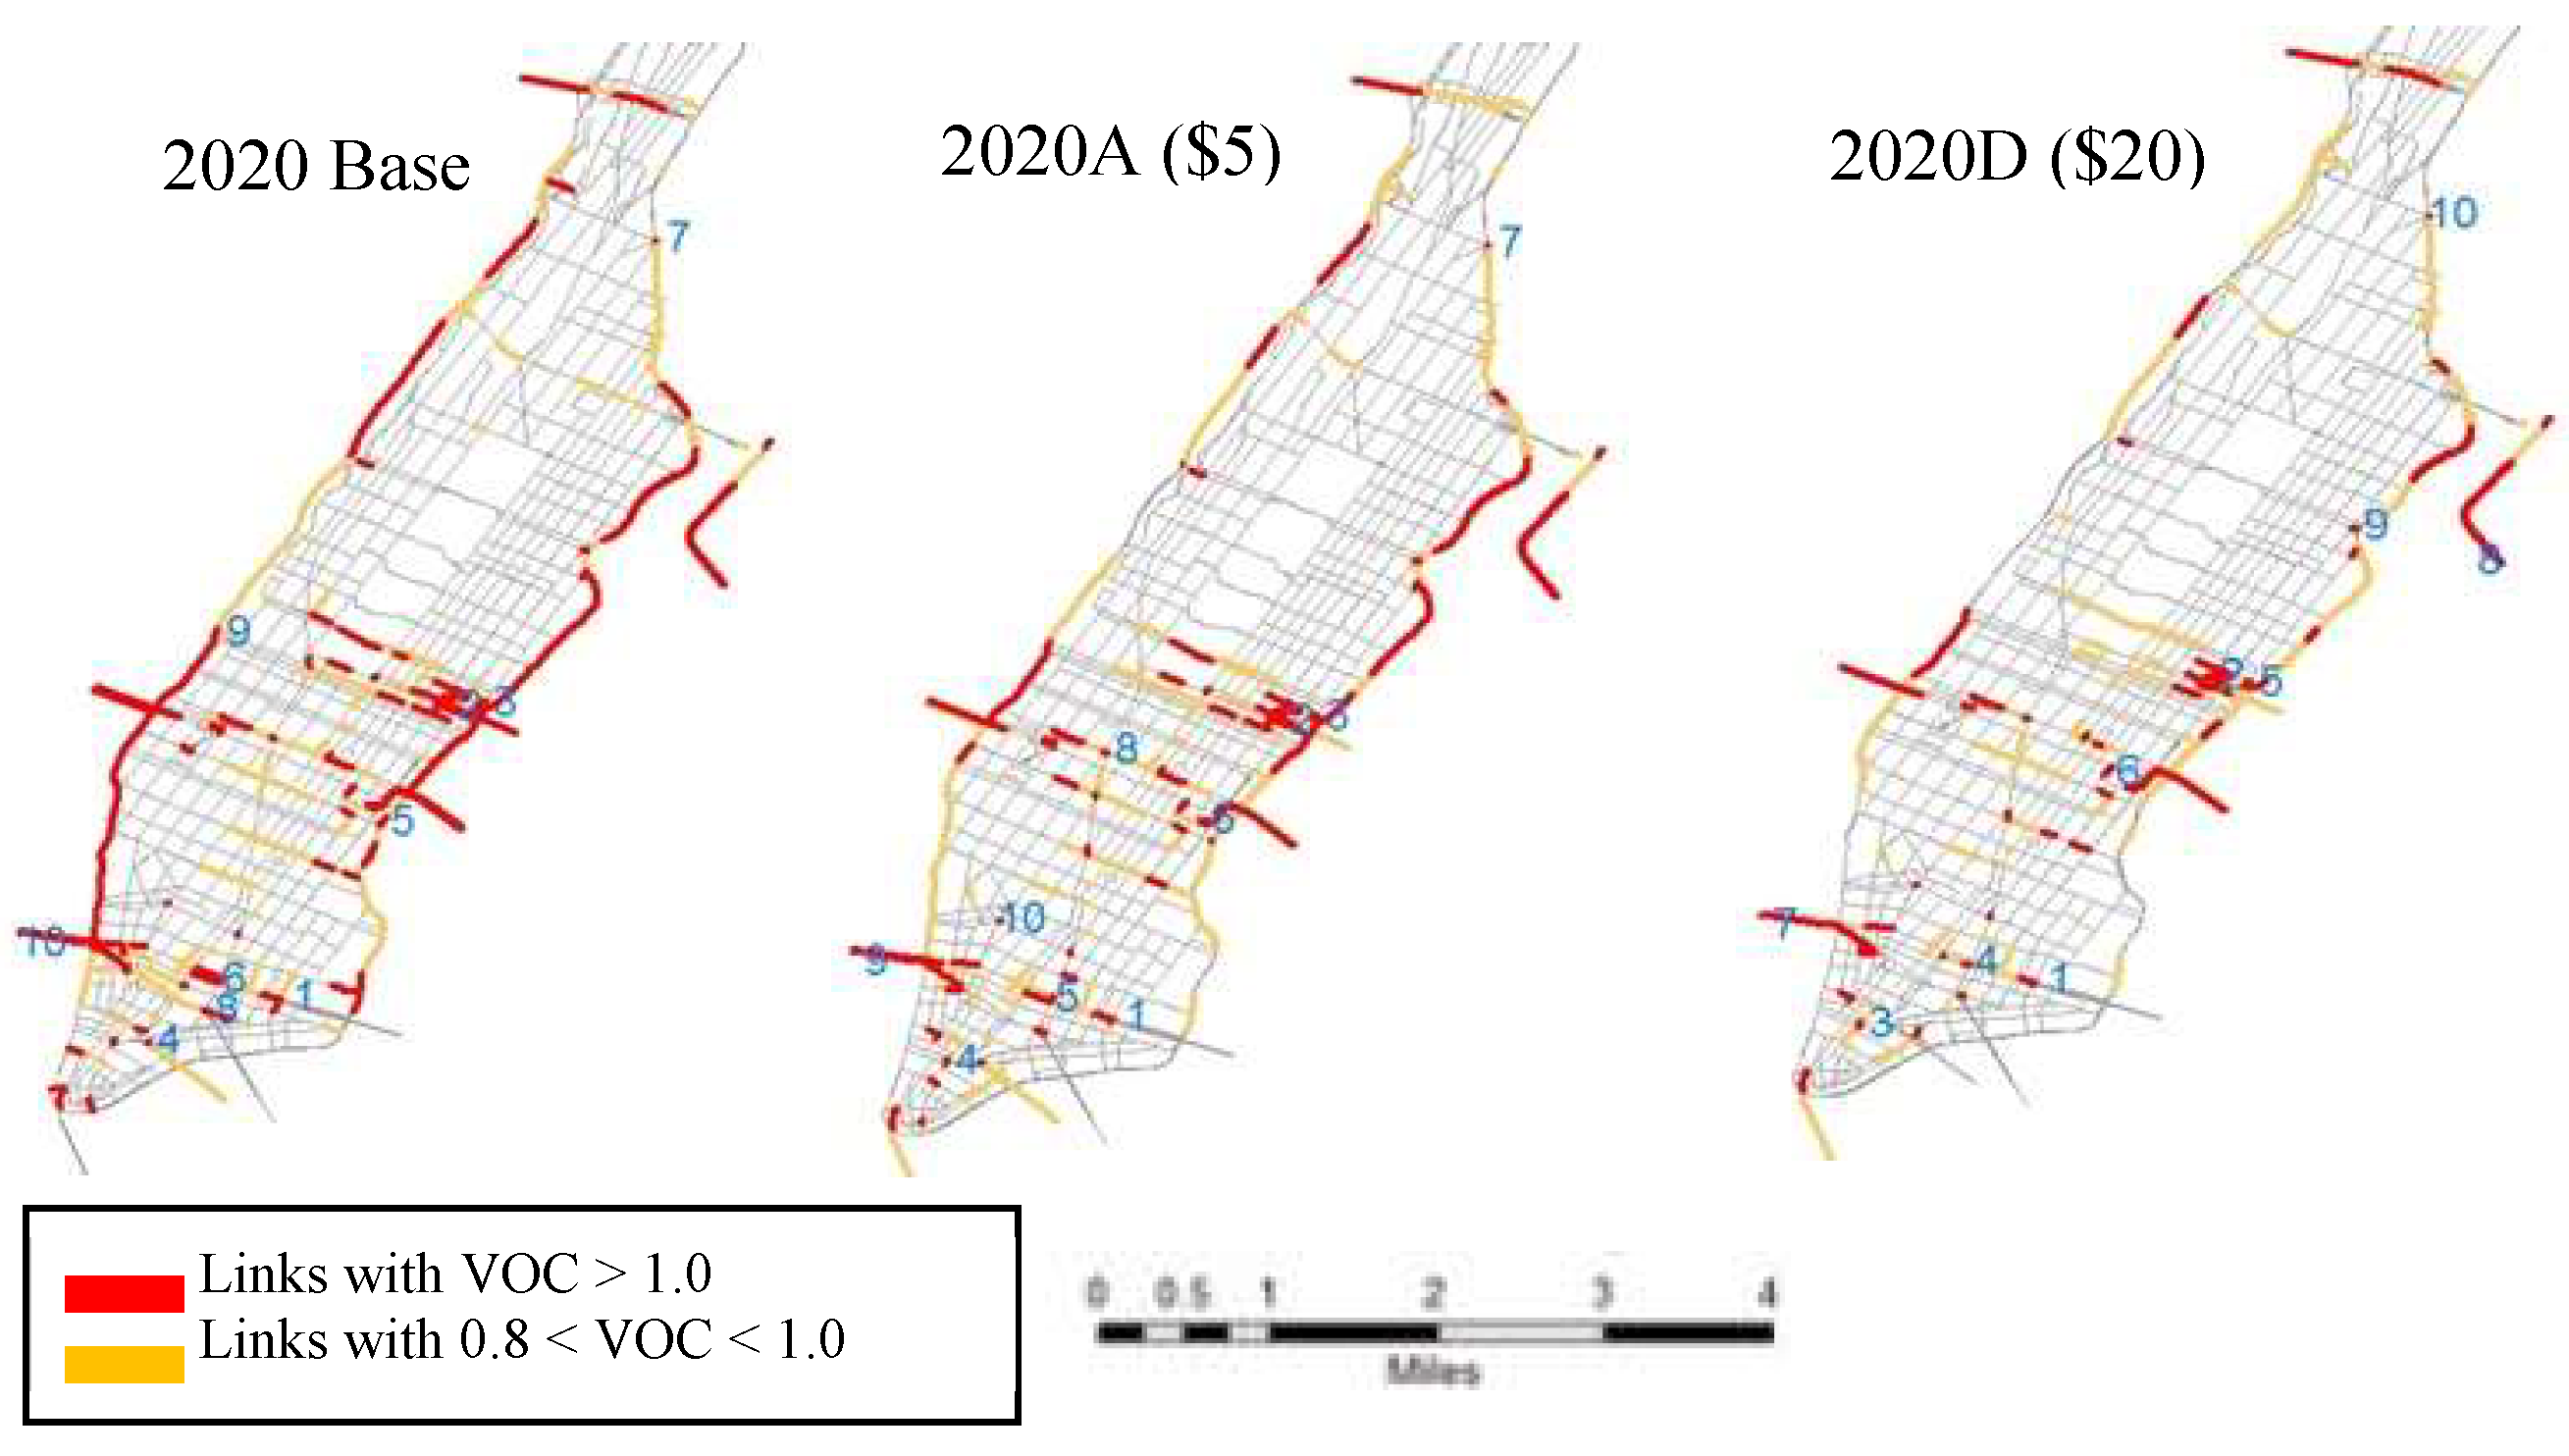
To better understand traffic conditions in response to cordon pricing,
Figure 8 shows the Manhattan network in the morning peak period (AM) for three scenarios of 2020 base, 2020A (
$5), and 2020D (
$20). Considering the proportion of red and yellow links, which indicate congested and critical traffic volume, we can conclude that proposed pricing scenarios can improve traffic conditions in the boundary of the cordon area, while it seems further policies are still required to relieve traffic congestion in the interior links.
7. Discussion and Conclusions
Road pricing is considered as one of the demand management strategies with the most potential for relieving traffic congestion, improving system performance, and mitigating environmental externalities. This paper studies how pricing scenarios in New York City can impact transportation demand, network performance, and traffic emissions. This is important, since NYC would be the first American metropolitan area to implement the cordon pricing strategy. Among the variety of pricing approaches, we considered cordon pricing. This scheme adds cost to the boundary link of the cordon area. The core of the analysis is based on analyzing changes in the chain of daily activities of individuals in response to increases in the charging fees, and we used an activity-based model developed for NYC area, NYBPM.
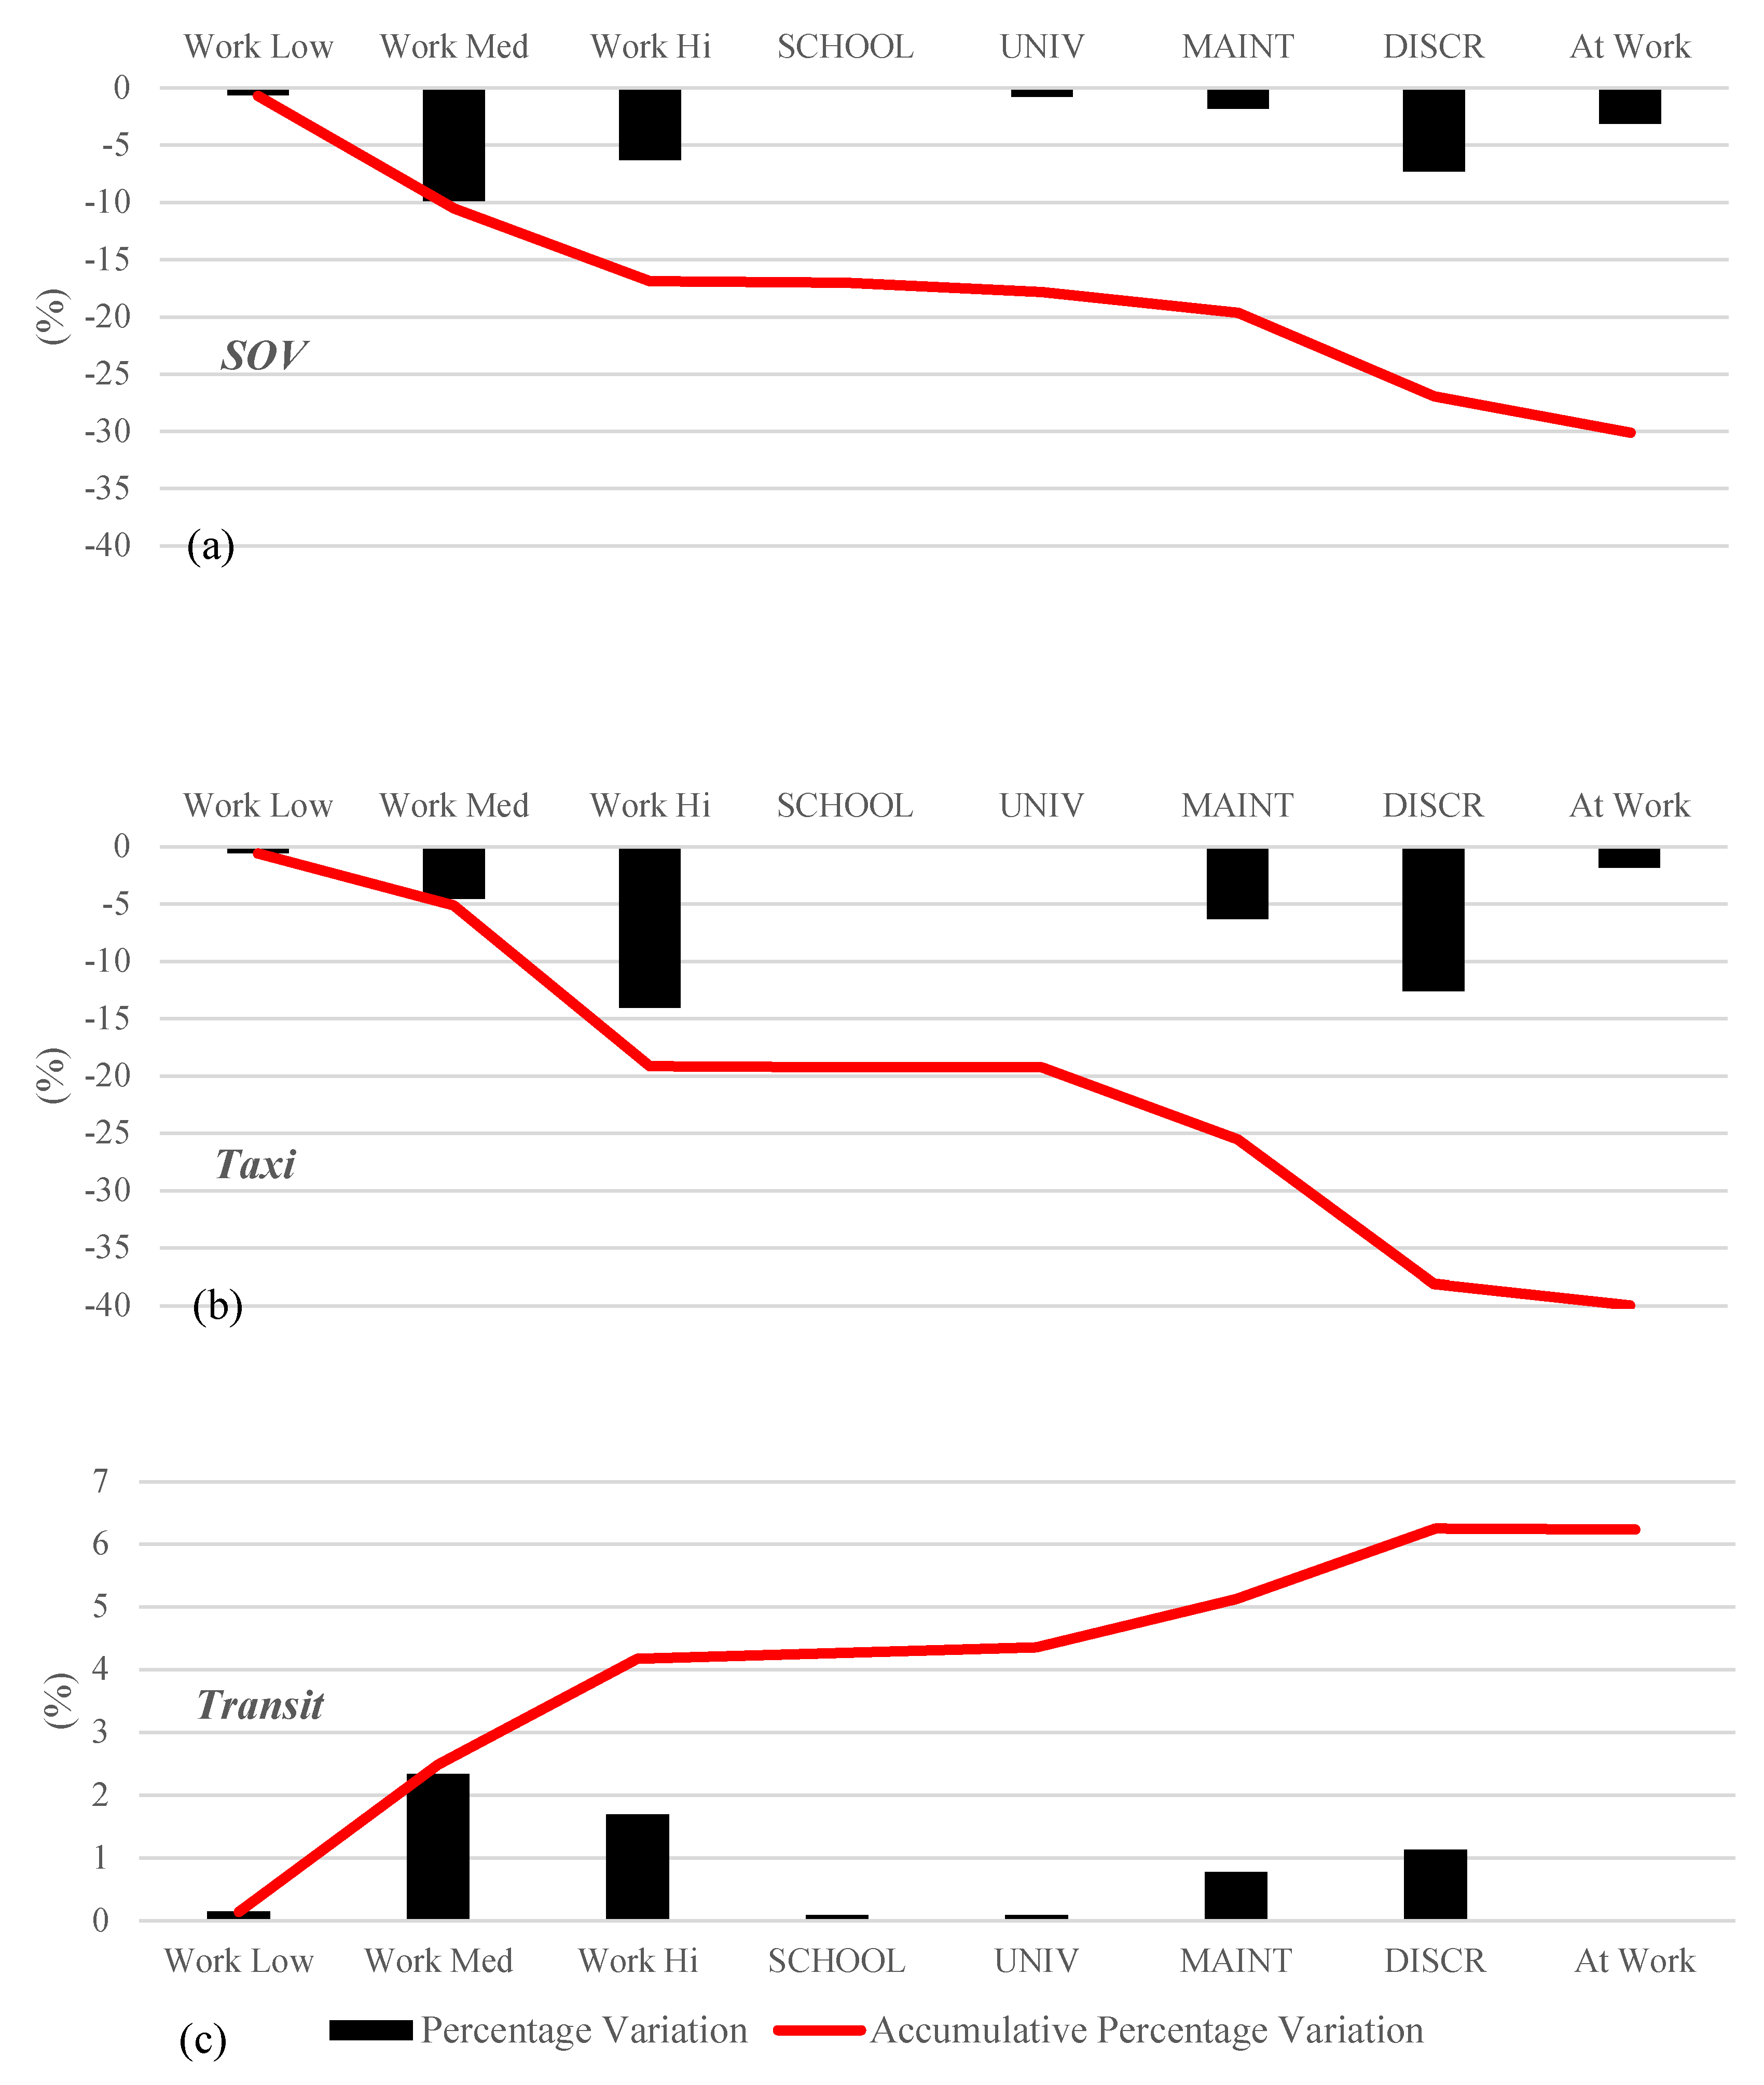
Analyzing the effect of pricing on CBD trip generation showed that trip attraction was more sensitive than trip production. Based on the results, the share of single-occupancy vehicles and taxis in both directions, entering and exiting the cordon area will be reduced under the pricing schemes. The reduction in SOV trips is mainly due to mode shifting, change in destination and departure time, or even trip cancellation. Vehicles with more than two occupants followed a slighter downward trend, probably because first users prefer to share their mode and cost, but they began to react differently at the most restricted scenario ($20). Further analysis demonstrated that trips for the purpose of work (for medium and high-income workers), discretionary, and maintenance were more sensitive to the change in travel cost compared to the other trip purposes.
Travel pattern changes that emerged in the network under the pricing schemes indicated that CBD cordon pricing can improve traffic conditions by reducing delay (depending on the pricing scenario, the reduction is in the rage of 15% to 32%), and VMT (5% to 14%) for the study area. According to the outputs of the traffic assignment step, congested lane miles reduction mainly occurred in border links rather than interior links. Therefore, more travel demand management strategies like parking management can help relieve traffic congestion inside the CBD areas.
Some improvements in the traffic emissions was also expected; however, drawing such a conclusion was not very straightforward due to the complex interactions between the elements of transportation systems and air quality in urban areas. The overall result of the environmental analysis indicates that cordon pricing can improve traffic emissions and consequently public health conditions. Our study reveals a non-linear relation between emission reduction and pricing schemes in a very dense and congested CBD area. The finding highlights the importance of transportation policies that are effective in reducing transportation emission inventory since most GHGs can remain in the atmosphere for a long period [
43], and exposure to PM2.5 directly relates to health impact and can cause negative health conditions like lung cancer and ischemic heart disease. Therefore, our proposed modeling framework enables policymakers to thoroughly evaluate how pricing policies not only affect traffic measures, but also reduce the negative health impacts of vehicle emissions resulting from traffic congestion.
This research was faced with some limitations, mainly due to the nature of the data and the models used for the analysis. For instance, trip purposes could be classified in more detail, however, the defined purposes in the existing NYBPM are not changeable by users. In order to change the trip purpose, the model needs to be fully recalibrated, which will cost money and time. There are several possibilities for expanding upon the methodology and results. Although the NYBPM predicts the travel demand at a disaggregate level, the traffic assignment step uses the aggregate OD matrices for calculating traffic volumes. Hence, it‘s not possible to track the network changes by each individual. Using other data sets or travel demand forecasting models, which can predict all trip making decisions and traffic assignment in a disaggregate level, can improve the outcome accuracy.
Another extension is related to the economic analysis by calculating the revenue of the cordon pricing policy. Using the number and type of vehicles crossing the border and the number of times they pass daily could be used to estimate the revenue of the policy. Conducting a cost-benefit analysis would provide a more accurate data for decision makers in order to assign the revenues to transportation system infrastructures. Furthermore, studying the equity aspect of cordon pricing by considering income levels, environmental justice, and public transportation accessibility can be added to the current outcomes. Using stated preference and revealed preference surveys, followed by developing logit models, is a possibility for expanding upon the methodology discussed in this research.


