Article

Spatiotemporal Analysis of Land Cover Changes in the Chemoga Basin, Ethiopia, Using Landsat and Google Earth Images


1
Department of Forest Sciences, Seoul National University, Seoul 08826, Korea
2
Department of Forest Resources, Daegu University, Kyeongsan 38453, Korea
3
Department of Forest Sciences, Research Institute of Agriculture & Life Sciences, Seoul National University, Seoul 08826, Korea
*
Author to whom correspondence should be addressed.
Sustainability 2020, 12(9), 3607; https://doi.org/10.3390/su12093607
Submission received: 3 April 2020 / Revised: 26 April 2020 / Accepted: 27 April 2020 / Published: 29 April 2020
(This article belongs to the Section Sustainable Urban and Rural Development)

Abstract

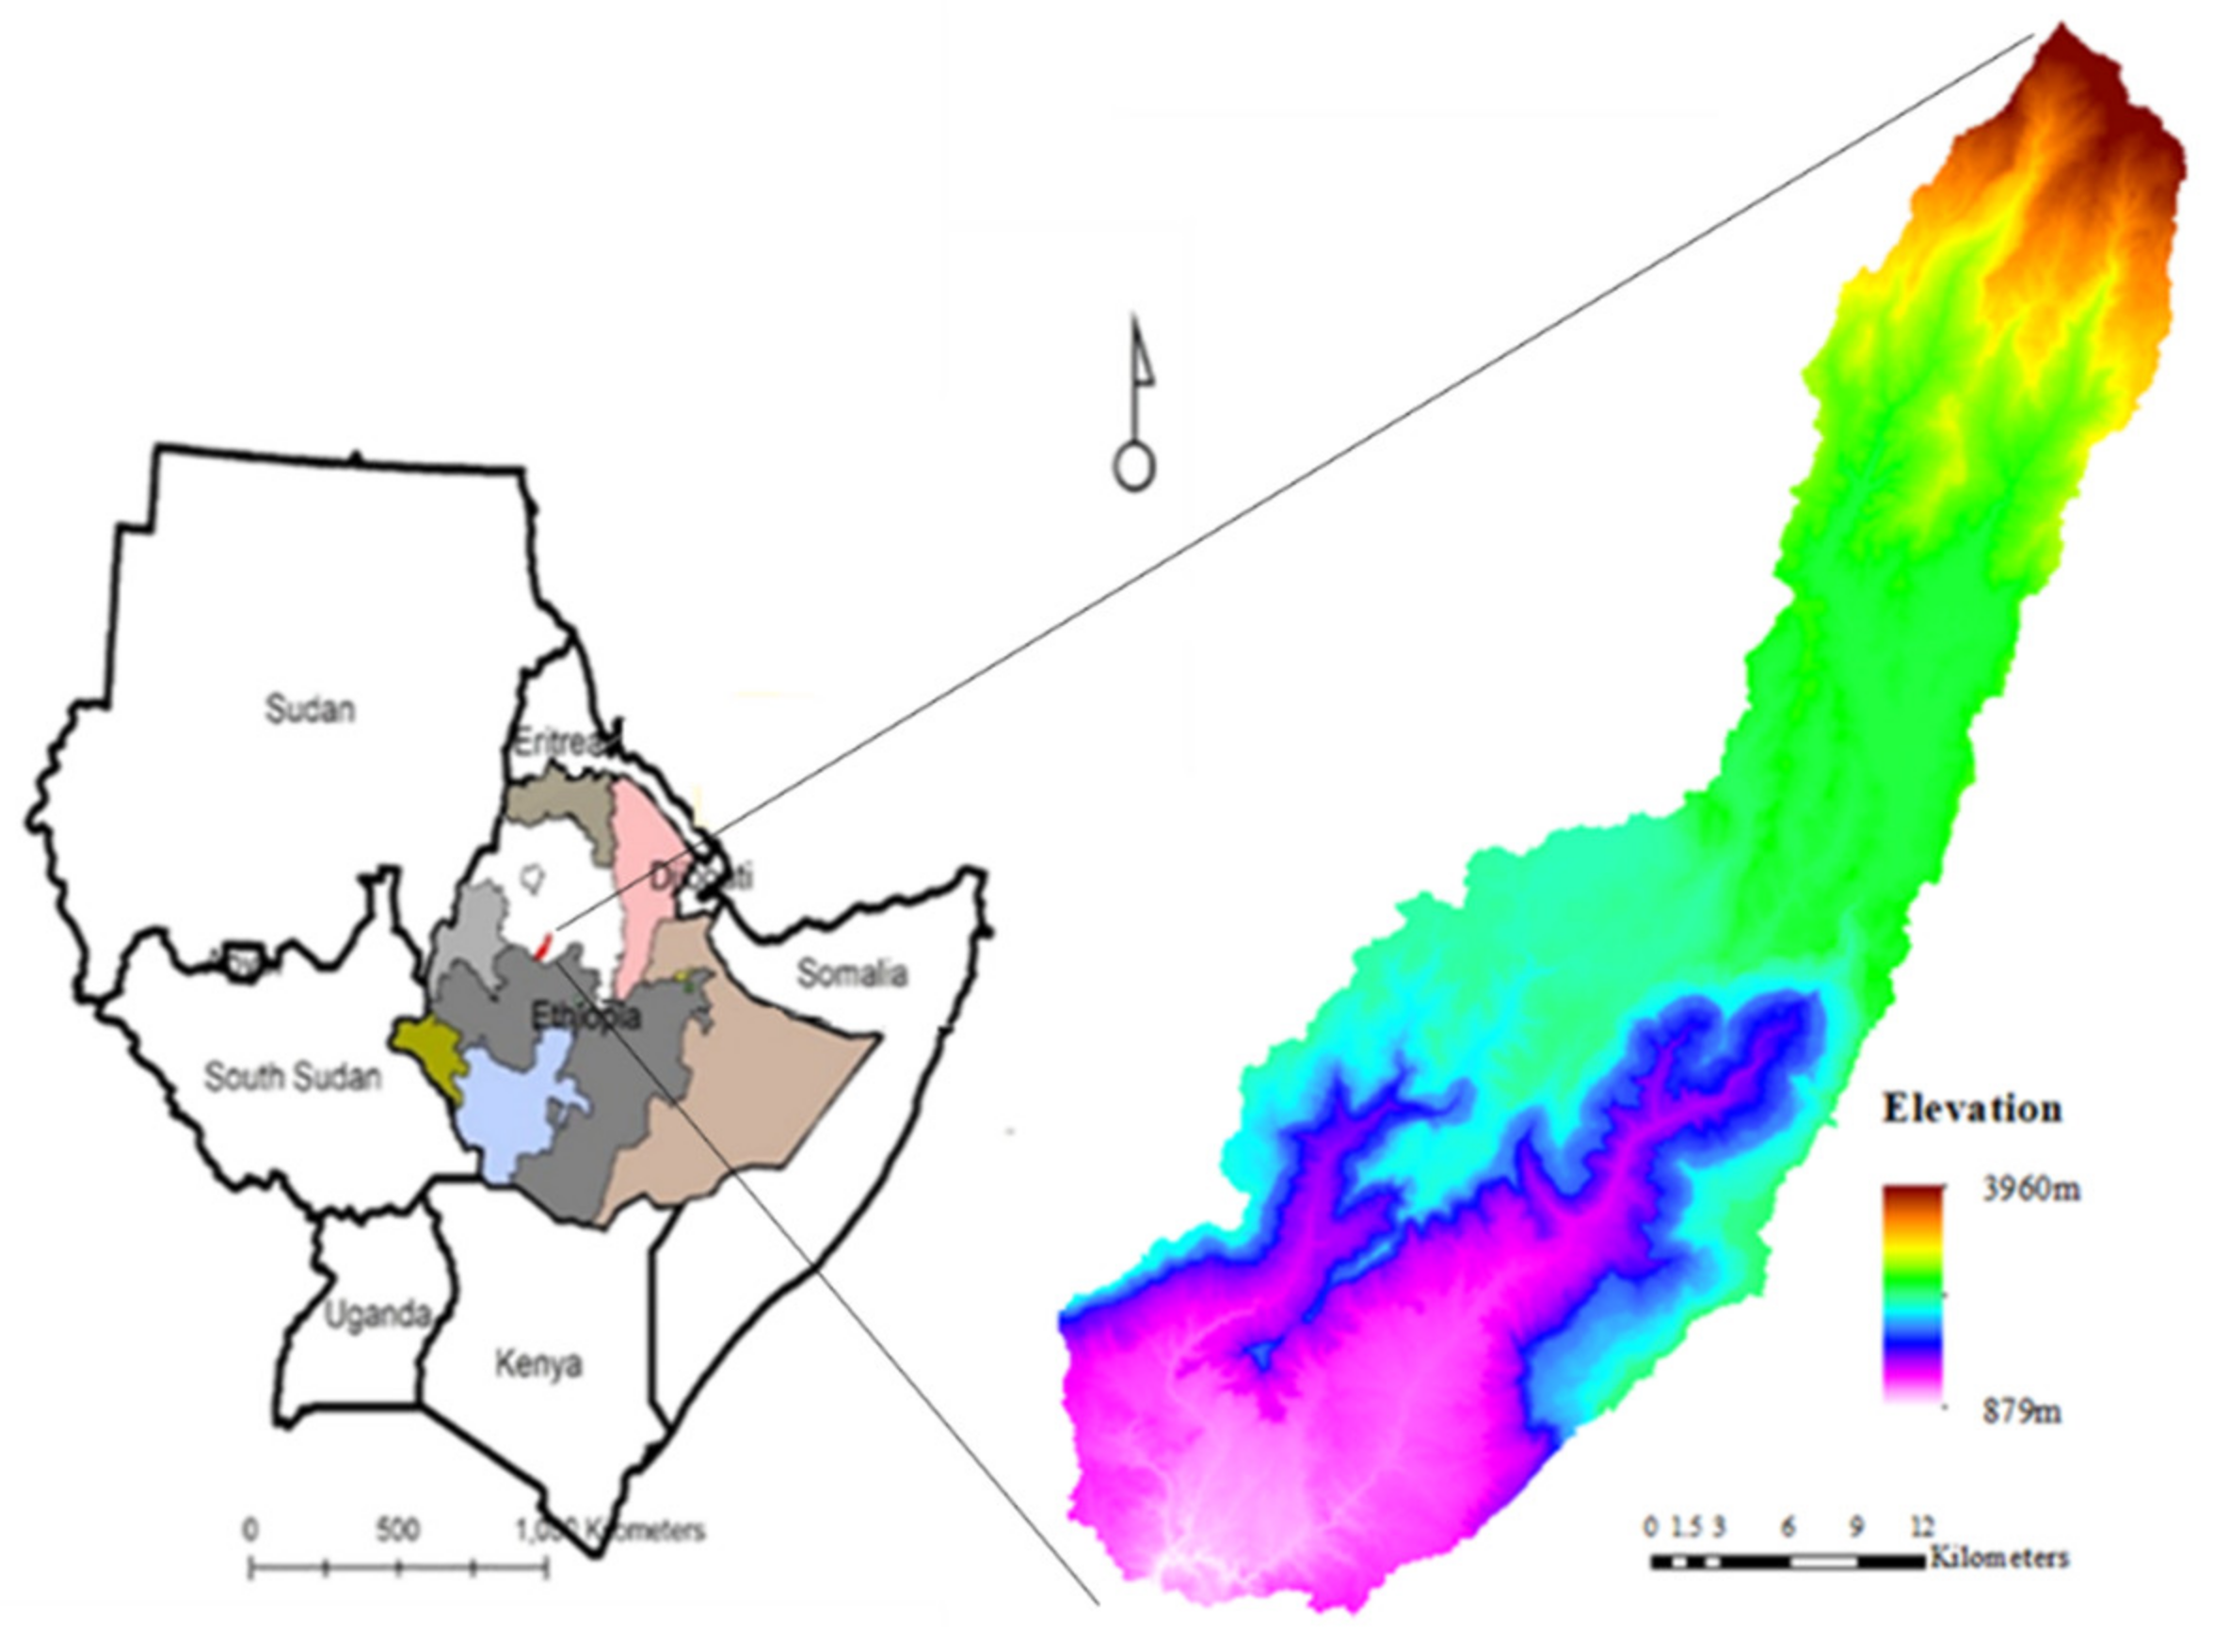
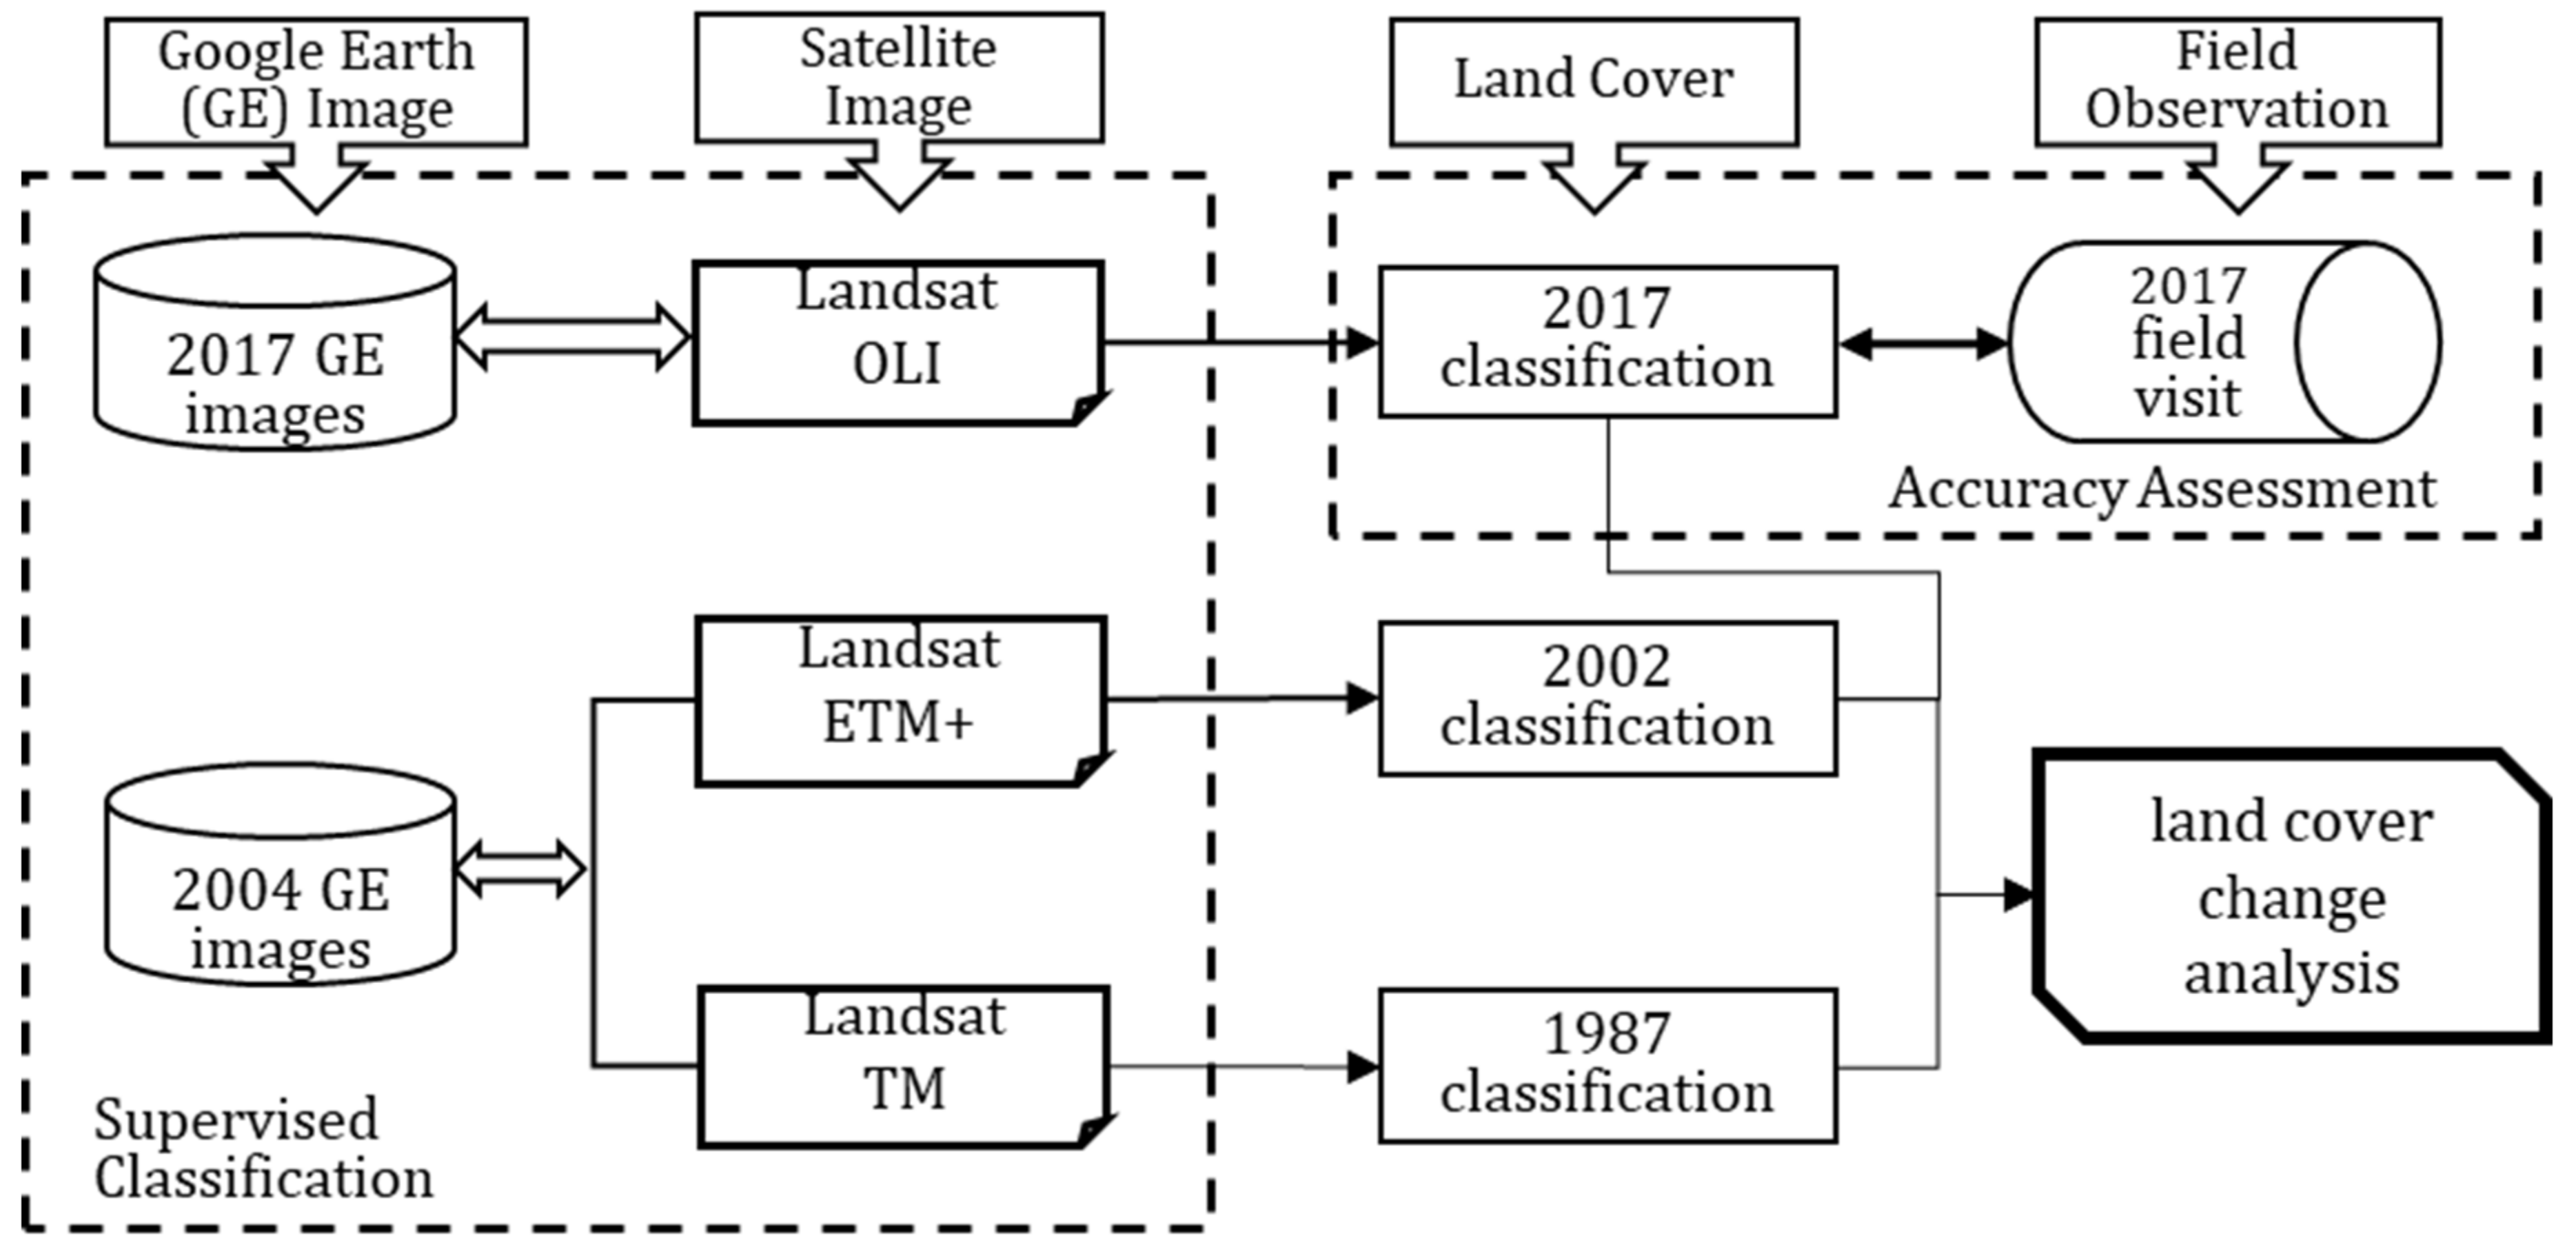
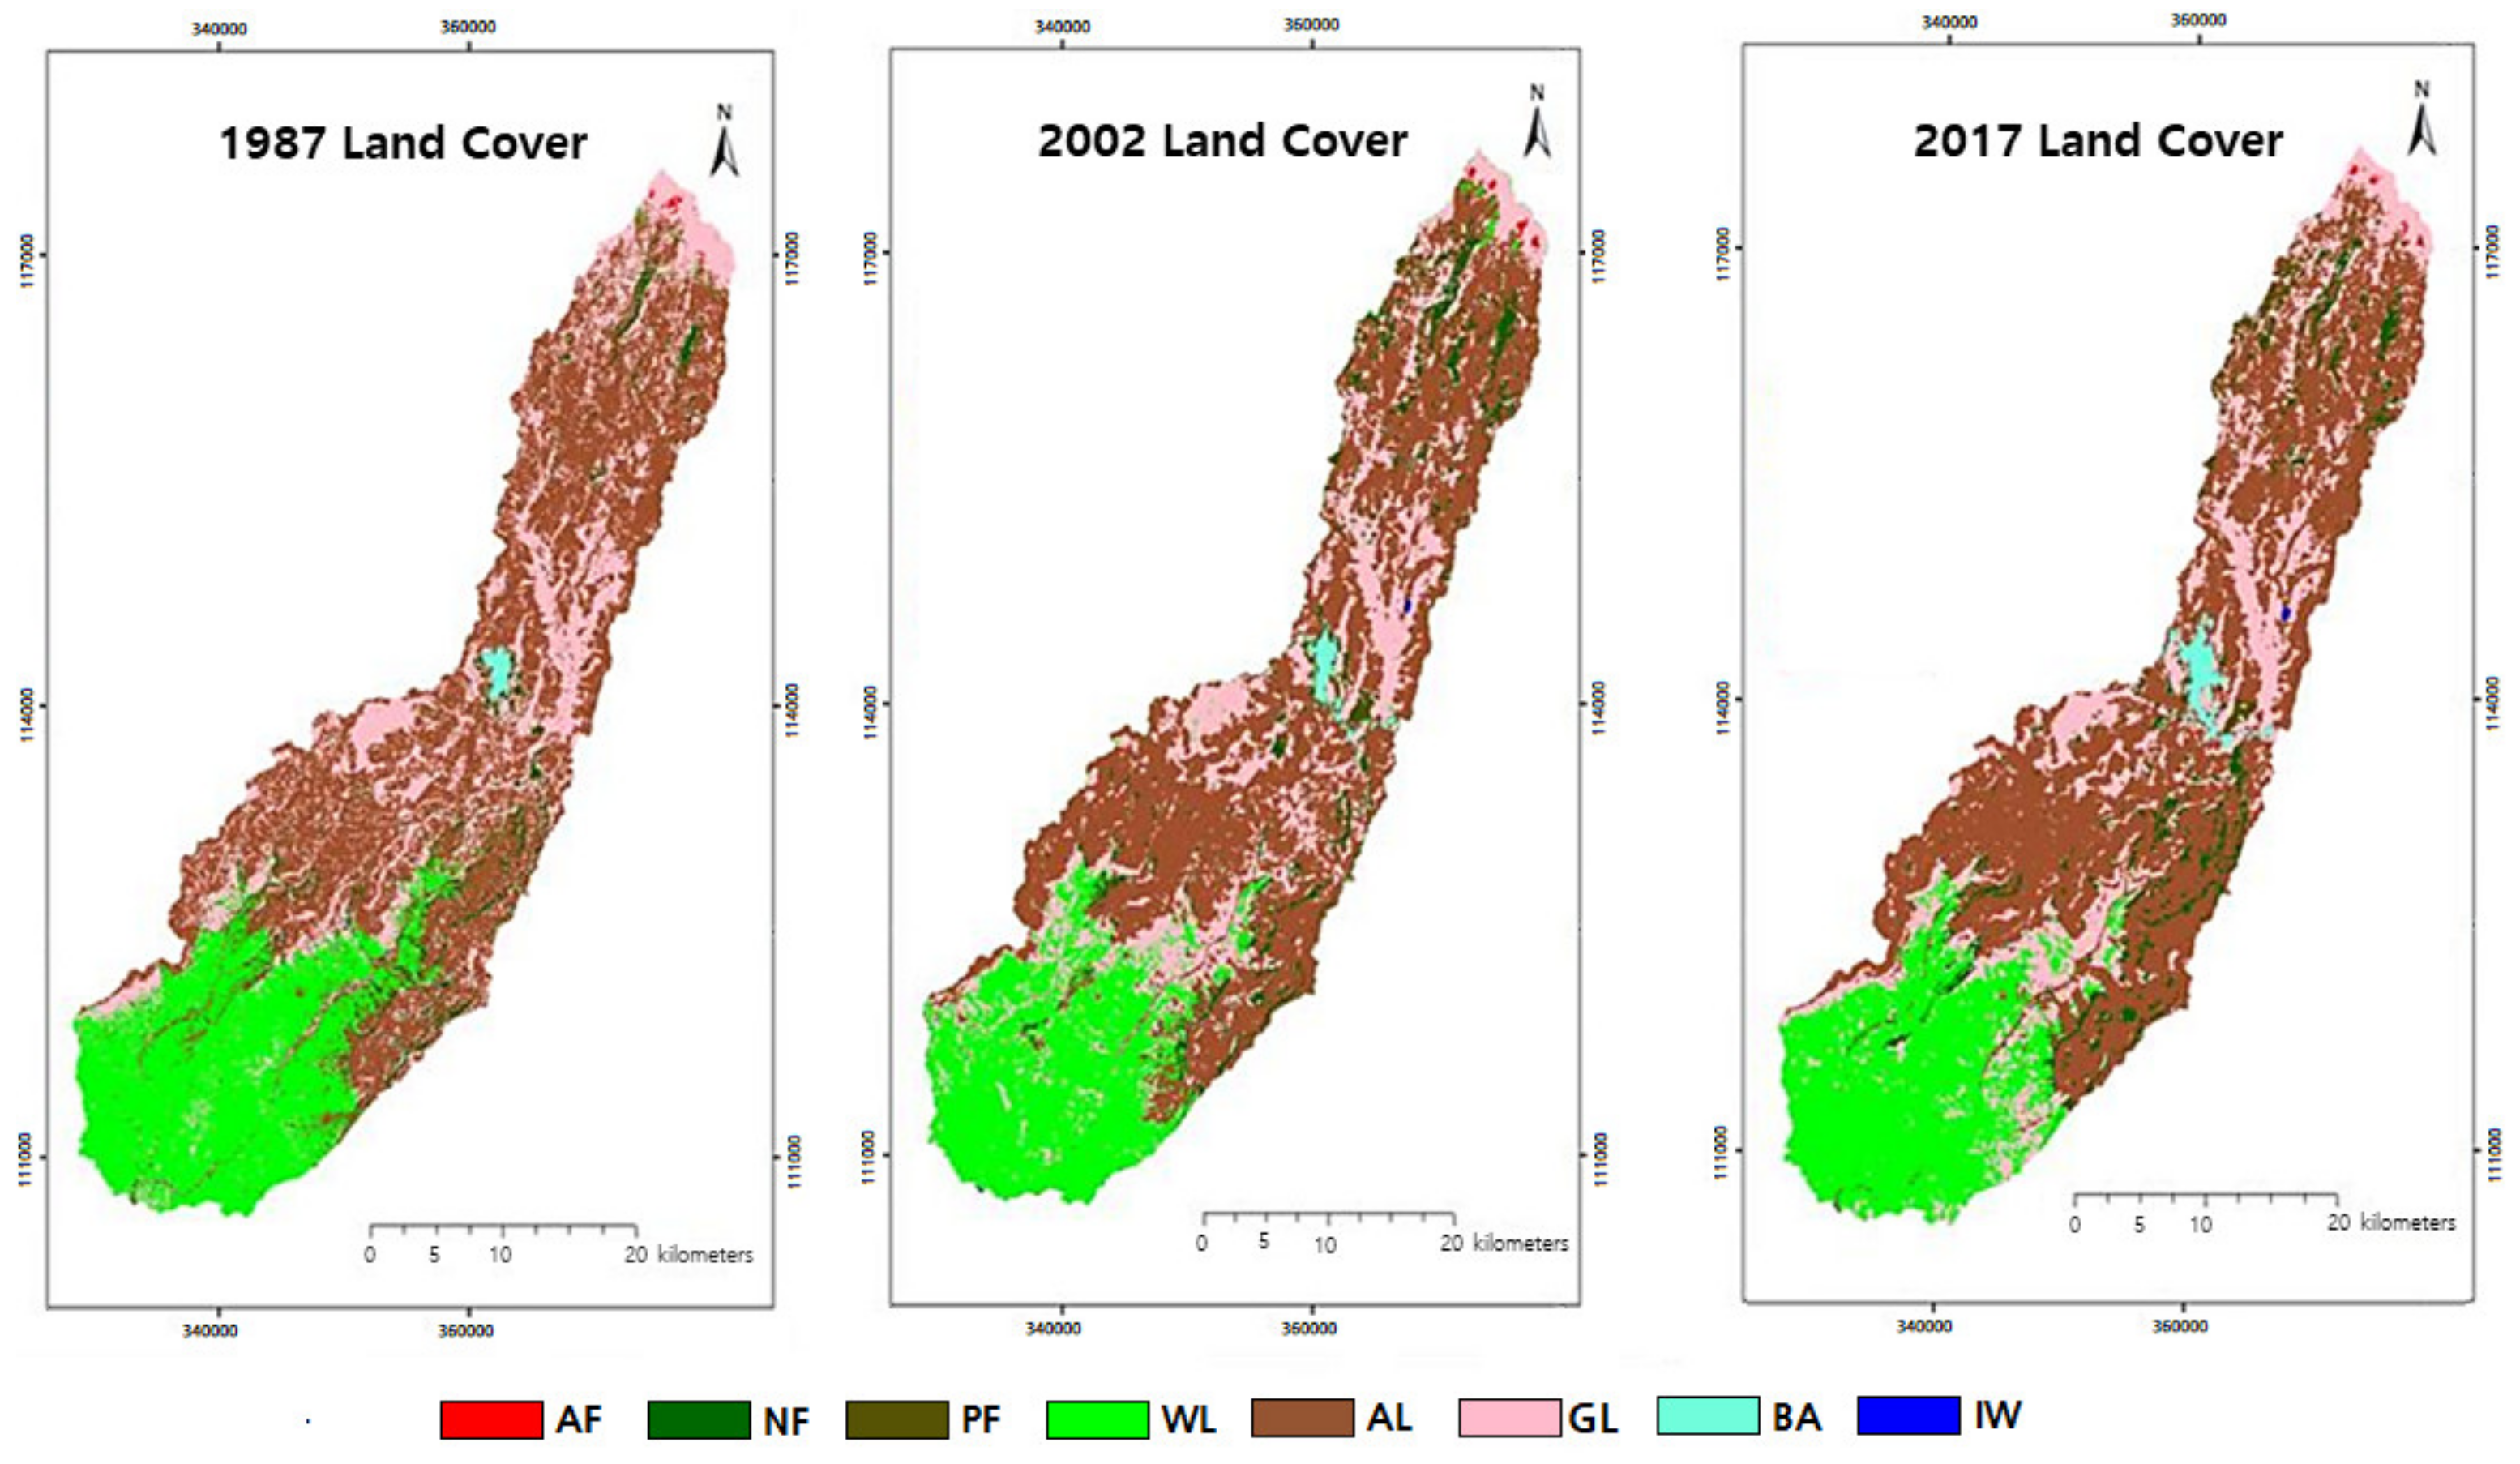
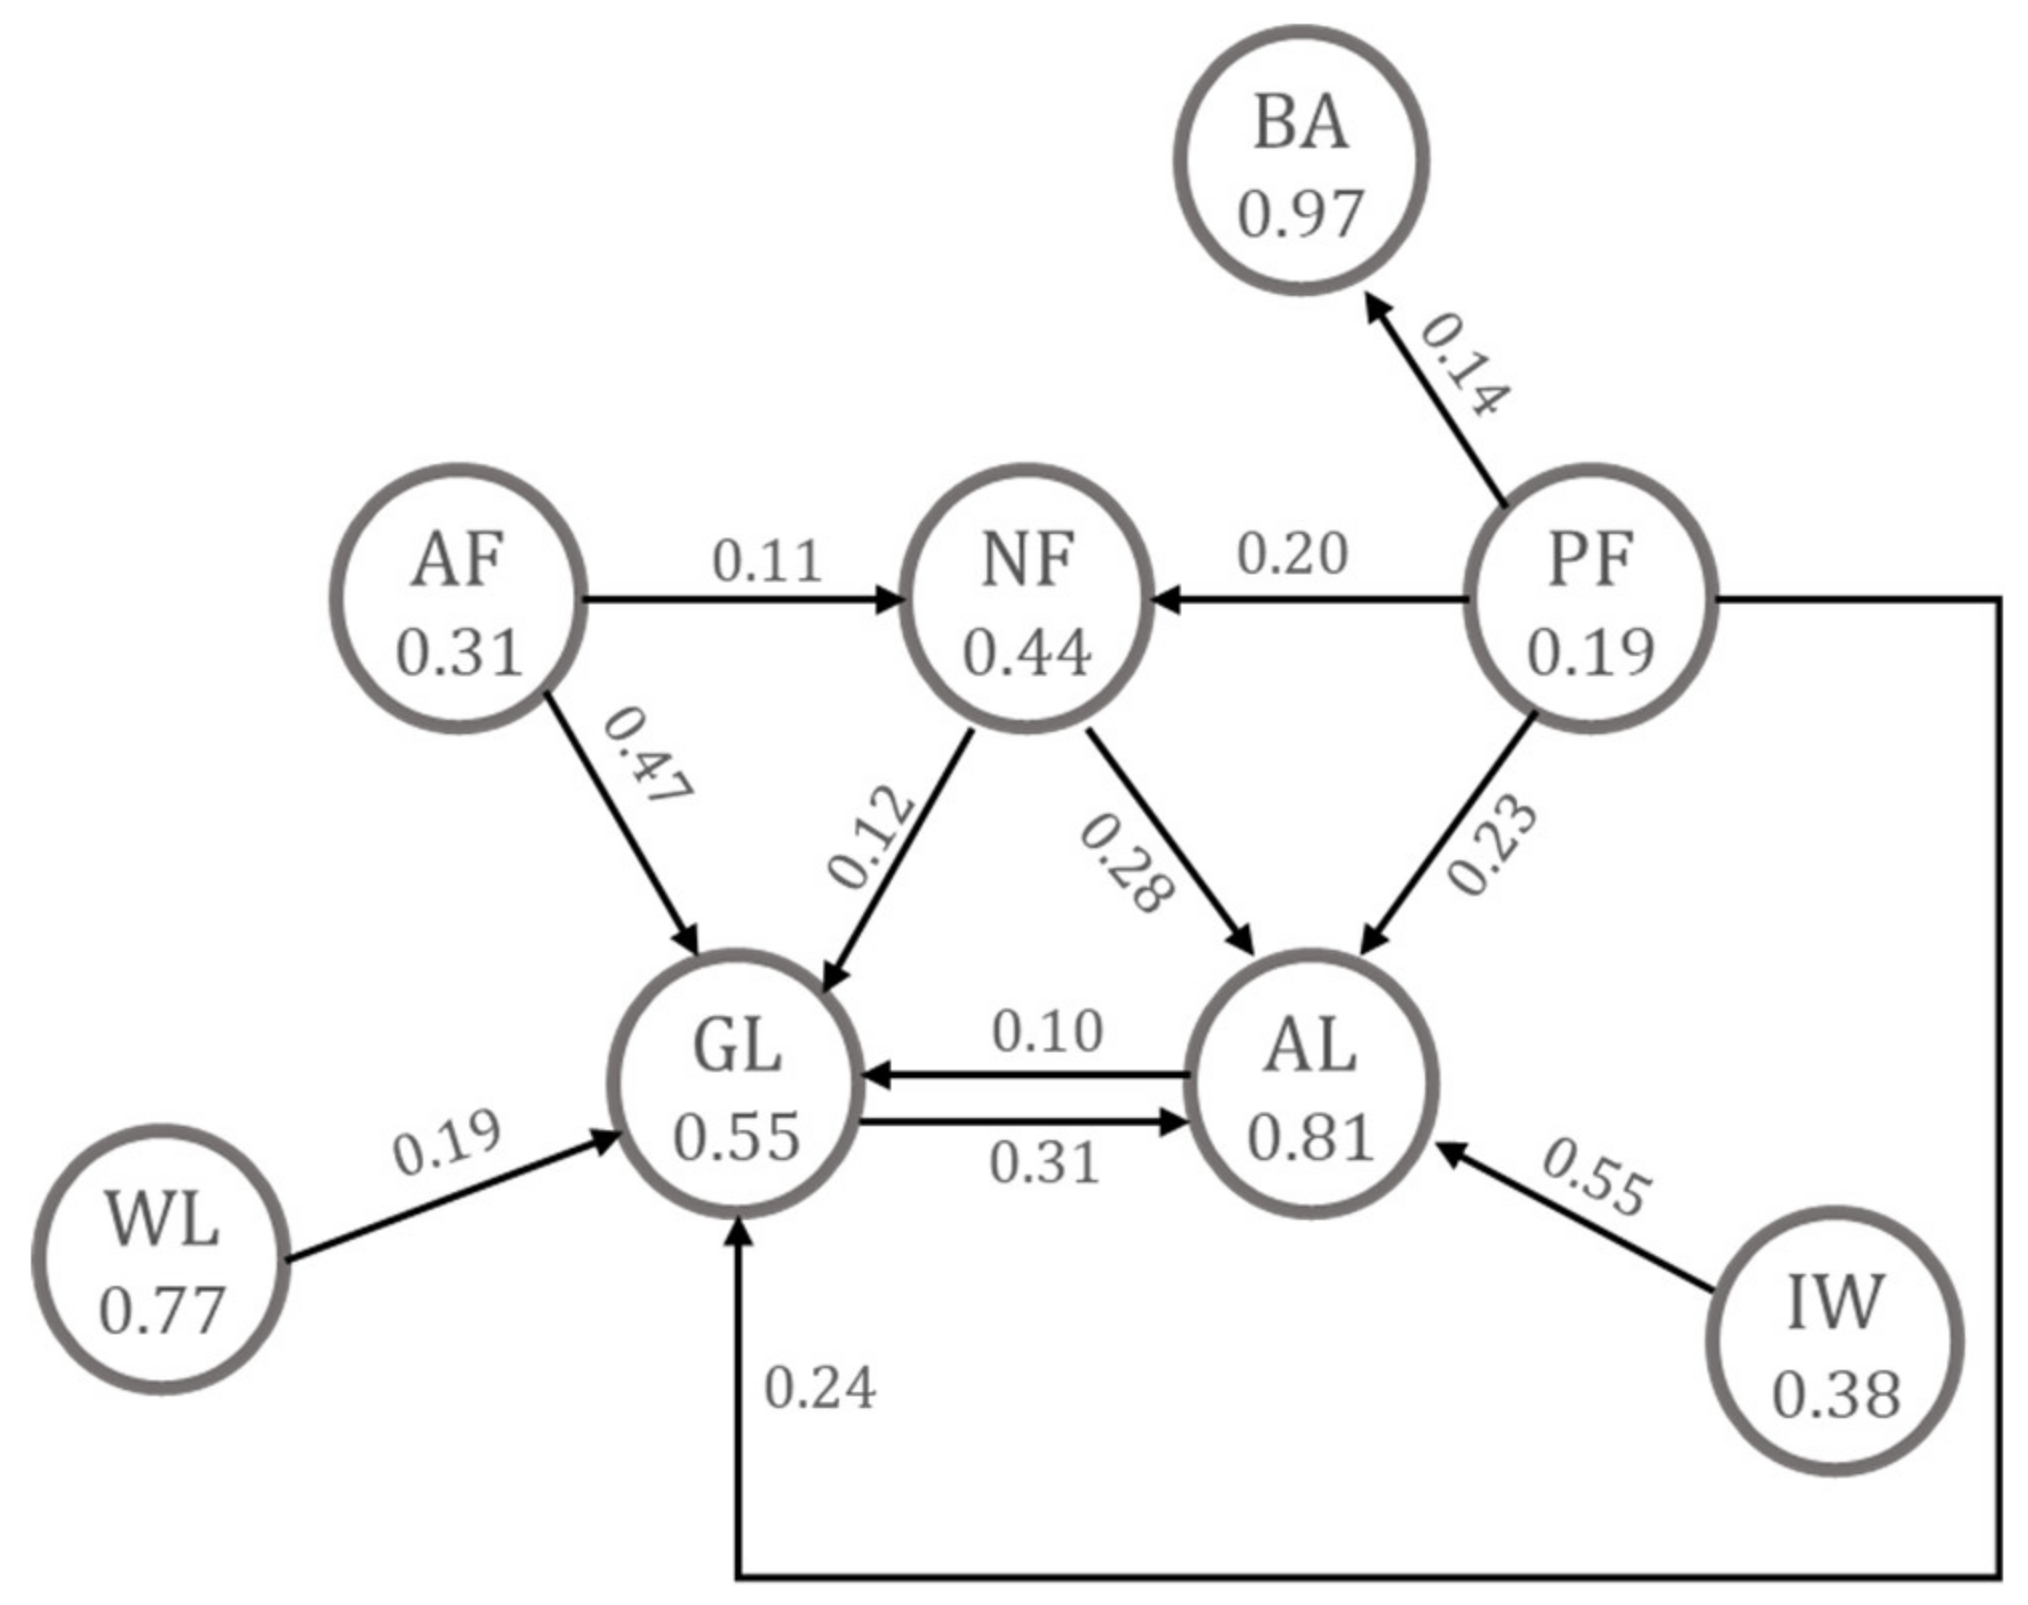
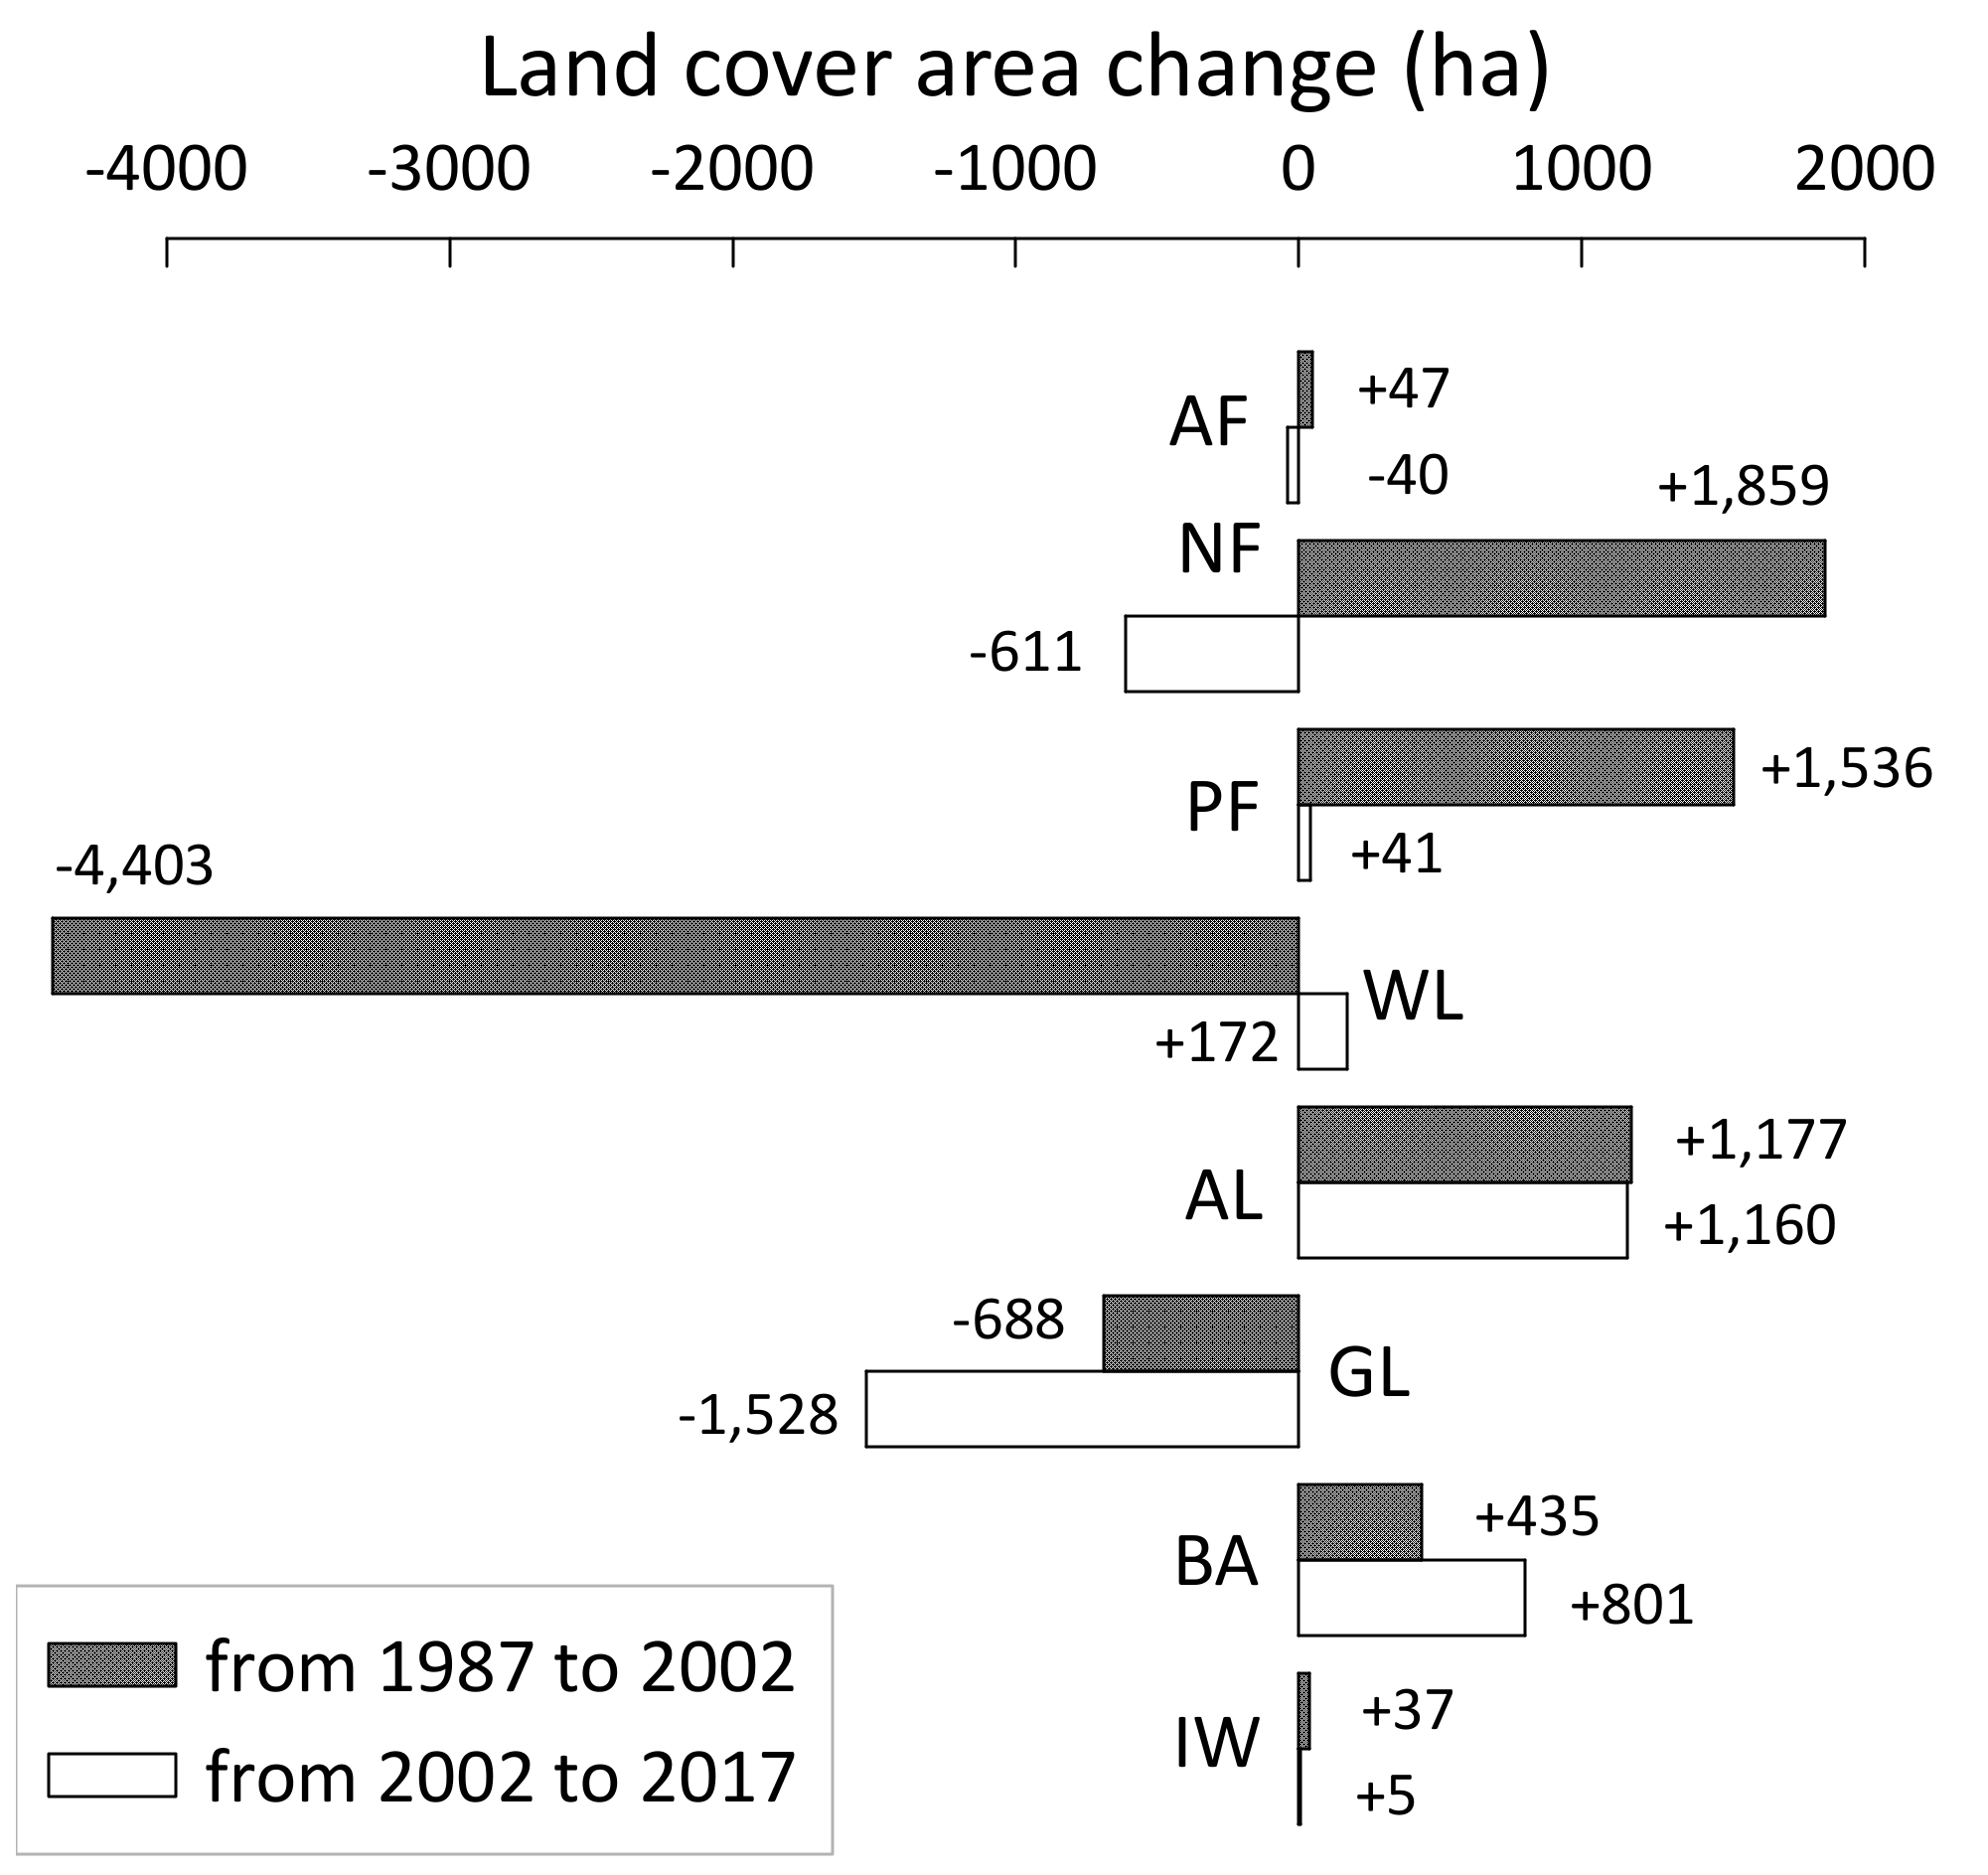
Land cover change is a major environmental concern in the northwestern highlands of Ethiopia. This study detected land cover transitions over the past 30 years in the Chemoga basin (total area = 118,359 ha). Land cover maps were generated via the supervised classification of Landsat images with the help of the Google Earth (GE) images. A total of 218 unchanged land features sampled from GE images were used as the training datasets. Classification accuracy was evaluated by comparing classified images with 165 field observations during the 2017 field visit. The overall accuracy was 85.4% and the kappa statistic was 0.81, implying that the land classification was satisfactory. Agricultural land is the dominant land cover in the study basin, and increased in extent by 2,337 ha from 1987 to 2017. The second and third most dominant land cover types, grassland and woodland, decreased by 1.9% and 3.6%, respectively, over the past 30 years. The increase in agricultural lands was mostly due to the conversion of grasslands and woodlands, although some agricultural lands changed to Eucalyptus plantations and human settlements. The results revealed that the expansion of built-up space and agricultural lands was the major driver of fragmentation of the landscape, and degradation of natural resources in the Chemoga basin, Ethiopia.
Keywords: land cover change; Google Earth images; supervised classification; transition matrix; dynamic index of land cover land cover change; Google Earth images; supervised classification; transition matrix; dynamic index of land cover