Social Vulnerability, Gender and Disasters. The Case of Haiti in 2010

 , , and
Abstract
1. Introduction
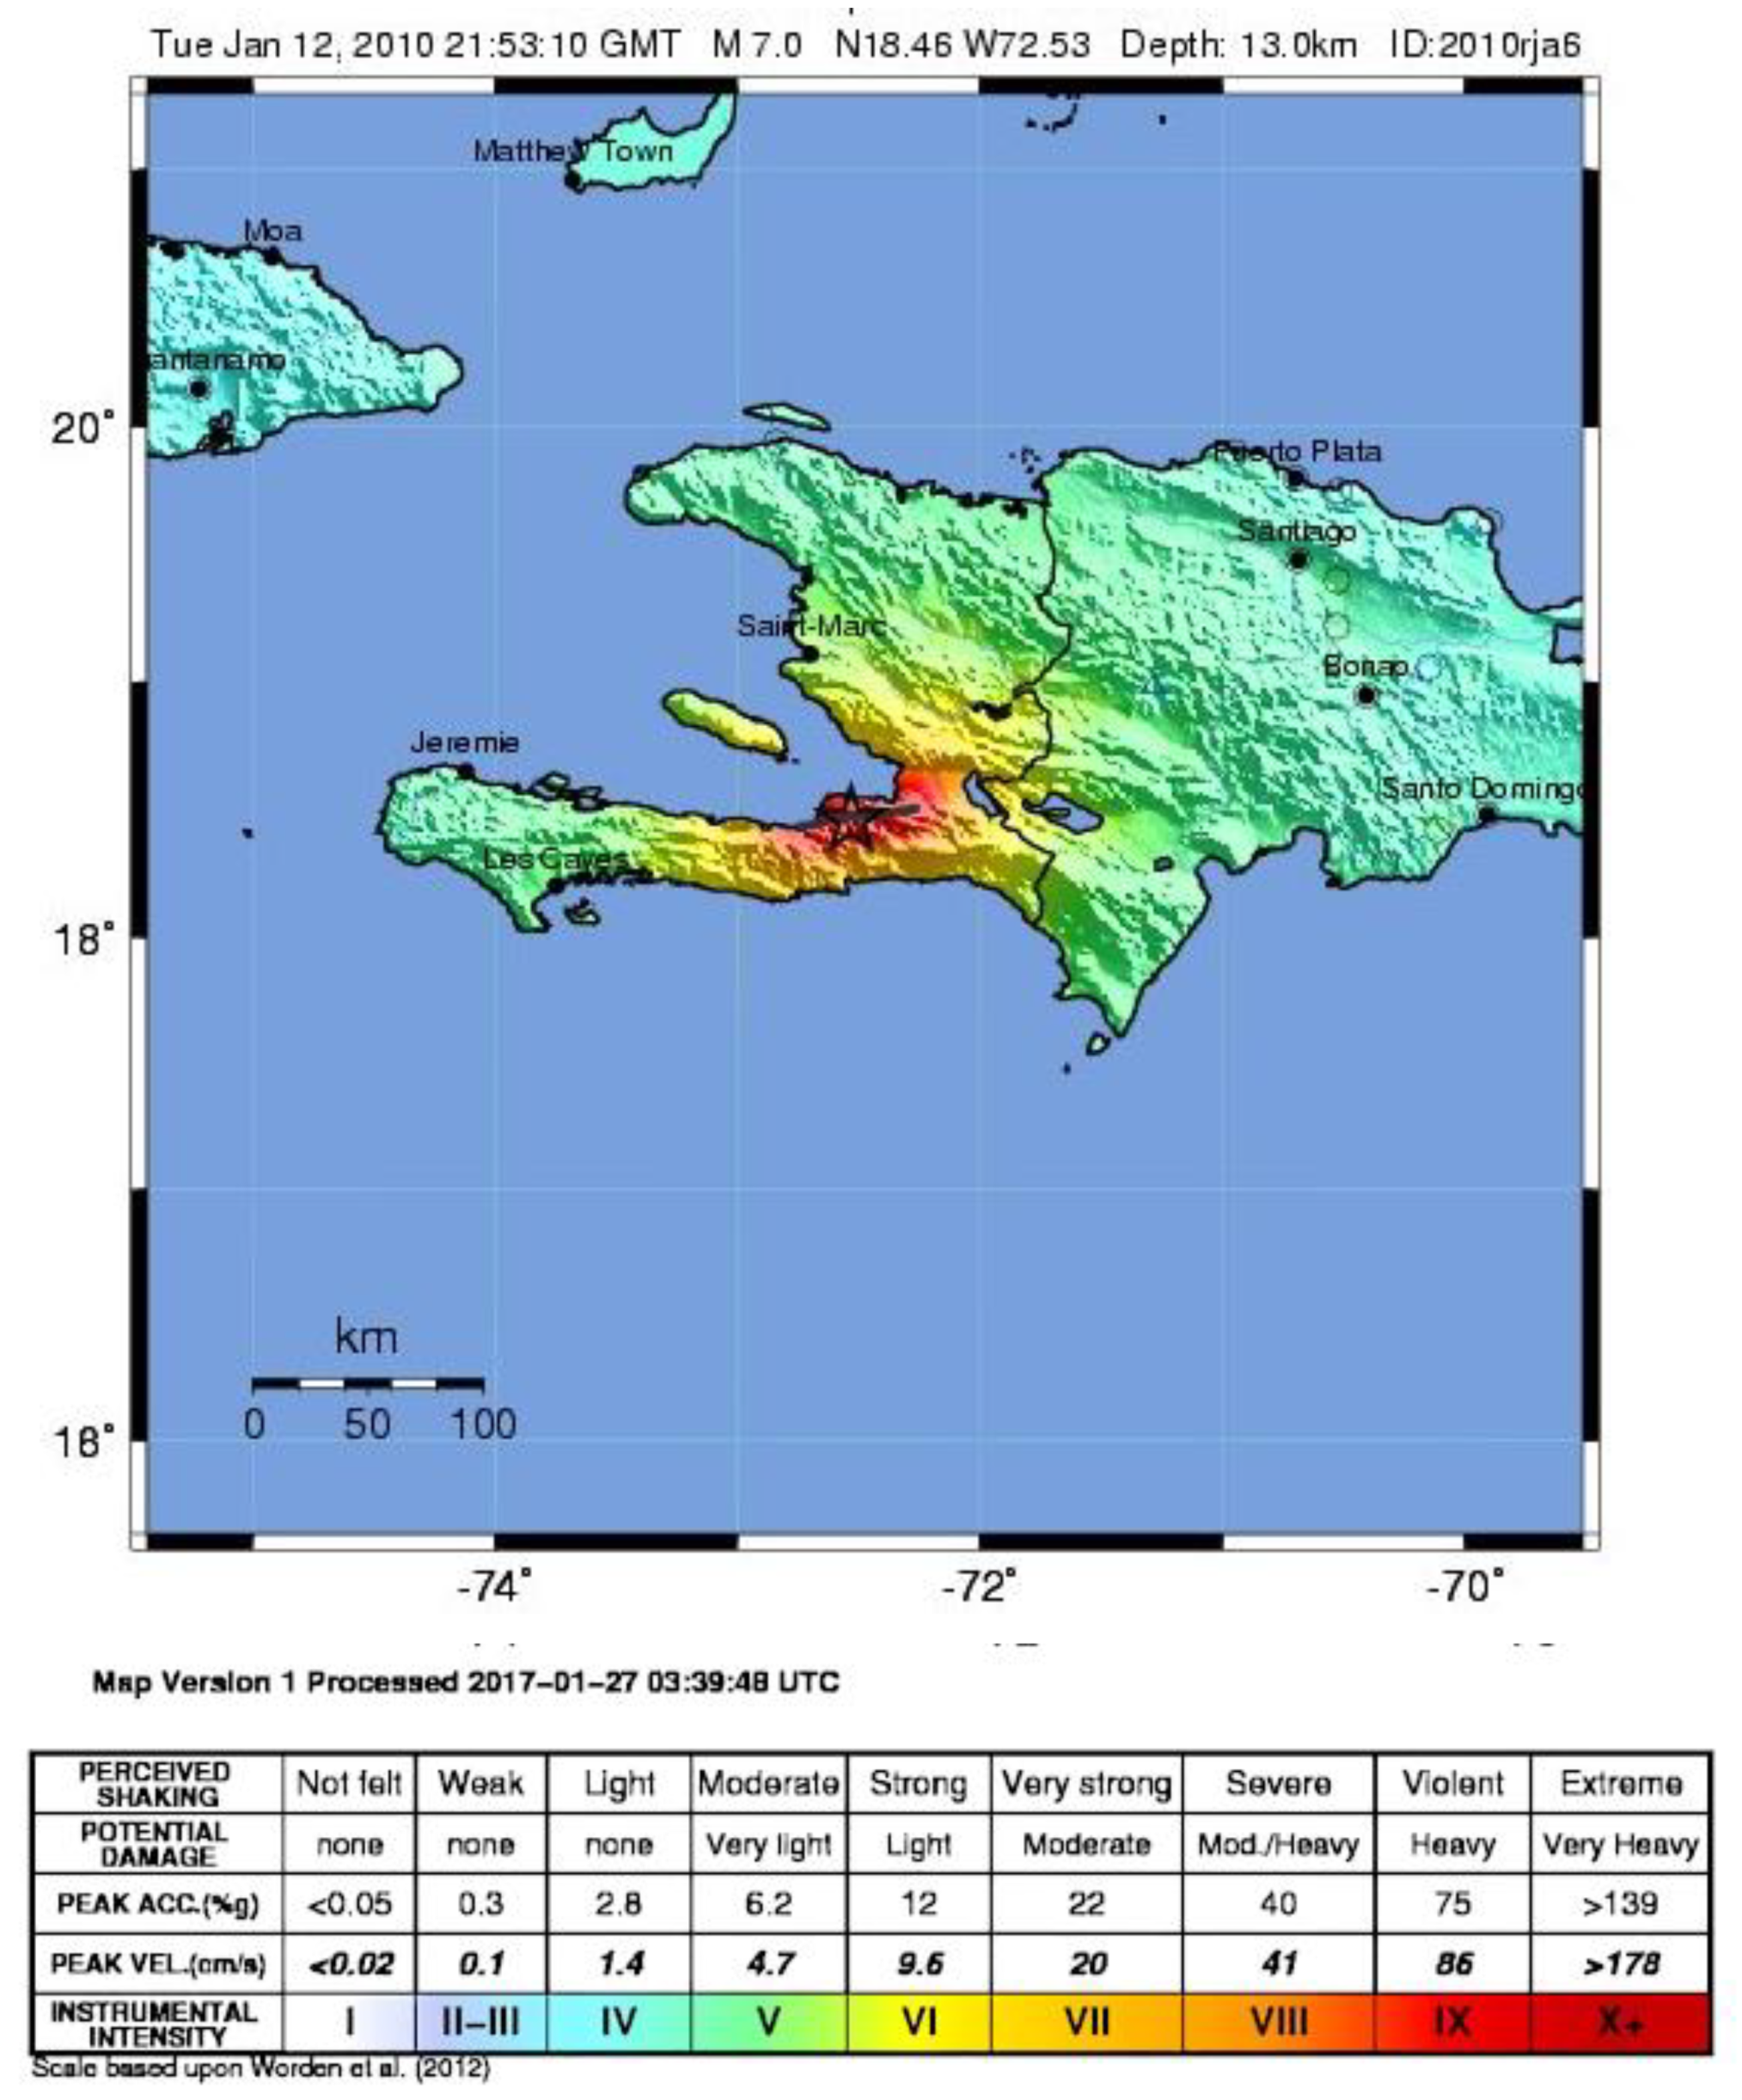
2. Study Area
3. Materials and Methods
3.1. Source of Information
3.2. Methods
3.2.1. Identification of Vulnerability Indicators
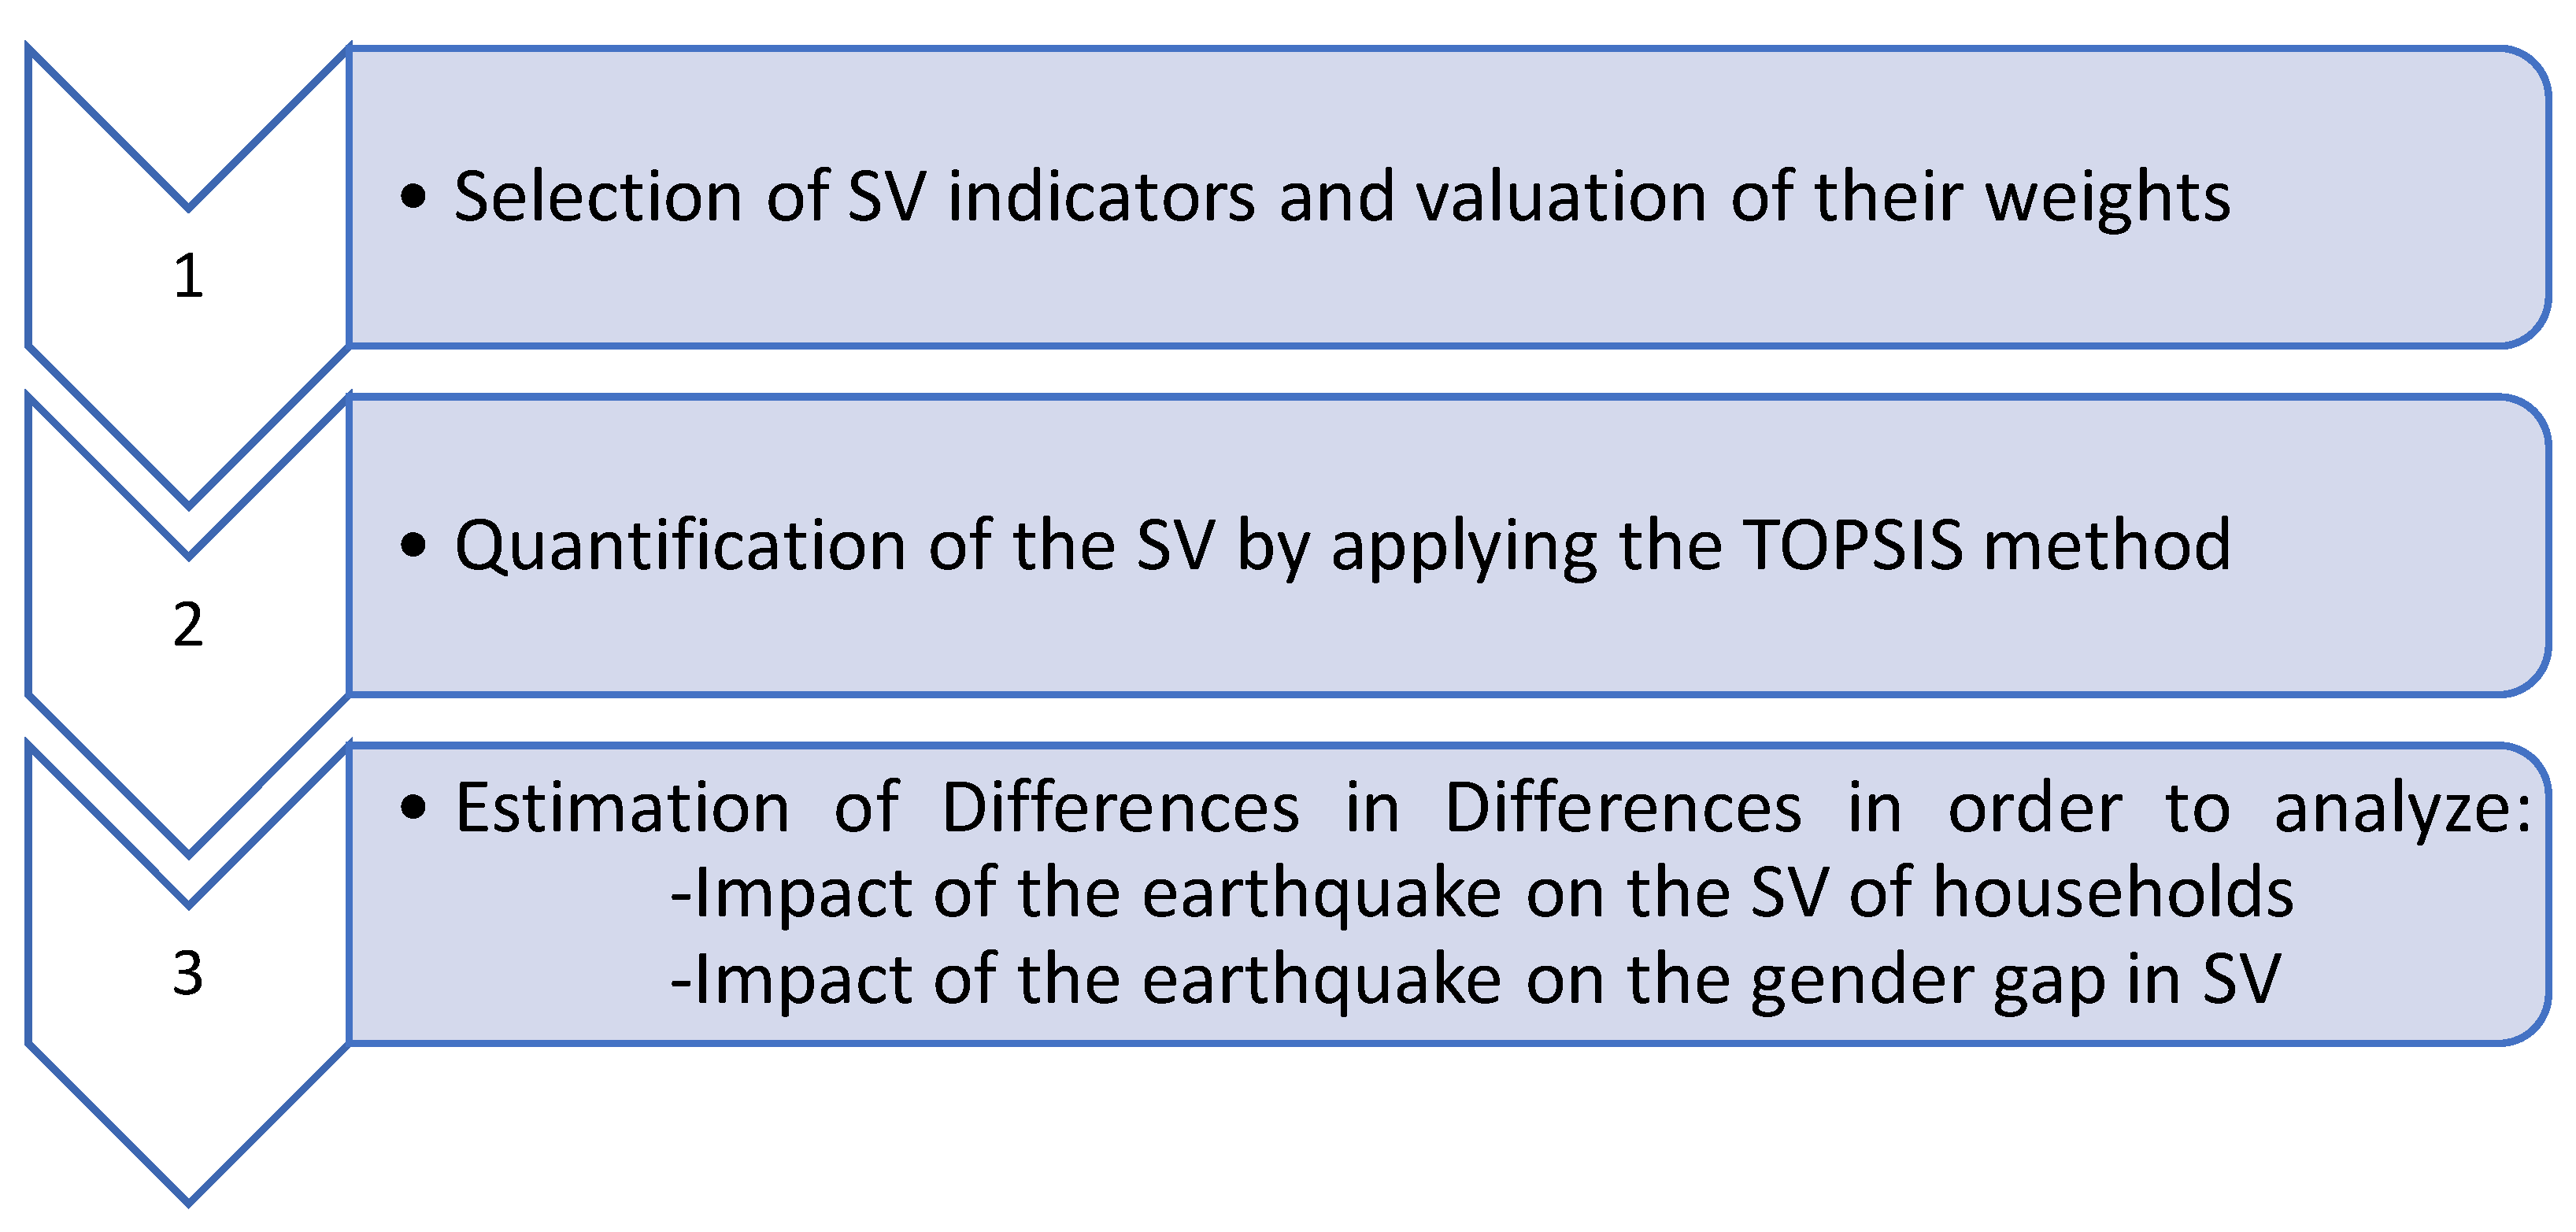
3.2.2. Technique for Order Preference for Similarity to the Ideal Solution (TOPSIS)
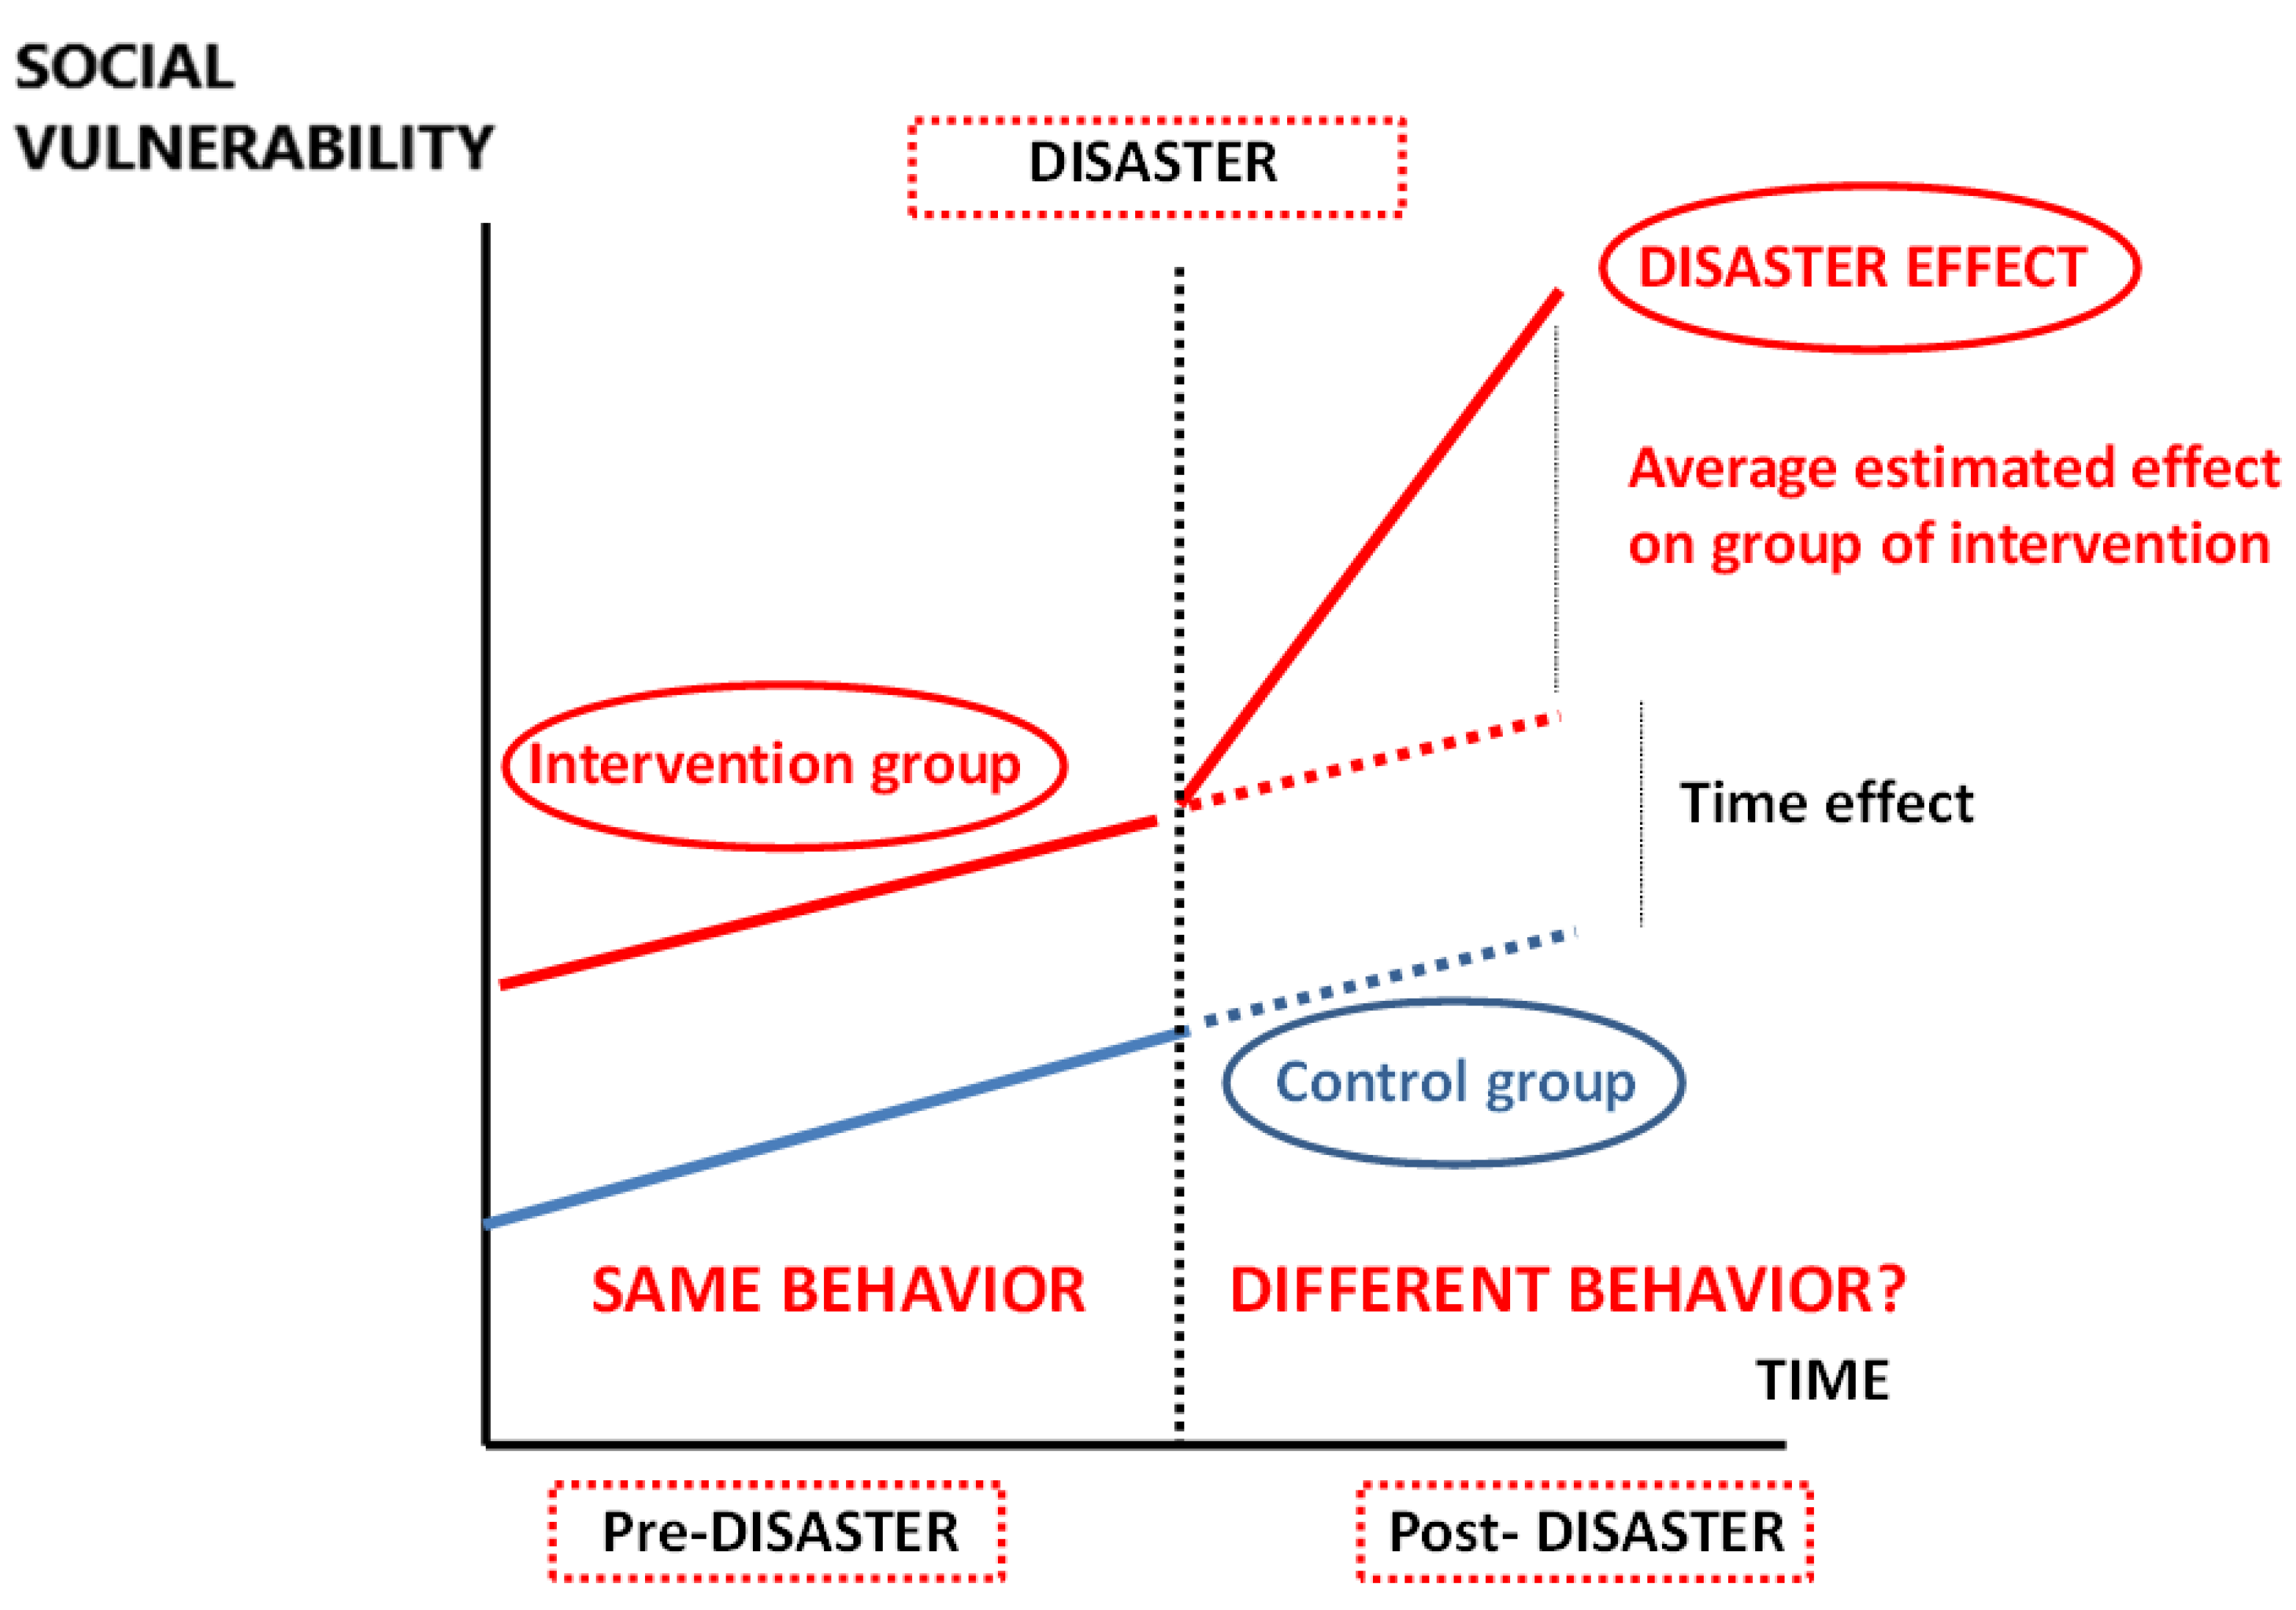
3.2.3. Differences in Differences Technique (DID)
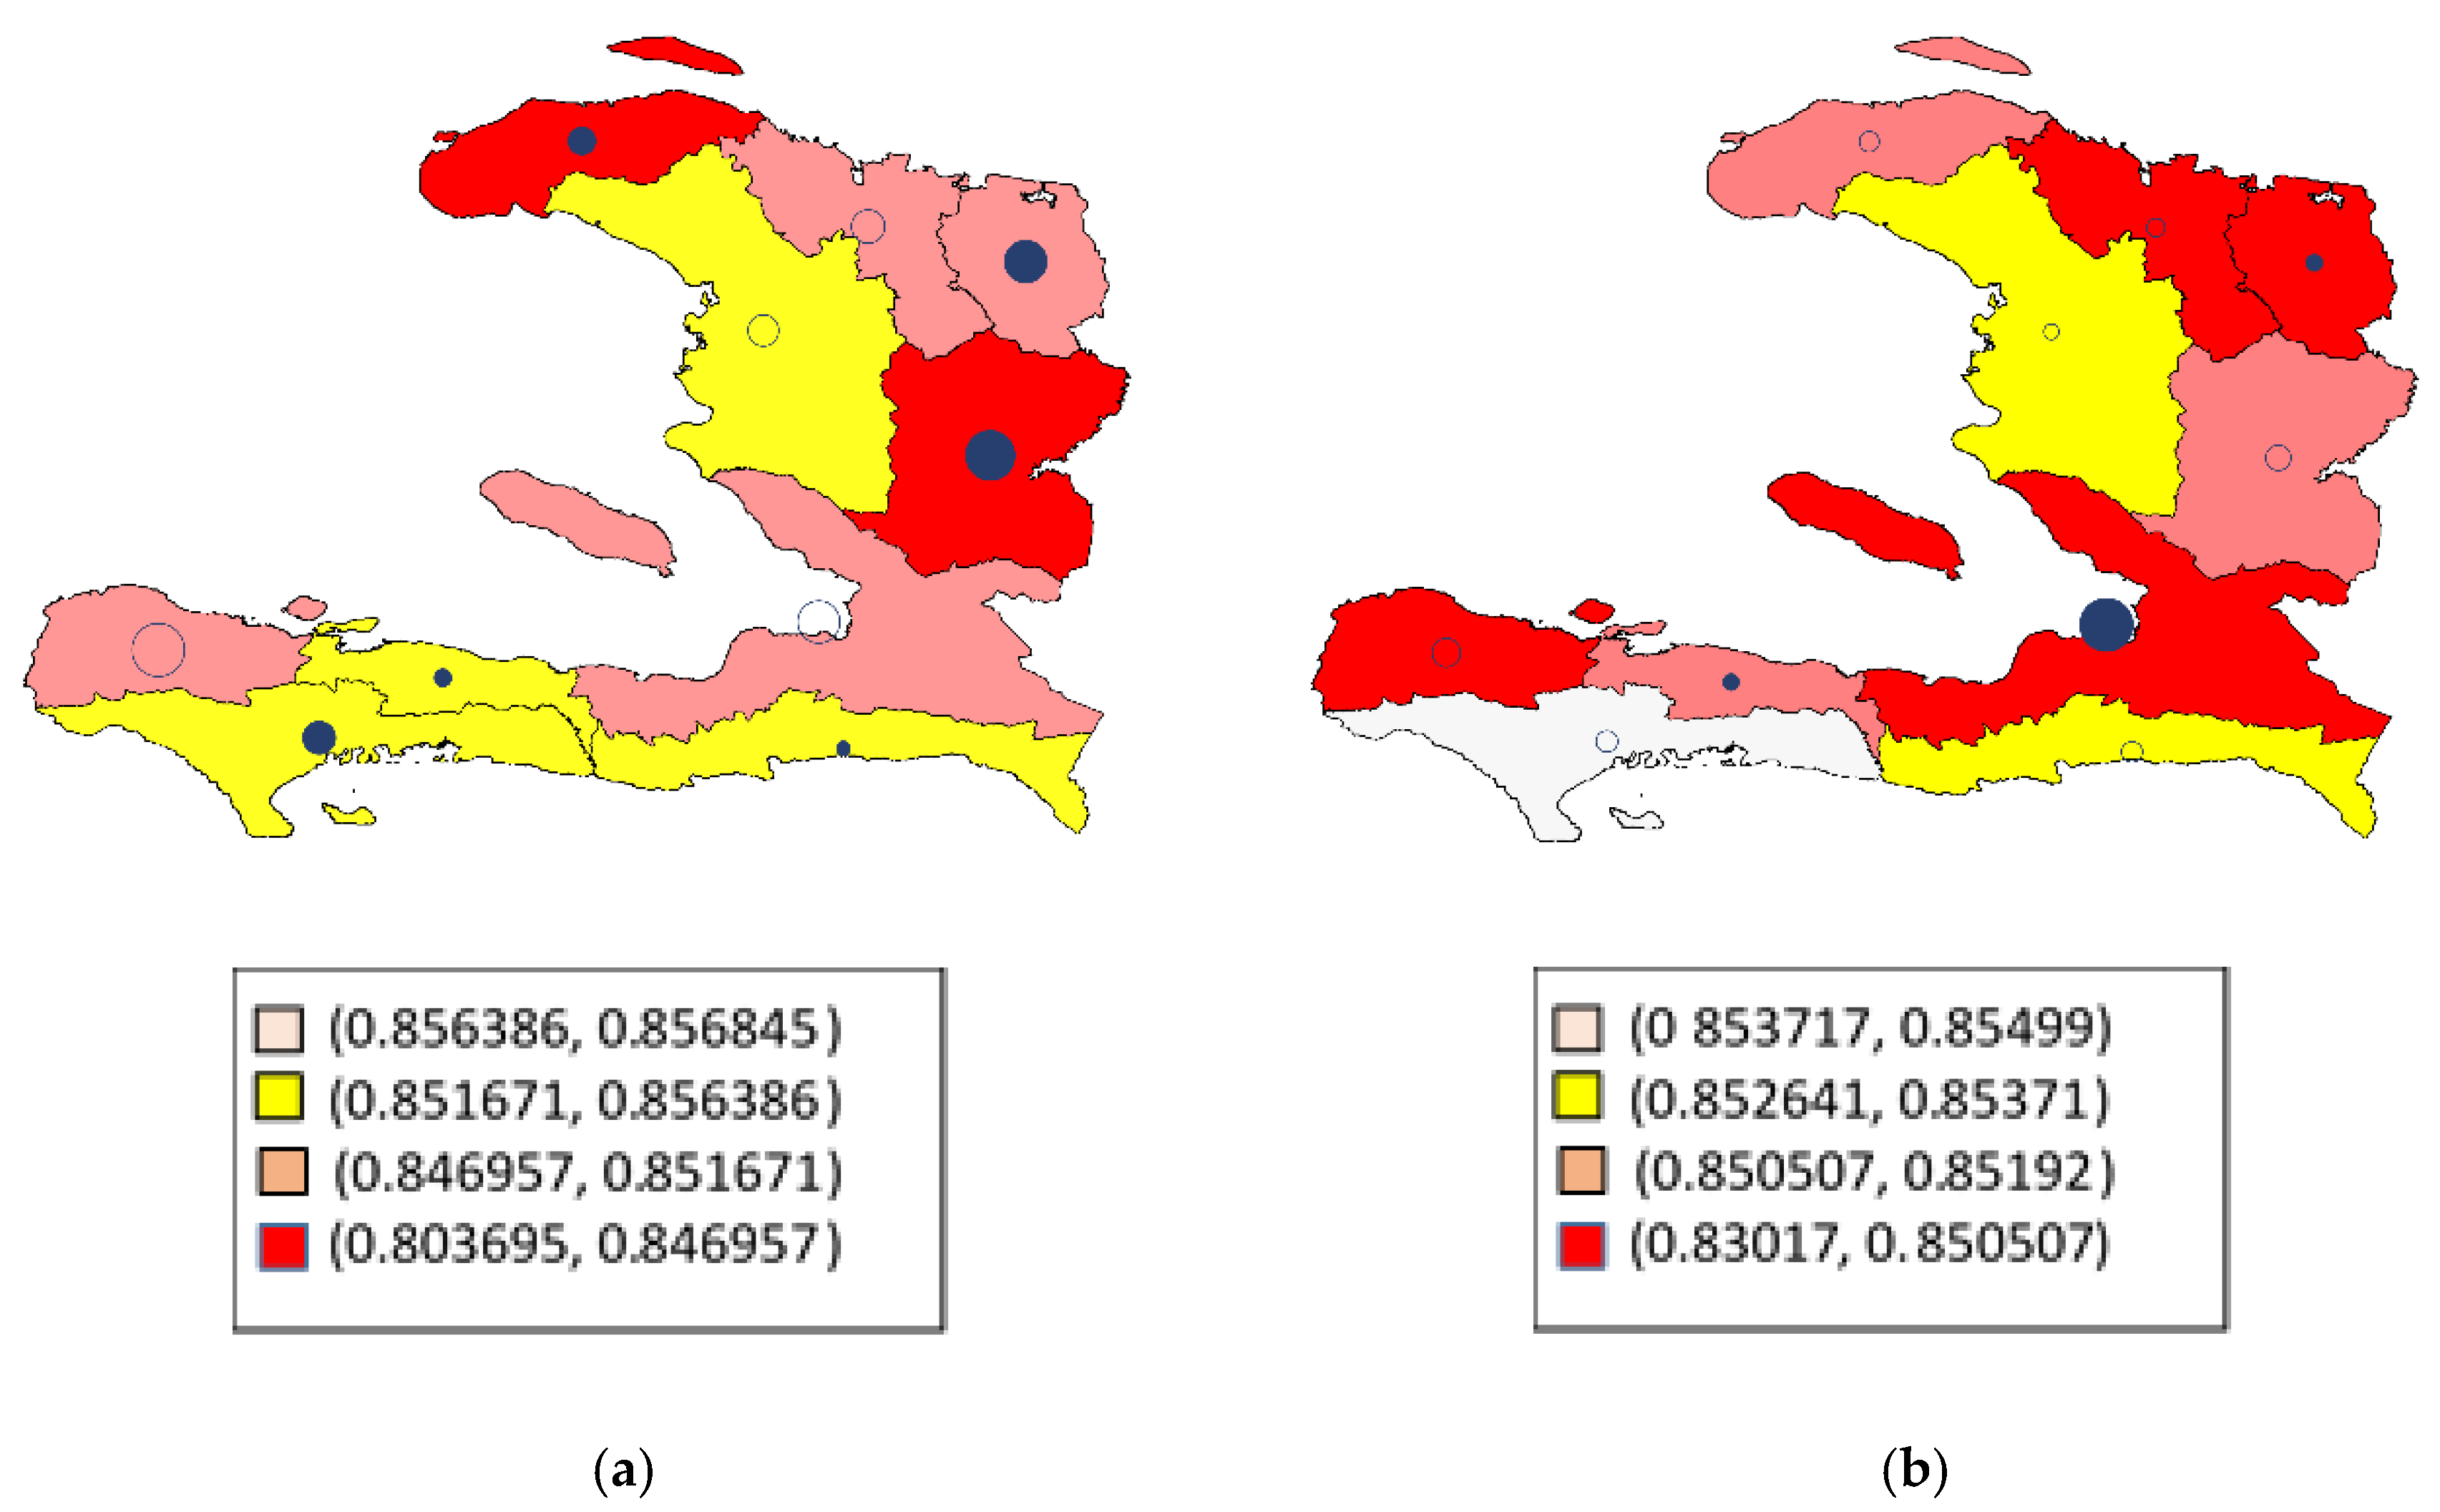
4. Results
5. Conclusions
Author Contributions
Funding
Conflicts of Interest
References
- Yang, W.; Xu, K.; Lian, J.; Ma, C.; Bin, L. Integrated flood vulnerability assessment approach based households on TOPSIS and Shannon entropy methods. Ecol. Indic. 2018, 89, 269–280. [Google Scholar] [CrossRef]
- UNDRR—Oficina Regional de Las Américas y El Caribe. Available online: https://eird.org/americas/noticias/el-informe-de-evaluacion-global-sobre-la-reduccion-del-riesgo-de-desastres-2019.html#.XlZGPUp7m70 (accessed on 26 February 2020).
- UNISDR. Terminology on Disaster Risk Reduction. Available online: https://www.undrr.org/publication/2009-unisdr-terminology-disaster-risk-reduction (accessed on 12 February 2020).
- Adger, W.N. Vulnerability. Glob. Environ. Chang. 2006, 16, 268–281. [Google Scholar] [CrossRef]
- Pérez de Armiño, K. Vulnerabilidad y desastres: Causas estructurales y procesos de la crisis de África. Cuad. Trab. Hegoa 2014, 24, 1–64. [Google Scholar]
- Giovene di Girasole, E.; Cannatella, D. Social Vulnerability to Natural Hazards in Urban Systems. An Application in Santo Domingo (Dominican Republic). Sustainability 2017, 9, 2043. [Google Scholar] [CrossRef]
- Dintwa, K.F.; Letamo, G.; Navaneetham, K. Measuring social vulnerability to natural hazards at the district level in Botswana. Jàmbá J. Disaster Risk Stud. 2019, 11. [Google Scholar] [CrossRef]
- De Loyola Hummell, B.M.; Cutter, S.L.; Emrich, C.T. Social Vulnerability to Natural Hazards in Brazil. Int. J. Disaster Risk Sci. 2016, 7, 111–122. [Google Scholar] [CrossRef]
- Thomas Bohórquez, J.E. Evaluación de la vulnerabilidad social ante amenazas naturales en Manzanillo (Colima). Un aporte de método. Investig. Geográficas Bol. Inst. Geogr. 2013, 79–93. [Google Scholar] [CrossRef]
- Aptekar, L.; Boore, J. The Emotional Effects of Disaster on Children: A Review of the Literature. Int. J. Ment. Health 1990, 19, 77–90. [Google Scholar] [CrossRef]
- Barnes, V.A.; Treiber, F.A.; Ludwig, D.A. African-American adolescents’ stress responses after the 9/11/01 terrorist attacks. J. Adolesc. Health 2005, 36, 201–207. [Google Scholar] [CrossRef]
- Peacock, W.G.; Morrow, B.H.; Gladwin, H. Hurricane Andrew: Ethnicity, Gender and the Sociology of Disasters; Routledge: London, UK; New York, NY, USA, 1997; ISBN 978-0-415-16811-3. [Google Scholar]
- Bista, R.B. Determinants of Flood Disaster Households’ Vulnerability in Nepal. Econ. J. Dev. Issues 2019, 47–59. [Google Scholar] [CrossRef]
- Atlas of the Human Planet 2017: Global Exposure to Natural Hazards. Available online: https://ec.europa.eu/jrc/en/publication/eur-scientific-and-technical-research-reports/atlas-human-planet-2017-global-exposure-natural-hazards (accessed on 13 February 2020).
- Enarson, E. Gender and Natural Disasters. In Focus Programme on Crisis Response and Reconstruction, Working Paper 1; International Labour Organization: Geneva, Switzerland, 2000; ISBN 978-92-2-112260-9. [Google Scholar]
- Enarson, E.; Meyreles, L. International perspectives on gender and disaster: Differences and possibilities. Int. J. Sociol. Soc. Policy 2004, 24, 49–93. [Google Scholar] [CrossRef]
- Neumayer, E.; Plümper, T. The Gendered Nature of Natural Disasters: The Impact of Catastrophic Events on the Gender Gap in Life Expectancy, 1981–2002. Ann. Assoc. Am. Geogr. 2007, 97, 551–566. [Google Scholar] [CrossRef]
- Horton, R. GBD 2010: Understanding disease, injury, and risk. Lancet 2012, 9859, 2053–2054. [Google Scholar] [CrossRef]
- Faedi Duramy, B. Gender and Violence in Haiti: Women’s Path from Victims to Agents; Rutgers University Press: New Brunswick, NJ, USA, 2014; ISBN 978-0-8135-6316-9. [Google Scholar]
- Nelson, K.S.; Abkowitz, M.D.; Camp, J.V. A method for creating high resolution maps of social vulnerability in the context of environmental hazards. Appl. Geogr. 2015, 63, 89–100. [Google Scholar] [CrossRef]
- Parida, P.K. The social construction of gendered vulnerability to tsunami disaster: The case of coastal Sri Lanka. J. Soc. Econ. Dev. 2015, 17, 200–222. [Google Scholar] [CrossRef]
- Ahmad, A. Conceptualizing Disasters from a Gender Perspective. In Disasters: Core Concepts and Ethical Theories; O’Mathúna, D.P., Dranseika, V., Gordijn, B., Eds.; Advancing Global Bioethics; Springer International Publishing: Cham, Switzerland, 2018; Volume 11, pp. 105–117. ISBN 978-3-319-92722-0. [Google Scholar]
- Rushton, A.; Gray, L.; Canty, J.; Blanchard, K. Beyond Binary: (Re)Defining “Gender” for 21st Century Disaster Risk Reduction Research, Policy, and Practice. Int. J. Environ. Res. Public. Health 2019, 16, 3984. [Google Scholar] [CrossRef]
- Schonfeld, D.J.; Gurwitch, R.H. Addressing Disaster Mental Health Needs of Children: Practical Guidance for Pediatric Emergency Health Care Providers. Clin. Pediatr. Emerg. Med. 2009, 10, 208–215. [Google Scholar] [CrossRef]
- Hamidazada, M.; Cruz, A.M.; Yokomatsu, M. Vulnerability Factors of Afghan Rural Women to Disasters. Int. J. Disaster Risk Sci. 2019, 10, 573–590. [Google Scholar] [CrossRef]
- CEPALSTAT. Available online: https://cepalstat-prod.cepal.org/cepalstat/tabulador/ConsultaIntegrada.asp?idIndicador=2465&idioma=e (accessed on 10 February 2020).
- Bradshaw, S.; Arenas, A. Análisis de Género en la Evaluación de los Efectos Socioeconómicos de los Desastres Naturales; Manuales; Naciones Unidas Comisión Económica para América Latina y el Caribe (CEPAL): Santiago, Chile, 2004. [Google Scholar]
- Arenas Ferriz, A. Expert Group meeting on Enviromental management and mitigation of natural disasters: A gender perspective. In Proceedings of the Relevance of Considering a Gender Perspective in Damage Assessment and Recovery Strategies: A Case Study in El Salvador, Central America, Ankara, Turkey, 6–9 November 2001. [Google Scholar]
- PNUD: Sustainable Development Goals. Available online: https://www.undp.org/content/undp/es/home/sustainable-development-goals.html (accessed on 11 February 2020).
- Cutter, S.L. A research agenda for vulnerability science and environmental hazards. Int. Hum. Dimens. Program Update 2001, 1, 8–9. [Google Scholar]
- Cutter, S.L.; Morath, D.P. The evolution of the Social Vulnerability Index. In Measuring Vulnerability to Natural Hazards; Birkmann, J., Ed.; United Nations University Press, forthcoming: Bonn, Germany, 2013; pp. 304–321. [Google Scholar]
- Cutter, S.L.; Boruff, B.J.; Shirley, W.L. Social Vulnerability to Environmental Hazards. Soc. Sci. Q. 2003, 84, 242–261. [Google Scholar] [CrossRef]
- Yeletaysi, S.; Ozceylan, D.; Fiedrich, F.; Harrald, J.R.; Jefferson, T. A framework to integrate social vulnerability into catastrophic natural disaster preparedness planning. In Proceedings of the International Emergency Management Society—TIEMS 16th Annual Conference, Istanbul, Turkey, 9–11 June 2009; pp. 9–11. [Google Scholar]
- Chen, Y.; Boehm, B.W.; Sheppard, L. Value-Adaptive Security Threat Modeling and Vulnerability Ranking. U.S. Patent 8,392,997, 5 March 2013. [Google Scholar]
- Cutter, S.L.; Finch, C. Temporal and spatial changes in social vulnerability to natural hazards. Proc. Natl. Acad. Sci. USA 2008, 105, 2301–2306. [Google Scholar] [CrossRef] [PubMed]
- Borden, K.A.; Schmidtlein, M.C.; Emrich, C.T.; Piegorsch, W.W.; Cutter, S.L. Vulnerability of U.S. Cities to Environmental Hazards. J. Homel. Secur. Emerg. Manag. 2007, 4. [Google Scholar] [CrossRef]
- Raschky, P. Institutions and the losses from natural disasters. Nat. Hazards Earth Syst. Sci. 2008, 8. [Google Scholar] [CrossRef]
- Toya, H.; Skidmore, M. Economic development and the impacts of natural disasters. Econ. Lett. 2007, 94, 20–25. [Google Scholar] [CrossRef]
- Kahn, M. The Death Toll from Natural Disasters: The Role of Income, Geography, and Institutions. Rev. Econ. Stat. 2005, 87, 271–284. [Google Scholar] [CrossRef]
- Peduzzi, P.; Dao, H.; Herold, C.; Mouton, F. Assessing Global Exposure and Vulnerability towards Natural Hazards: The Disaster Risk Index. Nat. Hazards Earth Syst. Sci. 2009, 9, 1149–1159. [Google Scholar] [CrossRef]
- Villagrán de León, J.C. Vulnerability: A Conceptual and Methodological Review; United Nationas University, Institute for Environment and Human Security: Bonn, Germany, 2006; ISBN 978-3-9810582-4-6. [Google Scholar]
- Angeon, V.; Bates, S. Reviewing Composite Vulnerability and Resilience Indexes: A Sustainable Approach and Application. World Dev. 2015, 72, 140–162. [Google Scholar] [CrossRef]
- Cutter, S.L.; Boruff, B.J.; Shirley, W.L. Social vulnerability to environmental hazards. In Hazards Vulnerability and Environmental Justice; Routledge: Londres, UK, 2012; pp. 143–160. [Google Scholar]
- Dwyer, A.; Zoppou, C.; Nielsen, O.; Day, S.; Roberts, S. Quantifying Social Vulnerability: A Methodology for Identifying Those at Risk to Natural Hazards; Geoscience Australia: Canberra, Australia, 2004; ISBN 978-1-920871-09-3. [Google Scholar]
- Welle, T.; Birkmann, J. The World Risk Index—An Approach to Assess Risk and Vulnerability on a Global Scale. J. Extrem. Events 2015, 2, 1550003. [Google Scholar] [CrossRef]
- Hwang, C.-L.; Yoon, K. Multiple Attribute Decision Making: Methods and Applications A State-of-the-Art Survey; Lecture Notes in Economics and Mathematical Systems; Springer: Berlin/Heidelberg, Germany, 1981; ISBN 978-3-540-10558-9. [Google Scholar]
- Behzadian, M.; Khanmohammadi Otaghsara, S.; Yazdani, M.; Ignatius, J. A state-of the-art survey of TOPSIS applications. Expert Syst. Appl. 2012, 39, 13051–13069. [Google Scholar] [CrossRef]
- Zyoud, S.H.; Fuchs-Hanusch, D. A bibliometric-based survey on AHP and TOPSIS techniques. Expert Syst. Appl. 2017, 78, 158–181. [Google Scholar] [CrossRef]
- USGS. English: Shake Map of 2010 Haiti Earthquake. 2010. Available online: https://earthquake.usgs.gov/earthquakes/eventpage/usp000h60h/shakemap/intensity (accessed on 25 February 2020).
- Kolbe, A.R.; Hutson, R.A.; Shannon, H.; Trzcinski, E.; Miles, B.; Levitz, N.; Puccio, M.; James, L.; Noel, J.R.; Muggah, R. Mortality, crime and access to basic needs before and after the Haiti earthquake: A random survey of Port-au-Prince households. Med. Confl. Surviv. 2010, 26, 281–297. [Google Scholar] [CrossRef] [PubMed]
- Doocy, S.; Cherewick, M.; Kirsch, T. Mortality following the Haitian earthquake of 2010: A stratified cluster survey. Popul. Health Metr. 2013, 11, 5. [Google Scholar] [CrossRef] [PubMed]
- Roberts, R. Responding in a Crisis: The Role of National and International Health Workers—Lessons from Haiti; Merlin: London, UK, 2010. [Google Scholar]
- Human Rights Watch (Organization). 2011 Human Rights Watch World Report: Strategies to Save the Planet; Seven Stories; Turnaround Distributor: New York, NY, USA; London, UK, 2011; ISBN 978-1-58322-921-7. [Google Scholar]
- Human Development Index (HDI). Human Development Reports. Available online: http://hdr.undp.org/en/content/human-development-index-hdi (accessed on 25 February 2020).
- Ministry of Public Health and Population [le Ministère de la Santé Publique and de la Population] (MSPP); Haitian Childhood Institute [l’Institut Haïtien de l’Enfance] (IHE); ICF International. 2012 Haïti Mortality, Morbidity, and Service Utilization Survey: Key Findings; MSPP, IHE, and ICF International: Calverton, MD, USA, 2013. [Google Scholar]
- Cayemittes, M.; Placide, M.F.; Mariko, S.; Barrère, B.; Sévère, B.; Alexandre, C. Enquête Mortalité, Morbidité et Utilisation des Services: EMMUS-IV: Haïti: 2005–2006. Available online: http://bases.bireme.br/cgi-bin/wxislind.exe/iah/online/?IsisScript=iah/iah.xis&src=google&base=DESASTRES&lang=p&nextAction=lnk&exprSearch=18482&indexSearch=ID (accessed on 10 April 2020).
- Schmidtlein, M.C.; Deutsch, R.C.; Piegorsch, W.W.; Cutter, S.L. A Sensitivity Analysis of the Social Vulnerability Index. Risk Anal. 2008, 28, 1099–1114. [Google Scholar] [CrossRef] [PubMed]
- Adger, W.N.; Brooks, N.; Bentham, G.; Agnew, M.; Eriksen, S. New Indicators of Vulnerability and Adaptive Capacity; Technical Report 7; Tyndall Centre for Climate Change Research, University of East Anglia: Norwich, UK, 2004. [Google Scholar]
- Fekete, A. Validation of a social vulnerability index in context to river-floods in Germany. Nat. Hazards Earth Syst. Sci. 2009, 9, 393–403. [Google Scholar] [CrossRef]
- Rygel, L.; O’sullivan, D.; Yarnal, B. A Method for Constructing a Social Vulnerability Index: An Application to Hurricane Storm Surges in a Developed Country. Mitig. Adapt. Strat. Glob. Chang. 2006, 11, 741–764. [Google Scholar] [CrossRef]
- de Oliveira Mendes, J.M. Social vulnerability indexes as planning tools: Beyond the preparedness paradigm. J. Risk Res. 2009, 12, 43–58. [Google Scholar] [CrossRef]
- Wood, N.J.; Burton, C.G.; Cutter, S.L. Community variations in social vulnerability to Cascadia-related tsunamis in the U.S. Pacific Northwest. Nat. Hazards 2010, 52, 369–389. [Google Scholar] [CrossRef]
- Finch, C.; Emrich, C.T.; Cutter, S.L. Disaster disparities and differential recovery in New Orleans. Popul. Environ. 2010, 31, 179–202. [Google Scholar] [CrossRef]
- Armaș, I.; Gavriș, A. Social vulnerability assessment using spatial multi-criteria analysis (SEVI model) and the Social Vulnerability Index (SoVI model)—A case study for Bucharest, Romania. Nat. Hazards Earth Syst. Sci. 2013, 13, 1481–1499. [Google Scholar] [CrossRef]
- Martins, V.N.; e Silva, D.S.; Cabral, P. Social vulnerability assessment to seismic risk using multicriteria analysis: The case study of Vila Franca do Campo (São Miguel Island, Azores, Portugal). Nat. Hazards 2012, 62, 385–404. [Google Scholar] [CrossRef]
- Ouma, Y.O.; Tateishi, R. Urban Flood Vulnerability and Risk Mapping Using Integrated Multi-Parametric AHP and GIS: Methodological Overview and Case Study Assessment. Water 2014, 6, 1515–1545. [Google Scholar] [CrossRef]
- Song, J.Y.; Chung, E.-S. Robustness, Uncertainty and Sensitivity Analyses of the TOPSIS Method for Quantitative Climate Change Vulnerability: A Case Study of Flood Damage. Water Resour. Manag. 2016, 30, 4751–4771. [Google Scholar] [CrossRef]
- Chung, E.S.; Abdulai, P.J.; Park, H.; Kim, Y.; Ahn, S.R.; Kim, S.J. Multi-Criteria Assessment of Spatial Robust Water Resource Vulnerability Using the TOPSIS Method Coupled with Objective and Subjective Weights in the Han River Basin. Sustainability 2017, 9, 29. [Google Scholar] [CrossRef]
- Bae, H.J.; Kang, J.E.; Lim, Y.R. Assessing the Health Vulnerability Caused by Climate and Air Pollution in Korea Using the Fuzzy TOPSIS. Sustainability 2019, 11, 2894. [Google Scholar] [CrossRef]
- Shih, H.S.; Shyur, H.J.; Lee, E.S. An extension of TOPSIS for group decision making. Math. Comput. Model. 2007, 45, 801–813. [Google Scholar] [CrossRef]
- Abo-Sinna, M.A.; Amer, A.H. Extensions of TOPSIS for multi-objective large-scale nonlinear programming problems. Appl. Math. Comput. 2005, 162, 243–256. [Google Scholar] [CrossRef]
- Huang, Y.-S.; Li, W.-H. A Study on Aggregation of TOPSIS Ideal Solutions for Group Decision-Making. Group Decis. Negot. 2012, 21, 461–473. [Google Scholar] [CrossRef]
- Govindan, K.; Khodaverdi, R.; Jafarian, A. A fuzzy multi criteria approach for measuring sustainability performance of a supplier based on triple bottom line approach. J. Clean. Prod. 2013, 47, 345–354. [Google Scholar] [CrossRef]
- Lixin, Y.; Ke, C.; Xiaoying, C.; Yueling, S.; Xiaoqing, C.; Ye, H. Analysis of social vulnerability of residential community to hazards in Tianjin, China. Nat. Hazards 2017, 87, 1223–1243. [Google Scholar] [CrossRef]
- Schlotter, M.; Schwerdt, G.; Woessmann, L. Econometric methods for causal evaluation of education policies and practices: A non-technical guide. Educ. Econ. 2011, 19, 109–137. [Google Scholar] [CrossRef]
- Wooldridge, J.M. Econometric Analysis of Cross Section and Panel Data, 2nd ed.; MIT Press: Cambridge, MA, USA, 2010; ISBN 978-0-262-23258-6. [Google Scholar]
- Weitzman, A.; Behrman, J.A. Disaster, Disruption to Family Life, and Intimate Partner Violence: The Case of the 2010 Earthquake in Haiti. Sociol. Sci. 2016, 3, 167–189. [Google Scholar] [CrossRef]
- USGS. the Modified Mercalli Intensity (MMI) Scale assigns intensities as. Available online: https://www.usgs.gov/media/images/modified-mercalli-intensity-mmi-scale-assigns-intensities (accessed on 11 April 2020).
- OECD; European Union; Joint Research Centre. European Commission Handbook on Constructing Composite Indicators: Methodology and User Guide; OECD: Paris, France, 2008; ISBN 978-92-64-04345-9. [Google Scholar]
- Cutter, S.L. GI science, disasters, and emergency management. Trans. GIS 2003, 7, 439–446. [Google Scholar]
- De Silva, M.M.G.T.; Kawasaki, A. Socioeconomic Vulnerability to Disaster Risk: A Case Study of Flood and Drought Impact in a Rural Sri Lankan Community. Ecol. Econ. 2018, 152, 131–140. [Google Scholar] [CrossRef]


| Indicator | Variables | Description | Increases (+) or Decreases(−) Social Vulnerability |
|---|---|---|---|
| Socioeconomic status | Head of education level | Qualitative variable that indicates that the head of the family has a level of primary or lower, secondary or high education. | Little education (+) Highly educated (−) |
| Wealth. | Quintile of wealth. | Low income or status (+) | |
| Busy family | Dumy variable that takes the value 1 if there are occupied in the family, 0 otherwise. | Employment loss (+) | |
| Single sector unit | Agricultural family | Dichotomous variable that takes the value 1 if the employment sector is agriculture, 0 otherwise. | Workers engaged in agriculture (+) |
| Urban/Rural | Place of residence | Dumy variable that takes the value 1 if the place of residence is urban, 0 otherwise | Rural (+) Urban (−) |
| Familiar structure | Marital status | Dummy variable that takes the value 1 if the woman is married or has a partner, 0 otherwise | Single-parent households (+) |
| Number of family members | Number of family unit members | Large families (+) | |
| Percentage under 5 years old | Percentage of children under 5 years of age | High birth rates (+) | |
| Age | Age, head of household | Qualitative variable indicating that the head of the family belongs to one of the age strata, under 65 years of age, 65 to 75 years of age and over 75 years of age. | Elderly (+) |
| Built environment | Water supply | Qualitative variable that identifies the difficulties of access to the water supply. | Worst environment built (+) |
| Type of bathroom-toilet | Qualitative variable that indicates the type of bathroom-toilet and wastewater evacuation that the house has. | ||
| Electricity | Dummy variable that takes the value 1 if the house has electricity, 0 otherwise. | ||
| Construction materials | It refers to the type of construction materials of roof walls and floor of the house. |
| Región | Average Mercalli Score | Typical Deviation |
|---|---|---|
| Nord | 4.70 | 0.55 |
| Grand’anse | 4.71 | 0.14 |
| Nord-Est | 4.79 | 0.05 |
| Nord-Ouest | 4.80 | 0.30 |
| Artibonite | 5.17 | 0.33 |
| Sud | 5.32 | 0.66 |
| Centre | 5.33 | 0.33 |
| Nippes | 5.60 | 2.26 |
| Sud-Est | 6.44 | 1.86 |
| Ouest | 7.97 | 1.42 |
| Dimensions | Variables | Categories | 2005–2006 | 2012 | |||
|---|---|---|---|---|---|---|---|
| Number of Cases | Frequency | Number of Cases | Frequency | ||||
| Sociodemographic characteristics | Marital status | Not in acouple | 291 | 8.63 | 390 | 8.84 | |
| In a couple | 3082 | 91.37 | 4021 | 91.16 | |||
| Place of residence | Rural | 1981 | 58.73 | 2672 | 60.53 | ||
| Urban | 1392 | 41.27 | 1742 | 39.47 | |||
| Age head of household | Under 65 | 3328 | 98.67 | 4351 | 98.57 | ||
| Between 65 and 75 years old | 21 | 0.62 | 42 | 0.95 | |||
| Over 75 years old | 24 | 0.71 | 21 | 0.48 | |||
| Continuous variables | Mean | Std. Dev. | Mean | Std. Dev. | |||
| Number of family members | 5.4455 | 2.2752 | 5.2251 | 2.2280 | |||
| Percentage under 5 years old | 18.4213 | 16.8150 | 17.1600 | 16.8150 | |||
| Variables | Categories | 2005–2006 | 2012 | 2005–2006 | 2012 | ||
| Number of Cases | Frequency | Number of Cases | Frequency | ||||
| Socioeconomic status | Family head of education level | No education | 1115 | 33.06 | 1014 | 22.97 | |
| Primary | 1327 | 39.34 | 1760 | 39.64 | |||
| High school | 834 | 24.73 | 1372 | 31.08 | |||
| High | 97 | 2.88 | 268 | 6.07 | |||
| Busy family | Busy | 3287 | 97.45 | 4291 | 97.21 | ||
| Not busy | 86 | 2.55 | 123 | 2.79 | |||
| Agricultural family | Agricultural sector | 1816 | 53.84 | 2148 | 48.66 | ||
| No agricultural sector | 1557 | 46.16 | 2266 | 51.34 | |||
| Wealth | Very poor | 789 | 23.39 | 1047 | 23.70 | ||
| Poor | 634 | 18.80 | 869 | 19.69 | |||
| Medium | 715 | 21.20 | 865 | 19.60 | |||
| Rich | 723 | 21.43 | 918 | 20.80 | |||
| Very rich | 512 | 15.18 | 716 | 16.22 | |||
| Variables | Categories | 2005–2006 | 2012 | 2005–2006 | 2012 | ||
| Number of Cases | Frequency | Number of Cases | Frequency | ||||
| Built environment | Water supply | External supply or natural resources | 1947 | 57.72 | 3130 | 70.91 | |
| Running water outside of the house | 1353 | 40.11 | 1245 | 28.21 | |||
| Type of bathroom-toilet | Running water in housing | 73 | 2.16 | 39 | 0.88 | ||
| In situ | 194 | 5.75 | 360 | 8.16 | |||
| Pit latrine | 2754 | 81.65 | 4001 | 90.62 | |||
| Conventional | 425 | 12.60 | 54 | 1.22 | |||
| Electricity | Does not have | 2429 | 72.01 | 2981 | 67.54 | ||
| Has | 944 | 27.99 | 1433 | 32.46 | |||
| Construction materials | Floor | Land/manure | 1421 | 42.13 | 1858 | 42.09 | |
| Wood/palm/bamboo | 14 | 0.42 | 10 | 0.23 | |||
| Cement/ceramic-parquet | 1938 | 57.46 | 2546 | 57.68 | |||
| Walls | Without partitions, cane/palm | 671 | 19.89 | 673 | 15.25 | ||
| Cane/palm/logs/stone with mud | 563 | 16.69 | 817 | 18.51 | |||
| Conventional | 2139 | 63.42 | 2924 | 66.24 | |||
| Ceiling | Roofless/straw | 432 | 12.81 | 423 | 9.58 | ||
| Bamboo mat/wood planks | 38 | 1.13 | 222 | 5.03 | |||
| Metal/Cement Fiber | 2903 | 86.07 | 3769 | 85.39 | |||
| Descriptive Statistics | Control Group | Tratament Group | ||
|---|---|---|---|---|
| 2005–2006 | 2012 | 2005–2006 | 2012 | |
| Mean | 0.85137 | 0.69369 | 0.85184 | 0.68318 |
| Median | 0.85232 | 0.84800 | 0.85264 | 0.84773 |
| Maximum | 0.85684 | 1.00000 | 0.85684 | 0.85683 |
| Minimum | 0.81052 | 0.49670 | 0.80370 | 0.47612 |
| Std. Dev. | 0.00487 | 0.17626 | 0.00462 | 0.17523 |
| Observations | 1224 | 1418 | 2149 | 2995 |
| Dependent Variable: (Social Vulnerability) | ||||
|---|---|---|---|---|
| Variable | Coefficient | Std. Error | t-Statistic | Prob. |
| C | 0.851524 | 0.005524 | 154.1580 | 0.0000 |
| D1 | 0.000849 | 0.004252 | 0.199690 | 0.8417 |
| D2 | −0.000491 | 0.011331 | −0.043289 | 0.9655 |
| SH | 0.000413 | 0.005374 | 0.076835 | 0.9388 |
| t | −0.199860 | 0.007425 | −26.91671 | 0.0000 |
| D1 × t | 0.030653 | 0.006800 | 4.508103 | 0.0000 |
| D2 × t | 0.118791 | 0.012086 | 9.829164 | 0.0000 |
| SH × t | 0.036803 | 0.006723 | 5.474370 | 0.0000 |
| R-squared | 0.225155 | Mean dependent var | 0.540902 | |
| Adjusted R-squared | 0.224458 | S.D. dependent var | 0.596215 | |
| S.E. of regression | 0.115175 | Akaike info criterion | −1.483702 | |
| Sum squared resid | 103.1905 | Schwarz criterion | −1.476551 | |
| Log likelihood | 5784.794 | Hannan-Quinn criter. | −1.481251 | |
| F-statistic | 322.9186 | Durbin-Watson stat | 0.213074 | |
| Prob(F-statistic) | 0.000000 | Weighted mean dep. | 0.794292 | |
| Dependent Variable: (Social Vulnerability) | ||||
|---|---|---|---|---|
| Variable | Coefficient | Std. Error | t-Statistic | Prob. |
| C | 0.851534 | 0.016511 | 51.57318 | 0.0000 |
| I | 8.27 × 10−05 | 0.002905 | 0.028465 | 0.9773 |
| SH | 0.000412 | 0.005364 | 0.076793 | 0.9388 |
| t | −0.379539 | 0.019047 | −19.92657 | 0.0000 |
| I × t | 0.037289 | 0.003146 | 11.85173 | 0.0000 |
| SH × t | 0.036848 | 0.006708 | 5.493126 | 0.0000 |
| R-squared | 0.227563 | Mean dependent var | 0.540902 | |
| Adjusted R-squared | 0.227066 | S.D. dependent var | 0.596215 | |
| S.E. of regression | 0.114981 | Akaike info criterion | −1.487328 | |
| Sum squared resid | 102.8699 | Schwarz criterion | −1.481965 | |
| Log likelihood | 5796.911 | Hannan-Quinn criter. | −1.485490 | |
| F-statistic | 458.4622 | Durbin-Watson stat | 0.215105 | |
| Prob(F-statistic) | 0.000000 | Weighted mean dep. | 0.794292 | |
© 2020 by the authors. Licensee MDPI, Basel, Switzerland. This article is an open access article distributed under the terms and conditions of the Creative Commons Attribution (CC BY) license (http://creativecommons.org/licenses/by/4.0/).
Share and Cite
Llorente-Marrón, M.; Díaz-Fernández, M.; Méndez-Rodríguez, P.; González Arias, R. Social Vulnerability, Gender and Disasters. The Case of Haiti in 2010. Sustainability 2020, 12, 3574. https://doi.org/10.3390/su12093574
Llorente-Marrón M, Díaz-Fernández M, Méndez-Rodríguez P, González Arias R. Social Vulnerability, Gender and Disasters. The Case of Haiti in 2010. Sustainability. 2020; 12(9):3574. https://doi.org/10.3390/su12093574
Chicago/Turabian StyleLlorente-Marrón, Mar, Montserrat Díaz-Fernández, Paz Méndez-Rodríguez, and Rosario González Arias. 2020. "Social Vulnerability, Gender and Disasters. The Case of Haiti in 2010" Sustainability 12, no. 9: 3574. https://doi.org/10.3390/su12093574
APA StyleLlorente-Marrón, M., Díaz-Fernández, M., Méndez-Rodríguez, P., & González Arias, R. (2020). Social Vulnerability, Gender and Disasters. The Case of Haiti in 2010. Sustainability, 12(9), 3574. https://doi.org/10.3390/su12093574