Abstract
Considering the importance of foreign direct investment (FDI) inflows for the sustainable economic advancement of a host country, this paper investigates the financial development and FDI nexus, using institutional quality as a moderator. The sample consists of 79 Belt and Road Initiative (BRI) partner countries, as these countries are entering a new age of integration, foreign trade, and mutual development. The empirical findings of conventional and robust estimators show that the financial development of BRI host countries significantly attracts FDI, while the institutional quality plays a significant moderating role in this relation. The in-depth analysis offers the insight that financial markets are less attractive to FDI relative to financial institutions. Thus, policymakers are advised to uphold sound financial institutions to make the country more attractive to overseas investors, while concentration on financial markets may multiply the benefits of FDI. The results are robust to alternative proxies of the key variables and alternative methodologies.
1. Introduction
Foreign direct investment (FDI) is most often seen as a major blessing to an economy [1,2,3], ceteris paribus. Believing in the role of FDI in achieving economic prosperity, researchers and policymakers search for the determinants or, in other words, the attractors of FDIs. Although many factors as attractors of FDI are emphasized, the impact of financial development (FD) has been the least explored in the financial and FDI literature. While FD is regarded as the increased provision of financial goods and services by a country to its citizens and enterprises [4,5], a developed financial system primarily works as a symbol of trust to foreign investors [6]. Most importantly, the financial system works as a resource allocator and provides information, as well as operating as a cost-reduction mechanism [7]. Researchers agree that real sustainable benefit from FDI can only be achieved when a host country has a developed financial system [8,9].
A country’s financial system has been regarded as a crucial factor for sustainable economic advancement [10,11], which is largely based on the rules, social norms, and law and order situation [12,13] of a country. For example, if a country is strict in implementing its contract laws, property rights, and investor protection rules, and has created good social norms, the country is expected to have a good financial system as well, because the rules and norms are reflected in the formulation of the different rules and regulations relevant to the financial system; this is broadly known as institutional quality (IQ). Empirical studies addressing the FD–FDI relationship are very few, and the moderating role of IQ in this relation has not so far been noticed.
According to North [14], the citizens’ formal and informal behavior in a country forms the IQ of that country. The formal part is the rules and laws, the investor and property rights protection mechanism, and the governmental system of the country, while the informal part consists of peoples’ usual behavioral culture, which is formed in accordance with the historical behavioral trend. For example, if a country has a long history of the strict practice of rules and laws in such a way that no political or other types of influences can bias the bureaucratic and judicial system, the people will tend to commit fraud and deception to a lesser extent. This will result in the due execution of contract enforcement, and property and investor rights protection, and so the financial system is expected to be positively impacted. Hodgson [15] regarded institutions as a social phenomenon as they provide the rules of the game, which organizations and entrepreneurs are required to maintain [14,15].
We use IQ as a force which moderates the FD–FDI relationship mainly for two reasons. Firstly, the financial system of a country is closely associated with the transparency and reliability of financial transactions and contract enforcement, all of which are only possible when the country has institutions of satisfactory quality. IQ can establish the rule of law, ensure property rights protection, control corruption, and minimize uncertainty in the business environment, and hence boost investor confidence [16,17,18,19]. Secondly, countries with better IQ are more attractive to foreign investors [20,21]. Good quality institutions provide a better absorptive capacity [22], which is recognized as a fair precondition of the FDI attractiveness of a country [23]. On the contrary, poor IQ is likely to create several hindrances to FDIs, since poor IQ functions as a tax and make investments costly, increases uncertainty [24] due to a lack of investor rights protection, and increases the volatility of FDI inflows [20]. While there is a dearth in the literature on the moderating role of IQ in the relationship between FD and FDI, Aibai, et al. [25] found a significant moderating role of IQ in this relationship.
Given the importance of financial sector development for FDI, this paper looks into FD–FDI relations, while investigating the moderating effect of IQ on these relations, since institutional behavior and the culture of an economy significantly impact on shaping the financial system of that country. To investigate the relations, we employ a 79–country sample from Belt and Road (BRI) partner countries (Appendix A Table A1). The Belt and Road network consists of the “the Silk Road economic belt” and the “21st–century maritime Silk Road”. After the initiation of the project by President Xi Jinping of China, this project has involved over 100 countries as partners who are motivated towards mutual development and to become a new group of countries [26], although most of these countries have a relatively underdeveloped financial system [25]. We analyze the data with standard procedures (pooled OLS, fixed and random effect models, and generalized methods of moments). Our study employs world governance indicators (WGI) provided by the World Bank [27,28] and political risk indicators provided by the International Country Risk Guide (ICRG) of the Political Risk Service group [29] as measures of IQ. We use the financial development index from the IMF [30,31] as a proxy of FD. The moderation effect is judged using interaction terms of IQ and FD variables.
To check the relationships in a baseline analysis, we used the WGI indicators and generated a composite index combining all six indicators from the WGI using principal component analysis (PCA). However, we did not exclude the individual indicators from the analysis, but rather considered each one as an alternative proxy, in order to acquire a deeper analysis. The analysis of the study reveals that there is an undoubted existence of the moderation effect of IQ in the FD–FDI relationship. Furthermore, we employed several robustness check strategies. Firstly, we replaced the IQ variable from WGI with the ICRG (which has 12 individual indicators) and followed a similar procedure to judge the relationship. Secondly, we replaced our FD variable (FDx) with segmented sectors such as the financial institution development index (FIx) and the financial market development index (FMx). Thirdly, we replaced the human capital variable, life expectancy at birth, with the employability ratio of the population as estimated by the International Labor Organization.
In an overall sense, we found consistent robust evidence that IQ significantly and positively moderates the FD–FDI relation while the FD–FDI relationship remains significantly positive. However, we found evidence that the relationship is reasonably weak when the financial market development is considered to take the place of financial development, even though the relationship with financial institutions is consistent with overall financial sector development. Moreover, our findings show that human capital is negatively associated with FDI attractiveness, something which is supported by recent literature [6]. This may occur due to the presence of an unskilled or inappropriately skilled (i.e., not skilled in the required tasks) labor force in BRI partner countries [6]. This finding is also robust to the alternative measures of FD, IQ, and human capital variables, and alternative estimators. Thus, our study suggests that policymakers should put emphasis on the maintenance and improvement of IQ in terms of law enforcement, enhancing administrative capacity, control of corruption, practicing democracy, reducing conflicts and tension, controlling political use of Governmental resources and so forth. At the same time, the study advises policymakers to formulate needs-based human resource development strategies. The study also advises policymakers to focus on financial market development while maintaining the development of financial institutions. All these suggestions are based on empirical findings with the aim of making the economy more attractive for foreign investors and, hence reaping real economic growth.
Our research contributes to the body of financial economics literature in several ways. Firstly, to our best knowledge and having searched the relevant literature, this is the first attempt to clarify the phenomena of the moderation effect of IQ in a finance–FDI relationship. Secondly, the research is conducted using BRI countries as the sample for empirical testing, which is an important contribution to the literature because the BRI is a combination of divergent countries which brings together economies with different locations (mostly from Asia, Europe, Africa, and Latin America) and institutional bases. Thirdly, in this research, we employ the most comprehensive proxy for FD—the financial development index [32], as developed by the IMF [33]—which covers the depth, access, and efficiency of financial markets and institutions. Thus, unlike the traditional proxies of finance, we cover the multidimensionality and complexity of the financial system by utilizing the financial development index. Lastly, we employ two alternative institutional proxies—governance indicators and political risk indicators. To check the overall effect of the IQ, we combine the indicators into composite indexes that maintain the maximum possible variance from the original indicators, and, thus, we can check the overall impact of the variables without losing any dimensions.
The next section of the paper elaborates on the materials and methods used for the investigation, including variable and data description, the sample, the time, and the estimation strategies used. Section 3 incorporates the results and explanation of these from empirical tests. Section 4 provides specific suggestions and concluding remarks.
2. Materials and Methods
2.1. Variables and Data
In line with the research objective, we use the stock of FDI inflows as our dependent variable. It is important to consider that the financial system is not something that develops overnight. It takes time, as such kinds of developments are the result of several policy formulations and changes, and their application. Thus, it is logical to think that the annual FDI account is not able to capture the impact of FD on FDI attraction. The previous literature suggests that the stock of FDI is capable of capturing the scenario in the long run [34,35,36].
Researchers in the new institutional economics consider that ensuring quality institutions can guide a country to a better law and order environment and can uphold the financial system of the country, which makes foreign investors confident in investing in the country [37]. Hence, we use FD as the key explanatory variable to attract FDIs, with a moderation role of IQ. It is widely acknowledged that financial development is a complex and multidimensional [32] issue that should be measured with utmost care. Previous literature has measured the issue with different bank-based or market-based proxies such as domestic credits provided to the private sector as a ratio of GDP [38,39,40,41,42,43,44,45,46,47,48,49,50,51,52], domestic credit provided to private sector by banks and other financial institutions [40,43,45,48,51,53,54,55], deposit money bank claims over deposit money bank and central bank claims [39,41,49,52,56,57,58], liquid liabilities [39,41,44,48,49,52,54,56,57,58], monetary aggregates such as narrow money and broad money [38,43,46,53,59,60], stock market capitalization as a ratio of GDP [38,39,40,41,42,43,44,45,49,52,55,56,57,58,61], stock market turnover of domestic shares [39,42,43,44,49], stock value traded [38–41, 49,52,56,58], private bank credit over bank deposits [57]. Some researchers have endeavored to combine multiple proxies taken from banking sector indicators or stock market indicators, or a combination of both, using principal component analysis to make a better representation [57]. However, each of these measures has certain shortcomings and is subject to criticisms. Svirydzenka [30] mentioned this traditional measure as obsolete as well, as it does not cover the multidimensionality of the financial system and thus undermines the weight of the system [32].
Moving away from what has been discussed above, a staff discussion at the International Monetary Fund [62] proposed a new broad-based index of financial development, which is further formalized by Svirydzenka [30]. The index is indeed a combination of 20 indicators, including financial institutions (banking and non–banking sector) as well as financial market (the stock market) indicators. Thus, financial institutions and markets are two sub-indices of the overall financial development index. Each of the sub-indices is further subdivided into depth, access, and efficiency sub-indicators. As a result, it can be clearly understood that this index better represents the financial system of an economy. A few researchers (e.g., for example [32,63]) have recently recommended this index for empirical studies. The current study considers this index to be a proxy for the deepening of the financial system.
The current research, for clarity and brevity, uses formal institutions as the representative of human interactions. We represent formal institutions with two frequently used datasets. (1) The worldwide governance indicator generated by Kaufman, Kraay and Mastruzzi [28] is a frequently used dataset for measuring the IQ of a country, and contains six–dimensions: control of corruption, government effectiveness, political stability and absence of violence/terrorism, regulatory quality, rule of law, voice and accountability. These indicators are reduced—in conjunction with a large variety of data—to a smaller number of indices that measure separate but interconnected issues regarding the quality of governance [64]. (2) The political risk indicators are introduced via the International Country Risk Guide (ICRG) of the Political Risk Service (PRS) group. The indicators of political risk index are government stability, socioeconomic conditions, investment profile, internal conflict, external conflict, corruption, military in politics, religious tensions, law and order, ethnic tensions, democratic accountability, and bureaucracy quality”. The indicators are rated differently, for example, the first five indicators take a range of points from 0 to 12 while the rest range from 0 to 4 and 0 to 6 points. A higher point for any of these indicators indicates a low risk, while a higher risk is indicated by a lower point score.
Aligned with previous literature, we use the following controls; human capital—understood as the skilled labor force—can make a country attractive to foreign investors as a major source of absorptive capacity for example [65,66,67,68]; real GDP per capita is often used as a proxy for the income level of citizens [38] and a higher purchasing power represents a wider market to the investors [38,49,59,69]; inflation (proxied by the consumer price index) represents the macroeconomic stability of the host country [25,39,41,46,47,49,54,58,66]; domestic investment (proxied by gross fixed capital formation) and FDI work in a complementary relationship with each other [38,54]; openness to trade is computed as the sum of exports and imports as a ratio of GDP [70] because a country which is open to foreign trade is expected to formulate policies favourable to foreign investors and protect their investments for example [39,41,71,72]); population is representative of market size because a larger population is always representative of a large market size as populated countries are meant to have a better market base [43,58,73,74]; initial FDI is included because previous FDI trends most often impact on the future investment decisions of the investors concerned as FDI is mostly believed to be self–reinforcing [38,45], i.e., the previous investors, if satisfied with the business environment of the host country, will tend to increase their investment, and, furthermore, new investors will be attracted in future years, considering investments made by earlier investors as a base of trust in a good business environment.
The selection of sample countries is solely based on data availability, and hence we use panel data comprised of 79 countries from 1999 to 2017. A list of the variables, including their abbreviated names and data sources, is given in Appendix B Table A2.
2.2. Empirical Strategy
Following the literature, to investigate the moderating effect of IQ on finance–FDI relations, we estimate the following functional form equation, which includes the explanatory and control variables.
where
- = Stock of inward foreign direct investment (FDI) per capita in country i and at time t.
- = Financial development in country i and at time t.
- Institutional Quality in country i at time t.
- = Gross domestic product at constant prices per capita in country i and at time t.
- = Macroeconomic stability represented by consumer prices index in country i and at time t.
- = Domestic investment in country i and at time t.
- = Openness to trade in country i and at time t.
- = Infrastructure in country i and at time t.
- = Population in country i and at time t.
The variables are transformed into a natural logarithm, other than those in percentage and ratio form. A common practice in the literature to capture the moderating effect is to form interaction terms of the subject variables [25,43]. We follow a similar strategy and form an interaction term of institutional quality () and financial development to capture the moderating effect of institutional quality on the finance–growth relationship. Thus, our empirical model takes the following primary form:
ln refers to the log transformation in the case of variables, except for those in percentage or fraction forms, and represents the interaction term of finance and IQ. However, as human capital works as one of the most important bases of FD, we also control for the moderating effect of human capital in this relation. Consequently, the general form of our empirical model is the following:
ln refers to the log transformation in cases of appropriate variables, and represents the interaction term. We primarily utilize pooled ordinary least square (POLS), fixed effect (FE), and random effect (RE) modeling to analyze the data for the BRI panel. Most often, panel data is considered to have a low level of bias due to the large number of data points that raise the degree of freedom, and it increases the ability to study the dynamics [75]. We estimate Equation (3) with POLS.
Although panel data estimation raises data points, the inference to be drawn is sensitive to the specification of the model and the methodology used [76]. The panel data estimation cannot appropriately be estimated with the usual OLS estimator [77,78], although the pooled OLS technique can be used as it allows clusters or group settings.
However, a pooled OLS technique may not be efficient to estimate a heterogeneous panel as it ignores cross-section specific effects. For such reasons, some basic assumptions—for example, orthogonality—may be violated. Furthermore, it is acknowledged that the OLS estimation is prone to heteroscedasticity in the case of pooled time series and cross-sectional settings [49,79,80]. This is because the intercept may be identical due to the pooling of data. Thus, the application of the pooled OLS ignores the cross-sectional heterogeneity and considers the intercept as .
Fixed and random effect modeling (FE and RE) can ease the limitations of the pooled OLS to a certain extent. While the panel has a large cross-section, the FE and RE techniques are especially effective. The current research considers primarily 79 countries from the BRI (OBOR) region. Moreover, our panel contains heterogeneity as it includes economies from divergent locations, and with differences in terms of development stages, infrastructure, population, inter alia. In such a case, an unrestricted intercept is more plausible [81]. The following are the general specifications for fixed and random effect models.
Here measures the cross-section specific effect, and represents the general disturbance term. To be more specific, the fixed effect and random effect models can be specified respectively, as follows:
The fixed-effect model examines the difference between country-specific intercepts, and the random effect model estimates the variance components by groups (or time) and the error term. The slopes of the K–vector are assumed to be unchanged in both models. The Hausman test makes a comparison between fixed and random effect models, and the null of the Hausman test is “a difference in coefficients is not systematic.” A significant chi–square leads to the rejection of the null and acceptance of the fixed–effect model, and vice versa.
Finally, because of the potential endogeneity in estimation models, we relied on an instrumental variable approach. As per the theoretical framework of the study, FD may also affect the inflow of foreign funds into an economy, which causes reverse causality [40,45]. To tackle this issue, we try to find instruments that are correlated with the finance variable but not with the error term and estimate Equation (3), as mentioned above, to investigate the finance–FDI relationship while taking IQ as a moderator.
Principal Component Analysis (PCA)
In modern data analysis, principal component analysis (PCA) is well accepted by researchers and used in different areas of research [82,83,84,85,86]. PCA is a non–parametric [87] and multivariate technique [88] that can extract relevant information from a large dataset where observations are generally depicted with several correlated quantitative dependent variables.
Thus a principal component analysis finds components as with a linear combination of of the variables from an original dataset that covers the maximum or optimum variation. PCA covers the maximum variance of the elements of as . The variance proportion of the original variable is covered by the first factors, measured by the sum of the squared factor loading, . If all components are retained, i.e., , it means that all variables of the original dataset are explained, i.e., . According to Kaiser [89], the factor with the eigenvalues of over 1 should be retained for the PCA. Jolliffe [90] suggests that the factors with eigenvalues >0.70 should be retained.
In the current study, we use the correlation matrix to compute PCA. To do so we compute the following equation:
where represents a sample correlation matrix of the variable set from the original dataset, and represents the eigenvalue and the eigenvector, respectively, and is the identity matrix. We utilize the PCA technique to form a single index for both IQ indicators, i.e., governance indicators [28,91] and political risk indicators [29].
3. Results
3.1. Generating Principal Component Using Principal Component Analysis (PCA)
To conduct the PCA with governance indicators, we consider all six indicators contained in the original dataset [28,91]. From the calculation of eigenvalues, we find that the first component among the six bears the value of 4.7398, which alone is capable of explaining 79% variation, while the other indicators have eigenvalues lower than 0.70. The results are reported in the supplementary material (hereafter SM) in Tables S1 and S2, respectively.
On the other hand, for ICRG indicators, we find that the first component bears the eigenvalue of 4.7222 with an explanatory power of 39.35%. The eigenvalues of the second and third principal components are 1.6580 and 1.3413, respectively, and they explain 13.82% and 11.18% of the phenomena, respectively. These three principal components have eigenvalues greater than 1, and cumulatively they explain 64.35% of the variation. However, we also retain the fourth principal component, which has an eigenvalue of over 0.70, following Jolliffe [90]. The four components combined explain 72.34% of the phenomena. The relevant calculation for the principal components and eigenvectors for the ICRG indicators can be found in Tables S3 and S4. However, the scree plots for the WGI and ICRG indicators are presented in Figure 1 and Figure 2, respectively.
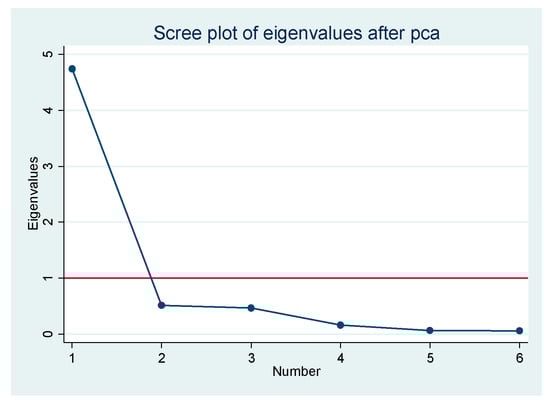
Figure 1.
Scree plot for principal component analysis (PCA) with world governance indicators (WGI).
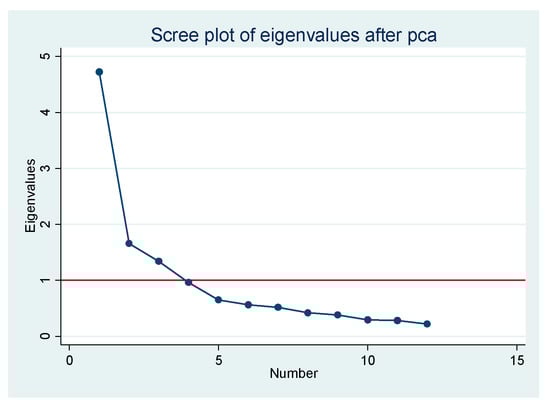
Figure 2.
Scree plot for principal component analysis (PCA) with International Country Risk Guide (ICRG) indicators.
3.2. Summary Statistics of Main Variables
This section presents the summary statistics of the main variables under consideration. Table 1 presents the summary statistics in terms of the mean, the standard deviation, the minimum and the maximum values, and the observation count. We find that most of the variables have 1501 observations for 79 countries over 19 years, from 1999 to 2017. The correlation of the main variables can be seen in Table 2. We find that the dependent variable (FDI) and the main independent variable (FDx) have a reasonable correlation of 0.720 and are acceptable [92,93], which is highly significant at 1% (p < 0.01) and thus can be used for further analysis without any high chance of multicollinearity.

Table 1.
Descriptive statistics of the main variables.
Table 2.
Correlation matrix of main variables.
3.3. Role Of Financial Development (FD) in Attracting Foreign Direct Investment (FDI)—The Moderating Effect of Institutional Quality (IQ)—Baseline Estimations with World Governance Indicators (WGI)
To estimate the relations under consideration, we opt for the generalized methods of moments, which can overcome the limitations of POLS and FE estimations with the application of instruments. We use a two–step system GMM, considering its efficiency over the difference GMM in the presence of endogeneity and fixed effects [94,95]. The estimation results can be seen in Table 3.
Table 3.
Impact of financial development (FD) on foreign direct investment (FDI)—moderating effect of IQ (system GMM estimation).
In Table 3, we find that FD has a significant and positive role in attracting FDI. The effect of finance on attracting FDI is such that if the FD is achieved by one unit there will be an increase of FDI into the economy of close to 1 percentage point (p < 0.05) when the overall moderation effect of the relationship is estimated. The results can be seen in column 1. In the same way, the finance–FDI coefficients when individual WGI indicators such as “control of corruption, government effectiveness, political stability, and absence of violence/terrorism, regulatory quality, rule of law, voice and accountability” are considered, are 1.126 (p < 0.01), 0.902 (p < 0.1), 1.797 (p < 0.01), 0.242 (p < 0.1), 0.946 (p < 0.05) and 1.388 (p < 0.01), respectively.
The other important aspect of this analysis is the moderating effect of IQ in the finance–FDI relation, which is measured by an interaction term of FD and IQ variables. The moderating variable (interaction term) shows a positive and significant effect. In the first column, we can notice that the interaction of overall IQ and FD has a significant positive coefficient. The lag dependent variable shows a positive coefficient that is significant at the 1% level, which is to be expected [38,45]. The income variable, measured as real GDP per capita, has highly significant (p < 0.01) and positive coefficients in all the alternative models, which is in line with economic theories of FDI and is consistent with the findings of Nkoa [38], Otchere, Soumaré and Yourougou [39], Al Nasser and Gomez [49], and Asiedu [69]. The sign of the domestic investment variable is positive and highly significant. This means that domestic investment in BRI countries is not a supplement to FDI inflows, but rather a complement, i.e., more domestic investment will make the country more attractive to foreign investors. This is probably because domestic investments develop the country’s infrastructure and may create a positive and sustainable business environment in the host country. The findings are consistent with the findings in the literature for example [38,54,96].
It is generally expected and evident in the literature that a country’ openness to trade is prone to attract foreign investment to the country [39,41,53,71,72]. In our case, we find the same phenomenon with positive and highly significant coefficients (p < 0.01), regardless of the proxy for IQ. The infrastructure of a country is a major requirement for making a sound business environment and is equally important to foreign and domestic private investors. Developed infrastructure facilitates the exchange of goods and services with both foreign and domestic suppliers and customers at a reduced cost [97]. The present research finds that its findings regarding infrastructure are in a similar vein to the previous literature as it finds a positive and highly significant coefficient in all cases irrespective of the proxy used for IQ. Moreover, market size is also important to foreign investors. The greater the population, the better chance there will be that the investment firm has a market for its products in the host country. Our finding states that in the case of BRI countries, this relation is in line with the literature [43,53,58,73,74] and is such that the attraction of FDI inflows varies positively with the population of the host country.
The human capital variable itself and its interaction term with IQ have a negative sign (p < 0.01). This means that with an increase in human capital, FDI inflows decrease. This finding is in line with Nkoa [38] and a more recent study of [6] and may be caused by the poor level of human capital in the countries under study, i.e., BRI partner countries. Furthermore, it is also somewhat surprising that the macroeconomic stability variable—inflation—shows a positive and significant coefficient. This may occur due to the low level of the development of the financial system of BRI countries and reverse effects [97,98,99,100,101].
The post estimation tests, determine the fitness of our estimator(s); these include AR1, AR2, and the Sargan and Hansen test of over-identification restrictions. Thus, we can infer that as there is no second-order autocorrelation and the instruments are valid, which implies that the model is robust and findings for decision–making purposes.
As part of our baseline estimations, we also apply the pooled OLS and fixed effect model based on the Hausman test, which is consistent. For brevity, we will not give the results here, but include them in the supplementary material (please see Table S5 for POLS results, Table S6 for FE estimation results, and Table S7 for Hausman test results).
3.4. The Role of Financial Development (FD) in Attracting Foreign Direct Investment (FDI)—The Moderating Effect of Institutional Quality (IQ)—Robustness Checks
To check the strength of our baseline estimations, i.e., to check the robustness of our empirical results in the previous sub–section, we conducted a triple set of robustness checks. Firstly, we used a different set of IQ variables or proxies. Here, we used political risk indicators generated by institutional country risk guides provided by the political risk services group. Secondly, we looked into the segmented dimensions of FD and investigated the phenomena with financial institution development and financial market development. Thirdly, as in our baseline analysis, we found that human capital is negatively associated with FDI attraction as a control variable, so we re–examined the relation with a different proxy of human capital.
3.4.1. Robustness Check with Political Risk Indicators from ICRG
We apply a similar procedure to conduct a robustness check with political risk indicators as an alternative proxy to IQ. The results from the two-step system GMM are illustrated in Table 4 (the other estimation and test results may be provided upon request). The table shows that the coefficients of the explanatory variable FDx are positive and significant in all the thirteen alternative models, where the first model in the first column measures the FD–FDI relations with the moderating effect of IQ measured by political risk indicators from ICRG. The second to thirteenth columns, which measure the same phenomena, taking individual risk indicators as the IQ proxy, are bureaucracy quality, corruption, democratic accountability, ethnic tensions, external conflict, government stability, internal conflict, investment profile, law and order, military in politics, religious tensions, and socioeconomic conditions, respectively. The first column, using the overall composite index of IQ (generated from the combination of ICRG indicators using PCA) shows highly significant (p < 0.01) and positive coefficients of the finance variable, FDx. This result is consistent with the baseline estimations with WGI as an IQ proxy. This means that a country may become attractive to foreign investors if the financial system is sound and developed [38,56], and the country will gain better quality in its institutions.
Table 4.
Impact of FD on the FDI—Moderating Effect of IQ (system GMM estimation—Robustness check with ICRG variables as IQ).
To illustrate the moderation effect of IQ in the present investigation, we find that the moderation effect of IQ to the FD–FDI relationship is very important as we find a highly significant and positive coefficient of the interaction term of FD and overall IQ (named as ICRGpca). The results can be seen in the first column of Table 4.
3.4.2. Robustness Check with Financial Market Development and Financial Institution Development Indexes
The financial system of an economy can generally be segregated in two dimensions: financial markets and financial institutions. The present study, while investigating the moderating effects of IQ on FD–FDI relations, also looks at the segments of the financial system in order to achieve a deeper and clearer understanding. The development of financial institutions and financial markets are measured by the sub-indices of the financial development index (FDx), i.e., the financial institution development index (FIx) and the financial market development index (FMx), as provided by the financial development database of the IMF [30,31].
In these analyses (please see Tables S12 and S13), we find the results to be highly consistent with our baseline findings as the financial institution variable shows highly significant and positive coefficients throughout the models, from the first to the seventh. This finding is of great importance to policymakers since it means that the developed financial institutional base of an economy is an important determinant of FDIs. The moderating effects of IQ are also seen to be significant and positive. In the case of the moderation effect judged by the PCA generated variable and the other six individual indicators of IQ, the coefficients are positive and significant and the interaction terms with FIx also show a significant impact. In terms of other control variables, the results are found to be consistent with our baseline analysis results. Moreover, in line with the baseline estimations and the estimation with ICRG variables as IQ measures, here, we also find the human capital variable to be negative.
In the other part of the current robustness checks conducted here, we measure the financial market (stock market) development with the financial market development index (FMx). The results can be seen in Table S9. These findings are interesting both to policymakers and researchers. The FMx variable shows a mostly positive association with FDI, but the relations are mostly insignificant across the moderation proxy used in the model. To be more specific, while the IQ moderation effect is measured by control of corruption and political stability, the effect of FMx on FDI is slightly significant and positive. When moderation is accounted for by government effectiveness, rule of law, voice, and accountability, the FMx variable shows a positive but insignificant effect, and moderate regulatory quality turns the finance variable in a negative direction. Most importantly, with the overall IQ variable moderation, i.e., moderation with a PCA-generated IQ variable (WGIpca), the effect of FMx becomes positive but loses its significance. At this point, a recommendation for policymakers is to critically evaluate the role of the financial markets and financial institutions and place the relevant emphasis in order to acquire a higher FDI flow. In other aspects, these results are highly consistent with the baseline estimations, as well. For example, the moderation terms (interaction terms) show constantly positive and significant coefficients, and the human capital variable shows a negative sign in the relation. In terms of other control variables, the results are also consistent.
3.4.3. Robustness Check with an Alternative Human Capital Proxy
Throughout our investigation, and regardless of the finance proxy used, we find the presence of negative coefficients for the human capital variable measured by life expectancy at birth. Human capital is of great importance for the phenomena under discussion, especially because human capital is considered to be one of the capacities required to absorb the spillover effects from FDI [3,23,43,73]. At this point in the investigation, we feel it is necessary to use an alternative proxy for human capital and check the robustness of the previous findings. Therefore, we use the employability of the population of a country, as measured by the International Labor Organization, as human capital and re-investigate the baseline estimation with a two-step system GMM estimator. The results (please see Table S14) show that the human capital variable is still negative and mostly significant, which complies with our baseline estimates. Moreover, the finance variable and the interaction terms are also consistent with our baseline estimations. Hence our results can be considered robust once again.
4. Conclusions
This paper empirically investigates the moderation effect of IQ in finance–FDI relations. FDI has, for a long time, been widely accepted as a facilitator for the sustainable growth of an economy.
Given the importance of FDI, economies—especially developing ones—need to attract more FDI. The current research work contributes to the FDI and the financial–economic literature by exploring FD as an attraction factor for foreign investors. While the previous paper empirically investigates the direct potential influence of FD to attract FDI, this paper contributes in a significant way by exploring the moderation effect of IQ on FD–FDI relationships. This is important because institutions play a significant role in formulating the financial system of an economy. Moreover, institutional differences can also lead to differences in the real output of the economy [102].
This paper employs a novel proxy to represent financial system development—the financial development index (FDx), as developed by the IMF [30,31]. The existing debates and criticisms on the frequently used traditional finance proxies are, to a large extent, overcome by this proxy (FDx) as it encompasses the widest dimensionality and complexity [32] of the financial system. Regarding IQ, this study uses two types of indicators. The first is the world governance indicators [28] provided by the World Bank, while the other is the political risk indicators, as developed by the International Country Risk Guide [29]. Here we apply the first for the baseline estimations because it has the best available data, while we use the other for robustness checking of the baseline estimations. We apply two more types of robustness analysis. We use the sub-division of the financial development index and use the financial institution development index (FIx) and the financial market index (FMx) separately to check the relations, taking FIx and FMx as FD proxies. Furthermore, we apply an alternative human capital proxy to cross–verify the robustness of the negative association between human capital and FDI.
The empirical findings reveal that FD still positively and significantly affects FDI in the BRI region. Importantly, the moderation effect of FD and IQ is found to be highly influential in the FD–FDI relation. Our robustness checks also support the baseline findings.
However, the study using the financial market (FMx) as a finance proxy differs from the baseline results. Here we find that coefficients of FMx and other alternative proxies—although mostly positive—to be mostly insignificant, which reveals the lesser importance of financial markets in attracting FDI.
At this point in the discussion, in order to achieve sustainable real sector benefits from FDIs, we suggest that the policymakers of each country should be more concerned about the financial system and the IQ. The BRI leaders and policymakers also can play a significant role in this area as BRI is aimed at mutual achievement and development. More specifically, the region should maintain and further develop its financial system. The developments in IQ, i.e., law and legislation, investor protection, and property rights, will add more value to the financial system to attract FDIs. At the same time, economies should introduce reform policies to make their stock markets more efficient and investment-friendly. Moreover, human capital development strategies should be formulated while keeping the demands from multinationals and other forms of FDI embedded in firms. All these actions may make a country more attractive to foreign investors, which will lead it to acquire more strength to gain adsorptive capacities from the FDI spillover effect and obtain real economic benefits.
Supplementary Materials
The following are available online at https://www.mdpi.com/2071-1050/12/9/3556/s1.
Author Contributions
Conceptualization, M.A.I. and M.A.K.; methodology, M.A.I.; software, M.A.I.; validation, M.A.I. and M.A.K.; formal analysis, M.A.I. and M.A.K.; investigation, W.S. and J.P.; resources, J.O.; data curation, W.S.; writing—original draft preparation, M.A.I. and M.A.K.; writing—review and editing, J.O.; visualization, J.P.; supervision, J.P. and J.O. All authors have read and agreed to the published version of the manuscript.
Funding
This research is self–motivated and received no external funding.
Acknowledgments
This research was funded by the National Research, Development, and Innovation Fund of Hungary grant number Project no. 130377, and was supported by the János Bolyai Research Scholarship of the Hungarian Academy of Sciences.
Conflicts of Interest
The authors declare no conflict of interest.
Appendix A
Table A1.
List of countries under study.
Table A1.
List of countries under study.
| SN | Country Name | SN | Country Name | SN | Country Name | SN | Country Name |
|---|---|---|---|---|---|---|---|
| 1 | Albania | 21 | Czech Rep. | 41 | Korea, Rep. | 61 | Romania |
| 2 | Algeria | 22 | Ecuador | 42 | Kuwait | 62 | Russia |
| 3 | Armenia | 23 | Egypt | 43 | Kyrgyz Republic | 63 | Rwanda |
| 4 | Azerbaijan | 24 | Estonia | 44 | Lebanon | 64 | Saudi Arabia |
| 5 | Bahrain | 25 | Fiji | 45 | Libya | 65 | Senegal |
| 6 | Bangladesh | 26 | Finland | 46 | Madagascar | 66 | Sierra Leone |
| 7 | Barbados | 27 | France | 47 | Malaysia | 67 | Singapore |
| 8 | Bhutan | 28 | Georgia | 48 | Moldova | 68 | Slovenia |
| 9 | Bolivia | 29 | Ghana | 49 | Mongolia | 69 | South Africa |
| 10 | Bosnia and Herzegovina | 30 | Greece | 50 | Morocco | 70 | Sri Lanka |
| 11 | Brunei Darussalam | 31 | Guyana | 51 | Nepal | 71 | Tajikistan |
| 12 | Bulgaria | 32 | Hungary | 52 | New Zealand | 72 | Thailand |
| 13 | Cambodia | 33 | Indonesia | 53 | Nigeria | 73 | Tonga |
| 14 | Cameroon | 34 | Iran | 54 | Macedonia | 74 | Tunisia |
| 15 | Chile | 35 | Israel | 55 | Oman | 75 | Turkey |
| 16 | China | 36 | Italy | 56 | Pakistan | 76 | Ukraine |
| 17 | Colombia | 37 | Jamaica | 57 | Panama | 77 | UAE |
| 18 | Costa Rica | 38 | Jordan | 58 | Philippines | 78 | Vanuatu |
| 19 | Cote d’Ivoire | 39 | Kazakhstan | 59 | Poland | 79 | Vietnam |
| 20 | Croatia | 40 | Kenya | 60 | Portugal |
Appendix B
Table A2.
Variable description.
Table A2.
Variable description.
| Variable name (Short form) | Measurement | Data Source | Expected Sign |
|---|---|---|---|
| The Stock of Inward FDI | Logged values of inward FDI stock per capita in current prices. | [103] | |
| Financial Development Index (FDx) | Index 0–1 | [33] | + |
| Financial Market Index (FMx) | Index 0–1 | [33] | + |
| Financial Institution Index (FIx) | Index 0–1 | [33] | + |
| Human Capital | Life expectancy in total years and Labor force estimate | [104] | +/− |
| Real GDP per capita | 2010 USD | [104] | +/− |
| Inflation (proxied by Consumer Price Index) | Index (2010 = 100) | [104] | +/− |
| Domestic investment (Proxied by Gross Fixed Capital Formation) | % of GDP | [104] | +/− |
| Openness to Trade (TO) | Ratio (Summation of Export and Import over GDP) | [104] | +/− |
| Market Size (Pop) | Logged Number of populations | [104] | +/− |
| Initial FDI | Log of current USD prices. | [103] | + |
| PCA of WGI indicators (WGIpca) | Index | Author | + |
| Control of Corruption (CC) | Index | [91] | +/− |
| Government Effectiveness (GE) | Index | [91] | +/− |
| Political Stability and Absence of Violence/Terrorism (PS) | Index | [91] | +/− |
| Regulatory Quality (RQ) | Index | [91] | +/− |
| Rule of Law (RL) | Index | [91] | +/− |
| Voice and Accountability (VA) | Index | [91] | +/− |
| PCA with ICRG indicators (ICRGpca) | Index | Author | + |
| Government Stability (GS) | Index 0 to 12 scale | [105] | +/− |
| Socioeconomic conditions (SC) | Index 0 to 12 scale | [105] | +/− |
| Investment Profile (IP) | Index 0 to 12 scale | [105] | +/− |
| Internal Conflict (IC) | Index 0 to 12 scale | [105] | +/− |
| External Conflict (EC) | Index 0 to 12 scale | [105] | +/− |
| Corruption (C) | Index 0 to 6 scale | [105] | +/− |
| Military in Politics (MP) | Index 0 to 6 scale | [105] | +/− |
| Religious Tensions (RT) | Index 0 to 6 scale | [105] | +/− |
| Law and Order (LO) | Index 0 to 6 scale | [105] | +/− |
| Ethnic Tensions (ET) | Index 0 to 6 scale | [105] | +/− |
| Democratic Accountability (DA) | Index 0 to 6 scale | [105] | +/− |
| Bureaucracy Quality (BQ) | Index 0 to 4 scale | [105] | +/− |
References
- Iamsiraroj, S. The foreign direct investment–economic growth nexus. Int. Rev. Econ. Financ. 2016, 42, 116–133. [Google Scholar] [CrossRef]
- Carkovic, M.; Levine, R. Does foreign direct investment accelerate economic growth? In Does Foreign Direct Investment Promote Development; Moran, T.H., Graham, E.M., Blomstrom, M., Eds.; Peterson Institute: Washington, DC, USA, 2005; p. 195. [Google Scholar]
- Borensztein, E.; De Gregorio, J.; Lee, J.-W. How does foreign direct investment affect economic growth? J. Int. Econ. 1998, 45, 115–135. [Google Scholar] [CrossRef]
- Gesaka, T.M. Effect Of Financial Deepening On The Performance Of The Youth Enterprise Development Fund; School of Business, University of Nairobi: Nairobi, Kenya, 2013. [Google Scholar]
- Shaw, E.S. Financial Deepening in Economic Development; FAO: Rome, Italy, 1973. [Google Scholar]
- Liu, H.; Islam, M.A.; Khan, M.A.; Hossain, M.I.; Pervaiz, K. Does financial deepening attract foreign direct investment? Fresh evidence from panel threshold analysis. Res. Int. Bus. Financ. 2020, 53, 101198. [Google Scholar] [CrossRef]
- Jiang, C.; Ma, X. The Impact of Financial Development on Carbon Emissions: A Global Perspective. Sustainability 2019, 11, 5241. [Google Scholar] [CrossRef]
- Desbordes, R.; Wei, S.-J. The effects of financial development on foreign direct investment. J. Dev. Econ. 2017, 127, 153–168. [Google Scholar] [CrossRef]
- Mahmood, H.; Furqan, M.; Bagais, O.A. Environmental Accounting of Financial Development and Foreign Investment: Spatial Analyses of East Asia. Sustainability 2018, 11, 13. [Google Scholar] [CrossRef]
- Paun, C.V.; Musetescu, R.C.; Topan, V.M.; Danuletiu, D.C. The Impact of Financial Sector Development and Sophistication on Sustainable Economic Growth. Sustainability 2019, 11, 1713. [Google Scholar] [CrossRef]
- Li, C.; Pervaiz, K.; Asif Khan, M.; Ur Rehman, F.; Oláh, J. On the Asymmetries of Sovereign Credit Rating Announcements and Financial Market Development in the European Region. Sustainability 2019, 11, 6636. [Google Scholar] [CrossRef]
- Fernández González, R.; Arce Fariña, M.E.; Garza Gil, M.D. Resolving Conflict between Parties and Consequences for Foreign Direct Investment: The Repsol–YPF Case in Argentina. Sustainability 2019, 11, 6012. [Google Scholar] [CrossRef]
- Trevino, L.J.; Thomas, D.E.; Cullen, J. The three pillars of institutional theory and FDI in Latin America: An institutionalization process. Int. Bus. Rev. 2008, 17, 118–133. [Google Scholar] [CrossRef]
- North, D.C. Institutions. J. Econ. Perspect. 1991, 5, 97–112. [Google Scholar] [CrossRef]
- Hodgson, G.M. What Are Institutions? J. Econ. Issues 2006, 40, 1–25. [Google Scholar] [CrossRef]
- Law, S.H.; Habibullah, M.S. Financial development, institutional quality and economic performance in East Asian economies. Rev. Appl. Econ. 2006, 2, 201–216. [Google Scholar]
- Kaidi, N.; Mensi, S.; Ben Amor, M. Financial Development, Institutional Quality and Poverty Reduction: Worldwide Evidence. Soc. Indic. Res. 2018, 141, 131–156. [Google Scholar] [CrossRef]
- Khan, M.A.; Kong, D.; Xiang, J.; Zhang, J. Impact of Institutional Quality on Financial Development: Cross–Country Evidence based on Emerging and Growth–Leading Economies. Emerg. Mark. Financ. Trade 2019, 55, 1–17. [Google Scholar] [CrossRef]
- Khan, M.A.; Ilyas, R.M.A.; Hashmi, S.H. Cointegration between Institutional Quality and Stock Market Development. NUML Int. J. Bus. Manag. 2018, 13, 90–103. [Google Scholar]
- Buchanan, B.G.; Le, Q.V.; Rishi, M. Foreign direct investment and institutional quality: Some empirical evidence. Int. Rev. Financ. Anal. 2012, 21, 81–89. [Google Scholar] [CrossRef]
- Masron, T.A.; Nor, E. FDI in ASEAN–8: Does institutional quality matter? Appl. Econ. Lett. 2013, 20, 186–189. [Google Scholar] [CrossRef]
- Jude, C.; Levieuge, G. Growth effect of foreign direct investment in developing economies: The role of institutional quality. World Econ. 2017, 40, 715–742. [Google Scholar] [CrossRef]
- Durham, J.B. Absorptive capacity and the effects of foreign direct investment and equity foreign portfolio investment on economic growth. Eur. Econ. Rev. 2004, 48, 285–306. [Google Scholar] [CrossRef]
- Daude, C.; Stein, E. The quality of institutions and foreign direct investment. Econ. Politics 2007, 19, 317–344. [Google Scholar] [CrossRef]
- Aibai, A.; Huang, X.; Luo, Y.; Peng, Y. Foreign Direct Investment, Institutional Quality, and Financial Development along the Belt and Road: An Empirical Investigation. Emerg. Mark. Financ. Trade 2019, 55, 3275–3294. [Google Scholar] [CrossRef]
- Baloch, M.A.; Zhang, J.; Iqbal, K.; Iqbal, Z. The effect of financial development on ecological footprint in BRI countries: Evidence from panel data estimation. Environ. Sci. Pollut. Res. 2019, 26, 6199–6208. [Google Scholar] [CrossRef]
- Kaufmann, D.; Kraay, A.; Mastruzzi, M. The worldwide governance indicators: Methodology and analytical issues. Hague J. Rule Law 2011, 3, 220–246. [Google Scholar] [CrossRef]
- Kaufman, D.; Kraay, A.; Mastruzzi, M. The Worldwide Governance Indicators Project: Methodology and Analytical Issues. World Bank Policy Res. Work. Pap. 2011, 3, 220–246. [Google Scholar]
- Howell, L.D. ICRG Methodology; Prs Group: Syracuse, NY, USA, 2013. [Google Scholar]
- Svirydzenka, K. Introducing a New Broad–based Index of Financial Development. IMF Work. Pap. WP/16/5. 2016. Available online: https://www.imf.org/external/pubs/ft/wp/2016/wp1605.pdf (accessed on 12 January 2016).
- Sahay, R.; Čihák, M.; N’Diaye, P.; Barajas, A.; Bi, R.; Ayala, D.; Gao, Y.; Kyobe, A.; Nguyen, L.; Saborowski, C. Rethinking financial deepening: Stability and growth in emerging markets, IMF Staff Discussion Note; International Monetary Fund: Washington, DC, USA, 2015; p. 41. ISBN 9781498312615. [Google Scholar]
- Khan, M.A.; Khan, M.A.; Abdulahi, M.E.; Liaqat, I.; Shah, S.S.H. Institutional quality and financial development: The United States perspective. J. Multinatl. Financ. Manag. 2019, 49, 67–80. [Google Scholar] [CrossRef]
- International Monetary Fund. Financial Development Index Database; IMF: Washington, DC, USA, 2019. [Google Scholar]
- Yeboua, K. Foreign direct investment, financial development and economic growth in Africa: Evidence from threshold modeling. Transnatl. Corp. Rev. 2019, 11, 187–189. [Google Scholar] [CrossRef]
- Khan, H.; Khan, U. Financial Development and FDI Inflows in China; Economics Discussion Papers, No 2019–54; Kiel Institute for the World Economy: Kiel, Germany, 2019. [Google Scholar]
- Khan, H.; Khan, U.; Khan, M.A. Causal Nexus between Economic Complexity and FDI: Empirical Evidence from Time Series Analysis. Chin. Econ. 2020, 1–21. [Google Scholar] [CrossRef]
- Khan, M.A.; Máté, D.; Abdulahi, M.; Sadaf, R.; Khan, M.A.; Popp, J.; Oláh, J. Do Institutional Quality, Innovation and Technologies Promote Financial Market Development? Eur. J. Int. Manag. 2019. [Google Scholar] [CrossRef]
- Nkoa, B.E.O. Determinants of foreign direct investment in Africa: An analysis of the impact of financial development. Econ. Bull. 2018, 38, 221–233. [Google Scholar]
- Otchere, I.; Soumaré, I.; Yourougou, P. FDI and financial market development in Africa. World Econ. 2016, 39, 651–678. [Google Scholar] [CrossRef]
- Hanif, A.; Shariff, S.S.M. Relationship Between Foreign Direct Investment and Financial Development. In Proceedings of the 1st AAGBS International Conference on Business Management 2014 (AiCoBM 2014); Springer: Singapore, 2016; pp. 457–467. [Google Scholar]
- Soumaré, I.; Tchana Tchana, F. Causality between FDI and Financial Market Development: Evidence from Emerging Markets. World Bank Econ. Rev. 2015, 29 (Suppl. S1), S205–S216. [Google Scholar]
- Sahin, S.; Ege, I. Financial Development and FDI in Greece and Neighbouring Countries: A Panel Data Analysis. Procedia Econ. Financ. 2015, 24, 583–588. [Google Scholar] [CrossRef]
- Agbloyor, E.K.; Abor, J.Y.; Adjasi, C.K.D.; Yawson, A. Private capital flows and economic growth in Africa: The role of domestic financial markets. J. Int. Financ. Mark. Inst. Money 2014, 30, 137–152. [Google Scholar] [CrossRef]
- Kaur, M.; Yadav, S.S.; Gautam, V. Financial system development and foreign direct investment: A panel data study for BRIC countries. Glob. Bus. Rev. 2013, 14, 729–742. [Google Scholar] [CrossRef]
- Agbloyor, E.K.; Abor, J.; Adjasi, C.K.D.; Yawson, A. Exploring the causality links between financial markets and foreign direct investment in Africa. Res. Int. Bus. Financ. 2013, 28, 118–134. [Google Scholar] [CrossRef]
- Adjasi, C.K.; Abor, J.; Osei, K.A.; Nyavor-Foli, E.E. FDI and economic activity in Africa: The role of local financial markets. Thunderbird Int. Bus. Rev. 2012, 54, 429–439. [Google Scholar] [CrossRef]
- Aggarwal, R.; Demirgüç–Kunt, A.; Pería, M.S.M. Do remittances promote financial development? J. Dev. Econ. 2011, 96, 255–264. [Google Scholar] [CrossRef]
- Abzari, M.; Zarei, F.; Esfahani, S.S. Analyzing the link between financial development and foreign direct investment among D–8 group of countries. Int. J. Econ. Financ. 2011, 3, 148. [Google Scholar] [CrossRef]
- Al Nasser, O.M.; Gomez, X.G. Do well–functioning financial systems affect the FDI flows to Latin America. Int. Res. J. Financ. Econ. 2009, 29, 60–75. [Google Scholar]
- Senhadji, A.S.; Khan, M.S. Financial Development and Economic Growth: A Review and New Evidence. J. Afr. Econ. 2003, 12 (Suppl. S2), ii89–ii110. [Google Scholar]
- Hermes, N.; Lensink, R. Foreign direct investment, financial development and economic growth. J. Dev. Stud. 2003, 40, 142–163. [Google Scholar] [CrossRef]
- Levine, R. Financial development and economic growth: Views and agenda. J. Econ. Lit. 1997, 35, 688–726. [Google Scholar]
- Kutan, A.M.; Samargandi, N.; Sohag, K. Does Institutional Quality Matter for Financial Development and Growth? Further Evidence from MENA Countries. Aust. Econ. Pap. 2017, 56, 228–248. [Google Scholar] [CrossRef]
- Sghaier, I.M.; Abida, Z. Foreign direct investment, financial development and economic growth: Empirical evidence from North African countries. J. Int. Glob. Econ. Stud. 2013, 6, 1–13. [Google Scholar]
- Law, S.H.; Habibullah, M.S. The determinants of financial development: Institutions, openness and financial liberalisation. South Afr. J. Econ. 2009, 77, 45–58. [Google Scholar] [CrossRef]
- Hajilee, M.; Al Nasser, O.M. The relationship between financial market development and foreign direct investment in Latin American countries. J. Dev. Areas 2015, 49, 227–245. [Google Scholar] [CrossRef]
- Bittencourt, M. Financial development and economic growth in Latin America: Is Schumpeter right? J. Policy Modeling 2012, 34, 341–355. [Google Scholar] [CrossRef]
- Alfaro, L.; Chanda, A.; Kalemli–Ozcan, S.; Sayek, S. FDI and economic growth: The role of local financial markets. J. Int. Econ. 2004, 64, 89–112. [Google Scholar] [CrossRef]
- Rousseau, P.L.; Wachtel, P. What is happening to the impact of financial deepening on economic growth? Econ. Inq. 2011, 49, 276–288. [Google Scholar] [CrossRef]
- Choong, C.-K.; Lim, K.-P. Foreign direct investment, financial development, and economic growth: The case of Malaysia. Macroecon. Financ. Emerg. Mark. Econ. 2009, 2, 13–30. [Google Scholar] [CrossRef]
- Tsagkanos, A.; Siriopoulos, C.; Vartholomatou, K. Foreign direct investment and stock market development: Evidence from a “new” emerging market. J. Econ. Stud. 2019, 46, 55–70. [Google Scholar] [CrossRef]
- Sahay, M.R.; Cihak, M.; N’Diaye, M.P.M.; Barajas, M.A.; Pena, M.D.B.A.; Bi, R.; Gao, M.; Kyobe, M.A.J.; Nguyen, L. Rethinking Financial Deepening: Stability and Growth in Emerging Markets; International Monetary Fund: Washington, DC, USA, 2016. [Google Scholar]
- Islam, M.A.; Liu, H.; Khan, M.A.; Reza, S.M.; Yahia, Y.E.; Nasrin, L. Causal Relationship between Economic Growth, Financial Deepening, Foreign Direct Investment and Innovation: Evidence from China. Asian Econ. Financ. Rev. 2018, 8, 1086–1101. [Google Scholar] [CrossRef]
- Langbein, L.; Knack, S. The worldwide governance indicators: Six, one, or none? J. Dev. Stud. 2010, 46, 350–370. [Google Scholar] [CrossRef]
- Cleeve, E.A.; Debrah, Y.; Yiheyis, Z. Human Capital and FDI Inflow: An Assessment of the African Case. World Dev. 2015, 74, 1–14. [Google Scholar] [CrossRef]
- Kar, S. Exploring the causal link between FDI and human capital development in India. Decision 2013, 40, 3–13. [Google Scholar] [CrossRef]
- Nembot Ndeffo, L. Foreign Direct Investments and Human Capital Development in Subsaharan Africa; University of Galati: Galați, Romania, 2010; ISSN 1584-0409. [Google Scholar]
- Lewin, A.Y.; Massini, S.; Peeters, C. Why are companies offshoring innovation? The emerging global race for talent. J. Int. Bus. Stud. 2009, 40, 901–925. [Google Scholar] [CrossRef]
- Asiedu, E. On the Determinants of Foreign Direct Investment to Developing Countries: Is Africa Different? World Dev. 2002, 30, 107–119. [Google Scholar] [CrossRef]
- Fan, H.; Hossain, M.I.; Islam, M.A.; Yahia, Y.E. The Impact of Trade, Technology and Growth on Environmental Deterioration of China and India. Asian Econ. Financ. Rev. 2019, 9, 1–29. [Google Scholar] [CrossRef]
- Cantah, G.W.; Brafu–Insaidoo, G.W.; Wiafe, E.A.; Adams, A. FDI and Trade Policy Openness in Sub–Saharan Africa. East. Econ. J. 2018, 44, 97–116. [Google Scholar] [CrossRef]
- Yusoff, M.B.; Nuh, R. Foreign Direct Investment, Trade Openness and Economic Growth: Empirical Evidence from Thailand. Foreign Trade Rev. 2015, 50, 73–84. [Google Scholar] [CrossRef]
- Agbloyor, E.K.; Gyeke-Dako, A.; Kuipo, R.; Abor, J.Y. Foreign direct investment and economic growth in SSA: The role of institutions. Thunderbird Int. Bus. Rev. 2016, 58, 479–497. [Google Scholar] [CrossRef]
- Alfaro, L.; Chanda, A.; Kalemli–Ozcan, S.; Sayek, S. Does foreign direct investment promote growth? Exploring the role of financial markets on linkages. J. Dev. Econ. 2010, 91, 242–256. [Google Scholar] [CrossRef]
- Hsiao, W.C. Abnormal economics in the health sector. Health Policy 1995, 32, 125–139. [Google Scholar] [CrossRef]
- Kittel, B.; Winner, H. How reliable is pooled analysis in political economy? The globalization-welfare state nexus revisited. Eur. J. Political Res. 2005, 44, 269–293. [Google Scholar] [CrossRef]
- Vuko, T.; Čular, M. Finding determinants of audit delay by pooled OLS regression analysis. Croat. Oper. Res. Rev. 2014, 5, 81–91. [Google Scholar] [CrossRef]
- Wooldridge, J. Multiple regression analysis: Further issues. Introd. Econ. Mod. Approach 2012, 196–198. [Google Scholar]
- Al Nasser, O.M. The Determinants of the U.S. Foreign Direct Investment: Does the Region Matter? Glob. Econ. Rev. 2007, 36, 37–51. [Google Scholar] [CrossRef]
- Jones, L.E.; Manuelli, R.E. Chapter 1 Neoclassical Models of Endogenous Growth: The Effects of Fiscal Policy, Innovation and Fluctuations. In Handbook of Economic Growth; Aghion, P., Durlauf, S.N., Eds.; Elsevier: Amsterdam, The Netherlands, 2005; Volume 1, pp. 13–65. [Google Scholar]
- Hassan, M.K. FDI, Information Technology and Economic Growth in the MENA Region; University of New Orleans: New Orleans, LA, USA, 2003. [Google Scholar] [CrossRef]
- Falqi, I.; Alsulamy, S.; Mansour, M. Environmental Performance Evaluation and Analysis Using ISO 14031 Guidelines in Construction Sector Industries. Sustainability 2020, 12, 1774. [Google Scholar] [CrossRef]
- Jin, Q.; Hu, H.; Kavan, P. Factors Influencing Perceived Crowding of Tourists and Sustainable Tourism Destination Management. Sustainability 2016, 8, 976. [Google Scholar] [CrossRef]
- Pradhan, R.P.; Arvin, M.B.; Hall, J.H. Economic growth, development of telecommunications infrastructure, and financial development in Asia, 1991–2012. Q. Rev. Econ. Financ. 2016, 59, 25–38. [Google Scholar] [CrossRef]
- Eghdami, H.; Azhdari, G.; Lebailly, P.; Azadi, H. Impact of Land Use Changes on Soil and Vegetation Characteristics in Fereydan, Iran. Agriculture 2019, 9, 58. [Google Scholar] [CrossRef]
- Ouyang, Y.; Li, P. On the nexus of financial development, economic growth, and energy consumption in China: New perspective from a GMM panel VAR approach. Energy Econ. 2018, 71, 238–252. [Google Scholar] [CrossRef]
- Shlens, J. A tutorial on principal component analysis. arXiv 2014, arXiv:1404.1100. [Google Scholar]
- Abdi, H.; Williams, L.J. Principal component analysis. Wiley Interdiscip. Rev. Comput. Stat. 2010, 2, 433–459. [Google Scholar] [CrossRef]
- Kaiser, H.F. A note on guttman’s lower bound for the number of common factors 1. Br. J. Stat. Psychol. 1961, 14, 1–2. [Google Scholar] [CrossRef]
- Jolliffe, I. Principal Component Analysis; Springer: Berlin, Germany, 2011. [Google Scholar]
- World Bank. Worldwide Governance Indicators; World Bank: Washington, DC, USA, 2019. [Google Scholar]
- Rahman, M.M.; Ashraf, B.N.; Zheng, C.; Begum, M. Impact of Cost Efficiency on Bank Capital and the Cost of Financial Intermediation: Evidence from BRICS Countries. Int. J. Financ. Stud. 2017, 5, 32. [Google Scholar] [CrossRef]
- Gujarati, D.N. Basic Econometrics; Tata McGraw–Hill Education: New York, NY, USA, 2009. [Google Scholar]
- Sultanuzzaman, M.R.; Fan, H.; Mohamued, E.A.; Hossain, M.I.; Islam, M.A. Effects of export and technology on economic growth: Selected emerging Asian economies. Econ. Res. 2019, 32, 2515–2531. [Google Scholar] [CrossRef]
- Bond, S.R. Dynamic panel data models: A guide to micro data methods and practice. Port. Econ. J. 2002, 1, 141–162. [Google Scholar] [CrossRef]
- Farla, K.; de Crombrugghe, D.; Verspagen, B. Institutions, Foreign Direct Investment, and Domestic Investment: Crowding Out or Crowding In? World Dev. 2016, 88, 1–9. [Google Scholar] [CrossRef]
- Kamal, M.A.; Ullah, A.; Zheng, J.; Zheng, B.; Xia, H. Natural resource or market seeking motive of China’s FDI in asia? New evidence at income and sub–regional level. Econ. Res. 2019, 32, 3869–3894. [Google Scholar] [CrossRef]
- Miniesy, R.S.; Elish, E. Is Chinese outward FDI in MENA little? J. Chin. Econ. Foreign Trade Stud. 2017, 10, 19–43. [Google Scholar] [CrossRef]
- Hurst, L. Comparative analysis of the determinants of China’s state-owned outward direct investment in OECD and non-OECD countries. China World Econ. 2011, 19, 74–91. [Google Scholar] [CrossRef]
- Kolstad, I.; Wiig, A. Is transparency the key to reducing corruption in resource–rich countries? World Dev. 2009, 37, 521–532. [Google Scholar] [CrossRef]
- Buckley, P.J.; Clegg, L.J.; Cross, A.R.; Liu, X.; Voss, H.; Zheng, P. The determinants of Chinese outward foreign direct investment. J. Int. Bus. Stud. 2009, 40, 353. [Google Scholar] [CrossRef]
- Law, S.H.; Azman–Saini, W. Institutional quality, governance, and financial development. Econ. Gov. 2012, 13, 217–236. [Google Scholar] [CrossRef]
- UNCTAD. Foreign Direct Investment: Inward and Outward Flows and Stock, Annual in 2018. Available online: https://unctadstat.unctad.org/wds/TableViewer/tableView.aspx?ReportId=96740 (accessed on 14 April 2020).
- WDI, World Development Indicators. 2018. Available online: https://blogs.worldbank.org/opendata/q1-2018-update-world-development-indicators-available (accessed on 24 April 2018).
- International Country Risk Guide (ICRG) Researchers Dataset. 2019. Available online: https://dataverse.harvard.edu/dataset.xhtml?persistentId=doi:10.7910/DVN/4YHTPU (accessed on 11 August 2019).
© 2020 by the authors. Licensee MDPI, Basel, Switzerland. This article is an open access article distributed under the terms and conditions of the Creative Commons Attribution (CC BY) license (http://creativecommons.org/licenses/by/4.0/).