Opinion

Economic Gain vs. Ecological Pain—Environmental Sustainability in Economies Based on Renewable Biological Resources

Campus Evenstad, Faculty of Applied Ecology, Agricultural Sciences and Biotechnology, Inland Norway University of Applied Sciences, No-2480 Koppang, Norway
*
Author to whom correspondence should be addressed.
Harry P. Andreassen sadly passed away 21 May 2019.
Sustainability 2020, 12(9), 3557; https://doi.org/10.3390/su12093557
Submission received: 30 March 2020 / Revised: 21 April 2020 / Accepted: 24 April 2020 / Published: 27 April 2020
(This article belongs to the Section Environmental Sustainability and Applications)

Abstract

:
There are two main international strategies concerning how to ensure a sustainable environment: one is to develop a globally bio-based economy, or bioeconomy, to meet the increased demand of goods and products to maintain our well-being and to reduce climate change. On the other hand, there is an aim to decrease the negative impacts on nature and natural habitats to conserve and maintain ecosystems and control the loss of biodiversity. There is a trade-off between these two strategies; as we increase the commitment to the bioeconomy by intensifying biomass production, we will simultaneously challenge biodiversity through the increased pressure on, and the utilization of, biological raw materials. Here, we first review and discuss the challenges and opportunities in terrestrial and marine ecosystems for the production of biomass for the bioeconomy. We focus on the trade-offs between economic sustainability on one hand, and environmental sustainability and resilience on the other hand. We conclude with a discussion of the various bioeconomy strategies. Finally, we present a conceptual model on how to sustainably develop the bioeconomies (by introducing the concept of optimizing the economic gain/ecological pain ratio) to be able to manage the biodiversity in a sustainable way.

1. Introduction

The increasing awareness of the adverse effects of climate change is shifting policymakers’ focus from fossil fuels to renewable biological resources, thereby developing bioeconomies [1,2,3]. A bioeconomy includes primary production and industries processing biological resources, such as food industry, fiber, pulp, and paper industries, and parts of the chemical, biotechnological, and energy industries converting biomass to bio-based products and bio-energy. The bioeconomy has been valued at €2 trillion in annual turnover in Europe alone, accounting for more than 22 million jobs [1]. The minimum estimate for the entire biosphere is estimated to be in the range of €15–€50 trillion (1012) per year, with an average of €30 trillion per year [4].
Bioeconomy is based on provisioning the ecosystem services comprising nutrition, materials, and energy [1]. Bioeconomy also exploits cultural ecosystem services economically; for instance, the recreational, health, and tourism industries [5]. The tourism industry (e.g. eco-tourism, skiing, visiting national parks) represents a value of €6.5 trillion worldwide and 266 million jobs [6], in which, eco-tourism is the fastest growing.
In 2012, the European Commission Directorate developed a bioeconomy strategy, which was renewed and updated in 2018 [7,8]. The European Commission expects that a sustainable bioeconomy would strengthen the circular economy by turning bio-waste and residual products into valuable reusable products. The bioeconomy strategy aims to contribute to the fulfillment of the Paris Agreement of a carbon neutral future, building healthy ecosystems that are no longer polluted by plastic or artificial products, and the restoration of already degraded ecosystems [8]. The European bioeconomy strategy also aims at creating 1 million new jobs in 2030 and supporting the European industry to become more cost efficient and produce new and more sustainable bio-based products.
In the upgraded bioeconomy strategy, the EU has included five main objectives to fulfill, and the second objective is managing natural resources sustainably, which includes avoiding ecosystem degradations, and restoring and keeping ecosystem services. Still, the overall aim of the strategy is to: 1) strengthen and scale-up the bio-based sectors, 2) deploy local bioeconomies rapidly across Europe, and 3) understand the ecological boundaries of the bioeconomy [8].
The strong focus on scaling up bioeconomy and growth may require an intensified production of renewable resources. In its most extreme, intensification implies the extensive production of fast-growing biomass in monocultures that are intensively managed with artificial feed or fertilization and the use of alien or genetically modified organisms.
We claim that despite increased monitoring and the increased focus on restoring ecosystem services and biodiversity, a growing bioeconomy may pose a threat to biodiversity.
A further loss of biodiversity to the bioeconomy will be a challenge for regulating and supporting services, comprising the regulation of the local and global climate, CO2 sequestration, the moderation of extreme weather events, the prevention of erosion, pollination, and the biological control of pests and diseases. Piotrowski et al. [9] has made an estimation that the bioeconomy will increase the demand of natural materials with 1–4% annually to 2050, which means that the use of materials in the bioeconomy will increase from 5–10% today to 20–30% in 2050.
The term “biodiversity,” or biological diversity, has been widely used since the Convention on Biological Diversity in Rio (1992), when it was defined as: The variability among living organisms from all sources including, inter alia, terrestrial, marine, and other aquatic ecosystems as well as the ecological complexes of which they are part; this includes diversity within species, between species and of ecosystems [10]. This means that biodiversity can be measured on highly divergent levels, such as diversity of genes, species, habitats, or ecosystem services. While biodiversity may have its own eigenvalue, it is still common to use a monetary value of ecosystem services to quantify the value of biodiversity; i.e. the economic value, the socio-cultural value, and the ecological value [11].
Our concern is that biodiversity conservation is driven by the economic and/or socio-cultural valuation, as they are most connected to ecosystem services, while the ecological value, often defined as an indicator that defines the threshold values required to maintain a healthy environment, is not included in the bioeconomy valuation.
Here, we first discuss the challenges and opportunities in terrestrial and marine ecosystems for the production of biomass, or other ecosystem services for the bioeconomy. Finally, we conclude with a conceptual model on how to sustainably manage the bioeconomies (optimize the economic gain/ecological pain ratio) to be able to also manage the biodiversity, defined as an ecological biodiversity value.

2. Biomass Production in Different Ecosystems

2.1. Global Biomass

Bioeconomies are based on biomass of different kinds, originating mainly from cultivated areas where we can control or intensify production, but also from areas that are not yet cultivated. In total, there are about 550 gigatons [12] of carbon (Gt C) biomass in all kingdoms of life—of which, terrestrial plants are the dominant biomass, with 450 Gt C [13]. Only 5 to 10 billion tons of C are found in the oceans [14]. Animals account for only approximately 2 Gt C and are mainly marine [13]. In ocean systems, the animal biomass is nearly 30 times larger than the plant biomass, and the total world fish biomass in the oceans is only between 0.8 and 2.0 billion tons [15]. However, being only a small part of the total biomass, the fish biomass is a globally important source of protein for animals and humans [15]. Livestock constitutes about 0.1 Gt C and accounts for 60% of terrestrial mammal biomass, and humans themselves comprise about 0.06 Gt C and account for 36% of mammal biomass. Wild mammals comprise only 0.007 Gt C and constitute 4.2% of mammal biomass [13]. In addition, there is live biomass from bacteria that may be as much as that of plants and animals [16].

2.2. Terrestrial Systems

2.2.1. Forest Production

Forests cover only 6% of the Earth (Figure 1), or 31% of the world’s total land areas (about 93% natural forest and 7% cultivated), but account for 90% of the world’s terrestrial biodiversity [17]. They are important biologically, economically, and climatically [17], and provide provisioning ecosystem services, such as clean water, food, and timber, in addition to regulation services, such as climate regulation, pollination, and the prevention of soil erosion. Globally, more than 1.6 billion people depend on forests for fuel, medicinal plants, and subsistence income [18]. Forests hold as much as 46 percent of the world’s terrestrial carbon stores and provide billions of dollars in raw materials for timber, as well as products such as pharmaceuticals, paper, and building supplies. The forestry sector provides formal employment for approximately 14 million people worldwide, and many more are employed in industries related to forest and forest products [18]. The total value of forest ecosystem services is tremendous and not easy to estimate, as the reduction of greenhouse gas emissions alone is estimated to be worth €3.4 trillion [19], and regulating services, such as pollination alone, are estimated to have a value of €153 billion per year [9].
Wood biomass, such as timber and pulp, is the main industrial output from forests, and is renewable if managed sustainably [19]. An increased focus on the bioeconomy may increase the demand for wood biomass. Intensified forest management means planting monocultural stands of native or introduced trees, and the use of multiple silvicultural treatments, such as cleaning, thinning, and fertilization, with potential negative consequences for the ecosystem and biodiversity [21]. Wood production in the boreal forests of Europe is inversely related to forest biodiversity in a gradient of long (Sweden and Finland) to short (northwest Russia) forestry intensification histories [22]. Tropical countries especially have challenges with conserving forest sustainability, with a net forest loss of about 7.6 million hectares yearly in the period 2010 to 2015 [23].

2.2.2. Non-timber Forest Products

Non-timber forest products (NTFPs) are tangible animal and plant products—other than commercial timber and fiber production—that can be collected from the forest [24,25]. They comprise meat, leather, fur, nuts, spices, latex, fruits, vegetables, medicinal plants, honey, wood for handcrafting and tools, ornamental plants, and construction materials [26,27,28]. NTFPs are initially considered as minor or secondary forest products compared to wood production [28,29]. Their use is primarily seen as a local interest with little or no commercial value [30]. NTFPs are, however, the main source of the livelihoods of forest dwelling rural communities, who rely on these products for their food, wellbeing, income, and medicine [28]. About 80% of the developing world depends on the NTFPs for food, medicine, and health promoting needs [26]. In industrialized countries, NTFPs provide significant economic benefits to rural households [29]. In Europe and North America, the demand for medicinal plants has increased due to an increased consumer interest in natural products. Hence, although most of NTFPs are used locally as food and medicine, some of them go to international commercial markets [28].
In 1996, the value of the global market for all medicinal plants was €13 billion, with Europe contributing to half of the trade and Asia contributing to 36% of the market [29]. Other internationally traded NTFPs are natural rubber with a value of €3.9 billion per year, essential oils with a value of €294 million per year, cork with a value of €295 million per year, as well as honey, walnuts, mushrooms, rattan, and Brazil nuts [31]. In general, the larger the market for NTFPs, the higher their value and the more prone to overexploitation [30].
The continuous evaluation and monitoring of the ecological impact of NTFP harvesting may increase sustainable utilization [32]. Increased food production can be effective in reducing the dependence on forest foods from rural households. For example, the introduction of sweet potatoes and manioc in Vanuatu Island reduced the utilization of wild taro, arrowroot, wild yams, and sago [33]. The cultivation of wild plant species of NTFPs with high commercial demand and social value is suggested as a way to reduce the pressure on natural forests [34].
Many wild large herbivore populations have increased dramatically across Europe and North America over the last decennia [35,36]. Wild meat is also a major source of protein and income in the tropics [37], in addition to being a potential substitute for the conventional livestock meat production [38]. Furthermore, the illegal harvesting, trade, overhunting, and poaching of wildlife is potentially causing the local extinction of species worldwide, and the trade of NTFPs is an increasing threat towards biodiversity [39,40].

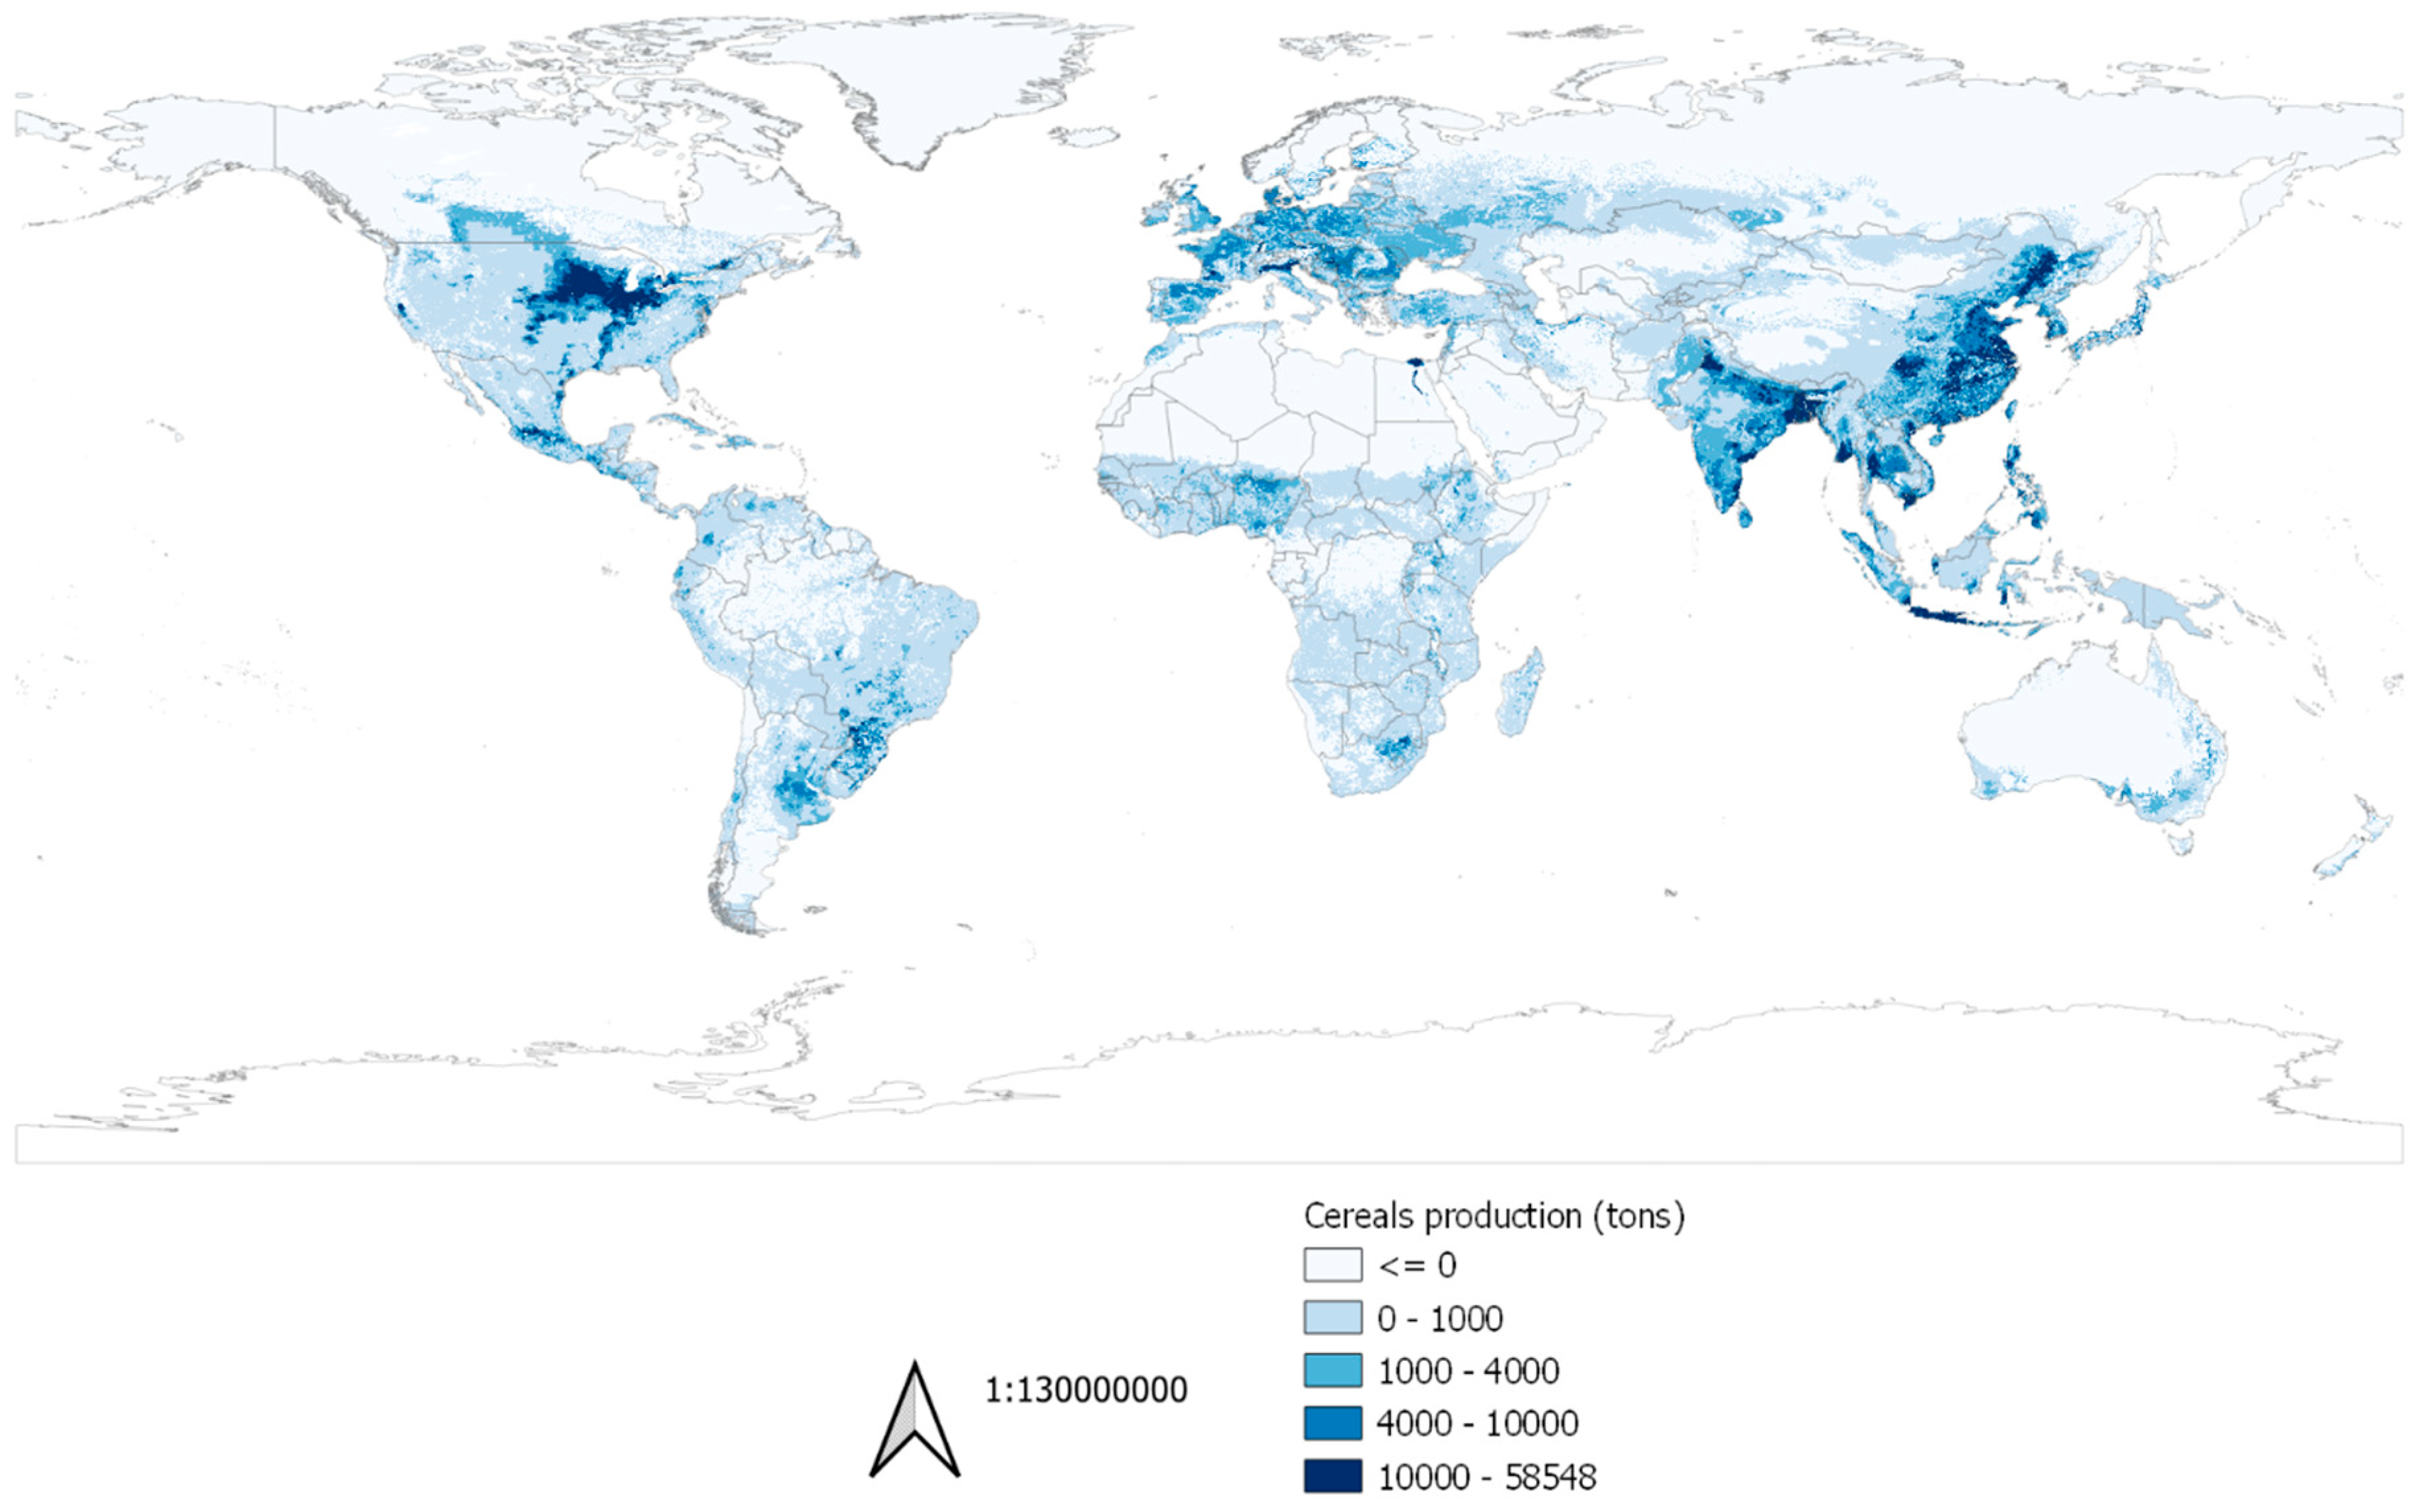
2.2.3. Crops Production

Today, we use 11% of the globe’s land surface (13.4 billion ha) for crop production (Figure 2). This is typical arable land and land under permanent crops. Still, this is only 1/3 of the available land estimated suitable for crop production [41]. Hence, there seems to be scope for the expansion of agricultural land, and crop production is projected to increase until 2030 at 1.4 percent per year. Most of this potential cropland is found in sub-Saharan Africa and Latin America, with some in East Asia, but it may not be used due to a lack of infrastructure or because it is located in conservation areas under forest cover or in wetlands [41]. Areas such as grasslands or other natural areas have traditionally been converted into agricultural areas to meet the increased demand of crop or food production. This change in land use from grasslands to croplands has a negative impact on biodiversity and soil composition, and is not an optimal option for sustainable food production [42].
The potential increase in crop production is also challenged by climate change [44]. Global warming will be more adverse in tropical areas than in temperate areas. The Northern hemisphere is expected to increase crop production due to global warming, while a number of countries in the Southern hemisphere are likely to be negatively affected [45], particularly in sub-Saharan Africa and Southern Europe [46,47]. In the Southern hemisphere, extreme climatic events started in the 1990s and they will increase in frequency and severity [48,49,50] with the loss of crops, livestock, homes, food stores, and livelihoods.
Food production also has a large environmental impact, being the main source of nitrate pollution, ammonia pollution, and a major contributor to the phosphate pollution of waterways [51]. Food production also affects climate change by releasing methane and nitrous oxide into the atmosphere [52].

2.2.4. Livestock Production

Livestock production represents the largest of all anthropogenic land uses, covering 30% of the world’s total land area, accounting for 70 percent of all agricultural land [53] (Figure 3). It provides livelihood for 1 billion people in rural areas [54]. Conventional meat production has increased between 40% and 60% over the last 40 years [55] and it is expected to continue to rise slowly in developed countries (0.2 percent per year) and fast in developing countries (1.6 percent per year) [56], yielding a 70% increase in livestock products by 2050 due to the increase in human population and increased consumption [53].
However, livestock farming is considered among the least efficient ways to produce edible proteins [61], possibly with the exception of areas of low primary productivity, where grazing may be the only way of producing proteins. The subsequent creation of monocultures can facilitate the spread of pathogens, pests, and disease, in addition to increased greenhouse gas emissions, water usage, and land use [62].
Thus, overgrazing, deforestation, water pollution, and soil erosion challenge biodiversity, especially in the arid parts of the world [63]. The environmental impacts of livestock production and consumption has not been fully addressed [64]. There is a need for an increased focus on nutrient recycling from large-scale meat production facilities, animal welfare, and preventive measures against animal diseases and the use of medication [65].
There are also positive impacts of livestock; for instance, as a protection for biodiversity, especially by maintaining valuable habitats [66], as free ranging livestock contributes to the maintenance of grasslands and landscaping [67].

2.3. Marine and Freshwater Systems

2.3.1. Marine Production

Water covers 70% of the world’s surface, and marine ecosystems provide a wide range of invaluable ecosystem services, including global climate regulation, nutrient cycling, and the provision of food [68,69]. Coastal waters sustain approximately 90% of the annual marine fishing efforts. Globally, 86.6 million tons of fish are captured, either for direct human consumption or indirectly by the production of fishmeal for aquaculture, with a total value of €91 billion [70] (Figure 4).
Currently, over 80% of the available fish stocks are exploited maximally or are already subject to over-exploitation, and the proportion is increasing [70,72]. An increase in the amount of marine catches is, therefore, not in concurrence with the preservation of biodiversity unless there is a shift in the management of the marine fisheries [73]. These marine systems are under severe pressure from anthropogenic influencers, which has resulted in a severe decrease and degradation of marine habitats [69,74]. Coupled with climate change and the persistent over-exploitation of fish stocks, the situation with the marine system and biota is dire [75,76].

2.3.2. Freshwater Production

Only about 3% of the water in the world is freshwater and 0.02% of the freshwater is found in streams and lakes [77]. Freshwater generates essential ecosystem services, such as drinking water, water for domestic, agricultural, and industrial use, hydroelectricity, food, medicines, recreational activities (e.g. sport fishing), tourism, and public health measures [78]. Freshwater fish constitutes over 2% of animal protein consumed by humans. In addition, it provides jobs and income (i.e. export) for several million people, particularly in developing countries [79].
The reservoirs of fresh water (e.g. ground water and surface water) are dependent on replenishment from the water cycle. However, here, we experience a long array of challenges.
The human use of freshwater today exceeds the rate of replenishment. The world’s clean water is decreasing at an accelerating pace due to a combination of increased evaporation and lower precipitation [80], coupled with an accelerated degree of pollution [81]. Climate change is increasingly affecting weather patterns around the world, causing droughts in some regions and floods in others [71,82]. Clean freshwater is a necessity for humans; however, an increasing percentage of humans are lacking a steady supply of clean water, and it is expected that two-thirds of the world’s population will experience water shortages within 2025 [83].
The use of hydropower (15% of today’s world electricity) is renewable and climate friendly [84]. However, it can largely affect the local environment through the alteration of the water quality and temperature and changes in aquatic and terrestrial habitats, and contributes to habitat fragmentation (physical barrier; hindering the upstream and/or downstream migration of aquatic organisms) [84].

2.3.3. Aquaculture Production

Aquaculture production (both marine and freshwater) produced over 59 million tons of food products in 2010, with a total value of €110 billion, and the production is continuing to increase [71]. Current aquaculture may have an adverse effect on the natural fish populations due to the high demand for fish from natural populations as aquaculture feed [85,86]. Approximately 40% of the current aquaculture production is dependent on fish feed from marine ecosystems [71]. If aquaculture production is to be increased, this will give an added pressure on the already fully exploited natural fish stocks through the increased catching of fish to feed farmed fish [85]. In addition, aquaculture poses several ecological risks; e.g. pollution from the farms, the spread of parasites, diseases, and invasive species, escaped farmed fish that negatively affect the genetic composition of native stocks and cascading effects through the decimation of small prey fish stocks for fish feed, and reducing prey availability for predatory marine animals and sea birds [71,86]. However, there are several promising adaptations towards making aquaculture more economically and ecologically sustainable, including land-based farming [87], utilizing fish manure as field fertilizer [88], aquaponics [89], producing fish feed from wood by-products, and lice-free net pens [90].

3. Bioeconomy Strategies and the Economic Gain and Ecological Pain Model

Through evolutionary time, there have been five mass extinctions, with a loss of 75% of the Earth’s species within 2 million years. With the current trend of species losses over the past few centuries and millennia, biologists now assume that a sixth mass extinction may be underway [91]. The current extinction rate is 100–5000 times higher than the natural extinction rate. There is strong evidence that the approaching mass extinction is directly driven by human activity, such as habitat destruction and fragmentation, due to land use change, direct exploitation, the introduction of alien species, the spreading of pathogens, and the discharge of environmental poisons or climatic gasses [92,93].

3.1. Bioeconomy Strategies

A refined bioeconomy is one of the solutions to halt climate change and CO2 emissions, and the development of bioeconomy strategies are important in the process of establishing a more sustainable society. However, there is a paradox that high bioeconomical growth may feedback on the exploitation of biodiversity. This will happen as long as a sustainable bioeconomy is not based on a sustainable harvest of bio-based raw materials [9]. Today, ecosystem diversity and species diversity is challenged because there is virtually no systematic monitoring of the biomass access and market demand in the high growing bioeconomy. The UN’s Nature Panel stresses how markets and socioeconomical factors, such as values, income, technology, and power, are drivers of the exploitation of nature [94]. This challenge is by no means solved in the various bioeconomy strategies.
In 2016, the 2030 Agenda for Sustainable Development uniformly defined 17 sustainability development goals (SDG) to strengthen universal peace and increase human rights, fighting hunger, poverty, and inequalities to build a sustainable future for mankind. The 17 goals deal with sustainability in all three dimensions—economic, social, and environmental—and two of the 17 goals deal directly with biodiversity and ecosystems (SDG 14 and SDG 15). This means that an economy can be defined as sustainable when the economy targets one or several of the UN SDGs, such as poverty, inequalities, or other SDGs. This is certainly a good way of bringing economy and sustainability together as a tool for building a sustainable future, but there is also a challenge when definitions such as sustainable bioeconomy are understood as a bioeconomy that is highly based on SDG 14 and/or SDG 15. Both globally and in Europe, we see that countries show large differences in which sectors they include in the definition of bioeconomy, and, thus, their bioeconomy strategies will differ greatly in how they define their sustainable bioeconomy [95]. For instance, in Argentina, bioeconomy is seen as a tool for sustainable development in the country, focusing on halting climate change (SDG 13) and supporting a continued economic progress to reduce poverty (SDG 1) [96]. In Germany, the national bioeconomy strategy prioritizes a secure supply of high-quality food (SDG 3), the transition from a fossil-based economy to an economy based on renewable resources while conserving biodiversity and soil fertility, and strengthening innovative power and international competitiveness in business and research (SDG 6, 7, and 9) [96]. In Malaysia, bioeconomy is seen as a key contributor to economic growth, which can provide benefits to society via breakthroughs in agricultural productivity, innovations in healthcare, and the adoption of sustainable industrial processes (SDG 3, 9, and 15) [96]. Hence, if bioeconomy is meant to be a contribution to sustainable development in future biodiversity and ecosystems, we need a common definition of the concept to ensure that bioeconomy really contributes to the whole sustainability concept: social sustainability, economic sustainability, and environmental sustainability [95,97,98]. There may be a need to include a new dimension to the concept of environmental sustainability that emphasizes biodiversity or ecological sustainability.
The European bioeconomy strategy has included monitoring and sustainability as an objective in their aims [8], but whenever a monitoring program reveals biodiversity loss, we are already too late for biodiversity conservation. We see this in the blue bioeconomy, which is already an important economic factor in most countries with a coastal line; however, hardly any of them have a monitoring system for the marine ecosystems or marine biodiversity [99].
Secondly, there is no agreement of the level that biodiversity should be defined at in the bioeconomy strategies. Should there be a focus on genes, species, or ecosystems? Bioeconomy strategies often define sustainability in association with ecosystem services, but if we value biodiversity through ecosystem services, these services are already defined as those benefitting human needs, and not services that are purely for the conservation of biodiversity.
We see equal challenges when it comes to marine ecosystems. Bioeconomy based on marine products is crucial for food production, feed, and energy, and we also see an increased effort to increase the innovation and development of the blue bioeconomy. However, marine environments are extremely vulnerable and, in spite of an increased effort to protect marine biodiversity, there is a challenge in fighting overharvest, illegal fishing, and pollution, among other threats [75,76].

3.2. The Economic Gain and Ecological Pain Model

We have to develop a bioeconomy where we produce biomass, the raw material for bioeconomy, with proper long-term sustainable management for safeguarding biodiversity in well-functioning and resilient ecosystems.
The long-term sustainability of utilizing biological resources requires that we plan our bioeconomies in relation to biodiversity targets and biodiversity levels that maintain well-functioning ecosystems.
The utilization of renewable biological resources as the basis for a bioeconomy must be managed in relation to the environmental impact—not only on short-term financial perspectives. We need to build optimization models where land use is defined based on what is economically and ecologically optimal (Figure 5). If we focus on the terrestrial system, it is evident from Figure 3 and Figure 4 and Hansen et al. [100] that crop and livestock production, as well as deforestation through forestry, are impacting biodiversity on an unimaginatively large scale [100,101]. As one increases from a low intensity production of crops, livestock, and forestry, there is a steady gain in economic benefit and a limited impact on biodiversity. Thus, the total economic gain/environmental pain ratio increases (Figure 5). However, as we intensify production or harvest, the environmental pain starts to become unbearable and too high to be counteracted by the economic gain. Thus, the ratio reaches its optimum and starts to decrease. The entire figure can be shifted to the right or left along the x-axis, depending on cultural, social, or emotional factors of decisionmakers or society at large. However, irrespective of having an ecocentric or anthropocentric world view—at some point of extreme utilization of livestock, crops, or forestry—the economic gain would decrease because of large scale challenges due to intensive production. This is exemplified to some degree with the current (April 2020) COVID-19 pandemic, as well as swine flu, antibiotic resistance (for livestock), pesticide resistance (for crops), floods, and erosion (for forestry).
In a large-scale landscape consisting of a mosaic of crops, livestock, and forest, we should aim to identify the optimum intensity of production that maximizes the economic gain/ecological pain ratio. Crops, livestock, and forestry are just example biomasses, but this concept can be applied to all landscapes where one utilizes some resource that could potentially harm biodiversity.
Intensified land use required by bioeconomies will change the landscape with unknown consequences for biodiversity, ecosystem functioning, and the multitude of ecosystem services. Thus, we might have to move from thinking about the intensification of land use to the optimization of land use—i.e. the optimal livestock/wildlife/crop density and distribution in the landscape in order to maximize the economic gain and minimize the ecological pain (i.e. biodiversity loss) (Figure 5).
We can further develop the production in the optimization model by increasing the ability of an ecosystem to produce biomass. We can manage the ecosystem to increase production for human needs by using technology (e.g. fertilization, genetically modified crops, pesticides, aquaponics, companion planting, and forestry scarification). As we intensify the production, we need a continuous development of knowledge and technology to maintain environmental sustainability. This is a risky technology-driven ecosystem where intensification increases the risk of passing a threshold where the technological development surpasses the ecological system so that the ecological system is no longer resilient and collapses.
We expect that the economies based on biological resources will have an optimum at a somewhat intermediate intensification, as technological demands will increase the cost at high intensification (Figure 5). The social acceptance of intensification will probably also be at a somewhat intermediate level, while health issues (except hunger) may be optimal at lower levels of intensification. However, social acceptance may continuously push towards increased production, as long as the system does not collapse (Figure 5). Furthermore, society’s perception of “intermediate” will change, and the “high” intensification of today will be the “intermediate” of tomorrow, following the Shifting Baseline Syndrome [102].
The challenge is how individual countries or continents could operationalize the gain/pain concept. There is, unfortunately, a time lag from the current economic gain to the future ecological pain it causes, meaning that elected politicians do not want to make the tough decisions needed for the future. The problem with this time lag is beautifully and dramatically illustrated by the reluctancy of world leaders to make tough decisions to decrease climate gas emissions for our future benefit, while the current (April 2020) COVID-19 pandemic causes the same leaders to take extreme measures to fight a current problem (i.e. closing down universities, schools, shops, regions, and nations).
We fear that sustainability discussions risk being just that—discussions—and that they do not lead to concrete guidelines and tools to determine the optimal intensity production in a landscape. However, the increased focus on the bioeconomy also being ecologically sustainable [8] gives us hope for tools to use on the ground.

Author Contributions

Conceptualization, S.P., K.E.G., and H.P.A.; methodology, S.P.; software, S.P.; validation, S.P., K.E.G., M.C., and H.P.A.; formal analysis, S.P.; investigation, S.P, K.E.G., M.C. and H.P.A.; writing—original draft preparation, S.P. K.E.G., M.C., and H.P.A.; writing—review and editing, S.P. K.E.G., M.C., and H.P.A.; visualization, S.P.; supervision, S.P. and H.P.A.; project administration, S.P. and H.P.A.; funding acquisition, H.P.A. All authors have read and agreed to the published version of the manuscript.

Funding

This research was funded by EU INTERREG SWEDEN-NORWAY, grant number 2017-000003 1704 HFK.

Acknowledgments

Harry P. Andreassen initially led the current manuscript, but sadly passed away in May 2019. We remember him as a warm person and an inspiring colleague, leader, supervisor, and friend. We thank Cyril Milleret, Mari Hagenlund, Marius Hassve, Christina Skarpe, Kaja Johnsen, Cicik Udayana, Torfinn Jahren, Morten Tofastrud, Rosemary P. Mramba, and Nuria F. Esteruelas for inputs during a PhD course and Jan Vermaat for comments on a previous version of the manuscript. We thank Vladimir Naumov for help creating the maps.

Conflicts of Interest

The authors declare no conflict of interest. The funders had no role in the design of the study; in the collection, analyses, or interpretation of data; in the writing of the manuscript, or in the decision to publish the results.

References

  1. European Commission. Innovating for Sustainable Growth: A Bioeconomy for Europe. Communication from the Commission to the European Parliament, the Council, the European Economic and Social Committee and the Committee of the Regions. 2012. Available online: https://op.europa.eu/en/publication-detail/-/publication/1f0d8515-8dc0-4435-ba53-9570e47dbd51/language-en (accessed on 10 February 2020).
  2. Ripple, W.J.; Wolf, C.; Newsome, T.M.; Galetti, M.; Alamgir, M.; Crist, E.; Mahmoud, M.I.; Laurance, W.F.; 15,364 scientist signatories from 184 countries. World scientists’ warning to humanity: A second notice. BioScience 2017, 67, 1026–1028. [Google Scholar] [CrossRef]
  3. de Schutter, L.; Giljum, S.; Häyhä, T.; Bruckner, M.; Naqvi, A.; Omann, I.; Stagl, S. Bioeconomy Transitions through the Lens of Coupled Social-Ecological Systems: A Framework for Place-Based Responsibility in the Global Resource System. Sustainability 2019, 11, 5705. [Google Scholar] [CrossRef] [Green Version]
  4. Costanza, R.; d’Arge, R.; De Groot, R.; Farber, S.; Grasso, M.; Hannon, B.; Limburg, K.; Naeem, S.; O’neill, R.V.; Paruelo, J. The value of the world’s ecosystem services and natural capital. Nature 1997, 387, 253–260. [Google Scholar] [CrossRef]
  5. Martínez, A.C.; García-Llorente, M.; Martín-López, B.; Palomo, I.; Iniesta-Arandia, I. Multidimensional approaches in ecosystem services assessment. Earth Obs. Ecosyst. Serv. 2013, 441, 441–468. [Google Scholar]
  6. WTTC. World Travel and Tourism Council. Economic Impact of Travel and Tourism 2014 Annual Update: Summary. 2014. Available online: http://www.ontit.it/opencms/export/sites/default/ont/it/documenti/files/ONT_2014-03-31_03008.pdf (accessed on 15 April 2020).
  7. SWD. Biodiversity Strategy. European Commision, 2011. 2012. Available online: http://ec.europa.eu/environment/nature/biodiversity/strategy/index_en.htm (accessed on 10 February 2020).
  8. European Commission. A Sustainable Bioeconomy for Europe: Strengthening the Connection between Economy, Society and the Environment; European Commission: Brussels, Belgium, 2018. [Google Scholar] [CrossRef]
  9. Piotrowski, S.; Carus, M.; Essel, R. Global bioeconomy in the conflict between biomass supply and demand. Ind. Biotechnol. 2015, 11, 308–315. [Google Scholar] [CrossRef]
  10. UNEP. The United Nations Convension on Biological Diversity; UNEP: Ginebra, Switzerland, 1992. [Google Scholar]
  11. Laurila-Pant, M.; Lehikoinen, A.; Uusitalo, L.; Venesjärvi, R. How to value biodiversity in environmental management? Ecol. Indic. 2015, 55, 1–11. [Google Scholar] [CrossRef] [Green Version]
  12. Bastille-Rousseau, G.; Schaefer, J.A.; Peers, M.J.L.; Ellington, E.H.; Mumma, M.A.; Rayl, N.D.; Mahoney, S.P.; Murray, D.L. Climate change can alter predator-prey dynamics and population viability of prey. Oecologia 2018, 186, 141–150. [Google Scholar] [CrossRef]
  13. Bar-On, Y.M.; Phillips, R.; Milo, R. The biomass distribution on Earth. Proc. Natl. Acad. Sci. USA 2018, 115, 6506–6511. [Google Scholar] [CrossRef] [Green Version]
  14. Groombridge, B.; Jenkins, M.D. Global Biodiversity: Earth’s Living Resources in the 21st Century; World Conservation Monitoring Centre: Cambridge, UK, 2000. [Google Scholar]
  15. Wilson, R.; Millero, F.J.; Taylor, J.; Walsh, P.; Christensen, V.; Jennings, S.; Grosell, M. Contribution of fish to the marine inorganic carbon cycle. Science 2009, 323, 359–362. [Google Scholar] [CrossRef] [Green Version]
  16. Whitman, W.B.; Coleman, D.C.; Wiebe, W.J. Prokaryotes: The unseen majority. Proc. Natl. Acad. Sci. USA 1998, 95, 6578–6583. [Google Scholar] [CrossRef] [Green Version]
  17. The World Bank. Biodiversity Conservation in Forest Ecosystems—World Bank Assistance, 1992–2002; The World Bank Group: Washington, DC, USA, 2002. [Google Scholar]
  18. FAO. Global Forest Resources Assessment 2010: Main Report; Food and Agriculture Organization: Rome, Italy, 2010; Available online: http://www.fao.org/3/a-i1757e.pdf (accessed on 15 April 2020).
  19. TEEB. The Economics of Ecosystems and Biodiversity. TEEB for Business. 2009. Available online: http://www.teebweb.org/wp-content/uploads/Study%20and%20Reports/Reports/Business%20and%20Enterprise/TEEB%20for%20Business%20Report/TEEB%20for%20Business.pdf (accessed on 15 April 2020).
  20. Santoro, M. GlobBiomass—Global datasets of forest biomass. PANGAEA10 2018, 1594. [Google Scholar] [CrossRef]
  21. Ranius, T.; Roberge, J.-M. Effects of intensified forestry on the landscape-scale extinction risk of dead wood dependent species. Biodivers. Conserv. 2011, 20, 2867–2882. [Google Scholar] [CrossRef] [Green Version]
  22. Naumov, V.; Manton, M.; Elbakidze, M.; Rendenieks, Z.; Priednieks, J.; Uhlianets, S.; Yamelynets, T.; Zhivotov, A.; Angelstam, P. How to reconcile wood production and biodiversity conservation? The Pan-European boreal forest history gradient as an “experiment”. J. Environ. Manag. 2018, 218, 1–13. [Google Scholar] [CrossRef]
  23. Food and Agriculture Organization of the United Nations. State of the World’s Forests 2016: Forests and Agriculture: Land-Use Challenges and Opportunities; FAO Report; FAO: Rome, Italy, 2016. [Google Scholar]
  24. Dijkman, W.; Boot, R.G.; Zuidema, P.A. Dynamics and Sustainability of Non-Timber Forest Products Extraction; Seminar Proceedings NTFP Research in the Tropenbos Programme: Results and Perspectives; Tropenbos: Wageningen, The Netherlands, 1999; pp. 169–173. [Google Scholar]
  25. Ros, T.; Dijkman, W.; van Bueren, E.L. Commercial and Sustainable Extraction of Non-Timber Forest Products: Towards a Policy and Management Oriented Research Strategy; Tropenbos Foundation: Wageningen, The Netherlands, 1995. [Google Scholar]
  26. FAO. State of the World’s Forests; Food and Agriculture Organization: Rome, Italy, 1997; Available online: http://www.fao.org/3/w4345e/w4345e00.htm (accessed on 15 March 2020).
  27. Reid, W.V.; Mooney, H.A.; Cropper, A.; Capistrano, D.; Carpenter, S.R.; Chopra, K.; Dasgupta, P.; Dietz, T.; Duraiappah, A.K.; Hassan, R. Ecosystems and Human Well-Being-Synthesis: A Report of the Millennium Ecosystem Assessment; Island Press: Washington, DC, USA, 2005. [Google Scholar]
  28. Ros-Tonen, M.A. The role of non-timber forest products in sustainable tropical forest management. Holz Als Roh-Und Werkst. 2000, 58, 196–201. [Google Scholar] [CrossRef]
  29. Chamberlain, J.L.; Bush, R.J.; Hammett, A.; Araman, P.A. Managing national forests of the eastern United States for non-timber forest products. In Proceedings of the XXI IUFRO World Congress 2000, Forests and Society: The Role of Research 1, Kuala Lumpur, Malaysia, 7–12 August 2000; pp. 407–420. [Google Scholar]
  30. Arnold, J.M.; Pérez, M.R. Can non-timber forest products match tropical forest conservation and development objectives? Ecol. Econ. 2001, 39, 437–447. [Google Scholar] [CrossRef] [Green Version]
  31. Ros-Tonen, M. Forest products—Non-timber. Berkshire Encyclopedia of Sustainability. Vol. 4: Natural Resources and Sustainability; Berkshire Publishing: Great Barrington, MA, USA, 2011; pp. 163–167. [Google Scholar]
  32. Chediack, S.E. The effect of forest exploitation on structure, diversity, and floristic composition of palmito-dominated Atlantic forests at Misiones, Argentina. Rev. Biol. Trop. 2008, 56, 721–738. [Google Scholar]
  33. Wollenberg, E.; Ingles, A. Incomes from the Forest: Methods for the Development and Conservation of Forest Products for Local Communities; Cifor: Bogor, Indonesia, 1998. [Google Scholar]
  34. Wickens, G.E. Management issues for development of non-timber forest products. Unasylva 1991, 42, 3–8. [Google Scholar]
  35. Apollonio, M.; Andersen, R.; Putman, R. European Ungulates and Their Management in the 21st Century; Cambridge University Press: Cambridge, UK; New York, NY, USA, 2010. [Google Scholar]
  36. Milner, J.M.; Bonenfant, C.; Mysterud, A.; GAILLARD, J.M.; Csányi, S.; Stenseth, N.C. Temporal and spatial development of red deer harvesting in Europe: Biological and cultural factors. J. Appl. Ecol. 2006, 43, 721–734. [Google Scholar] [CrossRef]
  37. Bennett, E.L.; Robinson, J.G. Hunting of Wildlife in Tropical Forests: Implications for Biodiversity and Forest Peoples. FAO, Open Knowledge Repository, OKR. 2000. Available online: http://agris.fao.org/agris-search/search.do?recordID=US2014603031 (accessed on 10 February 2020).
  38. Bleier, N.; Biró, Z.; Galló, J.; Szemethy, L.; Csányi, S. Trend in game meat production and consumption in Hungary over the period 1970–2012. In Proceedings of the 2nd International Symposium on Hunting, Novi Sad, Serbia, 17–20 October 2013; pp. 17–20. [Google Scholar]
  39. Gangås, K.E.; Kaltenborn, B.P.; Andreassen, H.P. Global differences in the motivation for illegal hunting. Nat. Conserv. 2020. in review. [Google Scholar]
  40. Milner-Gulland, E.J.; Bennett, E.L. Wild meat: The bigger picture. Trends Ecol. Evol. 2003, 18, 351–357. [Google Scholar] [CrossRef]
  41. FAO. World Agriculture: Towards 2015/30—An FAO Perspective; Food and Agriculture Organization: Rome, Italy, 2010. [Google Scholar]
  42. Clay, D.E.; Clay, S.A.; Reitsma, K.D.; Dunn, B.H.; Smart, A.J.; Carlson, G.G.; Horvath, D.; Stone, J.J. Does the conversion of grasslands to row crop production in semi-arid areas threaten global food supplies? Glob. Food Secur. 2014, 3, 22–30. [Google Scholar] [CrossRef] [Green Version]
  43. Monfreda, C.; Ramankutty, N.; Foley, J.A. Farming the planet: 2. Geographic distribution of crop areas, yields, physiological types, and net primary production in the year 2000. Glob. Biogeochem. CY 2008, 22. [Google Scholar] [CrossRef]
  44. Jones, P.G.; Thornton, P.K. The potential impacts of climate change on maize production in Africa and Latin America in 2055. Glob. Environ. Chang. 2003, 13, 51–59. [Google Scholar] [CrossRef]
  45. Fischer, G.; Shah, M.; van Velthuizen, H.; Nachtergaele, F.O. Global Agro-Ecological Assessment for Agriculture in the 21st Century; IIASA Research Repoort 02-02; International Institute for Applied Systems Analysis: Laxenburg, Austria, 2001; p. 119. [Google Scholar]
  46. Parry, M.E. Assessment of Potential Effects and Adaptations for Climate Change in Europe—The Europe Acacia Project; Jackson Environment Institute, University of East Anglia: Norwich, UK, 2000. [Google Scholar]
  47. Parry, M.; Rosenzweig, C.; Iglesias, A.; Fischer, G.; Livermore, M. Climate change and world food security: A new assessment. Glob. Environ. Chang. 1999, 9, S51–S67. [Google Scholar] [CrossRef] [Green Version]
  48. Easterling, D.R.; Meehl, G.A.; Parmesan, C.; Changnon, S.A.; Karl, T.R.; Mearns, L.O. Climate extremes: Observations, modeling, and impacts. Science 2000, 289, 2068–2074. [Google Scholar] [CrossRef] [Green Version]
  49. IPCC. Climate Change 2001: The Scientific Basis; Contribution of Working Group I to the Third Assessment Report of the Intergovernmental Panel on Climate Change; Cambridge University Press: Cambridge, UK; New York, NY, USA, 2001. [Google Scholar]
  50. IPCC. Climate Change 2001: Impacts, Adaptation and Vulnerability; Contribution of Working Group II to the Third Assessment Report of the Intergovernmental Panel on Climate Change; Cambridge University Press: Cambridge, UK; New York, NY, USA, 2001. [Google Scholar]
  51. OECD. OECD Environmental Outlook to 2020; OECD: Paris, France, 2001. [Google Scholar] [CrossRef]
  52. IPCC. Climate Change 2001: Synthesis Report; A Contribution of Working Groups I, II, and III to the Third Assessment Report of the Integovernmental Panel on Climate Change; Watson, R.T., the Core Writing Team, Eds.; Cambridge University Press: Cambridge, UK; New York, NY, USA, 2001; p. 398. [Google Scholar]
  53. FAO. Food and Agriculture Organization of the United Nations. Livestock and the Environment. 2020. Available online: http://www.fao.org/livestock-environment/en/ (accessed on 15 April 2020).
  54. Steinfeld, H.; Gerber, P.; Wassenaar, T.; Castel, V.; Rosales, M.; Rosales, M.; de Haan, C. Livestock’s Long Shadow: Environmental Issues and Options; Food & Agriculture Org.: Rome, Italy, 2006. [Google Scholar]
  55. Sukhdev, P.; Wittmer, H.; Schröter-Schlaack, C.; Nesshöver, C.; Bishop, J.; Brink, P.t.; Gundimeda, H.; Kumar, P.; Simmons, B. The Economics of Ecosystems and Biodiversity: Mainstreaming the Economics of Nature: A Synthesis of the Approach, Conclusions and Recommendations of TEEB; UNEP: Ginebra, Switzerland, 2010. [Google Scholar]
  56. McDonald, P.; Edwards, R.A.; Greenhalgh, J.F.D.; Sinclair, L.A.; Wilkinson, R.G. Animal Nutrition; Pearson Education Unlimited: Essex, UK, 2011; p. 672. ISBN 9781408204238. [Google Scholar]
  57. Gilbert, M.; Nicolas, G.; Cinardi, G.; van Boeckel, T.P.; Vanwambeke, S.; Wint, W.G.R.; Robinson, T.P. Global Cattle Distribution in 2010 (5 Minutes of arc); Harvard Dataverse, V3; 2018. [Google Scholar] [CrossRef]
  58. Gilbert, M.; Nicolas, G.; Cinardi, G.; van Boeckel, T.P.; Vanwambeke, S.; Wint, W.G.R.; Robinson, T.P. Global Goats Distribution in 2010 (5 Minutes of arc); Harvard Dataverse, V3; 2018. [Google Scholar] [CrossRef]
  59. Gilbert, M.; Nicolas, G.; Cinardi, G.; van Boeckel, T.P.; Vanwambeke, S.; Wint, W.G.R.; Robinson, T.P. Global Horses Distribution in 2010 (5 Minutes of arc); Harvard Dataverse, V3; 2018. [Google Scholar] [CrossRef]
  60. Gilbert, M.; Nicolas, G.; Cinardi, G.; van Boeckel, T.P.; Vanwambeke, S.; Wint, W.G.R.; Robinson, T.P. Global Sheep Distribution in 2010 (5 Minutes of arc); Harvard Dataverse, V3; 2018. [Google Scholar] [CrossRef]
  61. Kaldy, M. Protein yield of various crops as related to protein value. Econ. Bot. 1972, 26, 142–144. [Google Scholar] [CrossRef]
  62. Hoekstra, A.Y. Virtual Water Trade: Proceedings of the International Expert Meeting on Virtual Water Trade, Delft, The Netherlands, 12–13 December 2002; Value of Water Research Report Series No. 12; UNESCO-IHE: Delft, The Netherlands, 2003. [Google Scholar]
  63. Toutain, B.; Ickowicz, A.; Dutilly-Diane, C.; Reid, R.; Diop, A.T.; Taneja, V.K.; Gibon, A.; Genin, D.; Ibrahim, M.; Behnke, R. Impacts of livestock systems on terrestrial ecosystems. In Livestock in a Changing Landscape, Volume 1: Drivers, Consequences, and Responses; Bibliovault OAI Repository; The University of Chicago Press: Chicago, IL, USA, 2010; p. 1165. [Google Scholar]
  64. Steinfeld, H.; Gerber, P. Livestock production and the global environment: Consume less or produce better? Proc. Natl. Acad. Sci. USA 2010, 107, 18237–18238. [Google Scholar] [CrossRef] [Green Version]
  65. Thornton, P.K. Livestock production: Recent trends, future prospects. Philos. Trans. R. Soc. B Biol. Sci. 2010, 365, 2853–2867. [Google Scholar] [CrossRef] [Green Version]
  66. Reid, R.; Bedelian, C.; Said, M.; Kruska, R.; Mauricio, R.; Castel, V.; Olson, J.; Thornton, P. Global Livestock Impacts on Biodiversity. In Livestock in a Changing Landscape. Drivers, Consequences, and Responses; Steinfeld, H., Mooney, H.A., Schneider, F., Neville, L.E., Eds.; Island Press: Washington, DC, USA, 2010; Volume 1, pp. 111–138. [Google Scholar]
  67. Hampicke, U.; Plachter, H. Livestock grazing and nature conservation objectives in Europe. In Large-Scale Livestock Grazing: A Management Tool for Nature Conservation; Plachter, H., Hampicke, U., Eds.; Springer-Verlag: Berlin, Germany, 2010; pp. 2–25. [Google Scholar]
  68. Beaumont, N.; Austen, M.; Atkins, J.; Burdon, D.; Degraer, S.; Dentinho, T.; Derous, S.; Holm, P.; Horton, T.; Van Ierland, E. Identification, definition and quantification of goods and services provided by marine biodiversity: Implications for the ecosystem approach. Mar. Pollut. Bull. 2007, 54, 253–265. [Google Scholar] [CrossRef]
  69. Waycott, M.; Duarte, C.M.; Carruthers, T.J.; Orth, R.J.; Dennison, W.C.; Olyarnik, S.; Calladine, A.; Fourqurean, J.W.; Heck, K.L.; Hughes, A.R. Accelerating loss of seagrasses across the globe threatens coastal ecosystems. Proc. Natl. Acad. Sci. USA 2009, 106, 12377–12381. [Google Scholar] [CrossRef] [Green Version]
  70. FAO. The State of World Fisheries and Aquaculture-2012; Food and agriculture organization of the United Nations: Rome, Italy, 2012. [Google Scholar]
  71. Watson, R.A. A database of global marine commercial, small-scale, illegal and unreported fisheries catch 1950–2014. Sci. Data 2017, 4, 170039. [Google Scholar] [CrossRef] [Green Version]
  72. Godfray, H.C.J.; Beddington, J.R.; Crute, I.R.; Haddad, L.; Lawrence, D.; Muir, J.F.; Pretty, J.; Robinson, S.; Thomas, S.M.; Toulmin, C. Food security: The challenge of feeding 9 billion people. Science 2010, 327, 812–818. [Google Scholar] [CrossRef] [Green Version]
  73. Merino, G.; Barange, M.; Blanchard, J.L.; Harle, J.; Holmes, R.; Allen, I.; Allison, E.H.; Badjeck, M.C.; Dulvy, N.K.; Holt, J. Can marine fisheries and aquaculture meet fish demand from a growing human population in a changing climate? Glob. Environ. Chang. 2012, 22, 795–806. [Google Scholar] [CrossRef]
  74. Barbier, E.B. Progress and challenges in valuing coastal and marine ecosystem services. Rev. Environ. Econ. Policy 2012, 6, 1–19. [Google Scholar] [CrossRef] [Green Version]
  75. Lotze, H.K.; Lenihan, H.S.; Bourque, B.J.; Bradbury, R.H.; Cooke, R.G.; Kay, M.C.; Kidwell, S.M.; Kirby, M.X.; Peterson, C.H.; Jackson, J.B. Depletion, degradation, and recovery potential of estuaries and coastal seas. Science 2006, 312, 1806–1809. [Google Scholar] [CrossRef]
  76. Worm, B.; Hilborn, R.; Baum, J.K.; Branch, T.A.; Collie, J.S.; Costello, C.; Fogarty, M.J.; Fulton, E.A.; Hutchings, J.A.; Jennings, S. Rebuilding global fisheries. Science 2009, 325, 578–585. [Google Scholar] [CrossRef] [Green Version]
  77. WWF. Americas Regional Process Event. Water for our Future. 2014. Available online: https://c402277.ssl.cf1.rackcdn.com/publications/740/files/original/10-20_World_Water_Forum_WP_FIN_15_122.pdf?1416335200 (accessed on 15 March 2020).
  78. Aylward, B.; Bandyopadhyay, J.; Belausteguigotia, J.-C.; Borkey, P.; Cassar, A.; Meadors, L.; Saade, L.; Siebentritt, M.; Stein, R.; Tognetti, S. Freshwater ecosystem services. Ecosyst. Hum. Well-Being Policy Responses 2005, 3, 213–256. [Google Scholar]
  79. FAO. The State of World Aquaculture and Fisheries 2006; Food and Agriculture Organization of the United Nations: Rome, Italy, 2007. [Google Scholar]
  80. IPCC. Climate Change 2007: Impacts, Adaptation and Vulnerability; Contribution of Working Group II to the Fourth Assessment Report of the Intergovernmental Panel on Climate Change; Parry, M.L., Canziani, O.F., Palutikof, J.P., van der Linden, P.J., Hanson, C.E., Eds.; Cambridge University Press: Cambridge, UK, 2007; p. 976. [Google Scholar]
  81. UNESCO-WWAP. Water: A Shared Responsibility; the United Nations World Water Development Report 2. 2006. Available online: https://unesdoc.unesco.org/ark:/48223/pf0000145405 (accessed on 15 April 2020).
  82. Barbier, E.B. Sustainable use of wetlands valuing tropical wetland benefits: Economic methodologies and applications. Geogr. J. 1993, 159, 22–32. [Google Scholar] [CrossRef]
  83. UN-Water. Coping with Water Scarcity: A Strategic Issue and Priority for System-Wide Action. 2006. Available online: https://www.un.org/waterforlifedecade/pdf/2006_unwater_coping_with_water_scarcity_eng.pdf (accessed on 15 February 2020).
  84. Cada, G.; Sale, M.; Dauble, D. Environmental impact of hydropower. In Encyclopedia of Energy; Cleveland, J.C., Ed.; Elsevier: New York, NY, USA, 2004; Volume 3, pp. 291–300. [Google Scholar]
  85. Deutsch, L.; Gräslund, S.; Folke, C.; Troell, M.; Huitric, M.; Kautsky, N.; Lebel, L. Feeding aquaculture growth through globalization: Exploitation of marine ecosystems for fishmeal. Glob. Environ. Chang. 2007, 17, 238–249. [Google Scholar] [CrossRef]
  86. Naylor, R.L.; Eagle, J.; Smith, W.L. Salmon aquaculture in the Pacific Northwest a global industry with local impacts. Environ. Sci. Policy Sustain. Dev. 2003, 45, 18–39. [Google Scholar] [CrossRef]
  87. Focardi, S.; Corsi, I.; Franchi, E. Safety issues and sustainable development of European aquaculture: New tools for environmentally sound aquaculture. Aquac. Int. 2005, 13, 3. [Google Scholar] [CrossRef]
  88. Radziemska, M.; Mazur, Z. Effect of compost from by-product of the fishing industry on crop yield and microelement content in maize. J. Ecol. Eng. 2015, 16, 168–175. [Google Scholar] [CrossRef]
  89. Palm, H.W.; Knaus, U.; Appelbaum, S.; Goddek, S.; Strauch, S.M.; Vermeulen, T.; Jijakli, M.H.; Kotzen, B. Towards commercial aquaponics: A review of systems, designs, scales and nomenclature. Aquac. Int. 2018, 26, 813–842. [Google Scholar] [CrossRef]
  90. Alriksson, B.; Hörnberg, A.; Gudnason, A.E.; Knobloch, S.; Arnason, J.; Johannsson, R. Fish feed from wood. Cellul. Chem. Technol. 2014, 48, 843–848. [Google Scholar]
  91. Barnosky, A.D.; Matzke, N.; Tomiya, S.; Wogan, G.O.; Swartz, B.; Quental, T.B.; Marshall, C.; McGuire, J.L.; Lindsey, E.L.; Maguire, K.C. Has the Earth’s sixth mass extinction already arrived? Nature 2011, 471, 51–57. [Google Scholar] [CrossRef]
  92. Dirzo, R.; Raven, P.H. Global state of biodiversity and loss. Ann. Rev. Environ. Resour. 2003, 28, 137–167. [Google Scholar] [CrossRef] [Green Version]
  93. Wake, D.B.; Vredenburg, V.T. Are we in the midst of the sixth mass extinction? A view from the world of amphibians. Proc. Natl. Acad. Sci. USA 2008, 105, 11466–11473. [Google Scholar] [CrossRef] [Green Version]
  94. IPBES. Global Assessment Report on Biodiversity and Ecosystem Services; IPBES Secretariat: Bonn, Germany, 2019. [Google Scholar]
  95. Bugge, M.M.; Hansen, T.; Klitkou, A. What Is the Bioeconomy? A Review of the Literature. Sustainability 2016, 8, 691. [Google Scholar] [CrossRef] [Green Version]
  96. Bracco, S.; Calicioglu, O.; Gomez San Juan, M.; Flammini, A. Assessing the Contribution of Bioeconomy to the Total Economy: A Review of National Frameworks. Sustainability 2018, 10, 1698. [Google Scholar] [CrossRef] [Green Version]
  97. Egenolf, V.; Bringezu, S. Conceptualization of an Indicator System for Assessing the Sustainability of the Bioeconomy. Sustainability 2019, 11, 443. [Google Scholar] [CrossRef] [Green Version]
  98. Ramcilovic-Suominen, S.; Pülzl, H. Sustainable development—A ‘selling point’of the emerging EU bioeconomy policy framework? J. Clean. Prod. 2018, 172, 4170–4180. [Google Scholar] [CrossRef]
  99. UNECSO. Global Ocean Science Report—The Current Status of Ocean Science around the World; UNECSO: Paris, France, 2007. [Google Scholar]
  100. Hansen, M.C.; Potapov, P.V.; Moore, R.; Hancher, M.; Turubanova, S.A.; Tyukavina, A.; Thau, D.; Stehman, S.V.; Goetz, S.J.; Loveland, T.R.; et al. High-Resolution Global Maps of 21st-Century Forest Cover Change. Science 2013, 342, 850–853. [Google Scholar] [CrossRef] [PubMed] [Green Version]
  101. Chaudhary, A.; Verones, F.; de Baan, L.; Hellweg, S. Quantifying Land Use Impacts on Biodiversity: Combining Species–Area Models and Vulnerability Indicators. Environ. Sci. Technol. 2015, 49, 9987–9995. [Google Scholar] [CrossRef] [PubMed]
  102. Pauly, D. Anecdotes and the shifting baseline syndrome of fisheries. Trends Ecol. Evol. 1995, 10, 430. [Google Scholar] [CrossRef]
Figure 1. Worldwide biomass of forests reported as growing stock volume (m3 per ha). Data from Santoro [20].
Sustainability 12 03557 g001
Figure 2. Worldwide biomass of cereal crops (barley, buckwheat, canaryseed, fonio, maize, millet, oats, quinoa, rice, rye, sorghum, triticale, and wheat) (tons per 100 km2). Data from Monfreda et al. [43].
Sustainability 12 03557 g002
Figure 3. Worldwide biomass of livestock (cattle, sheep, horse, goats) (individuals per 100 km2). Data from Gilbert et al. [57,58,59,60].
Sustainability 12 03557 g003
Figure 4. Worldwide reported catches of marine fisheries (tons per 100 km2). Data from Watson [71].
Sustainability 12 03557 g004
Figure 5. Schematic figure illustrates the optimization of economy and ecology in a multipurpose landscape, exemplified though livestock, forestry, and crop production (dotted lines, note: lines do not represent true values; they are only for illustration purposes). As production intensity increases from zero, the economic gain increases faster compared to the ecological cost or pain. However, as ecosystems are pushed towards more intensive or extensive production, the ecological pain—e.g. loss of biodiversity—increases, the gain/pain ratio reaches its maximum level and starts to decrease as ecological pain continues to increase. Identifying the economic gain/ecological pain optimum is crucial in the developing bioeconomies.
Sustainability 12 03557 g005

