Article

Engineering, Durability, and Sustainability Properties Analysis of High-Volume, PCC Ash-Based Concrete

1
Technology Research & Development Institute, DAELIM Industrial Co., Ltd., 36 Jongno 1-Gil, Jongno-Gu, Seoul 03152, Korea
2
Department of Safety Engineering, Seoul National University of Science and Technology, 232 Gongneung-ro, Nowon-gu, Seoul 01811, Korea
*
Author to whom correspondence should be addressed.
These authors contributed equally to this work as first author.
Sustainability 2020, 12(9), 3520; https://doi.org/10.3390/su12093520
Submission received: 21 March 2020 / Revised: 14 April 2020 / Accepted: 22 April 2020 / Published: 25 April 2020
(This article belongs to the Section Sustainable Engineering and Science)

Abstract

:
This study aims to analyze the engineering properties and durability of binary blended concrete incorporating pulverized coal combustion ash (PCC ash) produced in local areas and assesses the sustainability. For this, tests and evaluations were carried out under conditions in which the unit binder weight and unit water weight were fixed at 330 and 175 kg/m3, respectively, while the replacement ratio of PCC ash increased from 0% to 70% at 10% intervals. The results showed that the replacement ratio of PCC ash should be less than 38.9% in order to secure the target compressive strength (fck = 24 MPa) at the age of 28 days in field application. The durability test found that as the replacement ratio of PCC ash increased, the carbonation depth and relative dynamic elastic modulus increased, while the chloride penetration depth decreased. However, the weight–loss ratio remained similar. It was also found that the optimum PCC ash replacement ratio, which satisfies four durability parameters and can ensure the target compressive strength (fck = 24 MPa) in the case of mix proportion conditions set in this study, ranges from 20.0% to 38.9%. The sustainability assessment results showed that as the replacement ratio of PCC ash increased, the global warming potential (GWP), ozone layer depletion potential (ODP), acidification potential (AP), eutrophication potential (EP), photochemical ozone creation potential (POCP) and abiotic depletion potential (ADP) decreased. Therefore, it was proven that the replacement of PCC ash instead of ordinary Portland cement (OPC) under the same concrete mix proportions is effective at reducing environmental impacts.

1. Introduction

Concrete is one of the most widely used construction materials in the world and has been known to cause serious environmental pollution because it consumes huge amounts of energy and raw materials. Therefore, it can have a significant effect on sustainability [1,2]. In particular, ordinary Portland cement (OPC), which is the most important component in concrete, is responsible for the wasting of resources, huge consumption of energy, and environmental pollution [3]. In addition, carbon dioxide emissions from cement production contribute to global warming [4]. Meanwhile, high levels of dust flying from the cement production process can pollute the air and generates fumes, thereby causing environmental pollution [5]. Therefore, in order to achieve sustainable development, it is important to reduce the amount of cement and find an alternative to cement [6]. In response, research has actively been conducted regarding methods that use fly ash (FA) as supplementary cementitious materials (SCMs) in concrete. The replacement of OPC with FA is known to have certain advantages, such as improved processability and durability, in terms of economy and performance [7,8].
FA is a kind of an industrial by-product and fine ash is produced during the coal combustion process [9]. FA is classified on the basis of several standards. According to American society for testing and materials (ASTM) C618 [10], FA is divided into two classes: Class F and Class C based on raw materials and ingredients. The primary difference between the two classes is the amount of calcium, silica, alumina and iron content in the ash [11,12]. Circulating fluidized bed combustion (CFBC) ash is an industrial by-product from the coal combustion process in a circulating fluidized bed boiler and differs from ash generated from a conventional pulverized fuel-fired combustion power plant not only in terms of shapes, but also in minerals and chemical components [13,14]. CFBC ash is not particularly suitable for concrete mixtures due to its high LOI (loss on ignition) and CaO content. However, it is characterized as a material used for ground improvement applications since it has a high content of CaO and can be used as an alkaline activator [15,16]. In this regard, this study sought to apply pulverized coal combustion ash (PCC ash) as a substitute for OPC that can be applied to normal-weight concrete.
Many studies have been conducted regarding concrete incorporating PCC ash. Van Nguyen et al. [17] demonstrated through experiments that the compressive strength of PCC ash concrete decreases at the early stages, but increases in the long run as the chemical process of hydration continues. Malhotra et al. [18] experimentally confirmed that the initial strength of PCC ash concrete is much lower than that of concrete without PCC ash and then reported that the pozzolanic reaction of PCC ash is a slow process. Barbhuiya et al. [19] reported that the compressive strength loss of concrete was at its lowest when OPC was replaced by 30% PCC ash and 10% ultra-fine PCC ash in a sulfuric acid environment, while that of concrete containing 20% to 30% PCC ash and 10% ultra-fine PCC ash was the lowest in a nitric acid environment. Kurda et al. [20] argued that the application of PCC ash to cement concrete has many advantages, such as reducing cement consumption, improving the workability of concrete, reducing creep, hydration heat and thermal expansion of concrete, and improving the impermeability of concrete. In addition, Zhu et al. [21] conducted tests on modified engineered cementitious composites (ECC) incorporating PCC ash to examine the ductility and compressive strength properties. The results confirmed that the addition of PCC ash results in a characteristic that the compressive strength decreases by about 40% but has a positive effect on the ductility improvement of ECC. According to Ma et al. [22], the incorporation of PCC ash into modified high-performance concrete (HPC) made a considerable contribution to the improvement of freeze–thaw resistance. However, it was also reported that PCC ash has a positive effect on the long-term mechanical properties and durability of concrete but adversely affects early strength.
Research is also being conducted to overcome the disadvantages of the application of PCC ash. Mohammed et al. (2018) [23] has developed a high-volume fly ash roller compacted concrete (HVFA RCC) that can improve the performance of the existing RCC. Crumb rubber (CR) was replaced with 0%, 10%, 20%, and 30% volumes, and nano silica (NS) was replaced with 0%, 1%, 2%, and 3% of the weight of cementitious materials to make up for the loss of strength. As a result, it was proved that the unit weight, compressive strength, rebound number, ultrasonic pulse velocity and dynamic modulus of elasticity of HVFA RCC pavement decreased as the content of CR and NS increased. In addition, Kumar et al. (2019) [24] introduced NS into HVFAC, and evaluated the strength and durability of concrete at 28, 56, and 90 days. As a result, it was evaluated that the use of 2% NS in HVFAC increased the strength and durability properties to a level similar to that of ordinary concrete after 28 days, so that it could be continuously used in solid pavement construction. Meanwhile, Adamu et al. (2016) [25] point out that the biggest problem when RCC is used in pavement is dynamic fatigue load from moving vehicles. To solve this, it was confirmed that ductility and bending deformation are improved by using CR for RCC. In addition, an improvement method was proposed for the disadvantages of deterioration in mechanical performance and durability of RCC due to deformation and elastic properties of rubber. In other words, by introducing NS into the RCC, it was proved that the interfacial transition zone (ITZ) between CR and cement paste can be improved and the concrete matrix can be compacted due to the filler ability of NS.
In addition, there are also research results focusing on the durability of PCC ash concrete as follows. Chuet al. (2019) [26] conducted experiments with PCC ash 0~30%, silica fume 0~10%, plasticizer 0.3% and 0.4%, to examine cement pastes for application in tropical climate marine environments such as Vietnam. As a result of the test, the optimum formulation was analyzed to be 20% PCC ash, 10% silica fume, and 0.4% plasticizer. In conclusion, it has been demonstrated that PCC ash and silica fume can improve the corrosion and wear resistance of concrete in coastal areas of tropical climates such as Vietnam. Additionally, Naibaho (2018) [27] set the PCC ash replacement rate to 0%, 10%, 20%, and 25%, soaked in seawater for 26 days, and then conducted a compressive strength test on the 28th day. As a result, the highest compressive strength was obtained when 10% of PCC ash was replaced. On the other hand, according to Thomas (2007) [28], a fly ash content of up to 50% may be suitable for most elements if the project’s initial strength requirements can be met and adequate moisture curing can be ensured. In particular, it has been reported that the amount of PCC ash should be limited if adequate curing is not possible or concrete is exposed to freezing and thawing in the presence of deicer salts (e.g., ≤25%).
As described above, when PCC ash is substituted for OPC, various performances such as durability of concrete can be improved, but there is a characteristic that premature compression strength and mechanical performance are reduced. As a countermeasure against this, many studies have been conducted to apply silica fume. However, in order to apply high volume PCC ash-based concrete to the actual site, it is difficult to use silica fume because the material cost of concrete must be considered. Therefore, for practical use in the local field, it is necessary to study the guide for the optimal formulation that can cope with the reduction in compressive strength and ensure durability by using only PCC ash materials. In addition, an environmental impact assessment needs to be performed to develop a PCC ash-based binder with excellent durability.
Therefore, this study sought to analyze the engineering properties and durability of binary blended concrete incorporating high-volume PCC ash and evaluate the sustainability. It also attempts to derive the optimum PCC ash replacement ratio and analyze the degree of environmental impact reduction so that it can be applied in the actual construction site. For this, the unit binder weight and unit water weight were set to 330 and 175 kg/m3, respectively. In series I, particle size distribution, scanning electron microscope (SEM), X-ray fluorescence (XRF), and grading distribution of aggregate were conducted to analyze the properties of raw materials. Slump, air content and compressive strength were also measured for the analysis of the engineering properties in series II. In addition, in series III, durability performance was examined by analyzing carbonation depth, chloride penetration depth, relative dynamic elastic modulus, and weight loss ratio. Finally, for the Sustainability properties analysis of series IV, the global warming potential (GWP), ozone layer depletion potential (ODP), acidification potential (AP), eutrophication potential (EP), photochemical ozone creation potential (POCP) and abiotic depletion potential (ADP) was evaluated.

2. Methods and Materials

2.1. Materials

Table 1 shows the chemical compositions of the OPC and PCC ash used in this study. Cement clinker is primarily composed of alite, belite, and celites, which contain a combination of four oxides: CaO, SiO2, Al2O3 and Fe2O3, while PCC ash has a larger content of SiO2, Al2O3 and Fe2O3 compared to OPC. In addition, the physical properties of the used materials are summarized in Table 2. Type 1 (KS L 5201) [29] with a specific surface area of 3322 cm2/g was used for the OPC, whereas Type 2 (KS L 5405) [30] with a specific surface area of 3964 cm2/g was used for the PCC ash. A fine aggregate was made by mixing washed sea sand and crushed sand, and crushed granitic aggregate was used as coarse aggregate. In addition, polycarboxylic acid group was used for the chemical admixture.

2.2. Experimental Procedures

Table 3 shows the mixing proportions of the concrete (ready-mixed concrete specification 25-24-180) used in this study. The unit binder weight, unit water weight and curing temperature were fixed at 330, 175 kg/m3 and 20 °C, respectively. The binder types are divided into OPC and PCC ash, and the admixture replacement ratio ranged from 0% to 70% at 10% intervals. In order to make the W/B ratio constant, the experiment was conducted by adjusting the chemical admixture content so that the target slump could be satisfied.

2.3. Test Methods

Figure 1 presents the research process which is conducted by four Series such as (I) Raw material analysis, (II) Engineering properties analysis, (III) Durability properties analysis, and (IV) Sustainability properties analysis.
Table 4 shows the test methods for each evaluation item. In Series I, particle size distribution, scanning electron microscope, XRF and grading distribution were measured for raw material analysis. The test methods were in compliance with ASTM C204 [31], ASTM C1723 [32], ASTM C114 [33] and ASTM C136 [34].
For Series II, the slump test was conducted in accordance with ASTM C143, the air content measurement in accordance with ASTM C231 [35], and the compressive strength test in accordance with ASTM C873 [36] and ASTM C39 [37], respectively. The size of compressive test specimens was Ø100 × 200 mm. Additionally, the compressive strength test was conducted by a ready-mixed concrete company to be delivered to the actual construction site. In the production of test specimens, the amount of chemical admixture was adjusted to satisfy the target slump under the condition that the water content was fixed. Until evaluation, all specimens were managed with standard water curing (20 ± 3 °C). In addition, the specimen production and standard water curing pictures are shown in Figure 2.
In Series III, the measurement of carbonation depth and chloride penetration depth was performed based on KS F 2584 (specimen size: Ø100 × 200 mm) [38] and NT Build 492 (specimen size: Ø100 × 50 mm) [39]. In particular, in the case of carbonation test, a test specimen was prepared according to KS F 2584, and standard curing was performed for four weeks before the carbonation test, and then placed in a constant place for eight weeks at a temperature of 20 ± 2 °C and a relative humidity of 60 ± 5%. Then, after sealing both ends (poured surface, bottom surface) of the specimen, the depth of carbonation was measured while the test specimen was exposed to conditions of 20 ± 2 °C, relative humidity 60 ± 5%, and carbon dioxide concentration 5 ± 0.2%. Relative dynamic elastic modulus and weight loss ratio tests were conducted in accordance with ASTM C666 (specimen size: 100 × 100 × 400 mm) [40]. In order to measure the carbonation depth, a test specimen was fabricated and underwent standard curing until 28 days of age. Then, an accelerated carbonation test was carried out, and the carbonation depth was measured at four and eight weeks after the start of the test. For the measurement of chloride penetration depth, a 0.5 M NaCl solution was used as a catholyte. Meanwhile, as an anolyte, a saturated Ca(OH)2 solution was used to perform a chloride ion penetration resistance test according to the potential difference.
Meanwhile, in Series IV, a life cycle assessment (LCA) was performed based on four steps of ISO 14040 [41] in order to evaluate the sustainability according to the replacement ratio of the PCC ash: (i) goal and scope definition; (ii) life cycle inventory analysis; (iii) life cycle impact assessment (LCIA); and (iv) results from analysis and interpretations [42,43].
(i)
Goal and scope definition: The environmental impacts of OPC and PCC, generated from the concrete manufacturing process, are analyzed using all the materials of concrete. The functional unit is defined as OPC, PCC ash, and water in a concrete mix with a 1 m3 size [42,43]. In the LCA of OPC and PCC considering their type, the W/B and replacement ratios are calculated to assess the environmental-impact value [42,43,44].
(ii)
Life cycle inventory analysis: The environmental-impact substance from OPC and PCC can be determined through life cycle inventory analysis. The input and output LCA to produce OPC, PCC ash and water are calculated using the life cycle inventory database (LCI DB) in South Korea [42,43,44,45]. For example, according to Korea National LCI DB, the PCC ash (kg-eq) is calculated from the pre-production stage, transport stage, and production stage. The consumption of energy, and water is also considered at these stage [45].
(iii)
LCIA: This process converts the environmental-impact substances from LCIA into the environmental impacts. The LCIA process includes (i) classification, (ii) characterization, (iii) normalization, and (iv) weighting. While classification and characterization are mandatory for calculating the environmental impact, normalization and weighting are optional. Thus, in this study, the characterized environmental impact was calculated through classification and characterization using Equation (1).
CI i = CI i , j = ( Load j × eqv i , j )
where CIi is the characterized impact of the category (l). CIi,j is the characterized impact of the list item (j) in the category (i) in the one-unit function, Loadj is the environmental load of the list item (j), and eqvi,j is the characterization coefficient value of list item (j) in the category (i).
(iv)
This study is based on the “environmental labeling type III” standard, the characterized environmental impacts were categorized under six headings: (i) GWP; (ii) ODP; (iii) AP; (iv) EP; (v) POCP; and (vi) ADP [42,43]. As shown in Table 5, the characterized environmental impacts index is calculated and presented based on the LCI DB as kilogram equivalent(kg-eq) [42,45].
Additionally, research has been conducted recently regarding the environmental impact assessment of admixture substitute concrete [46,47]. In this study, numerical calculations of environmental impacts for each admixture used in concrete were carried out. Fanand Miller considered four groups of admixtures as the environmental impacts of CO2 to exhibit the optimal concrete compressive strength. Meanwhile, several recent studies have discussed the efficient use of binders to reduce CO2 emissions. In general, a larger amount of binder is required to increase the compressive strength of concrete. However, as the strength of concrete increases, the size of the binder able to reduce CO2 emissions decreases [48]. Therefore, it is helpful to evaluate the CO2 emissions of concrete with the binder content required to increase the strength by 1 MPa. In this vein, the concept of Bi and Ci [49,50] was introduced in this study, and each functional equation is as follows.
Bi = B/ f′c
where Bi is the binder intensity (kg/m3∙MPa−1), B is the binder weight, and f′c is the concrete compressive strength.
Ci = Ce/f′c
where Ci is the CO2 intensity (kg CO2/m3∙MPa−1), Ce is the corresponding CO2 emissions, and f′c is the concrete compressive strength.

3. Experimental Results and Discussion

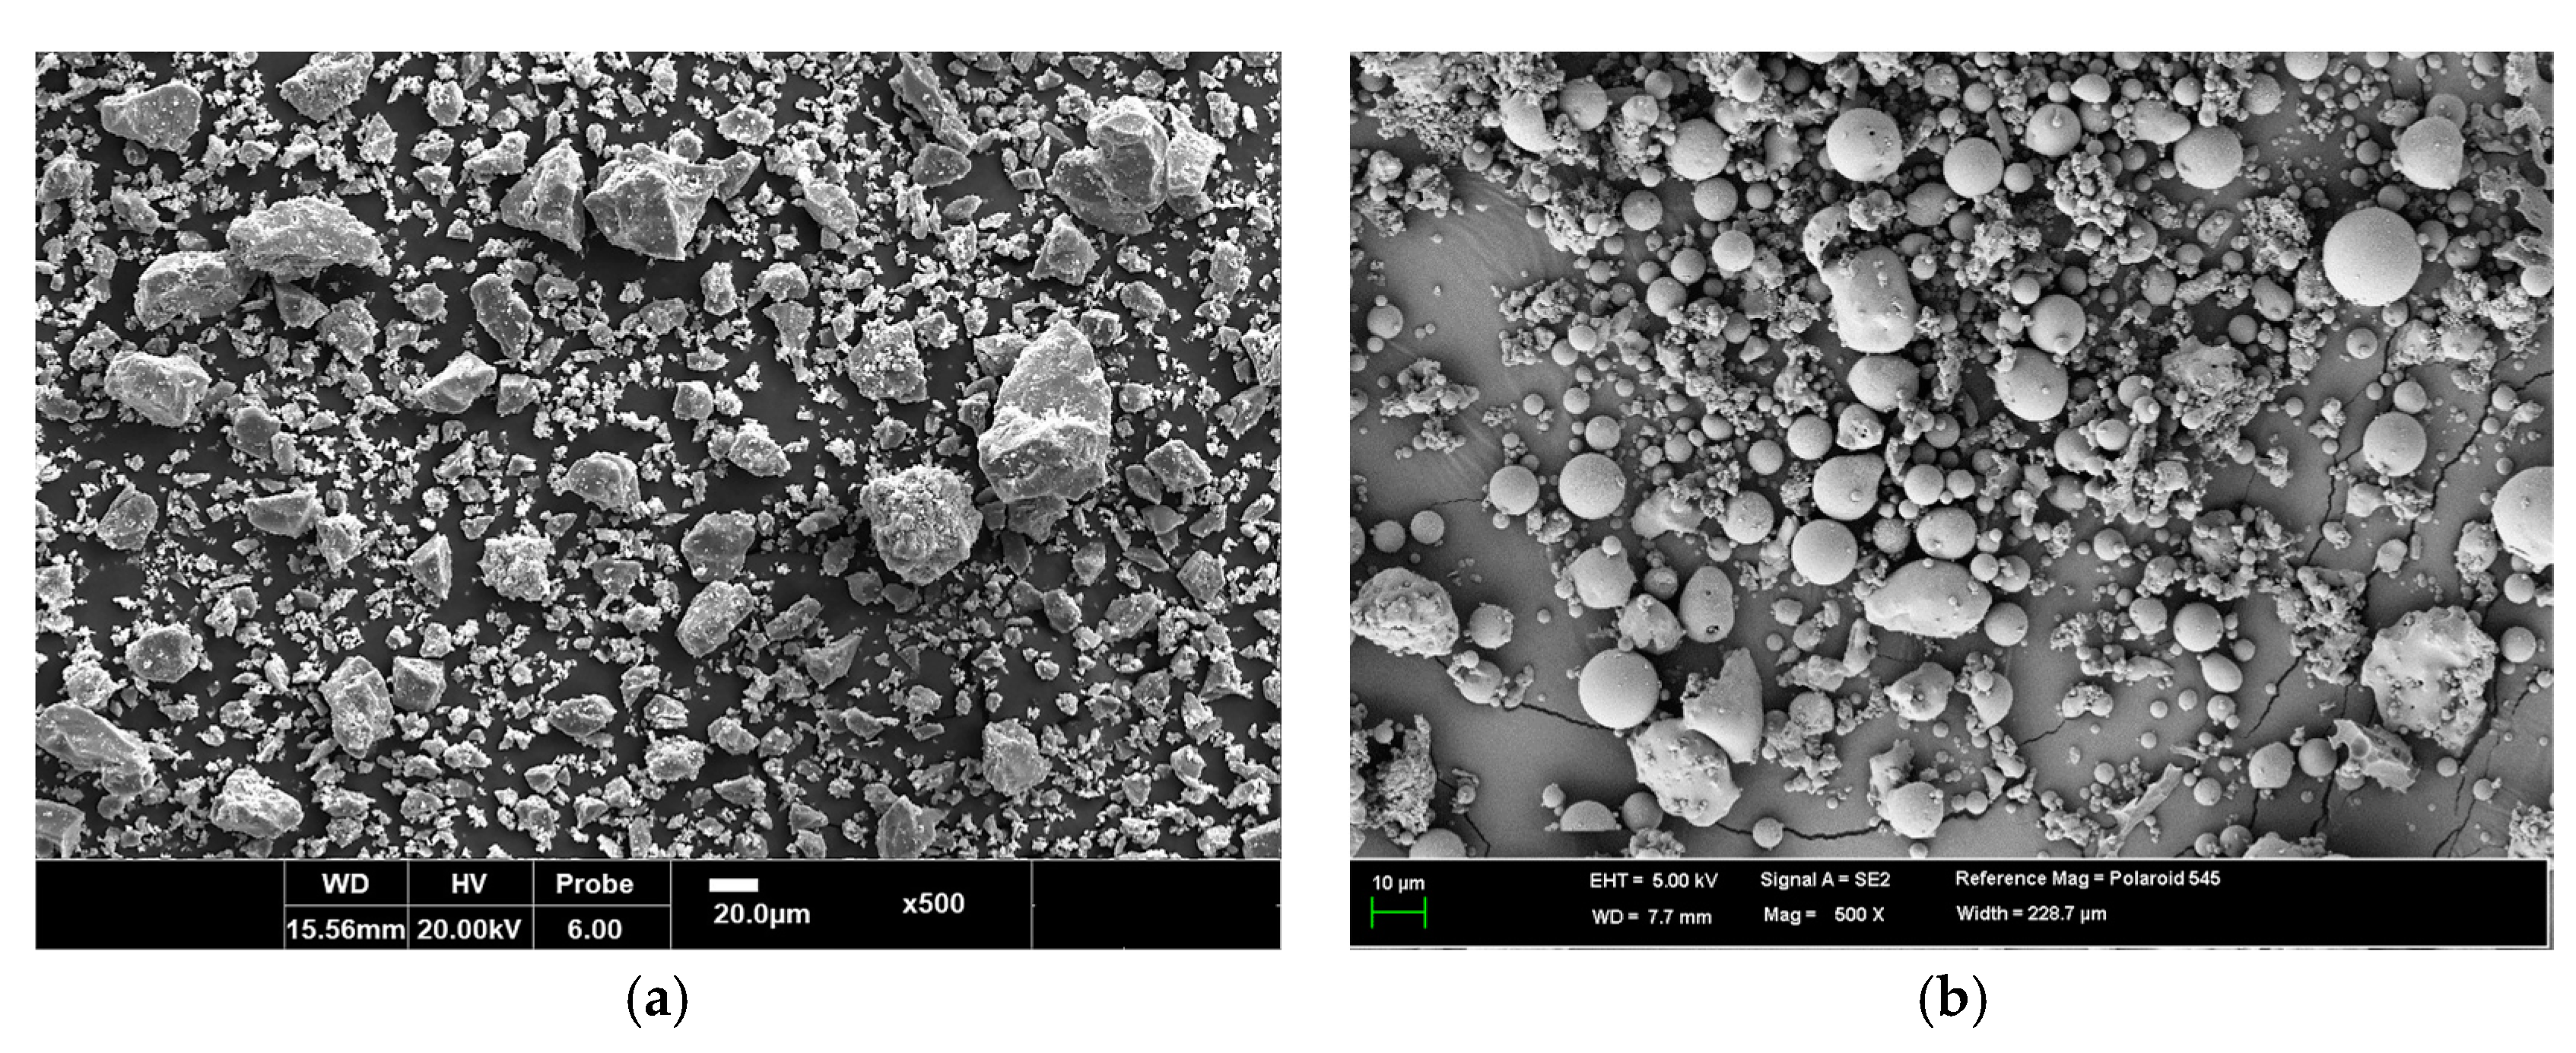
3.1. Raw Material Properties Analysis

Figure 3 shows the particle size distribution of the OPC and PCC ash used in this study. The mean size and fineness modulus of the OPC and PCC ash were 19.46 µm-1.18 and 21.30 µm-1.23, respectively. In order to observe the detailed granule shape of the OPC and PCC ash powder, the SEM (Emcrafts, Gwangju-si, Korea) analysis was conducted using Genesis-2020, as shown in Figure 4. The SEM analysis found that, in the case of the OPC, particles larger than 10 µm are oval-shaped polyhedra, while particles less than 10 µm are amorphous crystals. On the other hand, PCC ash was found to be characterized by a mixture of large sphere-shaped particles and irregular crystals. Therefore, it was analyzed that workability could be improved by replacing PCC ash with OPC. Thomas (2007) [28] reported that the well-proportioned PCC ash concrete mixture improved workability compared to OPC concrete. The reason is that the spherical particle shape of PCC ash lubricates the mix. As a result, it means that PCC ash concrete flows better than OPC concrete under the same slump condition.
In addition, tests for a sieve analysis of aggregates were conducted to analyze the grading of the mixed fine aggregate and crushed coarse aggregate used in this study. The results showed that the passing rate standards for each sieve opening size of mixed fine aggregate and crushed coarse aggregate were all satisfied as shown in Figure 5, and the fineness modulus was found to be 2.84 and 6.94, respectively.

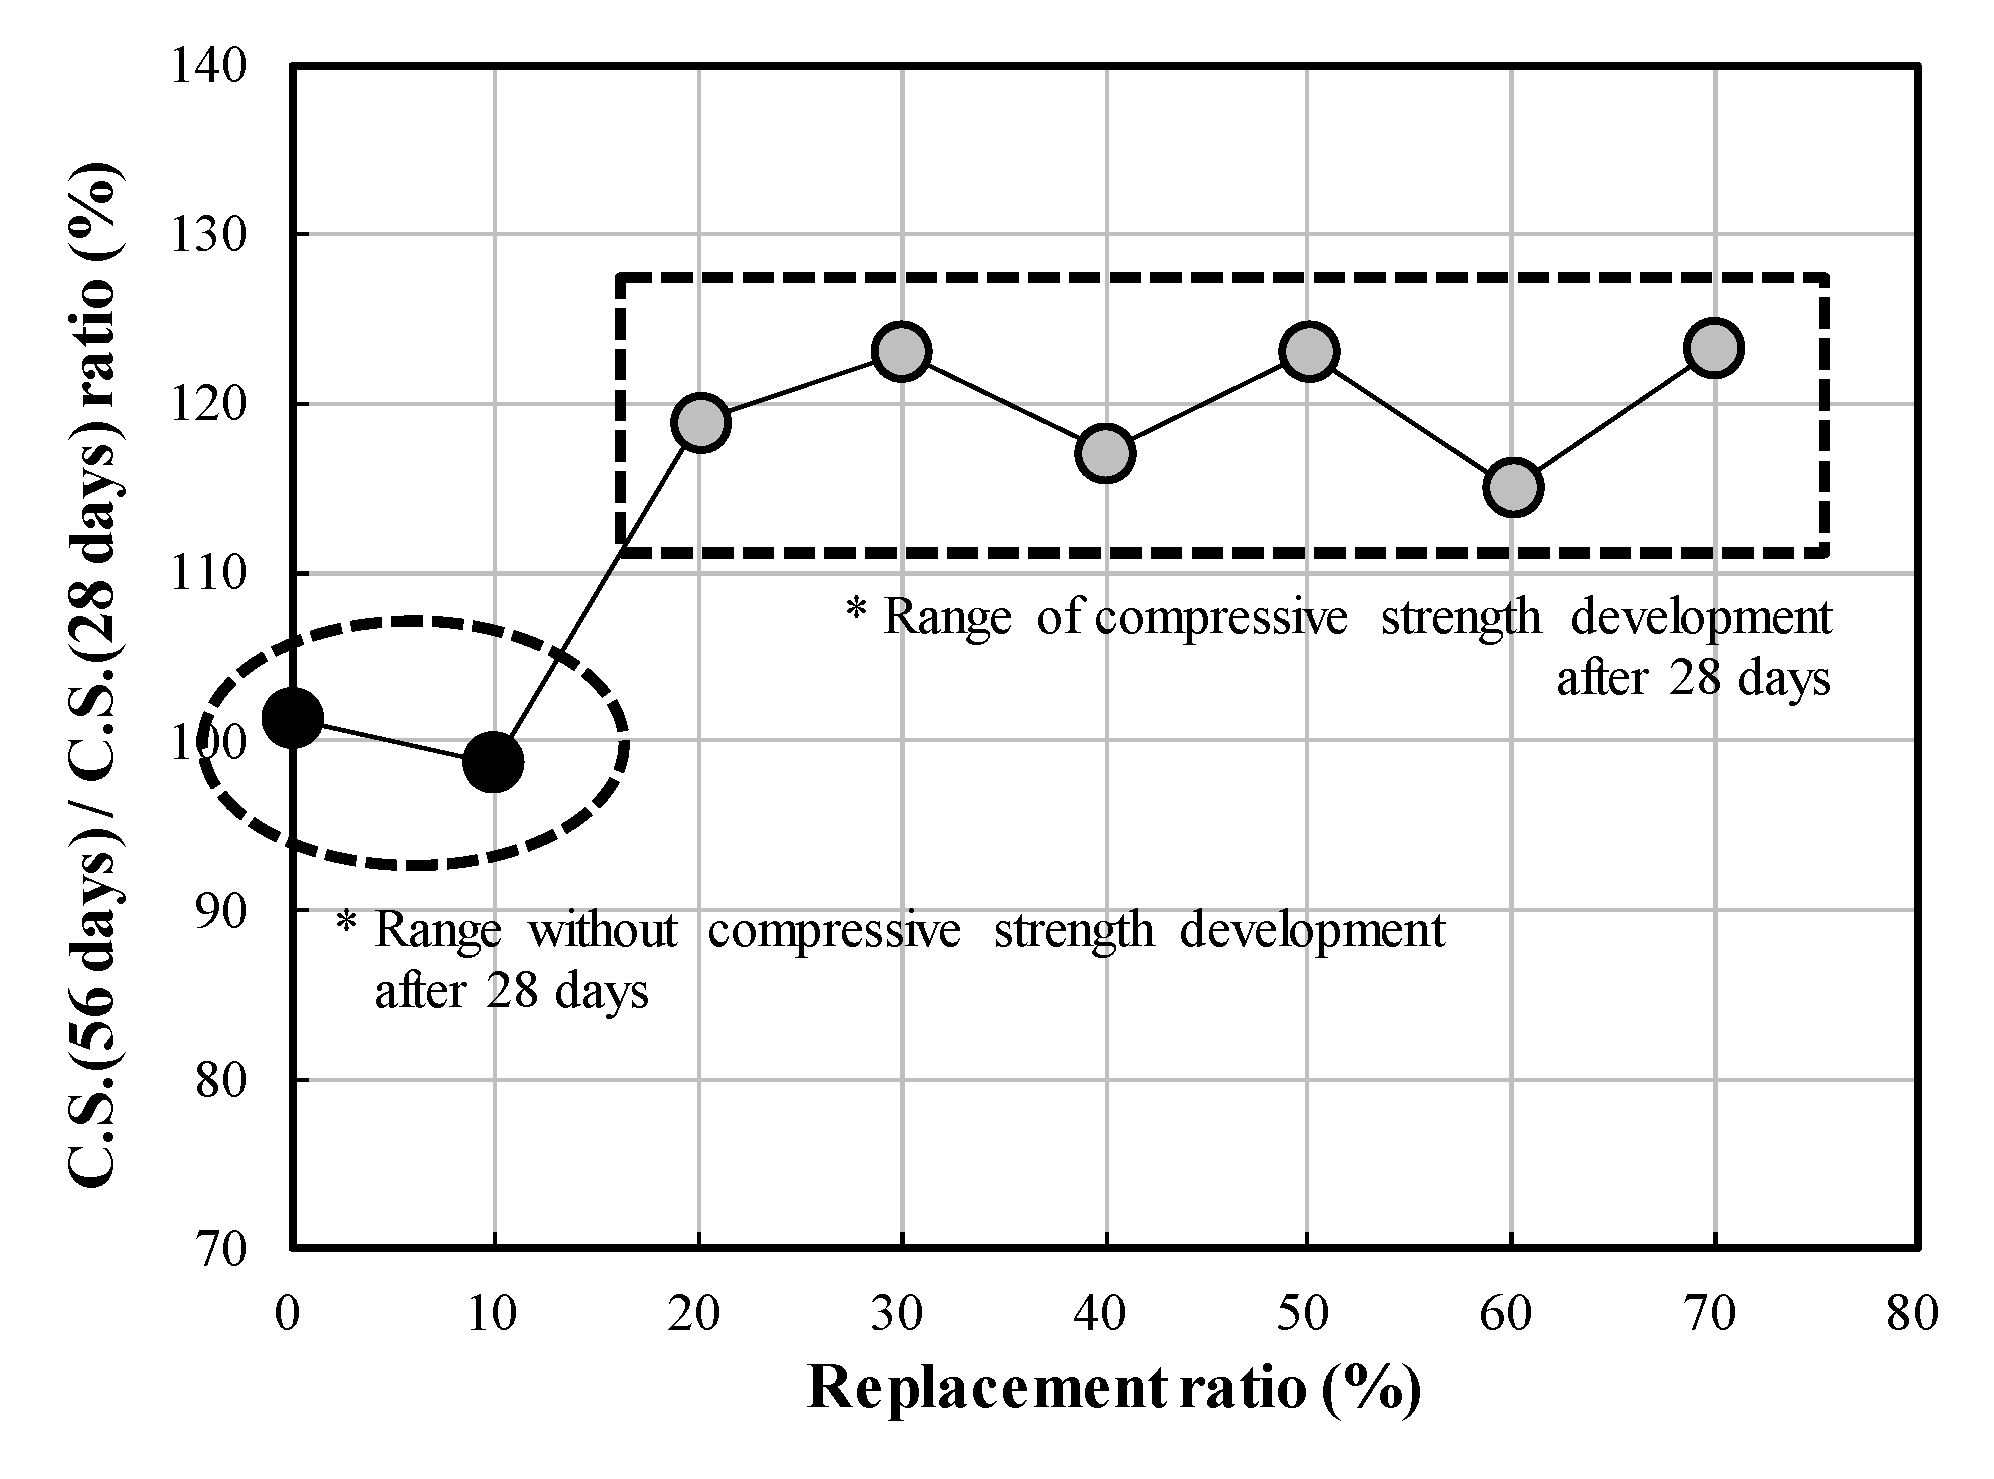
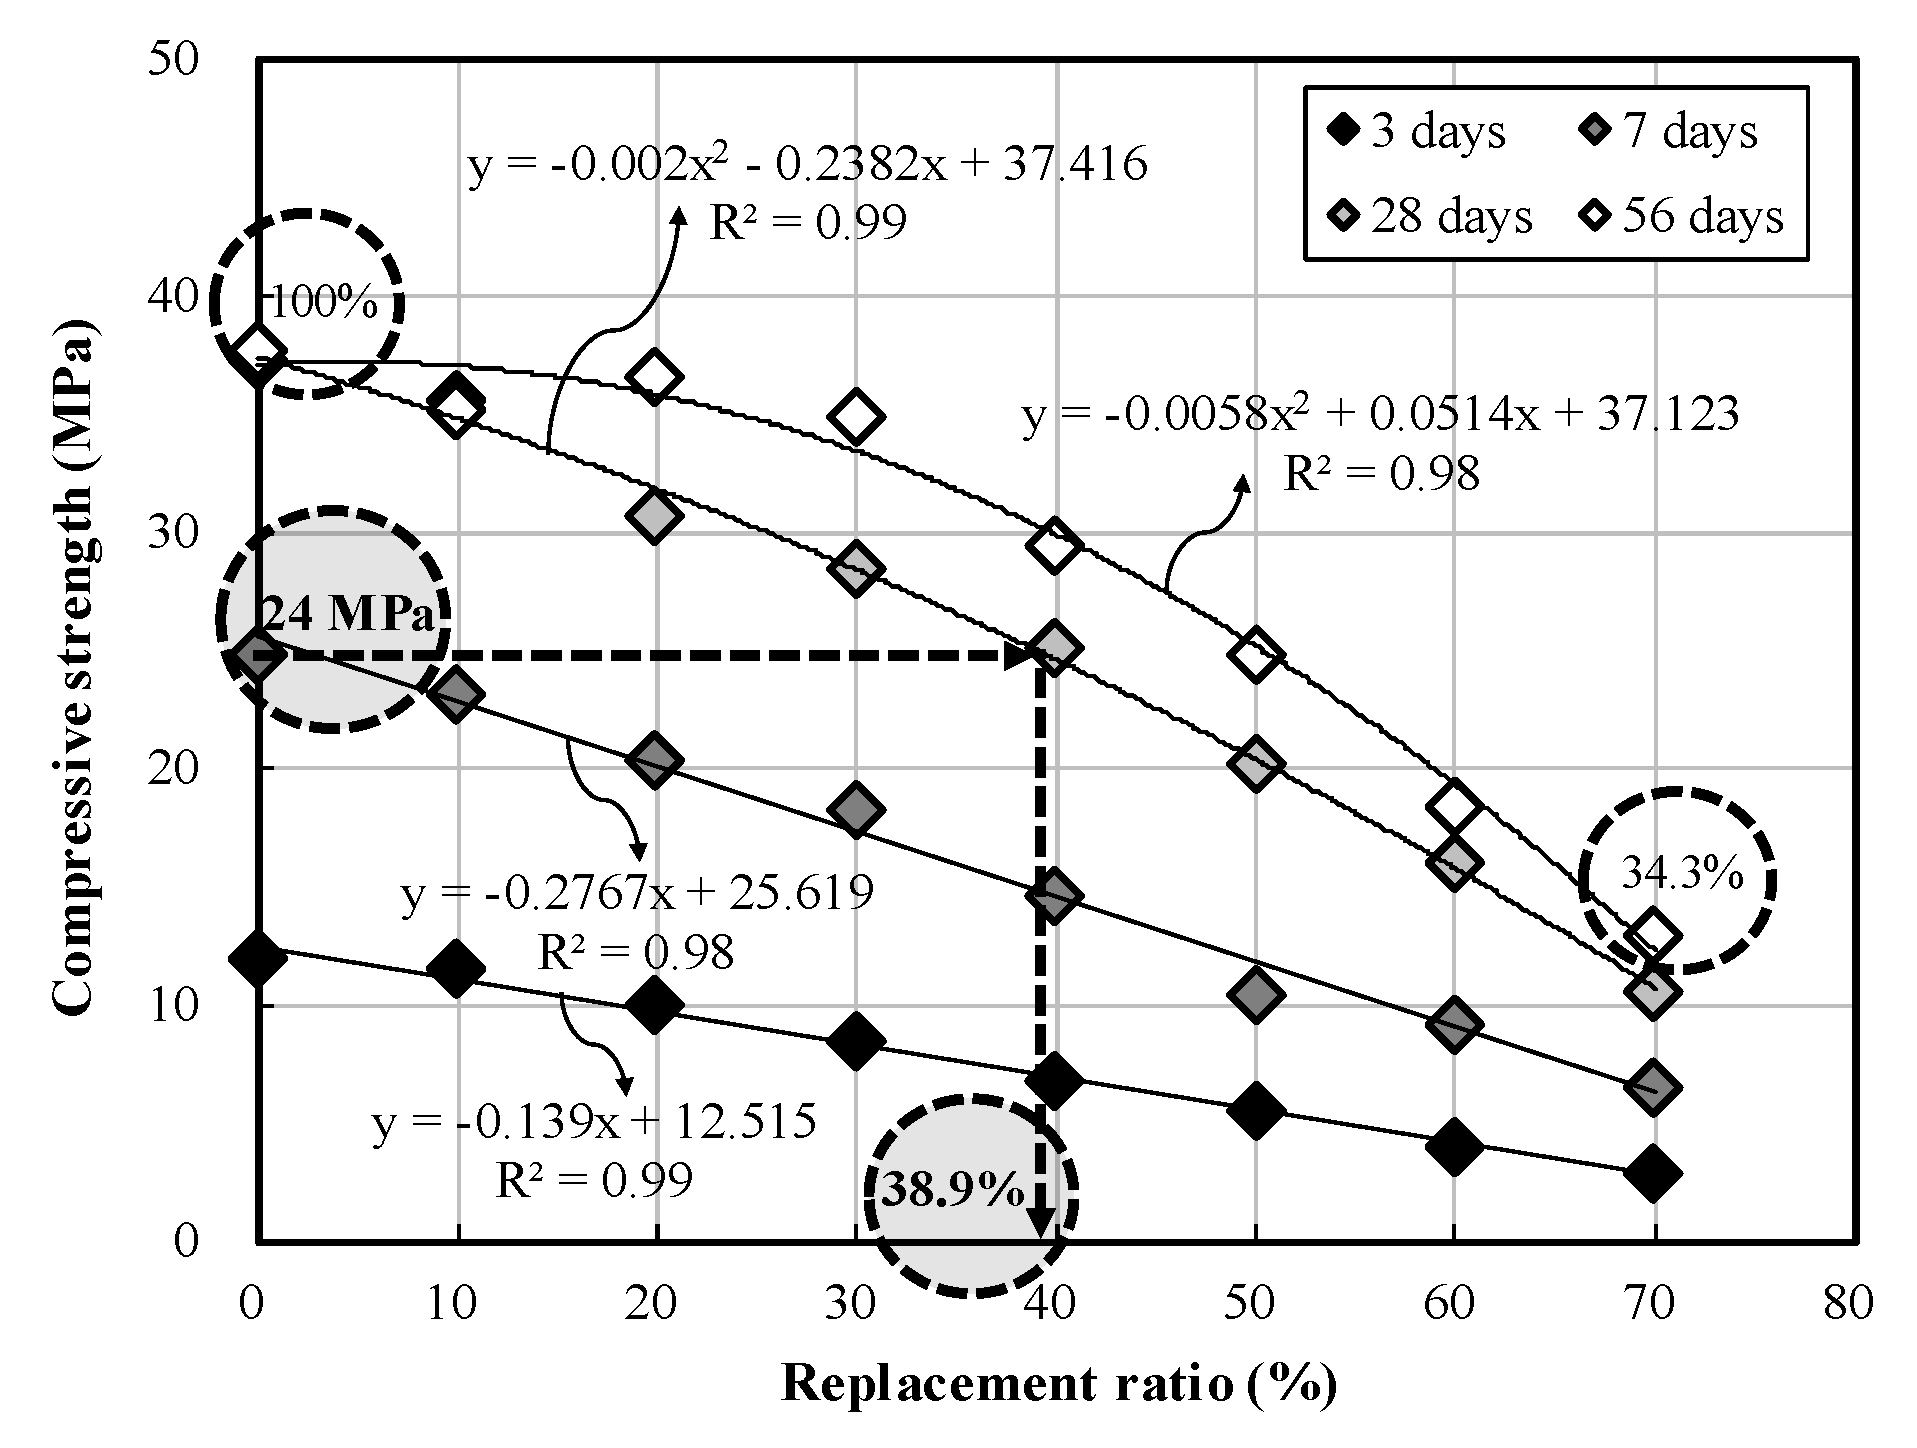
3.2. Engineering Properties Analysis

Figure 6 shows the measurement results of the slump and air content of fresh concrete according to the replacement ratio of the admixture. The targets (180 ± 25 and 4.5 ± 1.5 mm) were all met in all mix proportions. Figure 7 shows variations in compressive strengths by the replacement ratio according to the curing age in the hardened concrete. Overall, the compressive strength increased with age, but there was almost no strength development after 28 days when the replacement ratio ranged from 0% to 10%. In order to analyze the compressive strength development after 28 days, compressive strengths (C.S., 56 days) / C.S. (28 days) by replacement ratio were calculated as shown in Figure 8. Here, 100% means ratio 1.0 (i.e., C.S. (28 days) and C.S. (56 days) are the same). The results confirmed that the compressive strength development ratio ranged from 115% to 123.3% at a PCC ash replacement ratio of 20% or higher. This suggests that a long-term strength development effect occurs at the level of replacement ratio above 20%.
Figure 9 shows variations in the compressive strength of the specimen according to the replacement ratio. As the replacement ratio increased, the overall compressive strength showed a tendency to decrease. This result is similar to that of effective research. According to a study by Thomas (2007) [28], the higher the replacement level of PCC ash, the lower the initial strength, but improved the development of long-term strength. However, although there was compressive strength development after 28 days, the compressive strength at 58 days decreased rapidly in the range with a replacement ratio of 40% or higher. Therefore, in order to secure the target compressive strength (fck = 24 MPa) at 28 days in field application, the replacement ratio of PCC ash should be maintained at 38.9% or less.
In this study, compressive strength was measured after curing in fresh water, but in the study of Naibaho (2018) [27], the test specimens were immersed in sea water and then the compressive strengths of the specimens were compared. As a result of measuring the compressive strength on the 28th day after soaking in seawater for 26 days, when the mixing ratio of PCC ash was increased from 0% to 10%, the compressive strength at the age of 28 days increased by about 6.16%. On the other hand, when the content of PCC ash was increased to 20% and 25%, the compressive strengths decreased by 9.13% and 22.49%, respectively. Therefore, in the future, analysis and research on the performance of compressive strength under seawater conditions is additionally required.

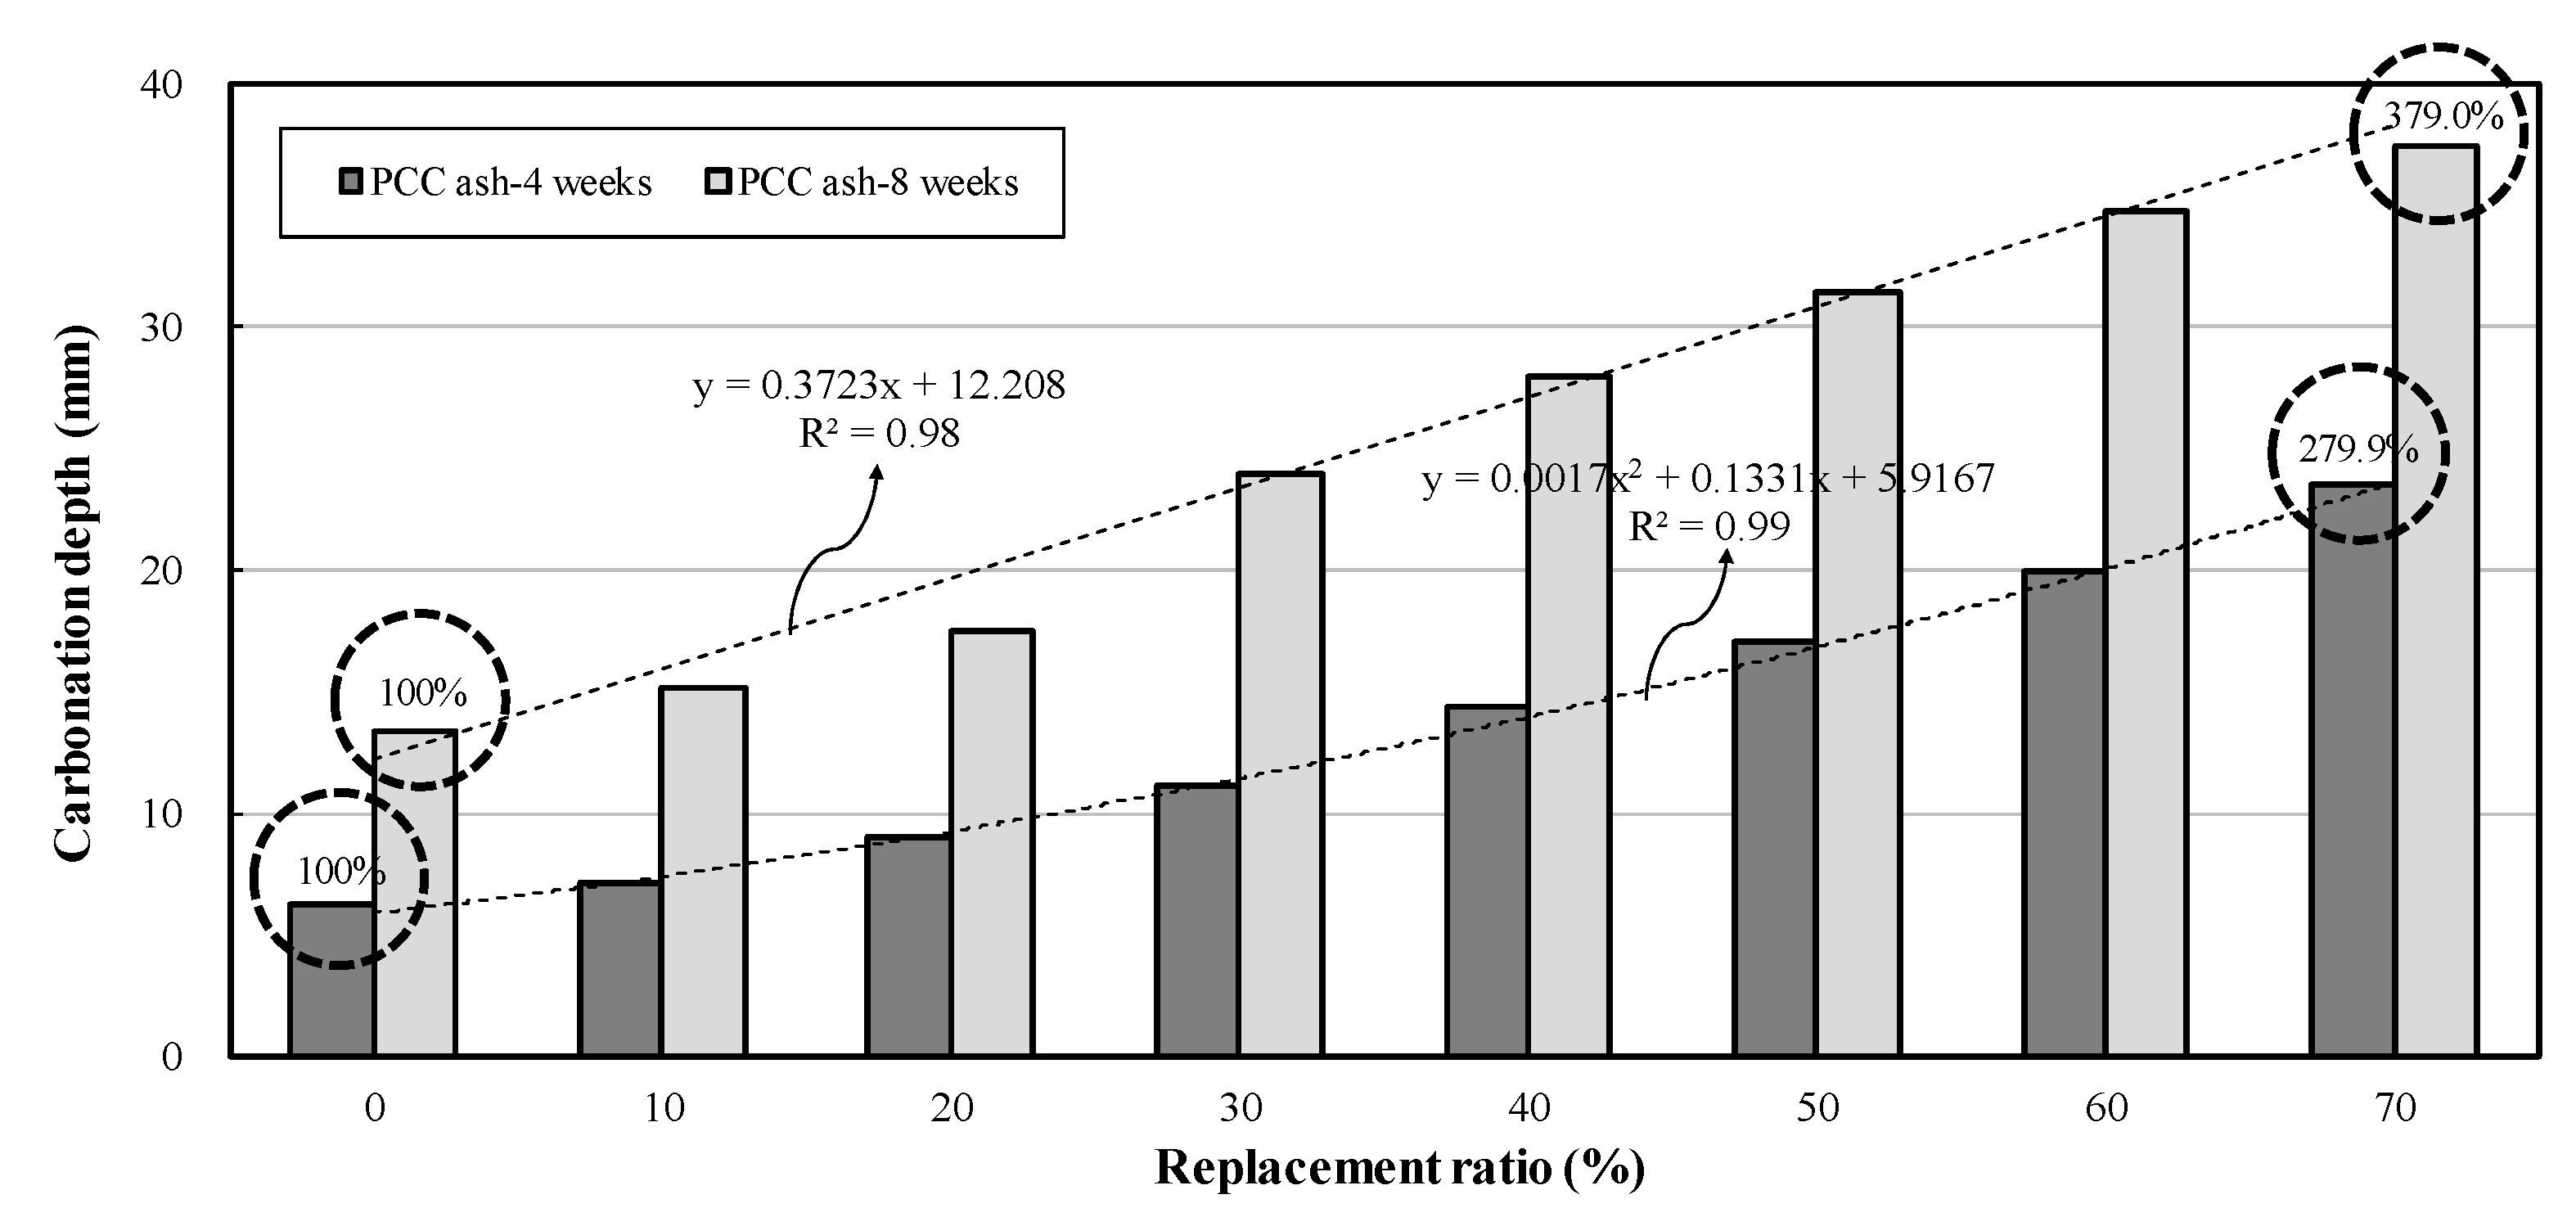
3.3. Durability Properties Analysis

Figure 10 shows the measurement results of carbonation depths according to the replacement ratio of PCC ash. Overall, as the replacement ratio of the admixture increased, the carbonation depth tended to increase as well. These results were also shown in study of Thomas and Matthews (1992) [51]. The inclusion of PCC ash at the same W/B ratios increases the rate of carbonation. In addition, this increase by PCC ash was found to be higher in poorly cured concrete with a high replacement rate and low strength. When compared to the lowest result value obtained at a replacement ratio of 70% in the specimen with the age of four and eight weeks, it increased by up to 279.9% and 379.0%, respectively.
The measurement results of chloride penetration depths according to the replacement ratio of the admixture are shown in Figure 11. Overall, the chloride penetration depth decreased as the replacement ratio increased. The ratio of the highest value to the lowest value was 153.3%, and the resistance to chloride attack was found to be excellent when the replacement ratio was more than 35%. Thomas and Wilson (2002) [52] also reported that PCC ash reduces the permeability of concrete to water and gas if concrete is properly cured. This is due to the improvement of the pore structure [53]. In addition, according to Thomas (2007) [28], at 28 days, as the FA content increased, the charge passed increased, and the chloride permeability of concrete containing 56% FA was almost twice that of the control concrete without FA. However, the charge passed rapidly decreased with time of FA concrete, and the tendency of chloride permeability to decrease with increasing FA content up to 180 days was reversed. In addition, the chloride penetration rate decreased significantly as the FA content increased, and the chloride content of concrete with 50% FA rarely increased during the initial 28-day period. In addition, the relative dynamic elastic modulus and weight reducing ratio were measured to examine the effects of the replacement ratio on freeze–thaw cycles or other chemical reactions.
Figure 12a shows changes in the relative dynamic modulus according to the replacement ratio of the admixture. The overall relative dynamic elastic modulus showed a tendency to increase as the replacement ratio of the admixture increased. The relative dynamic elastic modulus was low in the range with a replacement ratio of 20% or less. This result suggests that the replacement ratio should be maintained at 20% or higher in order to secure freeze–thaw resistance. Meanwhile, in order to examine the effects of the replacement ratio on the surface degradation of the specimen, the weight loss ratios of the specimen before and after the test according to the replacement ratio of the admixture were measured as shown in Figure 12b. The weight loss ratio of all specimens except for the case of replacement ratio 0% was higher than 100%. Therefore, it is judged that the management of mix design considering the relative dynamic elastic modulus and weight reducing ratio will be needed in future field applications. This result is similar to some studies that showed satisfactory performance in terms of resistance to cyclic freezing and thawing, and deicer salt scaling when PCC ash was replaced by 30% or more [54,55]. In addition, according to the study of Chu et al. (2019) [26], the samples with PCC ash had a lower rate of chloride ion and sulfate ion permeability than the control group. The reason is that the presence of PCC ash increases the amount of C3A due to the higher amount of alumina present in the mixture. As well as the use of PCC, ash increases the calcium silicate hydrate (C-S-H) content formed in the pozzolanic reaction to make chloride physically binding [56]. According to Thomas (1997) [57], however, various studies have found that concrete containing FA may be less resistant to scaling when subjected to freezing and thawing in the presence of deicer salts. In addition, it has been reported that as the content of PCC ash increases, especially at high levels of replacement (e.g., ≥40 to 50%) scaling mass loss increases. Therefore, it is considered that further research is needed to analyze the detailed factors for the results revealed in this study.
Recently, studies have been conducted on slurry infiltrated fiber concrete (SIFCON) capable of up to 20% by volume steel fiber content with outstanding strength, ductility, and crack/spall resistant properties [58]. In particular, it is important to consider the effect of temperature on resistance of concrete to be applied to actual construction sites. Hashim and Kadhum (2020) [59] suggest that the compressive strength of SIFCON decreases rapidly when the temperature rises above 600 °C, and the decrease in the modulus of elasticity is more important than the decrease in compressive strength at the same flame temperature. The residual compressive strength and modulus of elasticity at 900 °C were experimentally proved to be in the range of 52.1% to 59.6% and 30.6% to 34.1%, respectively. Additionally, Farnam et al. (2010) [60] tested by giving four different confining pressure levels (0, 5, 15, and 21.5 MPa) to cylindrical specimens with different volumes (0%, 2%, 5%, and 10%) of steel fibers. As a result, it was proved that the peak stress, energy absorption, toughness and Poisson’s ratio increased as the volume of the steel fiber increased, while the peak stress, energy absorption and toughness increased with increasing confining pressure. It has been reported that concrete can act as a plastic material. Meanwhile, Harbi and Izzet (2018) [61] reviewed the performance of composite prestressed concrete beam topped with reinforced concrete flange structures in the event of a fire. Test results have shown that exposure to fire temperature increases in addition to decreasing the stiffness of the beam and the modulus of elasticity of the concrete in all periods of the combustion and cooling cycles and residual cambers, as well as increasing the camber of the composite beam. As such, it is important to study the effect of temperature on resistance when studying durability of concrete. Therefore, in future studies, it is considered that durability properties according to high temperature of PCC ash-based concrete need to be analyzed.
The optimal replacement ratio for ensuring durability performance was derived as shown in Figure 13. In order for concrete incorporating PCC ash to ensure durability performance, it is desirable to prepare a mix design capable of minimizing the carbonation depth and chloride penetration depth while also maximizing the relative dynamic elastic modulus and weight reducing ratio. The replacement ratio capable of satisfying the above condition was found to be 20% to 40%. However, it was confirmed that the optimal PCC ash replacement ratio able to ensure even the target compressive ratio (fck = 24 MPa) ranges from 20.0% to 38.9%.

3.4. Sustainability Properties Analysis

Figure 14a shows changes in the GWP and ODP according to the replacement ratio of PCC ash. When the replacement ratio increased by 10%, the GWP and ODP were reduced by 17.26 kg CO2 eq/m3 and 3.0 × 10⁻⁶ kg CFC-11 eq/m3, respectively. In the case of the specimen with a replacement ratio of 70%, the GWP and ODP decreased to 31.9% and 87.9%, respectively, compared to the plain specimen. In addition, the compressive strength increased in direct proportion to both the GWP and ODP. The results are shown in Figure 14b.
As shown in Figure 15a, AP and EP showed a decrease of 0.086 kg SO2 eq/m3 and 0.004 kg PO43− eq/m3, respectively, when the replacement ratio increased by 10%. When 70% of the PCC ash was replaced, the AP decreased to 82.0%, and the EP to 87.9%. Both AP and EP were found to have a positive correlation with compressive strength, and the results are shown in Figure 15b.
In addition, changes in the POCP and ADP according to the replacement ratio are shown in Figure 16. When the replacement ratio increased by 10%, the POCP decreased by 0.025 kg C2H4 eq/m3, and ADP decreased by 0.122 kg Sb eq/m3. When 70% of the PCC ash was replaced, the POCP and ADP were reduced to 33.1% and 87.0%, respectively. Meanwhile, both the POCP and ADP tended to increase with increasing compressive strength.
Figure 17 shows changes in Bi and Ci according to the replacement ratio. Bi increased gradually until the replacement ratio increased to 40%, and then rapidly increased in the range of 40% or higher. When the replacement ratio was 70%, it increased by up to 359.3% compared to the plain specimen. On the other hand, Ci showed similar values in the range from 0% to 60%, and then increased by 114.6% when the replacement ratio was 70%. In addition, Bi tended to decrease rapidly until the compressive strength of 25 MPa, and then converge to a similar value, whereas Ci decreased until the compressive strength of 29.6 MPa, showing a similar value, and then slightly increased in the range over 35.1 MPa.
Table 5 shows a comparison of environmental impacts between the materials used in this study. PCC ash was found to have less environmental impact than OPC in environmental impact factors except for ODP. The degree of environmental impact reduction by optimal PCC ash replacement ratio that can ensure durability was analyzed based on the aforementioned content, and the results are summarized in Table 6. This study has proven that the replacement of PCC ash instead of OPC under the same concrete mix proportion conditions is effective at reducing environmental impacts. This leads to the conclusion that replacing OPC with PCC ash, which can ensure compressive strength and durability, will be of great help in mitigating the environmental impacts of large construction projects.

4. Conclusions

This study analyzed the engineering properties and durability of binary blended concrete incorporating high-volume PCC ash and assessed the sustainability. Then, the optimal PCC ash replacement ratio and environmental impacts were derived, and the results are summarized as follows:
(1)
The overall compressive strength decreased as the PCC ash replacement ratio increased in hardened concrete, and the compressive strength at 56 days showed a tendency to decrease rapidly in the range with a replacement ratio of 40% or higher. Therefore, in order to secure the target compressive strength (fck = 24 MPa), which was established in this study at 28 days, the replacement ratio of PCC ash should be maintained at 38.9% or less.
(2)
The durability review results showed that as the replacement ratio of PCC ash increased, the carbonation depth and relative dynamic elastic modulus increased. However, the chloride penetration depth showed a tendency to decrease. Nevertheless, the weight loss ratio was found to be similar. In addition, it was confirmed that the optimal PCC replacement ratio which satisfies four durability parameters and ensures the target compressive strength (fck = 24 MPa) in the case of the mix proportion conditions set in this study ranges from 20.0% to 38.9%.
(3)
The sustainability assessment revealed that as the replacement ratio of PCC ash increased, the GWP and ODP tended to decrease by 17.26 kg CO2 eq/m3 and 3.0 × 10⁻⁶ kg CFC-11 eq/m3, respectively. In addition, the AP and EP decreased by 0.086 kg SO2 eq/m3 and 0.004 kg PO43 eq/m3, respectively. Meanwhile, the POCP showed a decrease of 0.025 kg C2H4 eq/m3, and ADP a decrease 0.122 kg Sb eq/m3, respectively.
(4)
PCC ash was found to have less environmental impact than OPC in terms of GWP, AP, EP, POCP and ADP. This study has proven that the replacement of PCC ash instead of OPC under the same concrete mix proportions is effective at reducing environmental impacts.
(5)
It is expected that the engineering properties and durability analysis data of concrete incorporating PCC ash as well as the sustainability assessment results will help to provide a guide to the optimum mix proportion when high-volume, PCC-based concrete is applied to local construction sites in the future, and may serve as basic data in the development of concrete and binders that can minimize environmental impacts.
(6)
The limitation of this study was that it did not find the cause or reasons why the resistance performance was secured to an equal or higher level when the substitution rate of PCC ash was increased under freezing and thawing in the presence of deicer salts.
(7)
Future studies need to elaborate on the cause of the properties of the relative dynamic elastic modulus and weight reducing ratio. In addition, it is required to examine the change in durability characteristics when temperature changes, seawater immersion conditions, and silica fume are added.

Author Contributions

Conceptualization, J.L. and T.L.; investigation, J.L., T.L., J.J. (Jaewook Jeong) and J.J. (Jaemin Jeong); resources, J.L., T.L., J.J. (Jaewook Jeong) and J.J. (Jaemin Jeong); writing—original-draft, J.L. and T.L.; writing—review and editing, J.J. (Jaewook Jeong) and J.J. (Jaemin Jeong). All authors have read and agreed to the published version of the manuscript.

Funding

This study was supported by the Research Program funded by the SeoulTech (Seoul National University of Science and Technology).

Conflicts of Interest

The authors declare no conflict of interest.

References

  1. Bulatović, V.; Melešev, M.; Radeka, M.; Radonjanin, V.; Luki´c, I. Evaluation of sulfate resistance of concrete with recycled and natural aggregates. Constr. Build. Mater 2017, 152, 614–631. [Google Scholar] [CrossRef]
  2. Flower, D.; Sanjayan, J.; Baweja, D. Environmental impacts of concrete production and construction. In Proceedings of the Concrete Institute of Australia Biennial Conference, Melbourne, Australia, 17–19 October 2005. [Google Scholar]
  3. Wang, L.; Yang, H.Q.; Dong, Y.; Chen, E.; Tang, S.W. Environmental evaluation, hydration, pore structure, volume deformation and abrasion resistance of low heat Portland (LHP) cement-based materials. J. Clean. Prod. 2018, 203, 540–558. [Google Scholar] [CrossRef]
  4. Xu, X.N.; Yang, Y.L.; Xiao, C.; Zhang, X.M. Energy balance and global warming potential of corn straw-based bioethanol in China from a life cycle perspective. Int. J. Green Energy 2018, 15, 296–304. [Google Scholar] [CrossRef]
  5. Pellecchia, M.; Negri, I. Particulate matter collection by honey bees (Apis mellifera, L.) near to a cement factory in Italy. PeerJ 2018, 6, e5322. [Google Scholar] [CrossRef] [PubMed] [Green Version]
  6. Liu, H.; Luo, G.; Wang, L.; Gong, Y. Strength Time–Varying and Freeze–Thaw Durability of Sustainable Pervious Concrete Pavement Material Containing Waste Fly Ash. Sustainability 2019, 11, 176. [Google Scholar] [CrossRef] [Green Version]
  7. Han, S.H.; Kim, J.K.; Park, Y.D. Prediction of compressive strength of fly ash concrete by new apparent activation energy function. Cem. Concr. Res. 2003, 33, 965–971. [Google Scholar] [CrossRef]
  8. Lee, J.; Lee, T. Influences of Chemical Composition and Fineness on the Development of Concrete Strength by Curing Conditions. Materials 2019, 12, 4061. [Google Scholar] [CrossRef] [Green Version]
  9. Wang, C.Y.; Olsson, G.; Liu, Y. Coal-fired power industry water-energy-emission nexus: A multi-objective optimization. J. Clean. Prod. 2018, 203, 367–375. [Google Scholar] [CrossRef]
  10. ASTM. Specification for Coal Fly Ash and Raw or Calcined Natural Pozzolan for Use in Concrete; American Society for Testing Materials: West Conshohocken, PA, USA, 2017. [Google Scholar] [CrossRef]
  11. Anthony, E.J.; Granatstein, D.L. Sulfation phenomena in fluidized bed combustion systems. Prog. Energy Combust. Sci. 2001, 27, 215–236. [Google Scholar] [CrossRef]
  12. Koornneef, J.; Junginger, M.; Faaij, A. Development of fluidized bed combustion—An overview of trends, performance and cost. Prog. Energy Combust. Sci. 2007, 33, 19–55. [Google Scholar] [CrossRef] [Green Version]
  13. Armesto, L.; Merino, J.L. Characterization of some coal combustion solid residues. Fuel 1999, 78, 613–618. [Google Scholar] [CrossRef]
  14. Lin, W.T.; Weng, T.L.; Cheng, A.; Chao, S.J.; Hsu, H.M. Properties of controlled low strength material with circulating fluidized bed combustion ash and recycled aggregates. Materials 2018, 11, 715. [Google Scholar] [CrossRef] [PubMed] [Green Version]
  15. Lee, J.; Kim, G.; Kim, Y.; Mun, K.; Nam, J. Engineering properties and optimal conditions of cementless grouting materials. Materials 2019, 12, 3059. [Google Scholar] [CrossRef] [PubMed] [Green Version]
  16. Lee, J.; Lee, T. Effects of high CaO fly ash and sulfate activator as a finer binder for cementless grouting material. Materials 2019, 12, 3664. [Google Scholar] [CrossRef] [PubMed] [Green Version]
  17. Van Nguyen, C.; Lambert, P.; Hung Tran, Q. Effect of Vietnamese fly ash on selected physical properties, durability and probability of corrosion of steel in concrete. Materials 2019, 12, 593. [Google Scholar] [CrossRef] [PubMed] [Green Version]
  18. Malhotra, V.M.; Zhang, M.H.; Read, P.H.; Ryell, J. Long-term mechanical properties and durability characteristics of high-strength/high-performance concrete incorporating supplementary cementing materials under outdoor exposure conditions. ACI Mater. J. 2000, 97, 518–525. [Google Scholar] [CrossRef]
  19. Barbhuiya, S.; Kumala, D. Behaviour of a sustainable concrete in acidic environment. Sustainability 2017, 9, 1556. [Google Scholar] [CrossRef] [Green Version]
  20. Kurda, R.; Silvestre, J.D.; Brito, J. Life cycle assessment of concrete made with high volume of recycled concrete aggregates and fly ash. Resour. Conserv. Recyc. 2018, 139, 407–417. [Google Scholar] [CrossRef]
  21. Zhu, Y.; Zhang, Z.C.; Yang, Y.G.; Yao, Y. Measurement and correlation of ductility and compressive strength for engineered cementitious composites (ECC) produced by binary and ternary systems of binder materials: Fly ash, slag, silica fume and cement. Constr. Build. Mater. 2014, 68, 192–198. [Google Scholar] [CrossRef]
  22. Ma, H.X.; Yu, H.F.; Li, C.; Tan, Y.S.; Cao, W.T.; Da, B. Freeze–thaw damage to high–performance concrete with synthetic fibre and fly ash due to ethylene glycol deicer. Constr. Build. Mater. 2018, 187, 197–204. [Google Scholar] [CrossRef]
  23. Mohammed, B.S.; Adamu, M.; Liew, M.S. Evaluating the effect of crumb rubber and nano silica on the properties of high volume fly ash roller compacted concrete pavement using non-destructive techniques. Case Stud. Constr. Mater. 2018, 8, 380–391. [Google Scholar] [CrossRef]
  24. Kumar, B.; Sinha, S.; Chakravarty, H. Study of Effect of Nano-Silica on Strength and Durability Characteristics of High Volume Fly Ash Concrete for Pavement Construction. Civil Eng. J. 2019, 5, 1341–1352. [Google Scholar] [CrossRef]
  25. Adamu, M.; Mohammed, B.S.; Shafiq, N. Nano silica modified roller compacted rubbercrete–An overview. In Engineering Challenges for Sustainable Future. ROUTLEDGE Assoc. GSE Res. 2016, 483, 483–487. [Google Scholar] [CrossRef]
  26. Chu, T.X.H.; Zheng, J.; Chen, D.; Nguyen, T.T.H.; Elbashiry, E.; Tang, V.T. Utilization of Industrial Waste in Cement in a Marine Environment with a Tropical Climate. J. Mar. Sci. Eng. 2019, 7, 245. [Google Scholar] [CrossRef] [Green Version]
  27. Naibaho, A. The effectiveness of fly ash as a substitute of cement for marine concrete. Civil Eng. J. 2018, 4, 702. [Google Scholar] [CrossRef] [Green Version]
  28. Thomas, M.D.A. Optimizing the Use of Fly Ash in Concrete; Portland Cement Association: Skokie, IL, USA, 2007; Volume 5420. [Google Scholar]
  29. Korean Standards Association. Portland Cement. KS L 5201; Korean Standards Association: Seoul, Korean, 2006. [Google Scholar]
  30. Korean Standard Association. Fly Ash. KS L 5405; Korean Standard Association: Seoul, Korean, 2016. [Google Scholar]
  31. ASTM. Standard test methods for fineness of hydraulic cement by air-permeability apparatus. In Annu. Book ASTM; ASTM International: West Conshohocken, PA, USA, 2007. [Google Scholar] [CrossRef]
  32. ASTM. Standard guide for examination of hardened concrete using scanning electron microscopy. Concr. Aggregat 2010, 4, 2. [Google Scholar] [CrossRef]
  33. ASTM. Standard Test Methods for Chemical Analysis of Hydraulic Cement. Am. Soc. Test. Mater. 2018. [Google Scholar] [CrossRef]
  34. ASTM. Standard Test Method for Sieve Analysis of Fine and Coarse Aggregates. Am. Soc. Test. Mater. 2019. [Google Scholar] [CrossRef]
  35. ASTM. Standard Test Method for Air Content of Freshly Mixed Concrete by the Pressure Method. Am. Soc. Test. Mater. 2017. [Google Scholar] [CrossRef]
  36. ASTM. Standard Test Method for Compressive Strength of Concrete Cylinders Cast in Place in Cylindrical Molds. Am. Soc. Test. Mater. 2015. [Google Scholar] [CrossRef]
  37. ASTM. Standard Test Method for Compressive Strength of Cylindrical Concrete Specimens. Am. Soc. Test. Mater. 2018. [Google Scholar] [CrossRef]
  38. Korean Standards Association. Standard Test Method for Accelerated Carbonation of Concrete [KS F 2584]; Korean Standards Association: Seoul, Korea, 2015. [Google Scholar]
  39. NT BUILD 492, ‘Concrete, mortar and cement-based repair materials: Chloride migration coefficient from non-steady-state migration experiments’. Nord. Method 1999, 1–8.
  40. ASTM. Standard Test Method for Resistance of Concrete to Rapid Freezing and Thawing. Am. Soc. Test. Mater. 2015. [Google Scholar] [CrossRef]
  41. ISO. Environmental Management: Life Cycle Assessment; Requirements and Guidelines; International Organization for Standardization: Geneva, Switzerland, 2006. [Google Scholar] [CrossRef]
  42. Jeong, J.; Hong, T.; Kim, J.; Chae, M.; Ji, C. Multi-criteria analysis of a self-consumption strategy for building sectors focused on ground source heat pump systems. J. Clean. Prod. 2018, 186, 68–80. [Google Scholar] [CrossRef]
  43. Kim, J.; Hong, T.; Jeong, J.; Koo, C.; Jeong, K. An optimization model for selecting the optimal green systems by considering the thermal comfort and energy consumption. Appl. Energy 2016, 169, 682–695. [Google Scholar] [CrossRef]
  44. Rahla, K.M.; Mateus, R.; Bragança, L. Comparative sustainability assessment of binary blended concretes using Supplementary Cementitious Materials (SCMs) and Ordinary Portland Cement (OPC). J. Clean. Prod. 2019, 220, 445–459. [Google Scholar] [CrossRef]
  45. Korea Environmental Industry and Technology Institute (KEITI). LCI DB. Available online: http://www.epd.or.kr/ (accessed on 21 November 2019).
  46. Fan, C.; Miller, S.A. Reducing greenhouse gas emissions for prescribed concrete compressive strength. Constr. Build. Mater. 2018, 167, 918–928. [Google Scholar] [CrossRef]
  47. Kim, T.; Tae, S.; Chae, C. Analysis of environmental impact for concrete using LCA by varying the recycling components, the compressive strength, and the admixture material mixing. Sustainability 2016, 8, 389. [Google Scholar] [CrossRef] [Green Version]
  48. Damineli, B.L.; Kemeid, F.M.; Aguiar, P.S.; John, V.M. Measuring the eco-efficiency of cement use. Cem. Concr. Compos. 2010, 32, 555–562. [Google Scholar] [CrossRef]
  49. Yang, K.H.; Jung, Y.B.; Cho, M.S.; Tae, S.H. Effect of supplementary cementitious materials on the reduction of CO2 emissions from concrete. J. Clean. Prod. 2015, 103, 774–783. [Google Scholar] [CrossRef]
  50. Yang, K.H.; Song, J.K.; Song, K.I. Assessment of CO2 reduction of alkali-activated concrete. J. Clean. Prod. 2013, 39, 265–272. [Google Scholar] [CrossRef]
  51. Thomas, M.D.A.; Matthews, J.D. Carbonation of fly ash concrete. Mag. Concr. Res. 1992, 44, 217–228. [Google Scholar] [CrossRef]
  52. Thomas, M.D.A.; Wilson, M.L. Supplementary Cementing Materials for Use in Concrete; PCA: Skokie, IL, USA, 2002. [Google Scholar]
  53. Thomas, M.D.A. The Effect of Curing on the Hydration and Pore Structure of Hardened Cement Paste Containing Pulverized-Fuel Ash. Adv. Cem. Res. 1989, 2, 181–188. [Google Scholar] [CrossRef]
  54. Bilodeau, A.; Carette, G.G.; Malhotra, V.M. Influence of curing and drying on salt scaling resistance of fly ash concrete. Spec. Publ. 1991, 126, 201–228. [Google Scholar]
  55. Naik, T.R.; Ramme, B.W.; Tews, J.H. Pavement Construction with High-Volume Class C and Class F Fly Ash Concrete. ACI Mater. J. 1995, 92, 200–210. [Google Scholar] [CrossRef]
  56. Yerramala, A.; Ganesh Babu, K. Transport properties of high volume fly ash roller compacted concrete. Cem. Concr. Compos. 2011, 33, 1057–1062. [Google Scholar] [CrossRef]
  57. Thomas, M.D.A. Laboratory and Field Studies of Salt Scaling in Fly Ash Concrete; Setzer, M.J., Auberg, R., Eds.; Frost Resistance of Concrete: Essen, Germany, 1997. [Google Scholar]
  58. Lankard, D.R. Slurry infiltrated fiber concrete (SIFCON): Properties and applications. MRS Online Proc. Libr. Arch. 1984, 42. [Google Scholar] [CrossRef]
  59. Hashim, A.M.; Kadhum, M.M. Compressive Strength and Elastic Modulus of Slurry Infiltrated Fiber Concrete (SIFCON) at High Temperature. Civil Eng. J. 2020, 6, 265–275. [Google Scholar] [CrossRef] [Green Version]
  60. Farnam, Y.; Moosavi, M.; Shekarchi, M.; Babanajad, S.K.; Bagherzadeh, A. Behaviour of slurry infiltrated fibre concrete (SIFCON) under triaxial compression. Cem. Concr. Res. 2010, 40, 1571–1581. [Google Scholar] [CrossRef]
  61. Harbi, N.A.; Izzet, A.F. Performance of Post-Fire Composite Prestressed Concrete Beam Topped with Reinforced Concrete Flange. Civil Eng. J. 2018, 4, 1595–1609. [Google Scholar] [CrossRef] [Green Version]
Figure 1. Research process.
Sustainability 12 03520 g001
Figure 2. The pictures of (a) specimen production and (b) standard water curing.
Sustainability 12 03520 g002
Figure 3. The particle size distribution of OPC (ordinary Portland cement) and PCC (pulverized coal combustion) ash.
Sustainability 12 03520 g003
Figure 4. Scanning electron microscope of binder types used: (a) OPC; (b) PCC ash.
Sustainability 12 03520 g004
Figure 5. Gradation sieve analysis curves of aggregates used: (a) Coarse aggregates; (b) Fine aggregates.
Sustainability 12 03520 g005
Figure 6. Result of slump and air content by replacement ratio.
Sustainability 12 03520 g006
Figure 7. Result of compressive strength by replacement ratio according to curing age.
Sustainability 12 03520 g007
Figure 8. Result of compressive C.S. (56 days)/C.S. (28 days) by replacement ratio.
Sustainability 12 03520 g008
Figure 9. Results of compressive strength by replacement ratio.
Sustainability 12 03520 g009
Figure 10. Result of carbonation depth ratio by replacement ratio.
Sustainability 12 03520 g010
Figure 11. Results of chloride penetration depth by replacement ratio.
Sustainability 12 03520 g011
Figure 12. Result of (a) relative dynamic elastic modulus and (b) weight loss ratio by replacement ratio.
Sustainability 12 03520 g012
Figure 13. Optimal replacement ratio range for enduring durability performance.
Sustainability 12 03520 g013
Figure 14. Assessment results of GWP and ODP (a) by replacement ratio and (b) by compressive strength.
Sustainability 12 03520 g014
Figure 15. Assessment results of AP and EP (a) By replacement ratio and (b) By compressive strength.
Sustainability 12 03520 g015
Figure 16. Assessment results of POCP and ADP (a) by replacement ratio and (b) by compressive strength.
Sustainability 12 03520 g016
Figure 17. Assessment results of Ci and Bi (a) by replacement ratio and (b) by compressive strength.
Sustainability 12 03520 g017
Table 1. Chemical compositions of the used binders.
MaterialChemical Composition (%)
CaOSiO2Al2O3Fe2O3MgOK2ONa2OSO3Other
OPC 160.2021.605.153.302.300.990.531.504.43
PCC ash 24.0057.9020.506.801.381.180.89-7.35
1 OPC: Ordinary Portland cement; 2 PCC ash: Pulverized coal combustion ash.
Table 2. Physical properties of the materials.
MaterialProperty
OPCType 1 ordinary Portland cement (KS L 5201)
Density: 3.15 g/cm3, specific surface area: 3322 cm2/g
PCC ashType 2 pulverized coal combustion ash (KS L 5405)
Density: 2.14 g/cm3, specific surface area: 3964 cm2/g
Fine aggregateS1Washed sea sand
Fineness modulus: 2.01, density: 2.60 g/cm3, absorption: 0.79%
S1Crushed sand
Fineness modulus: 3.29, density: 2.57 g/cm3, absorption: 0.87%
Coarse aggregateCrushed granitic aggregate
Size: 25 mm, density: 2.60 g/cm3, absorption: 0.76%
Chemical admixturePolycarboxylic acid group, density: 1.05 g/cm3
Table 3. Mixing proportions of the concrete.
Mix No.Unit Weight (kg/m3)
W/BWaterBinderOPCPCC Ash
Plain0.531753303300
P129733
P226466
P323199
P4198132
P5165165
P6132198
P799231
Remarks: - Curing temperature: 20 °C; - Chemical admixture content: various to secure target slump.
Table 4. Test methods by evaluation items.
SeriesEvaluation ItemTest Method
I. Raw material analysisParticle size distribution (%)ASTM C204
Scanning electron microscopeASTM C1723
X-ray fluorescenceASTM C114
Grading distribution (%)ASTM C136
II. Engineering properties analysisSlump (mm)ASTM C143
Air content (%)ASTM C231
Compressive strength (MPa)ASTM C873
ASTM C39
III. Durability properties analysisCarbonation depth (mm)KS F 2584
Chloride penetration depth (mm)NT Build 492
Relative dynamic elastic modulus (%)ASTM C666
Weight loss ratio (%)
IV. Sustainability properties analysisGlobal warming potential (kg CO2 eq/m3)ISO 14040
Ozone layer depletion potential (CFC-11 eq/m3)
Acidification potential (kg SO2 eq/m3)
Eutrophication potential (kg PO43− eq/m3)
Photochemical ozone creation potential (kg C2H4 eq/m3)
Abiotic depletion potential (kg Sb eq/m3)
Table 5. Environmental impact from concrete materials.
MaterialsEnvironmental Impacts
GWP
(kg CO2 eq.)
ODP
(kg CFC-11 eq.)
AP
(kg SO2 eq.)
EP
(kg PO43-eq.)
POCP
(kg C2H4 eq.)
ADP
(kg Sb eq.)
OPC5.32 × 10−11.27 × 10−93.68 × 10−46.60 × 10−51.15 × 10−43.76 × 10⁻³
PCC ash1.01 × 10−22.99 × 10−94.97 × 10−57.28 × 10−61.91 × 10−56.82 × 10⁻⁵
Water8.88 × 10−39.32 × 10−72.53 × 10−27.06 × 10−47.39 × 10−32.07 × 10⁻⁴
Table 6. Degree of environmental impact reduction by optimal replacement ratio.
Environmental Impact FactorDegree of Environmental Impact Reduction
20.0%38.9%
GWP34.52 kg CO2 eq/m367.15 kg CO2 eq/m3
ODP6.0 × 10−6 kg CFC-11 eq/m311.7 × 10−6 kg CFC-11 eq/m3
AP0.17 kg SO2 eq/m30.33 kg SO2 eq/m3
EP0.01 kg PO43 eq/m30.02 kg PO43− eq/m3
POCP0.05 kg C2H4 eq/m30.10 kg C2H4 eq/m3
ADP0.24 kg Sb eq/m30.47 kg Sb eq/m3

