Social Networks Use Patterns among University Youth: The Validity and Reliability of an Updated Measurement Instrument


Abstract
1. Introduction
1.1. Social Networks in The University
1.2. Objective
2. Material and Methods
2.1. Participants
2.2. Design of the First Version of the Questionnaire
2.3. Fieldwork and Analysis Procedure
3. Results
3.1. Content Validity Analysis
3.2. Comprehension Validity Analysis
3.3. Construct Validity Analysis
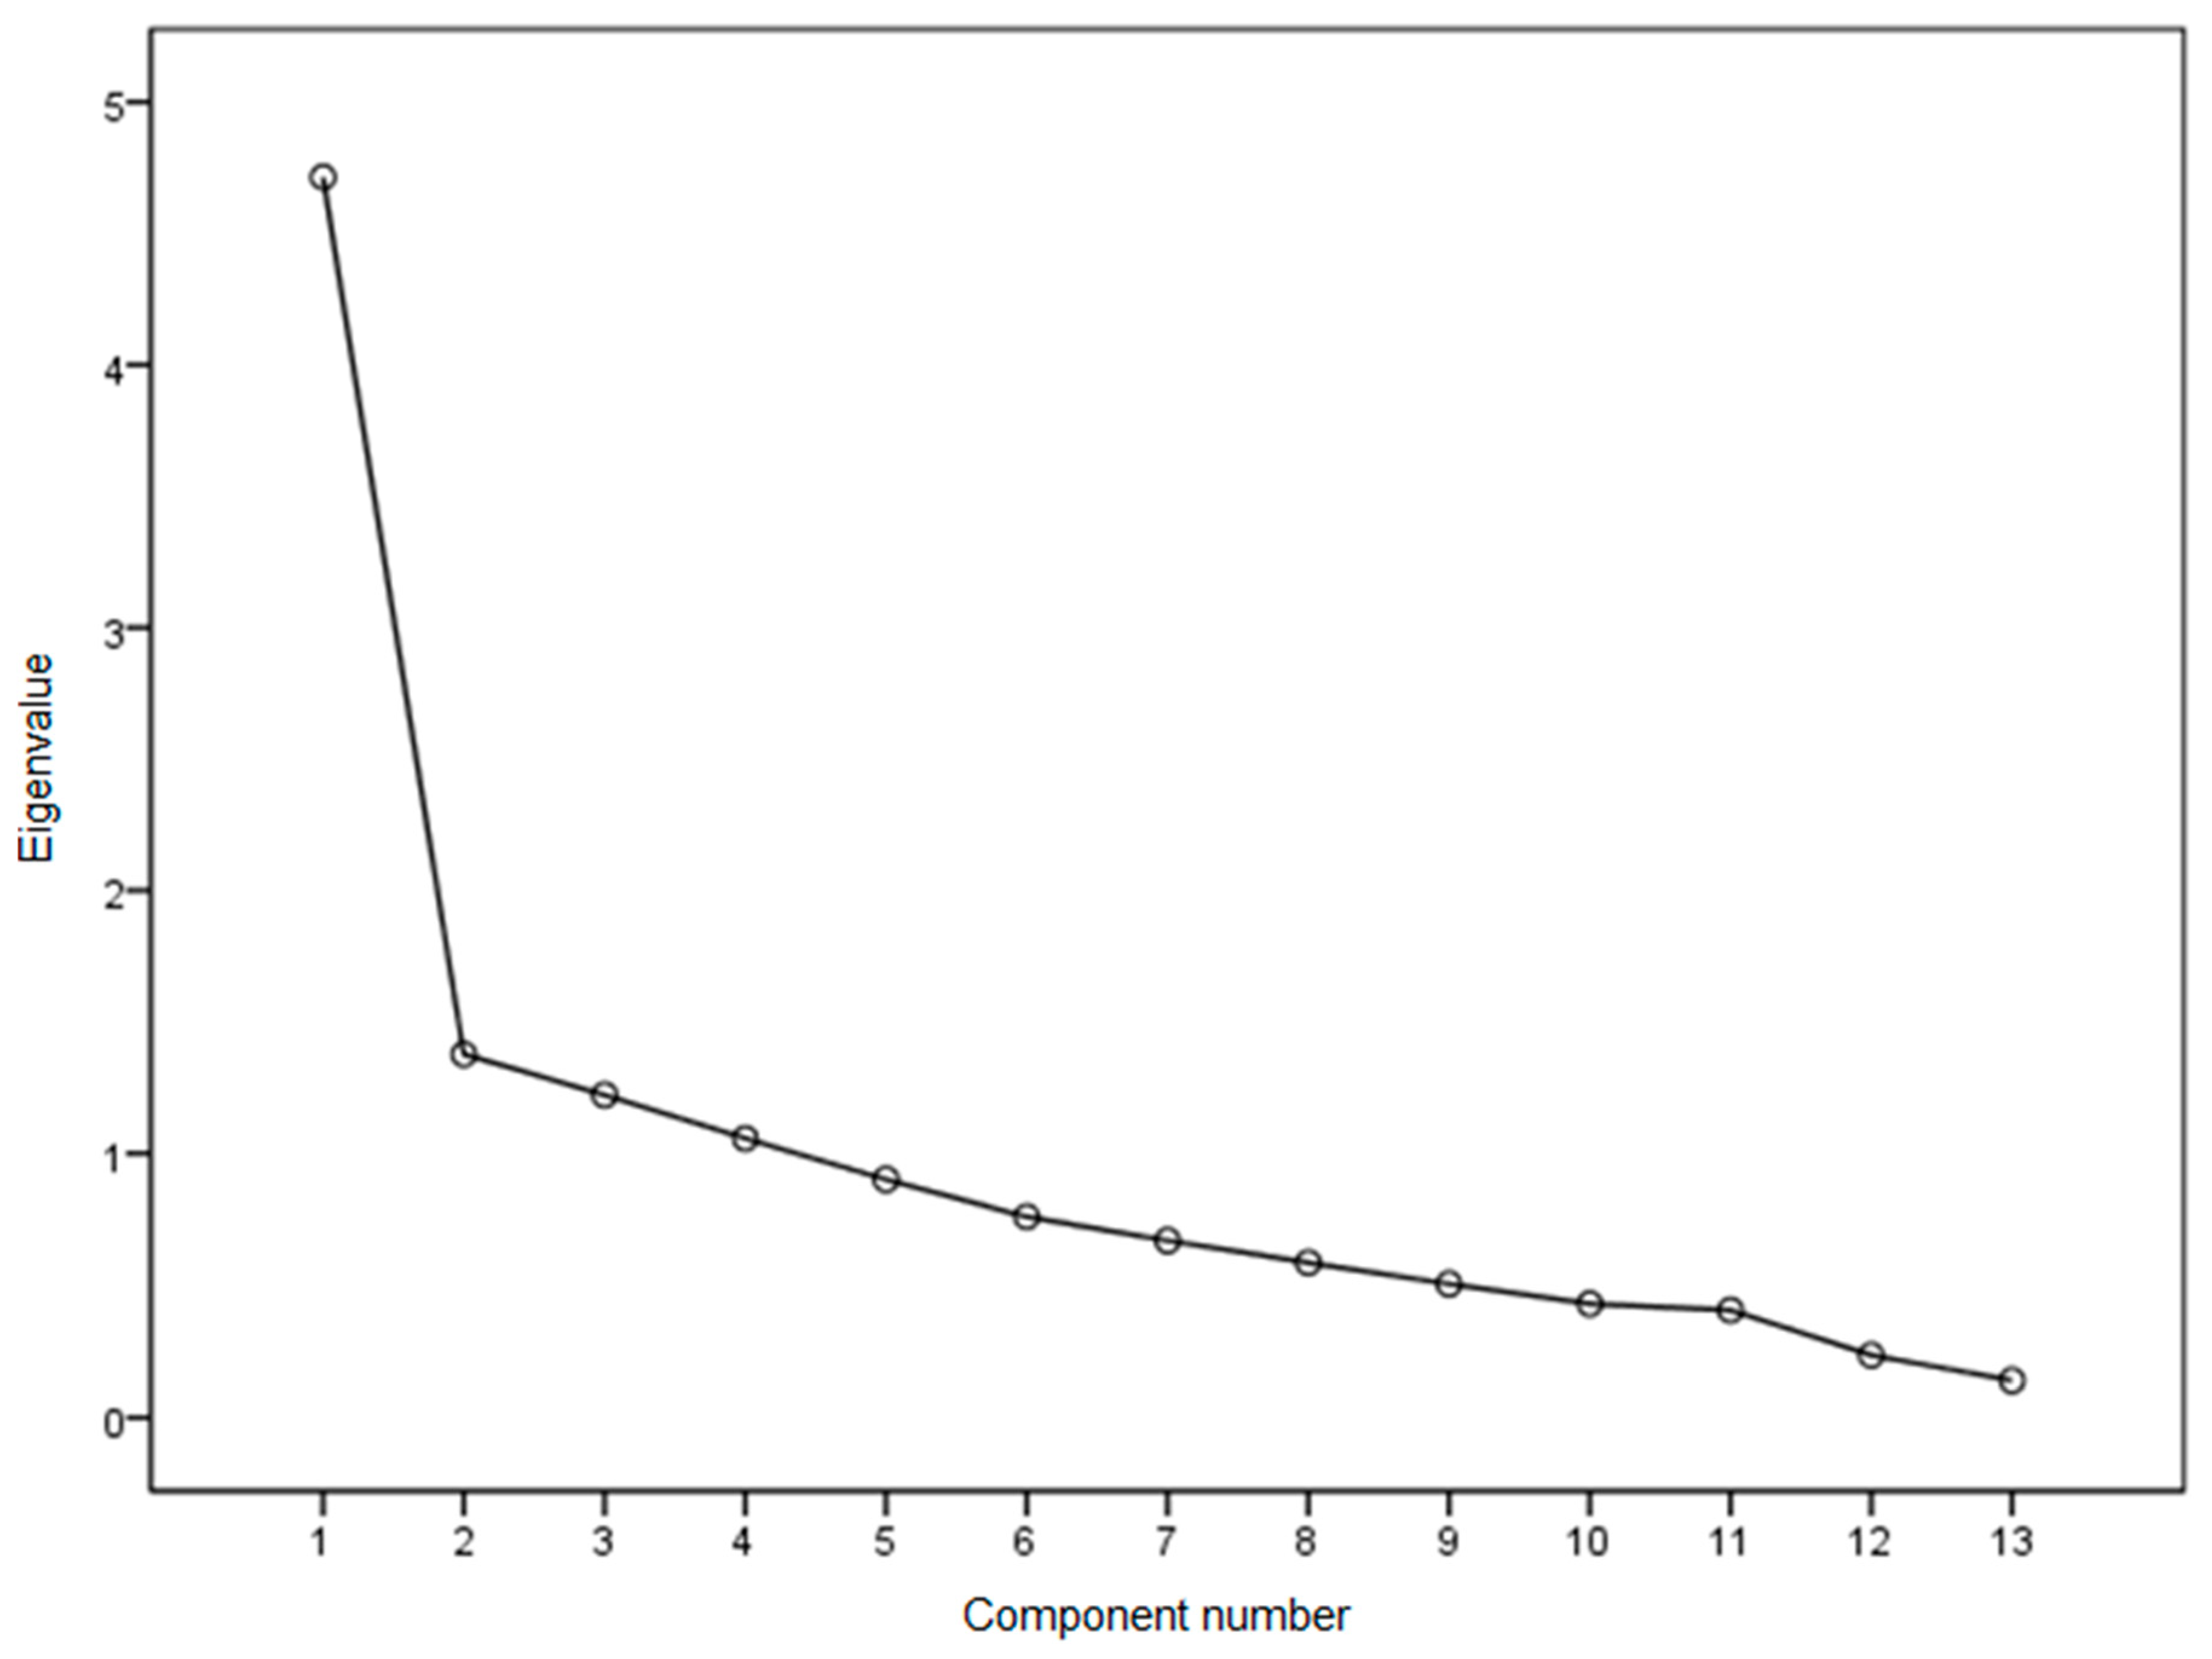
3.3.1. EFA
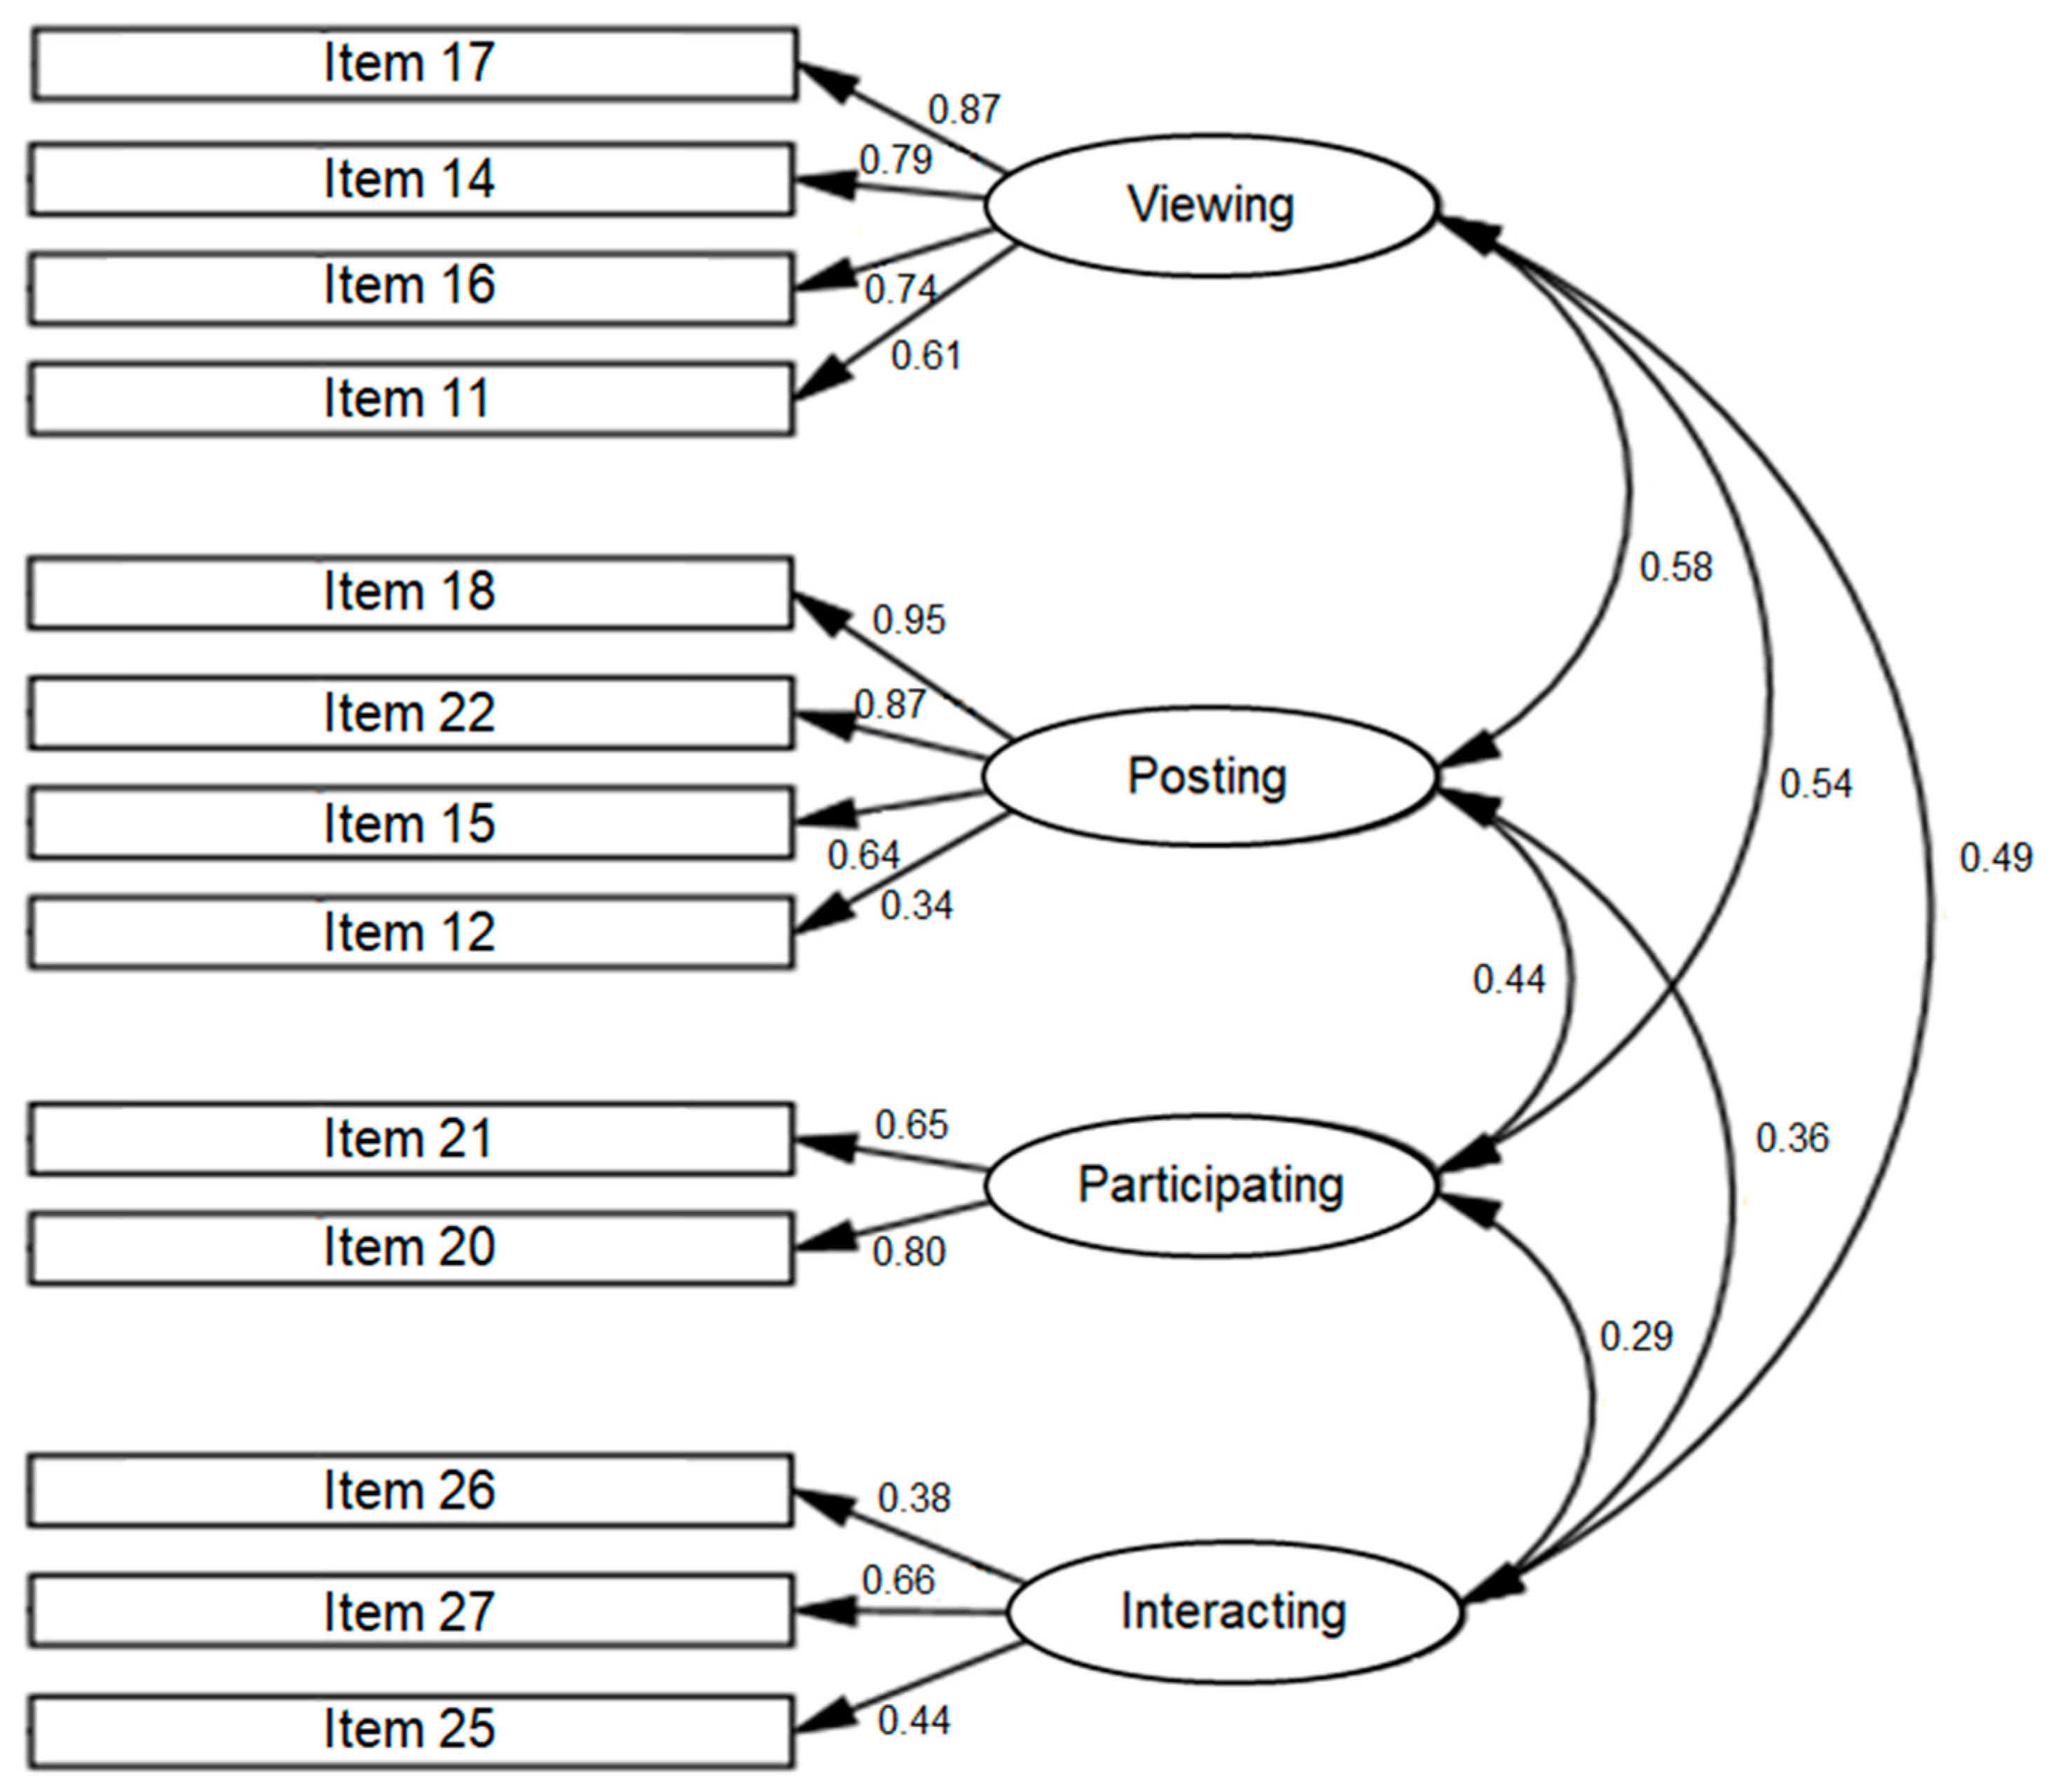
3.3.2. CFA
3.4. Reliability Analysis of The Final Instrument
3.5. Descriptive Results Obtained with the Validated Questionnaire
4. Discussion and Conclusions
Author Contributions
Funding
Conflicts of Interest
References
- INE. Encuesta Sobre Equipamiento y Uso de Tecnologías de Información y Comunicación en Los Hogares. TICH 2019; INE: Madrid, Spain, 2019. [Google Scholar]
- Gómez-Aguilar, M.; Roses-Campos, S.; Farias-Batlle, P. El uso académico de las redes sociales en universitarios. Comunicar 2012, 19, 131–138. [Google Scholar] [CrossRef]
- Bernal, C.; Angulo, F. Interacciones de los jóvenes andaluces en las redes sociales. Comunicar 2013, 20, 25–30. [Google Scholar]
- Castaño, C.; Maiz, I.; Palacio, G.; Villarroel, J.D. Prácticas educativas en entornos Web 2.0; Cabero, J., Ed.; Editorial Síntesis: Madrid, Spain, 2008; ISBN 9788497565714. [Google Scholar]
- Castañeda Quintero, L. Aprendizaje Con Redes Sociales: Tejidos Educativos Para Los Nuevos Entornos; Cabero-Almenara, J., Ed.; Editorial MAD: Sevilla, Spain, 2010; ISBN 978-84-676-3619-2. [Google Scholar]
- Prendes Espinosa, P.; Gutiérrez Porlán, I.; Castañeda Quintero, L. Perfiles de uso de redes sociales: Estudio descriptivo con alumnado de la Universidad de Murcia. Rev. Complut. Educ. 2015, 26, 175–195. [Google Scholar] [CrossRef]
- Prendes Espinosa, M.P. Nuevas Tecnologías y Educación; Pearson Educación: Madrid, Spain, 2004; ISBN 8420541621. [Google Scholar]
- Lévy, P. Inteligencia Colectiva Por Una Antropología Del Ciberespacio; Organización Panamericana de la Salud: Washington, DC, UA, 2004; ISBN 2707126934. [Google Scholar]
- Siemens, G. Connectivism: A Learning Theory for the Digital Age. Int. J. Instr. Technol. Distance Learn. 2014, 2, 1–9. [Google Scholar]
- Almansa, A.; Fonseca, O.; Castillo, A. Redes sociales y jóvenes. Uso de Facebook en la juventud colombiana y española. Comunicar 2013, 20, 127–135. [Google Scholar]
- Junco, R. The relationship between frequency of Facebook use, participation in Facebook activities, and student engagement. Comput. Educ. 2012, 58, 162–171. [Google Scholar] [CrossRef]
- McAndrew, F.T.; Jeong, H.S. Who does what on Facebook? Age, sex, and relationship status as predictors of Facebook use. Comput. Hum. Behav. 2012, 28, 2359–2365. [Google Scholar] [CrossRef]
- Backstrom, L.; Huttenlocher, D.; Kleinberg, J.; Lan, X. Group formation in large social networks: Membership, growth, and evolution. In Proceedings of 12th International Conference on Knowledge Discovery in Data Mining; ACM Press: New York, NY, USA, 2006; pp. 44–54. [Google Scholar]
- Liu, H.; Maes, P.; Davenport, G. Unraveling the Taste Fabric of Social Networks. Int. J. Semant. Web Inf. Syst. 2006, 2, 42–71. [Google Scholar] [CrossRef]
- Calvete, E.; Orue, I.; Estévez, A.; Villardón, L.; Padilla, P. Cyberbullying in adolescents: Modalities and aggressors’ profile. Comput. Hum. Behav. 2010, 26, 1128–1135. [Google Scholar] [CrossRef]
- McBride, D.L. Risks and benefits of social media for children and adolescents. J. Pediatr. Nurs. Nurs. Care Child. Fam. 2011, 26, 498–499. [Google Scholar] [CrossRef]
- García-Ruiz, R.; Tirado, R.; Hernando, Á. Redes sociales y estudiantes: motivos de uso y gratificaciones. Evidencias para el aprendizaje. Aula Abierta 2018, 47, 291–298. [Google Scholar] [CrossRef]
- Sánchez-Rodríguez, J.; Ruiz-Palmero, J.; Sánchez-Rivas, E. Uso problemático de las redes sociales en estudiantes universitarios. Rev. Complut. Educ. 2015, 159, 1130–2496. [Google Scholar] [CrossRef]
- Espuny Vidal, C.; González Martínez, J.; Lleixà Fortuño, M.; Gisbert Cervera, M. Actitudes y expectativas del uso educativo de las redes sociales en los alumnos universitarios. RUSC. Univ. Knowl. Soc. J. 2011, 8, 171–185. [Google Scholar]
- Gutiérrez Porlan, I.; Soto Pérez, F.J. Conectados: Una experiencia de uso de Facebook con estudiantes de Pedagogía. In Proceedings of the IV Jornadas Nacionales TIC y Educación y Y III Jornadas EXPERTIC. Los Retos De La Competencia Digital: El Cambio Metodológico; de Murcia, R., Consejería de Educación, F.E., Estadística, S.G.S., Eds.: Lorca, Spain, 2012. [Google Scholar]
- Santillán García, A.; Cornejo Marroquín, C.; Ausín Lomas, S. Las fan page de Facebook como medio de difusión de la enfermería basada en la evidencia. Enfermería Glob. 2012, 11. [Google Scholar] [CrossRef]
- Tuñez López, M.; Sixto García, J. Las redes sociales como entorno docente: Análisis del uso de Facebook en la docencia universitaria. Pixel-Bit. Rev. Medios Educ. 2012, 41, 77–92. [Google Scholar]
- Marín, V.I.; Tur, G. Student Teachers’ Attitude towards Twitter for Educational Aims. Open Prax. 2014, 6, 275–285. [Google Scholar] [CrossRef][Green Version]
- Cabero, J.; Marín, V. Posibilidades educativas de las redes sociales y el trabajo en grupo. Percepciones de los alumnos universitarios. Comunicar 2014, 21, 165–172. [Google Scholar]
- Serrat Antoli, N. Metodologías participativas y Facebook en el ámbito universitario. Innoeduca. Int. J. Technol. Educ. Innov. 2015, 1, 25. [Google Scholar] [CrossRef]
- Matosas-López, L.; Romero-Luis, J. Correlaciones entre redes sociales y recursos educativos digitales en estudiantes universitarios de Marketing en el EEES. In Contenidos audiovisuales, narrativas y alfabetización mediática; Sierra Sánchez, J., Ed.; McGraw Hill: Madrid, Spain, 2019; pp. 393–402. ISBN 978-84-486-1816-2. [Google Scholar]
- Santoveña-Casal, S.; Bernal-Bravo, C. Explorando la influencia del docente: Participación social en Twitter y percepción académica. Comunicar 2019, 27, 75–84. [Google Scholar] [CrossRef]
- Durán, M.; Guerra, J.M. Usos y tendencias adictivas de una muestra de estudiantes universitarios españoles a la red social Tuenti. An. Psicol. 2015, 31, 260–267. [Google Scholar]
- Matosas-López, L.; Romero-Ania, A. Preferencias de uso de redes sociales entre los estudiantes universitarios de ciencias sociales. In Proceedings of the XIX Congreso Internacional de Investigación Educativa: Investigación Comprometida para la Transformación Social; AIDIPE: Madrid, Spain, 2019; pp. 164–170. [Google Scholar]
- Folch, C.S.; Castellano, C.M. Los medios sociales como herramientas de acceso a la información en la enseñanza universitaria. Digit. Educ. Rev. 2017, 118–129. [Google Scholar]
- Matosas-López, L.; Bernal-Bravo, C.; Romero-Ania, A.; Palomero-Ilardia, I. Quality Control Systems in Higher Education Supported by the Use of Mobile Messaging Services. Sustainability 2019, 11, 6063. [Google Scholar] [CrossRef]
- Hsieh, M.Y. The Most Sustainable Niche Principles of Social Media Education in A Higher Education Contracting Era. Sustainability 2020, 12, 399. [Google Scholar] [CrossRef]
- Ruiz-Palmero, J.; Sánchez-Rivas, E.; Gómez-García, M.; Sánchez Vega, E. Future Teachers’ Smartphone Uses and Dependence. Educ. Sci. 2019, 9, 194. [Google Scholar] [CrossRef]
- García-Vera, V.; Roig-Vila, R.; García, P. Construcción de un instrumento para medir la utilidad percibida de las TIC usadas en la docencia por estudiantes de arquitectura técnica. Pixel-Bit. Rev. Medios Educ. 2016, 49, 121–135. [Google Scholar] [CrossRef]
- Sabariego Puig, M. El proceso de investigación. In Metodología De La Investigación Educativa; Alzina, R.B., Ed.; La Muralla: Madrid, Spain, 2004; pp. 128–163. ISBN 84-7133-748-7. [Google Scholar]
- Gargallo López, B.; Suárez Rodríguez, J.; Garfella Esteban, P.; Fernández March, A. El cuestionario CEMEDEPU. Un instrumento para la evaluación de la metodología docente y evaluativa de los profesores universitarios. Estud. Sobre Educ. 2011, 21, 9–40. [Google Scholar]
- Rivas-Rebaque, B.; Gértrudix-Barrio, F.; Britto, J.C.D.C. De La percepción del docente universitario ante el uso y valor de los datos abiertos. Educ. XX1 2019, 22, 141–163. [Google Scholar] [CrossRef]
- García-Jiménez, A.; López-de-Ayala, M.C.; Catalina-García, B. Hábitos de uso en Internet y en las redes sociales de los adolescentes españoles. Comunicar 2013, XXI, 1–9. [Google Scholar]
- Carretero-Dios, H.; Pérez, C. Normas para el desarrollo y revisión de estudios instrumentales. Int. J. Clin. Heal. Psychol. 2005, 5, 521–551. [Google Scholar]
- Reche Urbano, E.; Quintero Ordoñez, B.; Vilches Vilela, M.J. Influencia mediática en la vida de los menores. Proceso de construcción y validación de un instrumento. EDMETIC 2017, 6, 359–381. [Google Scholar] [CrossRef]
- Escobar-Pérez, J.; Cuervo-Martínez, Á. Validez de contenido y juicio de expertos: Una aproximación a su utilización. Av. Med. 2008, 6, 27–36. [Google Scholar]
- Santos Rego, M.A.; Sotelino Losada, A.; Jover Olmeda, G.; Naval, C.; Alvarez Castillo, J.L.; Vazquez Verdera, V. Diseño y validación de un cuestionario sobre práctica docente y actitud del profesorado universitario hacia la innovación. Educ. XX1 2017, 20, 39–71. [Google Scholar] [CrossRef]
- Lacave Rodero, C.; Molina Díaz, A.I.; Fernández Guerrero, M.M.; Redondo Duque, M.A. Análisis de la fiabilidad y validez de un cuestionario docente. Rev. Investig. Docencia Univ. Inf. 2016, 9, 2. [Google Scholar]
- Luna Serrano, E. Validación de constructo de un cuestionario de evaluación de la competencia docente. Rev. Electron. Investig. Educ. 2015, 17, 13–27. [Google Scholar]
- Martínez Clares, P.; Pérez Cusó, F.J.; González Morga, N. ¿Qué necesita el alumnado de la tutoría universitaria? Validación de un instrumento de medida a través de un análisis multivariante. Educ. XX1 2019, 22, 189–213. [Google Scholar] [CrossRef]
- Bentler, P.M. EQS, Structural Equations Program Manual; Multivariate Statistical Software: CA, USA, 2006. [Google Scholar]
- Timmerman, M.E.; Lorenzo-Seva, U. Dimensionality assessment of ordered polytomous items with parallel analysis. Psychol. Methods 2011, 16, 209–220. [Google Scholar] [CrossRef]
- Calderón, A.; Arias-Estero, J.L.; Meroño, L.; Méndez-Giménez, A. Diseño y Validación del Cuestionario de Percepción del Profesorado de Educación Primaria sobre la Inclusión de las Competencias Básicas (#ICOMpri3). Estud. Sobre Educ. 2018, 34, 67–97. [Google Scholar]
- Bulger, S.M.; Housner, L.D. Modified Delphi Investigation of Exercise Science in Physical Education Teacher Education. J. Teach. Phys. Educ. 2007, 26, 57–80. [Google Scholar] [CrossRef]
- Lloret-Segura, S.; Ferreres-Traver, A.; Hernández-Baeza, I.; Tomás-Marco, A. El análisis factorial exploratorio de los ítems: una guía práctica, revisada y actualizada. An. Psicol. 2014, 30, 1151–1169. [Google Scholar] [CrossRef]
- Kaiser, H.F. An index of factorial simplicity. Psychometrika 1974, 39, 31–36. [Google Scholar] [CrossRef]
- Sharon, A.T.; Bartlett, C.J. Effect of instructional conditions in producing leniency on two types of rating scales. Pers. Psychol. 1969, 22, 251–263. [Google Scholar] [CrossRef]
- Tanaka, J.S.; Huba, G.J. A fit index for covariance structure models under arbitrary GLS estimation. Br. J. Math. Stat. Psychol. 1985, 38, 197–201. [Google Scholar] [CrossRef]
- Bentler, P.M. Comparative fit indexes in structural models. Psychol. Bull. 1990, 107, 238–246. [Google Scholar] [CrossRef] [PubMed]
- Steiger, J.H. Structural Model Evaluation and Modification: An Interval Estimation Approach. Multivar. Behav. Res. 1990, 25, 173–180. [Google Scholar] [CrossRef] [PubMed]
- Hu, L.; Bentler, P.M. Cutoff criteria for fit indexes in covariance structure analysis: Conventional criteria versus new alternatives. Struct. Equ. Model. A Multidiscip. J. 1999, 6, 1–55. [Google Scholar] [CrossRef]
- Cea D’Ancona, M.A. Métodos De Encuesta: Teoría Y Práctica, Errores Y Mejora; Síntesis: Madrid, Spain, 2004; ISBN 9788497562508. [Google Scholar]
- Kerlinger, F.N.; Lee, H.B. Investigación Del Comportamiento. Métodos De Investigación En Ciencias Sociales; 4a.; McGraw-Hill: México D.F., Mexico, 2008; ISBN 9789701030707. [Google Scholar]
- Matosas-López, L.; Romero-Ania, A.; Romero-Luis, J. Similarities and differences in the use patterns of social networks by university students: Comparative Spain—Azerbaijan. In Proceedings of the Congreso Universitario Internacional Sobre La Comunicación En La Profesión Y En La Universidad De Hoy: Contenidos, Investigación, Innovación y Docencia (CUICIID); Padilla Castillo, G., Ed.; Fórum XXI: Madrid, Spain, 2019; pp. 754–757. [Google Scholar]
- Vílchez Vilela, M.J.; Reche Urbano, E.; Marín Díaz, V. Diseño y validación de un cuestionario para valorar Whatsapp en la regulación de trabajo en grupo. Rev. Científica Electrónica Educ. Comun. Soc. Conoc. 2015, 15, 245–272. [Google Scholar]
- Alonso-García, S.; Morte-Toboso, E.; Almansa-Núñez, S. Redes sociales aplicadas a la educación: EDMODO. EDMETIC Rev. Educ. Mediática TIC 2014, 4, 88–111. [Google Scholar]
- Monge Benito, S.; Olabarri Fernández, M.E. Los alumnos de la UPV/EHU frente a Tuenti y Facebook: Usos y percepciones. Rev. Lat. Comun. Soc. 2011, 66. [Google Scholar]
- Valerio Ureña, G.; Serna Valdivia, R. Redes sociales y bienestar psicológico del estudiante universitario. Rev. Electrónica Investig. Educ. 2018, 20, 19. [Google Scholar] [CrossRef]
- Abella García, V.; Delgado Benito, V. Aprender a usar Twitter y usar Twitter para aprender. Profr. Rev. Currículum Form. Profr. 2015, 19, 364–378. [Google Scholar]
- Doval-Avendaño, M.; Domínguez Quintas, S.; Dans Álvarez, I. El uso ritual de las pantallas entre jóvenes universitarios/as. Prism. Soc. 2018, 21, 480–499. [Google Scholar]
- García Galera, M.D.C.; Fernández Muñoz, C.; Del Hoyo Hurtado, M. Ciudadanía informada, ciudadanía participativa. la movilización de los jóvenes en el entorno digital. Prism. Soc. 2017, 18, 124–143. [Google Scholar]


| Program | Enrolled Students | Sample | Sample Percentage Out of Enrolled Students |
|---|---|---|---|
| Marketing | 1853 | 164 | 8.85% |
| Elementary Education | 1457 | 133 | 9.15% |
| Law | 1411 | 125 | 8.84% |
| Accounting and Finance | 841 | 74 | 8.75% |
| International Relations | 719 | 65 | 9.10% |
| Industrial Organization Engineering | 486 | 48 | 9.88% |
| Nursing | 361 | 31 | 8.59% |
| Social Work | 215 | 20 | 9.40% |
| Total | 7128 | 640 | 8.98% |
| Item | Description |
|---|---|
| Block I | |
| Item 1 | Importance placed on having an active Twitter account |
| Item 2 | Importance placed on having an active Facebook account |
| Item 3 | Importance placed on having an active Instagram account |
| Item 4 | Importance placed on having an active LinkedIn account |
| Item 5 | Frequency of accessing Twitter |
| Item 6 | Frequency of accessing Facebook |
| Item 7 | Frequency of accessing Instagram |
| Item 8 | Frequency of accessing LinkedIn |
| Block II | |
| Item 9 | Importance placed on following friends and/or family members |
| Item 10 | Importance placed on following prominent figures |
| Item 11 | Importance placed on mentioning friends and/or family members |
| Item 12 | Importance placed on mentioning prominent figures |
| Item 13 | Importance placed on sending private messages to other users |
| Item 14 | Importance placed on watching videos or GIFs on the network |
| Item 15 | Importance placed on posting videos or GIFs on the network |
| Item 16 | Importance placed on searching for or accessing information |
| Item 17 | Importance placed on looking at photos |
| Item 18 | Importance placed on posting photos |
| Item 19 | Importance placed on sharing your thoughts |
| Item 20 | Importance placed on participating in surveys or games |
| Item 21 | Importance placed on taking part in discussions |
| Block III | |
| Item 22 | Importance placed on posting status updates |
| Item 23 | Importance placed on the look and presentation of your profile photo |
| Item 24 | Importance placed on the personal description shown on your profile |
| Item 25 | Frequency of use of the mentions function |
| Item 26 | Frequency of use of the hashtag function |
| Item 27 | Frequency of use of “like” function or similar |
| Block IV | |
| Item 28 | Device used to access social networks |
| Item | SD | Skewness | Skewness Standard Error | Kurtosis | Kurtosis Standard Error |
|---|---|---|---|---|---|
| Item 5 | 1.456 | 0.972 | 0.145 | −0.519 | 0.290 |
| Item 6 | 1.733 | −0.110 | 0.145 | 1.231 | 0.290 |
| Item 7 | 1.780 | 0.368 | 0.145 | −1.402 | 0.290 |
| Item 11 | 1.097 | −0.207 | 0.145 | −0.470 | 0.290 |
| Item 12 | 1.008 | 0.802 | 0.145 | 0.419 | 0.290 |
| Item 14 | 1.095 | −0.388 | 0.145 | −0.566 | 0.290 |
| Item 15 | 1.177 | 0.451 | 0.145 | −0.736 | 0.290 |
| Item 16 | 1.032 | −0.810 | 0.145 | 0.162 | 0.290 |
| Item 17 | 1.026 | −0.711 | 0.145 | 0.104 | 0.290 |
| Item 18 | 1.123 | −0.203 | 0.145 | −0.598 | 0.290 |
| Item 20 | 1.251 | 0.386 | 0.145 | −0.857 | 0.290 |
| Item 21 | 1.186 | 0.378 | 0.145 | −0.760 | 0.290 |
| Item 22 | 1.120 | −0.192 | 0.145 | −0.700 | 0.290 |
| Item 23 | 1.436 | 0.276 | 0.145 | −1.278 | 0.290 |
| Item 24 | 1.399 | 0.012 | 0.145 | −1.265 | 0.290 |
| Item 25 | 0.956 | 0.056 | 0.145 | −0.628 | 0.290 |
| Item 26 | 0.946 | 0.841 | 0.145 | 0.022 | 0.290 |
| Item 27 | 1.071 | −0.487 | 0.145 | −0.254 | 0.290 |
| Item 28 | 0.407 | 5.407 | 0.145 | 29.381 | 0.290 |
| Item | Scale Variance If Item Deleted | Corrected Item-Total Correlation | Cronbach’s Alpha If Item Deleted |
|---|---|---|---|
| Item 5 | 77.796 | 0.158 | 0.714 |
| Item 6 | 77.142 | 0.125 | 0.723 |
| Item 7 | 77.556 | 0.103 | 0.727 |
| Item 11 | 74.742 | 0.422 | 0.686 |
| Item 12 | 76.702 | 0.354 | 0.693 |
| Item 14 | 73.596 | 0.488 | 0.680 |
| Item 15 | 72.124 | 0.523 | 0.675 |
| Item 16 | 73.834 | 0.511 | 0.680 |
| Item 17 | 73.410 | 0.540 | 0.677 |
| Item 18 | 70.947 | 0.621 | 0.667 |
| Item 20 | 71.934 | 0.493 | 0.677 |
| Item 21 | 74.750 | 0.380 | 0.689 |
| Item 22 | 72.078 | 0.559 | 0.673 |
| Item 23 | 81.285 | 0.024 | 0.728 |
| Item 24 | 84.244 | −0.087 | 0.738 |
| Item 25 | 79.817 | 0.243 | 0.706 |
| Item 26 | 80.939 | 0.222 | 0.711 |
| Item 27 | 78.141 | 0.247 | 0.702 |
| Item | Factor 1 | Factor 2 | Factor 3 | Factor 4 |
|---|---|---|---|---|
| Item 17 | 0.841 | |||
| Item 14 | 0.775 | |||
| Item 16 | 0.768 | |||
| Item 11 | 0.601 | |||
| Item 18 | 0.851 | |||
| Item 22 | 0.841 | |||
| Item 15 | 0.731 | |||
| Item 12 | 0.480 | |||
| Item 21 | 0.841 | |||
| Item 20 | 0.769 | |||
| Item 26 | 0.698 | |||
| Item 27 | 0.687 | |||
| Item 25 | 0.668 |
| Item | Description | Average | SD |
|---|---|---|---|
| Factor 1: Viewing | |||
| Item 17 | Importance placed on looking at photos | 3.80 | 1.026 |
| Item 14 | Importance placed on watching videos or GIFs on the network | 3.55 | 1.095 |
| Item 16 | Importance placed on searching for or accessing information | 3.89 | 1.032 |
| Item 11 | Importance placed on mentioning friends and/or family members | 3.24 | 1.097 |
| Factor 2: Posting | |||
| Item 18 | Importance placed on posting photos | 3.12 | 1.023 |
| Item 22 | Importance placed on posting status updates | 2.96 | 1.020 |
| Item 15 | Importance placed on posting videos or GIFs on the network | 2.35 | 1.177 |
| Item 12 | Importance placed on mentioning prominent figures | 2.20 | 1.008 |
| Factor 3: Participating | |||
| Item 21 | Importance placed on taking part in discussions | 2.47 | 1.286 |
| Item 20 | Importance placed on participating in surveys or games | 2.53 | 1.351 |
| Factor 4: Interacting | |||
| Item 26 | Frequency of use of the hashtag function | 1.91 | 0.946 |
| Item 27 | Frequency of use of “like” function or similar | 3.43 | 1.071 |
| Item 25 | Frequency of use of the mentions function | 2.65 | 0.956 |
© 2020 by the authors. Licensee MDPI, Basel, Switzerland. This article is an open access article distributed under the terms and conditions of the Creative Commons Attribution (CC BY) license (http://creativecommons.org/licenses/by/4.0/).
Share and Cite
Gómez-García, M.; Matosas-López, L.; Ruiz-Palmero, J. Social Networks Use Patterns among University Youth: The Validity and Reliability of an Updated Measurement Instrument. Sustainability 2020, 12, 3503. https://doi.org/10.3390/su12093503
Gómez-García M, Matosas-López L, Ruiz-Palmero J. Social Networks Use Patterns among University Youth: The Validity and Reliability of an Updated Measurement Instrument. Sustainability. 2020; 12(9):3503. https://doi.org/10.3390/su12093503
Chicago/Turabian StyleGómez-García, Melchor, Luis Matosas-López, and Julio Ruiz-Palmero. 2020. "Social Networks Use Patterns among University Youth: The Validity and Reliability of an Updated Measurement Instrument" Sustainability 12, no. 9: 3503. https://doi.org/10.3390/su12093503
APA StyleGómez-García, M., Matosas-López, L., & Ruiz-Palmero, J. (2020). Social Networks Use Patterns among University Youth: The Validity and Reliability of an Updated Measurement Instrument. Sustainability, 12(9), 3503. https://doi.org/10.3390/su12093503