Article

Using Si, Al and Fe as Tracers for Source Apportionment of Air Pollutants in Lake Baikal Snowpack

by
Mikhail Yu. Semenov
1,*,
Anton V. Silaev
2,
Yuri M. Semenov
2 and
Larisa A. Begunova
3
1
Limnological institute of Siberian Branch of Russian Academy of Sciences, Ulan-Batorskaya st. 3, 664033 Irkutsk, Russia
2
V.B. Sochava Institute of Geography of Siberian Branch of Russian Academy of Sciences, Ulan-Batorskaya st. 1, 664033 Irkutsk, Russia
3
Department of chemistry and food technology, Institute of high technologies, Irkutsk National Research Technical University, Lermontov st. 83, 664074 Irkutsk, Russia
*
Author to whom correspondence should be addressed.
Sustainability 2020, 12(8), 3392; https://doi.org/10.3390/su12083392
Submission received: 12 March 2020 / Revised: 17 April 2020 / Accepted: 19 April 2020 / Published: 22 April 2020

Abstract

:
The aim of this study was to select chemical species characterized by distinctly different proportions in natural and anthropogenic particulate matter that could be used as tracers for air pollutant sources. The end-member mixing approach, based on the observation that the chemical species in snow closely correlated with land use are those that exhibit differences in concentrations across the different types of anthropogenic wastes, was used for source apportionment. The concentrations of Si and Fe normalized to Al were used as tracers in the mixing equations. Mixing diagrams showed that the major pollution sources (in descending order) are oil, coal, and wood combustion. The traces of several minor sources, such as aluminum production plants, pulp and paper mills, steel rust, and natural aluminosilicates, were also detected. It was found that the fingerprint of diesel engines on snow is similar to that of oil combustion; thus, future research of the role of diesel engines in air pollution will be needed. The insufficient precision of source apportionment is probably due to different combinations of pollution sources in different areas. Thus, principles for the delineation of areas affected by different source combinations should be the subject of further studies.

1. Introduction

The contribution of different emission sources to air pollution can be identified and quantified by two main families of modelling techniques: receptor-oriented models (RMs) and source-oriented models (SMs) [1,2,3,4,5,6]. SMs have been used to simulate the distribution of concentrations of airborne pollutants over the Lake Baikal area using emission inventories and meteorological fields, as well as air concentrations, as input data [7,8,9]. However, the large amount of input data made it difficult to use SMs. Moreover, quantitative assessment of the relationship between the emissions from a given source and the corresponding air concentration is also difficult when using SMs. The calculation of source contribution is easier using RMs. Nevertheless, despite numerous studies concerned with air pollution over Lake Baikal [10,11,12,13,14,15], RMs have never been applied for source apportionment in this area. The applicability of different RMs is conditioned by availability of input data. Some RM techniques require data of the chemical composition of source emissions (called source profiles) and other techniques to derive the source profiles from pollutant concentrations at the receptor site.
RM techniques that do not require source profiles are based on multivariate analysis techniques, such as principal component analysis (PCA) [16,17,18], cluster analysis [19,20,21], and factor analysis [22,23]. Multivariate techniques use an orthogonal transformation to convert a set of observations of possibly correlated variables (tracers) into a set of values of linearly uncorrelated variables called principal components (PCs) or factors. Each PC is assumed to represent a source [24,25,26,27,28], characterized by a certain group of chemicals (source profile). Multivariate approaches allow the use of a variety of possible tracers simultaneously; however, the obtained results may be misleading because the reconstructed source profiles may be combinations of several real source profiles, or may not exist at all [29].
Source profiles are the most realistic basis for source apportionment [30]. The most efficient technique that uses source profiles is the Chemical Mass Balance (CMB) model [31]. CMB uses multiple tracers [32,33,34] measured at the receptor site and expresses them as the sum of products of source compositions and source contributions using a set of linear equations. The precision of source apportionment using CMB depends on the number of chemical species used for fitting: the greater the number, the higher the precision is. CMB is sensitive to the degree of similarity among the source profiles: the higher the similarity, the lower the model’s applicability [31,32]. This model is only useful for primary emissions [35].
Selecting the chemical species that can be used as tracers is a crucial aspect in any study concerned with the source apportionment of pollutants. Less reliable source apportionment results are usually obtained when using organic tracers. Organic tracers, such as polycyclic aromatic hydrocarbons (PAHs), are subject to oxidation by ozone or nitrogen oxides [36] or due to microbial degradation [37,38,39]. Changes in organic tracer values may also occur during the sampling process [40,41,42] or due to physicochemical [43,44] or biological [45] fractionation. Stable isotopes of light elements are more conservative than those of PAHs; however, they also can be biased due to mixing of element sources and biological fractionation [46,47,48,49,50,51]. The most reliable results are obtained using lead isotope ratios as source tracers [52,53,54,55], as the Pb isotope ratio does not change in industrial or environmental processing, and retains its characteristic value from its source ore [56]. The disadvantage of using lead isotopes is the low Pb concentrations in most study objects (i.e., water, air, and snow). The main problem in all tracer studies is the lack of literature data on tracer concentrations in source emissions (source profiles).
It seems more promising to use conservative tracers, for which concentrations in various environmental objects (as well as in anthropogenic wastes) are widely known, such as the elements which are most abundant in the Earth’s crust. The small number of such elements makes it necessary to use simple but efficient RM techniques for source apportionment, such as the end-member mixing analysis (EMMA) technique previously used in hydrological studies [57]. This approach is based on the observation that the chemical species in air most closely correlated with land use are the same ones that exhibit marked differences in concentrations across the different types of fuels and industrial and domestic wastes. Thus, the aim of this study was to select the tracers, characterized by distinctly different proportions in natural and anthropogenic particulate matter, which are suitable for source apportionment of air pollutants in the Lake Baikal area using EMMA.

2. Materials and Methods

2.1. Study Area

The study was conducted in Southeast Siberia (Figure 1a) at Lake Baikal (Figure 1b) in February of 2018 and 2019. The study area is characterized by long, cold winters lasting 4–5 months (November–March) and short, hot summers (June–August). The mean winter air temperatures are about −15 to −20 degrees Celsius (°C), and the mean summer air temperatures are about 20 to 25 °C.
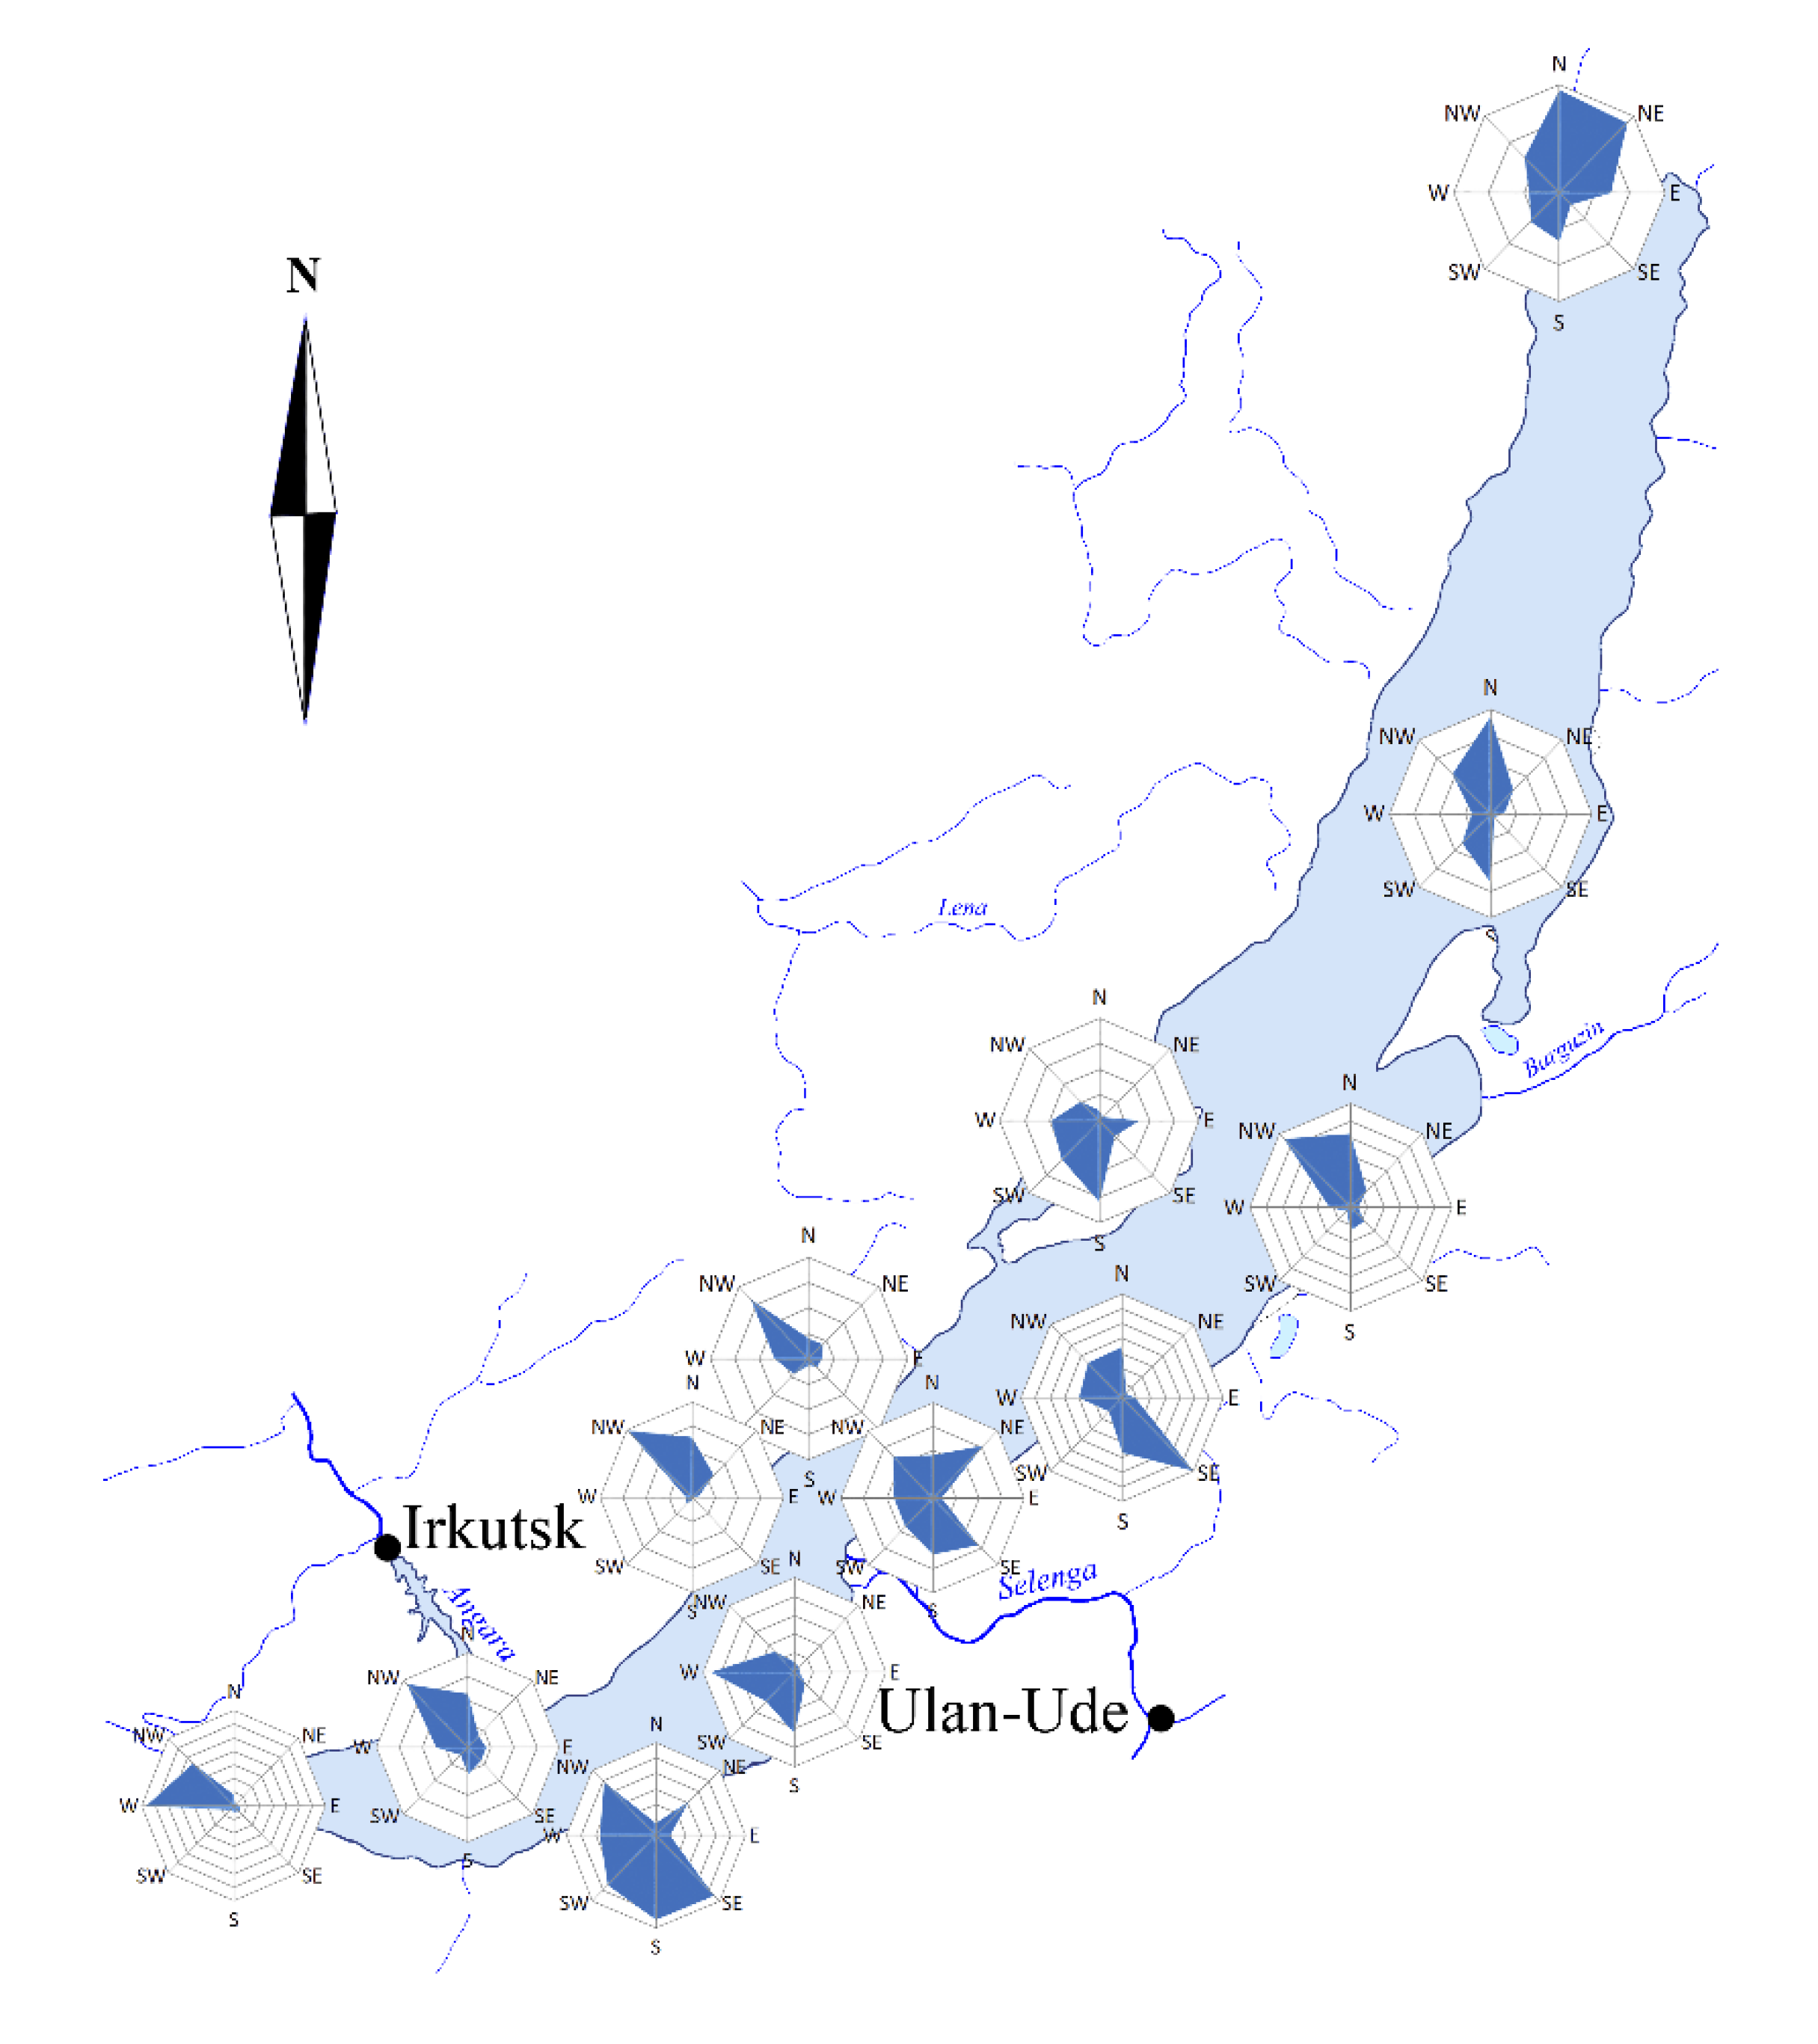
The characteristic feature of atmospheric circulation in the study area is the prevalence of western transport of air masses, up to 3–5 km in height. In winter, the Siberian anticyclone stops Atlantic air from advancing into Russia’s east, leading to prolonged frosts and fair weather in the Lake Baikal area. The East Asian winter monsoon does not affect the Lake Baikal basin, passing to the south of it. The winter circulation of air masses over Lake Baikal is conditioned by relief. Baikal lies in a deep structural hollow surrounded by mountains, some of which rise more than 2,000 meters above the lake’s surface. Cold air sweeps down from the tops of the mountains, along the valleys and intermountain depressions, towards the lake. As the most of valleys and depressions around the lake are oriented north-west or south-east, the predominant wind directions are northwesterly and southeasterly (Figure 2).
Thus, winds blow from the mountains to the center of the lake. The speed of the winds does not depend on direction and varies from 1–7 m/s. The persistent blocking pattern, together with light winds, suggest local pollution sources dominate over Lake Baikal in wintertime.
The area is not densely populated (population density is 2.8 people per square kilometer); however, numerous anthropogenic emission sources are located in the Lake Baikal catchment. Some sources, such as pulp and paper mills, oil-fired and coal-fired central and residential heating boilers, wood stoves, and woodworking plants are located directly on the lake shore [43]. Other sources, such as aluminum plants, oil refineries, and asphalt plants, as well as numerous central and residential heating boilers, are located upwind from the lake along the Angara (the only Baikal outflow) and Selenga (a major Baikal tributary) river valleys [8]. The emission composition profiles of various local pollution sources used in this study were derived from the literature [58,59,60,61,62,63]. On plants equipped with wet scrubbers, the spent scrubber liquid was sampled from the recirculation tanks. On plants equipped with electrostatic precipitators, the particulate matter was sampled from collecting hoppers. Collected particulate matter samples were digested using diluted nitric acid prior to analysis. Concentrations of elements were determined via mass spectrometry. Soil dust containing quartz and aluminosilicates was considered as a natural crustal element source.

2.2. Sampling and Chemical Determinations

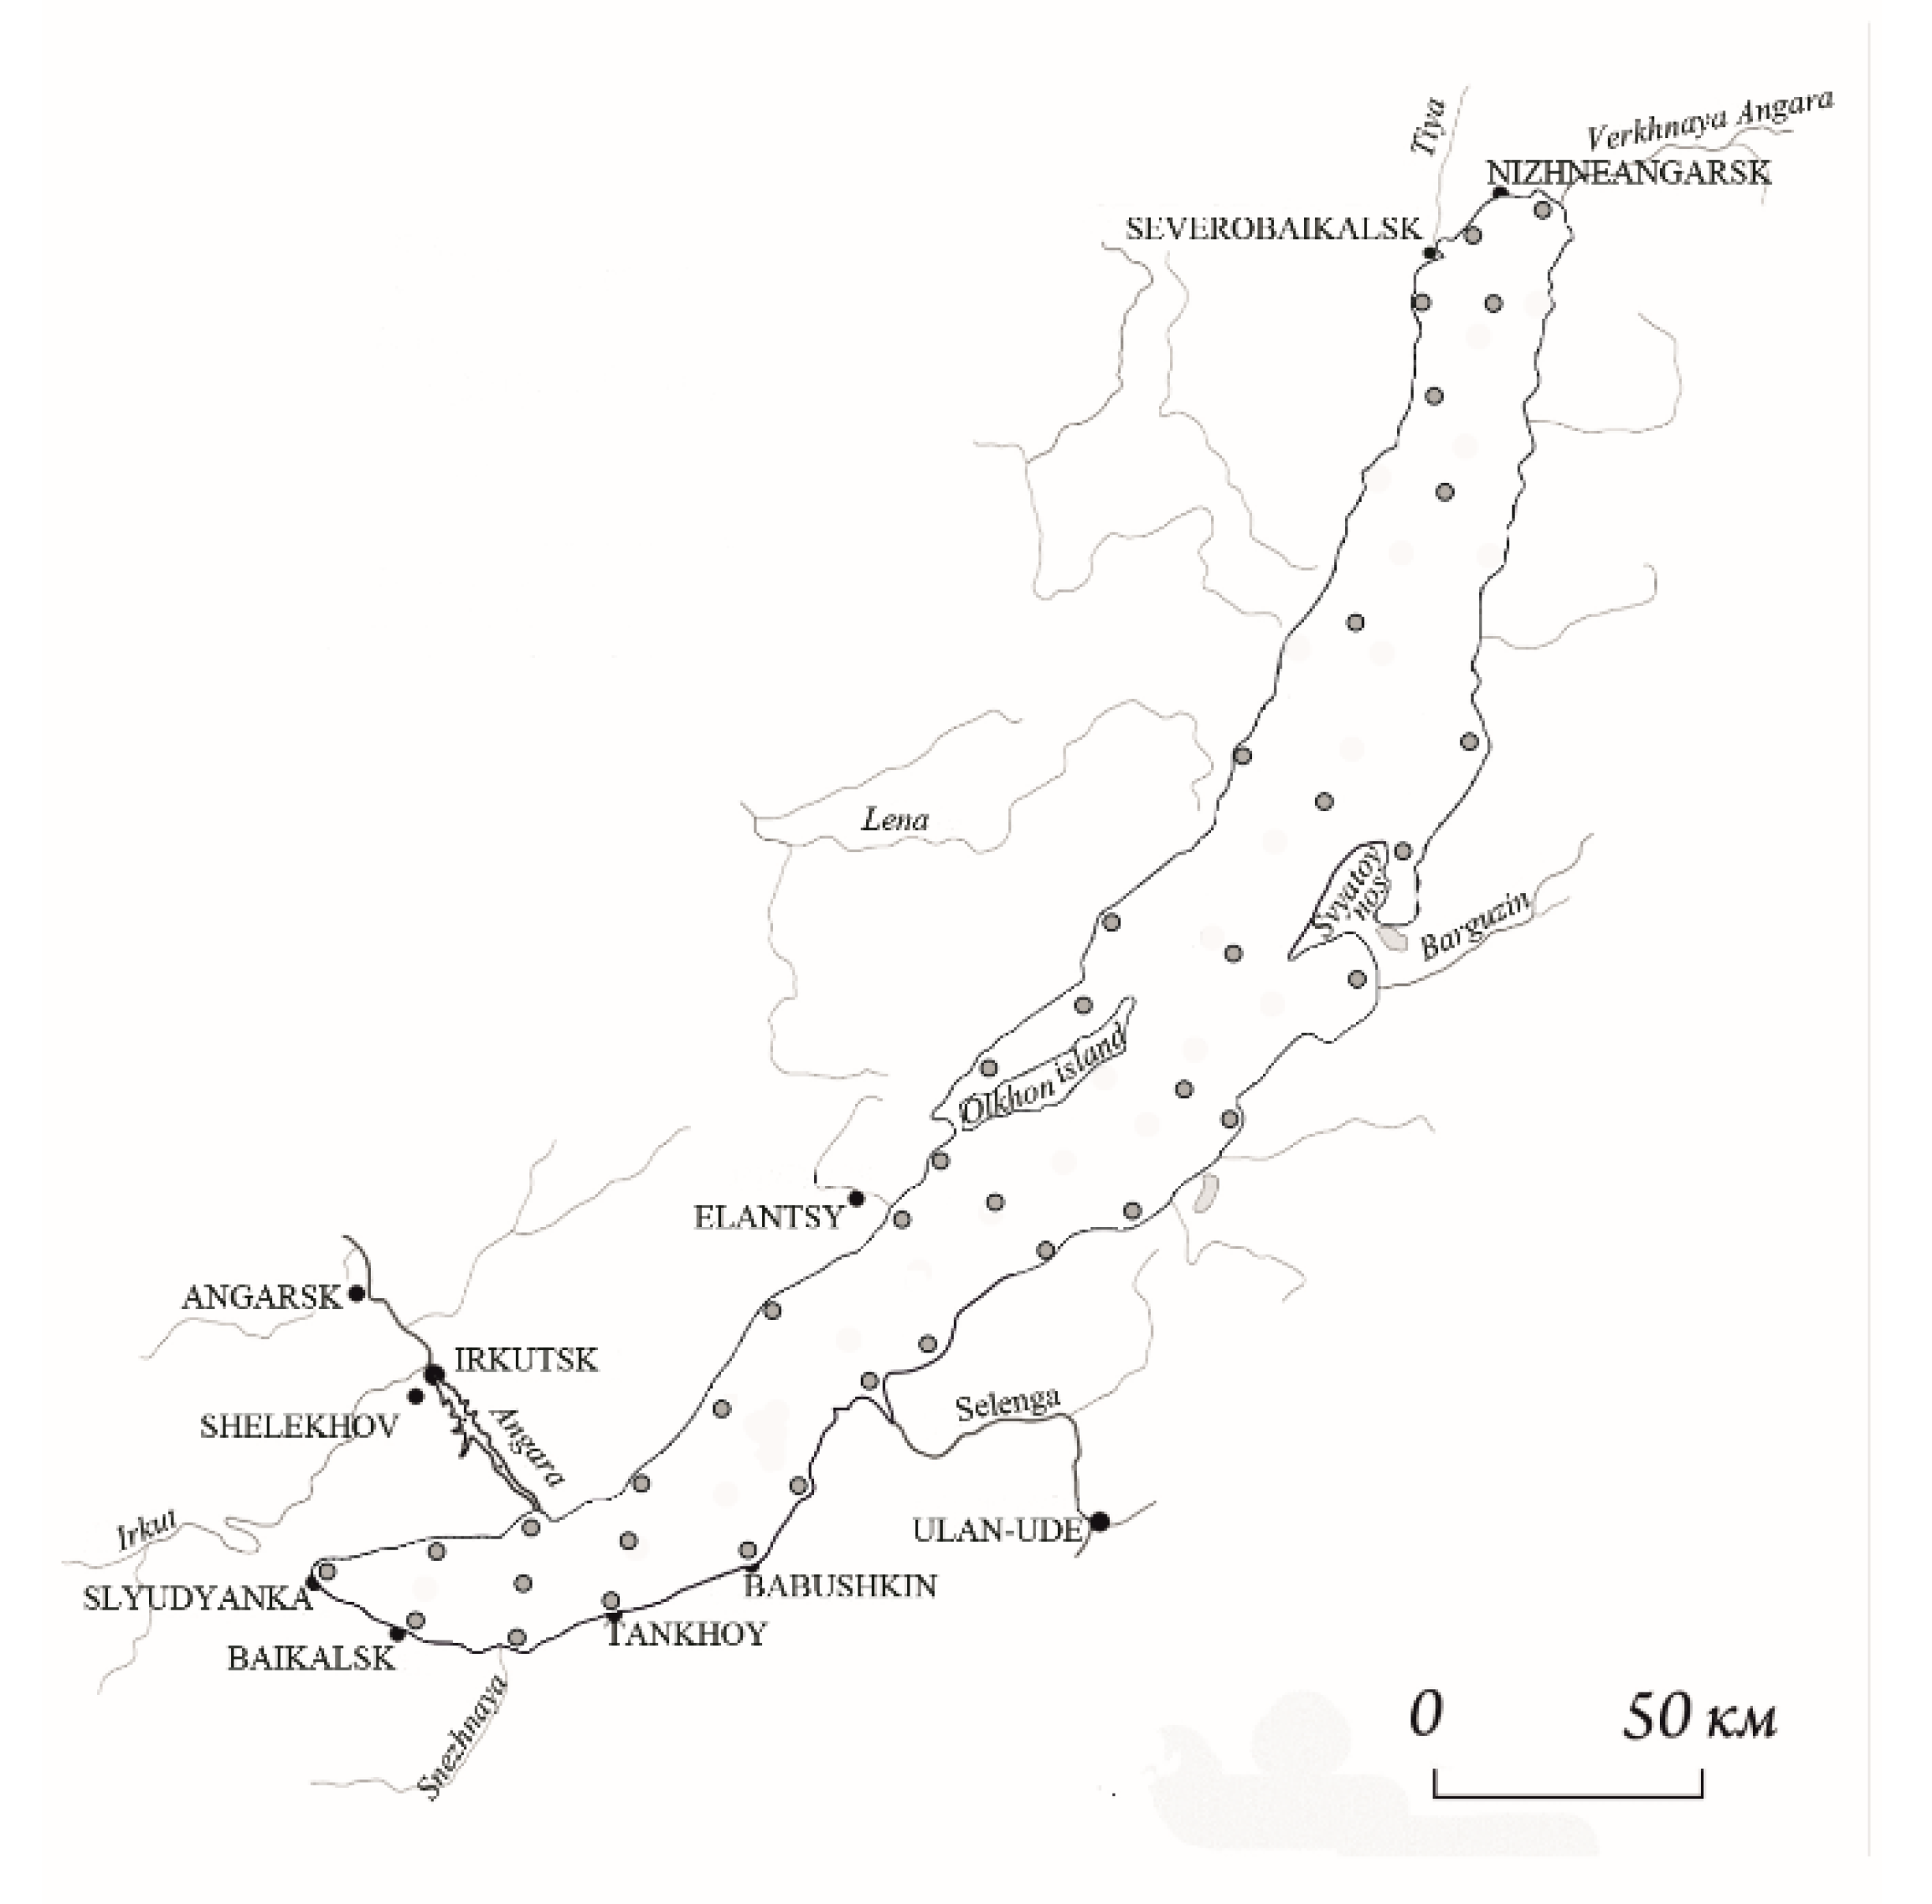
The lake snowpack was selected as the study object, as the snow is an excellent matrix which allows air pollutants to accumulate and become isolated from other environmental media (e.g., soil, water, or plants) during the whole winter period. The snow was sampled from the lake ice surface before the period of snow melting (from early March to early April), according to a map of sampling locations (Figure 3).
Initially, it was supposed that samples would be collected from a regular grid of 20 × 20 km. However, the actual positions of sampling locations were conditioned by their accessibility and the presence of snow cover. One 50 × 50 m sampling plot was established in each sampling location. Five subplots for snow sampling were selected at the center and on the diagonals of the sampling plot. The thickness of the snow layer varied from several centimeters offshore to tens of centimeters nearshore. In deep snow, samples were taken through the entire snow layer profile using the snow coring tube VS-43 (NGO Typhoon, Russia). In shallow snow, samples were obtained using trowels. A total of 152 samples were collected from all sampling locations. The weight of snow samples varied from 0.5 to 1.5 kg. Snow samples were stored outside in plastic bags at negative temperatures prior to analysis.
The melt water was filtered through 47 mm Whatman® nitrocellulose membrane filters with pore size of 5 μm. Filtration was performed to remove particulate matter that originated from random pollution sources characterized by a predominance of coarse particles, such as plant residues, domestic wastes (e.g., paper, food, and construction rubbish), salt/sand used to de-ice roadways, and so on. This was especially important for sampling points located close to settlements. Filtered meltwater was then subjected to microwave-assisted digestion using diluted nitric acid prior to analysis. The concentrations of Si, Al, Fe, Mo, Mn, Sr, B, V, Ni, Cu, Co, Cd, and Ti were measured using an Agilent 7500 mass spectrometer. The ICP-MS was calibrated at six concentration levels (0.5, 1, 2, 5, 10, and 20 µg/L) to determine the linearity of the responses before sample analysis. For calibration of the mass spectrometer, the multi-element standard solutions ICP-MS68A-A and ICP-MS-68A-B (High-purity standards, Charleston, U.S.A.) were used. To control the analysis quality, all samples were spiked with internal surrogate standards. As no sample manipulation was performed before measurement, the recovery of analytes was not assessed. Detection limits varied from 0.03 (for Ni and V) to 0.2 µg/L (for Al and Fe). The accuracy (closeness of a measured value to the standard) and precision (closeness of repeat analysis values) of measurements, expressed as standard deviation, were evaluated. Precision ranged from 2% to 7%, although most values were better than 10%, and accuracy ranged from 2.7% to 13.4% and, therefore, was very good. Additional data on snow meltwater chemistry were extracted from the literature [10,11,12,13].

2.3. Data Processing

The number of sources was determined using PCA. PCA is a statistical procedure that uses an orthogonal transformation to convert an initial data set (where samples are in rows and the columns are chemicals) into a set of values of linearly uncorrelated variables called principal components (PCs). Each PC (eigenvector) corresponds to an eigenvalue which reflects the quality of the projection from the N-dimensional initial data set to a reduced number of dimensions. PCs with eigenvalues greater than 1.00 were retained [64]. The retained PCs were considered as potential pollution sources. The PCs with eigenvalues less than 1.00 were not retained, as they accounted for less variability than a single variable (i.e., an initial variable in the data set).
Actual pollution sources were identified using the end-member mixing approach [57]. The identification procedure was based on plotting the samples with potential end-member sources on the same mixing diagram using the ratios of crustal element concentrations (tracers) as co-ordinates. It was assumed that the other pollutants came from the same sources as crustal elements. The rule used to identify tracers and sources was to determine whether most samples could be tightly bound by a polygon whose vertices are pollution sources. When a point was inside a polygon, all the sources contributed to sample pollution; whereas, when a point was outside a polygon, only two neighboring sources (vertices) contributed to the pollution. Source contributions were calculated using the following system of linear equations:
{ f 1   +   f 2   +   + f n   =   1 T 1 1 · f 1   +   T 2 1 · f 2   +   +   T n 1 · f n   =   T mix 1 T 1 2 · f 1   +   T 2 2 · f 2   +   +   T n 2 · f n   =   T mix 2 T 1 m · f 1   +   T 2 m · f 2   +   +   T n m · f n   =   T mix m
where T is a tracer and f is the contribution of a specified source. Superscripts denote the tracer number, subscripts denote the source number, and the subscript mix denotes mixture or snow.
The solutions for samples lying outside the polygon have negative fractions for some sources, which is not realistic. To solve this problem, fractions for outliers were resolved by a geometric approach [65]. The idea underlying this approach is that the distance between the perpendicular dropped from an outlier to the side of the polygon and either of the two adjacent vertices is inversely proportional to the contribution of the corresponding source. The contribution of the third source (the vertex opposite to this side of the polygon) was set equal to zero.
For mapping purposes, source contributions were calculated using the element concentrations averaged for five samples taken within each sampling plot. As the obtained source contribution values were not regularly gridded, to estimate missing values in between existing ones, the source contributions were interpolated at the points P(x, y) in a grid using the QGIS 3.10 software. As implemented in the software, Delaunay triangulation was performed between the observed points such that all points formed a net of triangles with their direct neighbor, not having any other point within a triangle. The complements of the Delaunay triangles (called Thiessen polygons) were constructed by dividing the edges of the Delaunay triangles into halves. These cells C divide the area between the scattered points fairly. For a new interpolated point P(x, y), a new Thiessen polygon was constructed with its direct neighboring observations zi = f(xi, yi). The proportions of intersected area between the new cell Cp and the cells Ci served as weighting factors wi. The interpolated values were calculated according the following formula:
P ( x ,   y ) = i = 1 n w i   f ( x i ,   y i ) ,
where P(x, y) is the interpolated point at the position (x, y, z), n is the number of natural neighbors, f(xi, yi ) are the observed values surrounding P, and w i = ( C p C i ) / C p .

3. Results and Discussion

3.1. Chemical Composition of Snow Meltwater and Data Variability Analysis

The obtained data showed that the elemental composition of snow meltwater varied significantly from place to place. The only identified patterns in the spatial distribution of elements in snowpack were decreases of elemental concentrations in a direction towards the center of the lake and with distance from settlements along the coast. The concentrations of most of the measured elements (B, V, Ni, Cu, Co, Cd, and Ti) were very low. Moreover, in a substantial number of samples, the concentrations of these elements were below the detection limits. Nevertheless, all samples showed detectable concentrations of Si, Al, Fe, Mo, Mn, and Sr. The basic statistical parameters for these six elements in 152 samples are shown in Table 1. The highest mean concentration was observed for Si and the lowest mean concentration was observed for Mo. The highest standard deviations were observed for Si and Sr and the highest mean errors were observed for Sr, Al, and Fe. As can be seen from Table 1 and Table S1 (Supplementary Material), the descriptive statistics have not helped in revealing the origins of the atmospheric elements entrapped in the snow.
To divide the six most abundant elements into groups, according to the chemical nature of their parent compounds, principal component analysis was applied. The PCA results show that the largest portion of elemental composition variability (61.66%) was explained by two PCs with eigenvalues greater than 1.00 (Table 2). However, PC3’s eigenvalue was close to 1.00, and so the number of emission sources was either two or three.
The first PC accounts for the variability of Fe, Al, and Mn concentrations, and the second PC accounts for the variability of Sr, Si, and Mo concentrations (Figure 4). This most likely means that these two groups of elements originated from two particle types. Taking into account the elemental concentrations in snow meltwater (Table 1), these two groups of snow samples (or particle types) can be considered as Al-Fe-rich and Si-rich.
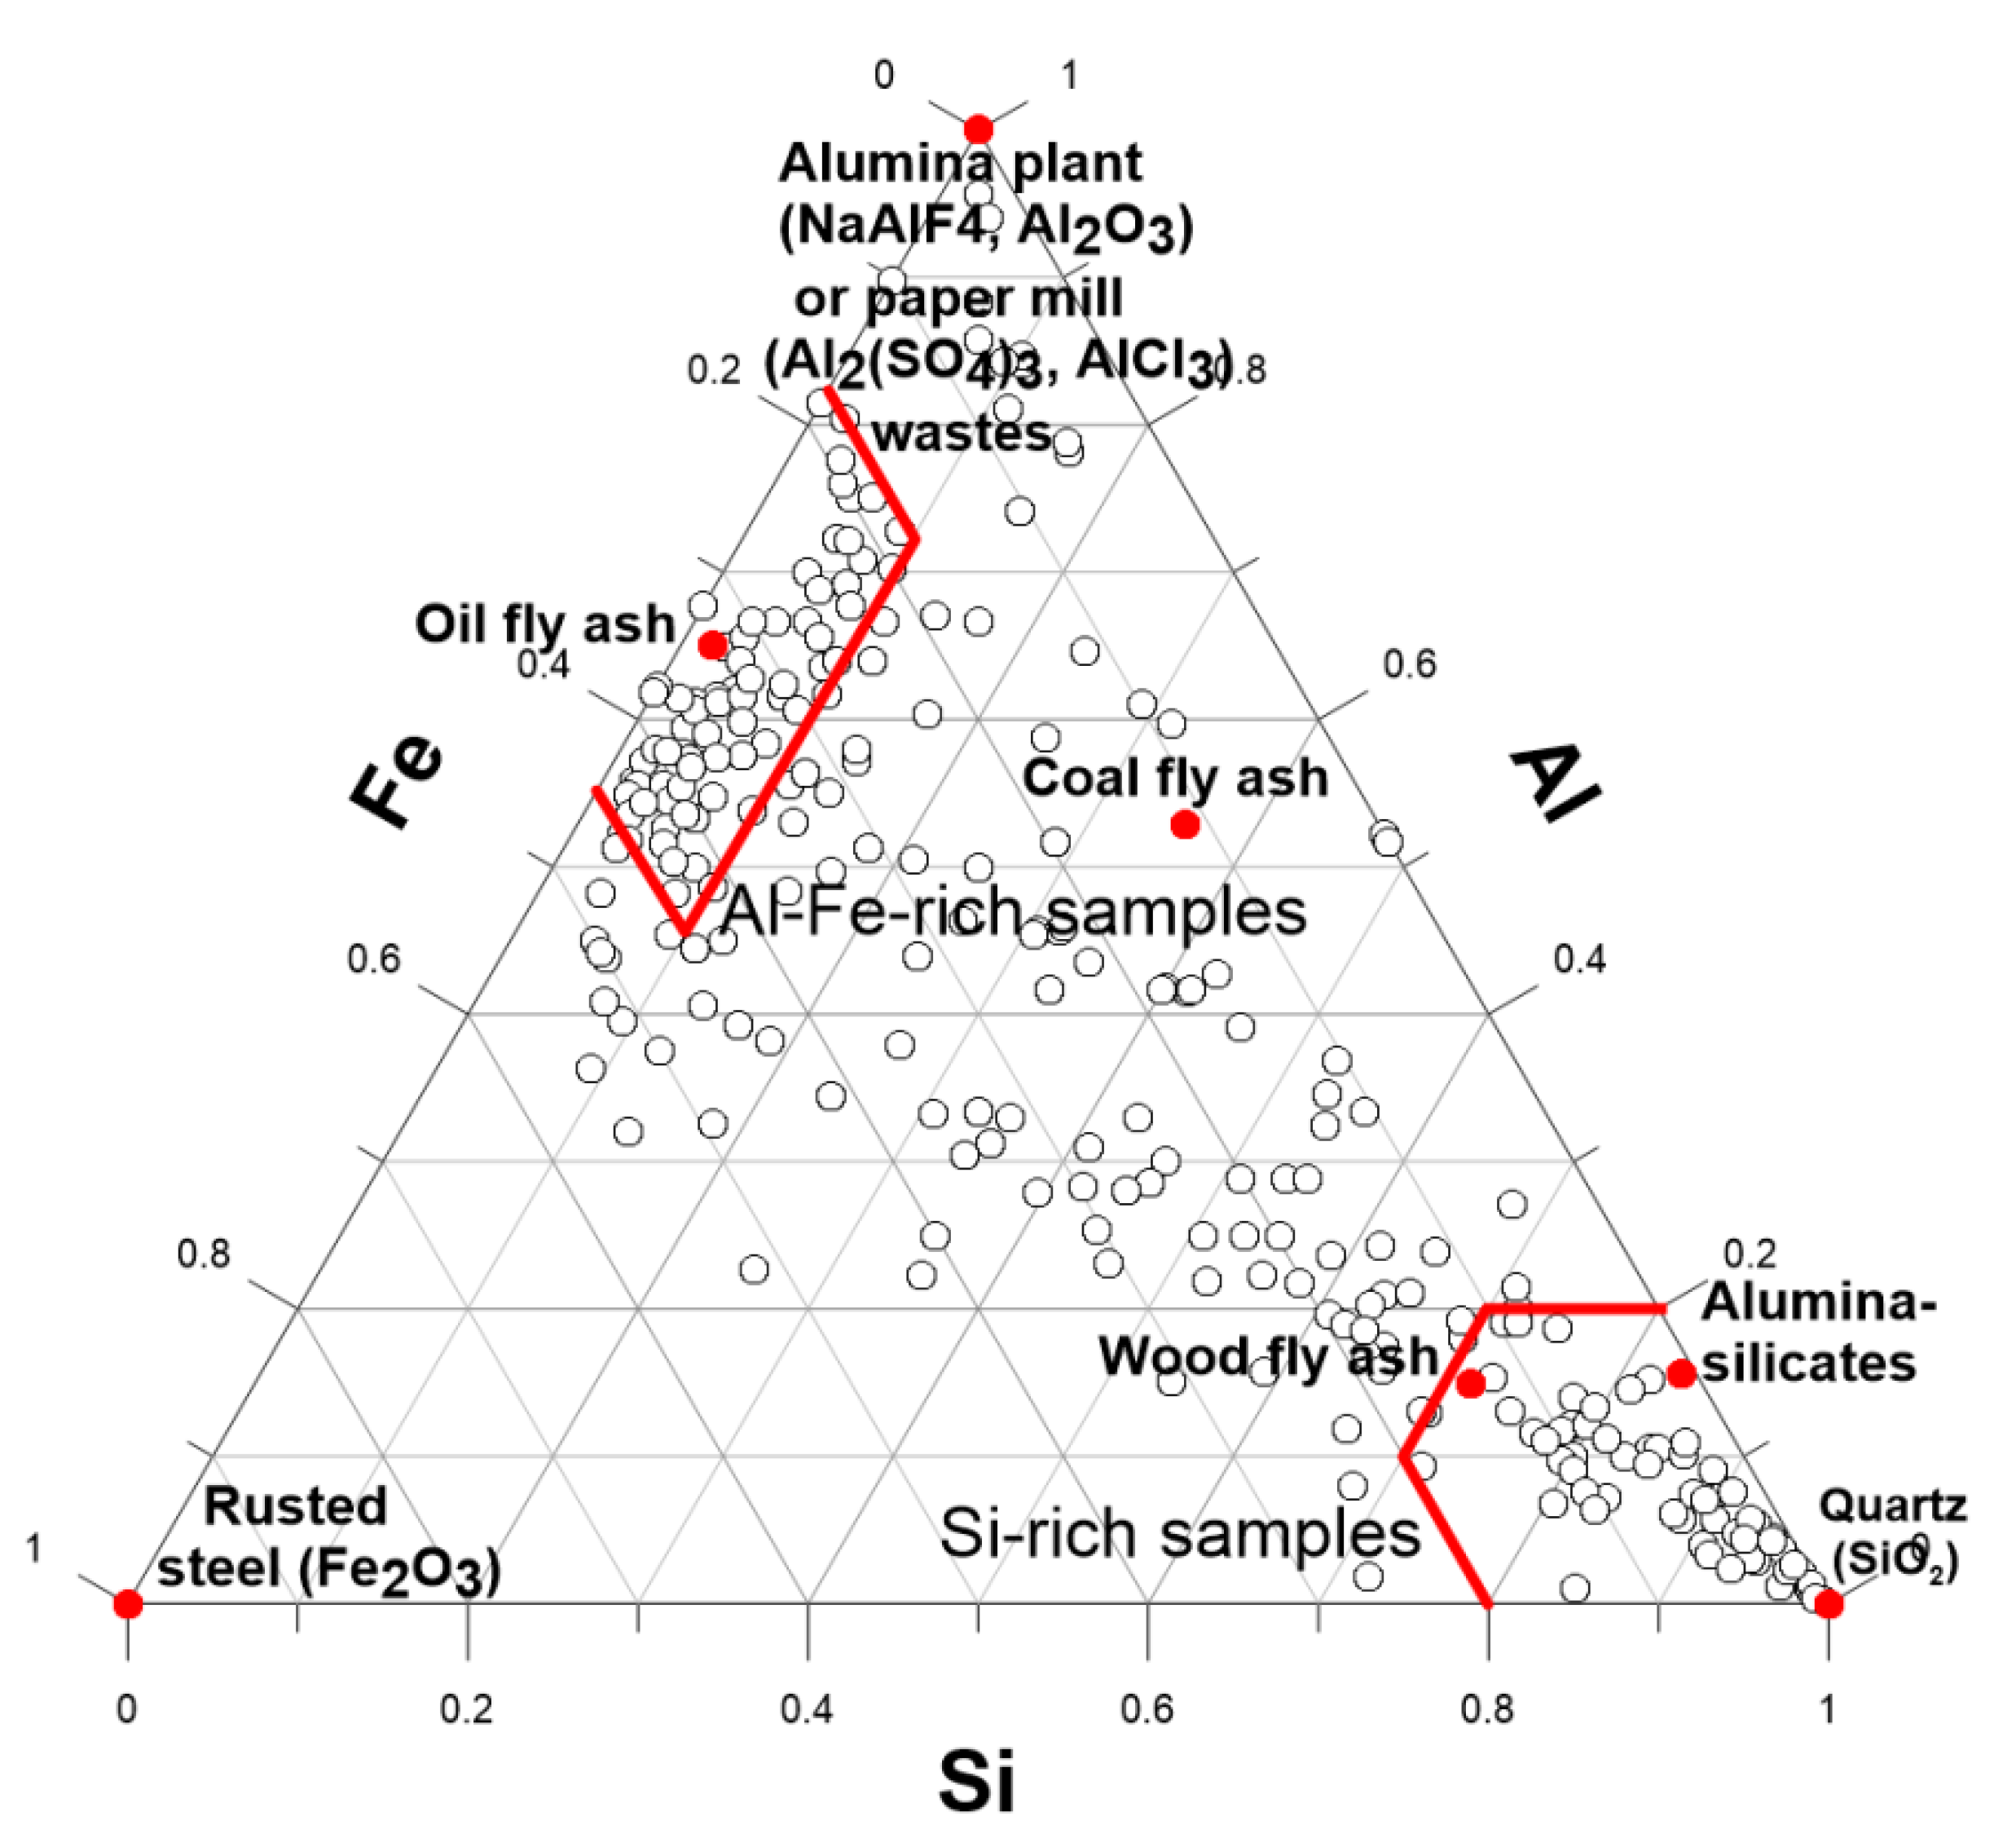
The division of snow samples into Al-Fe-rich and Si-rich groups is also evident in the ternary Si–Al–Fe diagram (Figure 5).
In Al-Fe-rich samples, the contributions of Si, Al, and Fe to the total concentration of these elements were in the ranges of 5–20%, 40–70%, and 20–50%, correspondingly; whereas, in Si-rich samples, the contributions of Si, Al, and Fe were in the ranges of 70–100%, 0–30%, and 0–20%, correspondingly. The average Si–Al–Fe ratio in Al-Fe-rich samples was 2:9:5, and the average Si–Al–Fe ratio in Si-rich samples was 21:2:1.

3.2. Chemical Composition of Potential Source Emissions

The composition of Al-Fe-rich particles was similar to that of oil and coal fly ash emitted from local sources such as oil- and coal-fired boilers (Figure 5), and similar in composition to oil and coal ash as reported in the scientific literature [66,67,68,69,70,71,72,73]. This makes it possible to use these values as source diagnostic ratios for source apportionment, regardless of study area location. The presence of other Al and Fe sources is also possible.
One of the possible Al sources could be the vaporization of electrolytes at Irkutsk aluminum plant located in Shelehov city (Figure 1b) and the release of sodium tetrafluoroaluminate (NaAlF4) into the atmosphere by process off-gas produced as a byproduct of an aluminum smelting process [74,75]. As dry scrubbing technologies have become more than 99% efficient, the main source of fluoride emissions is now fugitive. However, some gaseous and particulate Al-containing species can pass through the dry and wet scrubbers due to equipment ageing or malfunction. Another possible Al source could be the AlCl3 used at Selenginsk and Baikalsk pulp and paper mills for coagulation and precipitation of pulping effluent. These paper mills are located in the settlement of Selenginsk and in the city of Baikalsk respectively (Figure 1b). The pulping effluent from Selenginsk pulp and paper mill is stored in open tanks. Thus, the pollution of the coastal area with AlCl3 is possible during all seasons of the year, due to transport of effluent droplets by wind. The Baikalsk pulp and paper mill has not been in operation since 2008; however, its storage tanks are still full of effluent and, so, pollution of the coastal area is still possible during the warm time of the year. In winter, the polluted particulate matter from the lake coast can be redeposited on the ice-covered lake surface. The Fe source is probably steel rust.
The Si-rich particles were probably from naturally occurring minerals, such as aluminosilicates, which originated from distant sources. It is well-known that the Asian Dust phenomenon affects much of East Asia year-round. For example, in Korea, the annual arrival of yellow dust from Mongolia and China occurs in the spring [76], when high-speed surface winds blow from west to east. The chemical composition of a minor part of snow samples, plotted between arrays of Si-rich and (Al, Fe)-rich samples in Figure 5, is similar to that of the mineral dust from the Gobi Desert found in Korea [77]. However, such dust events are hardly possible in Eastern Siberia in winter, as the Siberian anticyclone (which is usually centered on Lake Baikal) prevents the intrusion of air masses from Mongolia [78]. Taking into account the atmospheric blocking over the Lake Baikal watershed in winter, the similarity of chemical compositions of Baikalian and Korean particulate matter samples seems to be coincidental. It is more likely that these samples were polluted with wood combustion residues, as their composition is also similar to that of local wood fly ash. The locally available aluminosilicates (soils and rocks) used to sprinkle the roads or which are blown out during excavation cannot be the source of the mineral dust in the Baikal snowpack, as they contain much less iron (Figure 5). As Si, Al, and Fe are the most abundant elements in the Earth’s crust, the use of them as tracers is only possible for source apportionment of particulate matter in snow and in air, as high natural concentrations of these elements in other environmental compartments mask the Si, Al, and Fe contributions from anthropogenic sources.

3.3. Source Apportionment

The absolute concentrations of Si, Al, and Fe cannot be used as tracers, as the elemental concentrations in source exhaust and snow have different units of measurement. To plot snow samples together with sources on one mixing diagram, all possible biplots for all combinations of Si, Al, and Fe concentrations, normalized to each other, were generated. The unitless Si/Al and Fe/Al concentration ratios were finally chosen as tracers. The maximum number of sources that can be quantified using these three-element concentrations is four. For this purpose, the Si, Al, and Fe concentrations normalized to the sum concentration of these elements would be used as potential tracers.
The use of the Si/Al–Fe/Al coordinate system sufficiently reduced the number of potential pollution sources that could be placed on the mixing diagram. For example, the Si/Al and Fe/Al coordinates of single-element fingerprint sources, such as aluminum plants, paper mills, quartz, and steel rust, would be equal to zero or undefined, as zero concentration divided by any nonzero concentration is 0 and any nonzero concentration divided by 0 is undefined. Moreover, the rule used to identify major pollution sources was to determine whether most samples could be bound tightly by a polygon formed by potential sources. From this point of view, the sources mentioned above are also not eligible, because they lay far away from the array of data points on the ternary diagram (Figure 5).
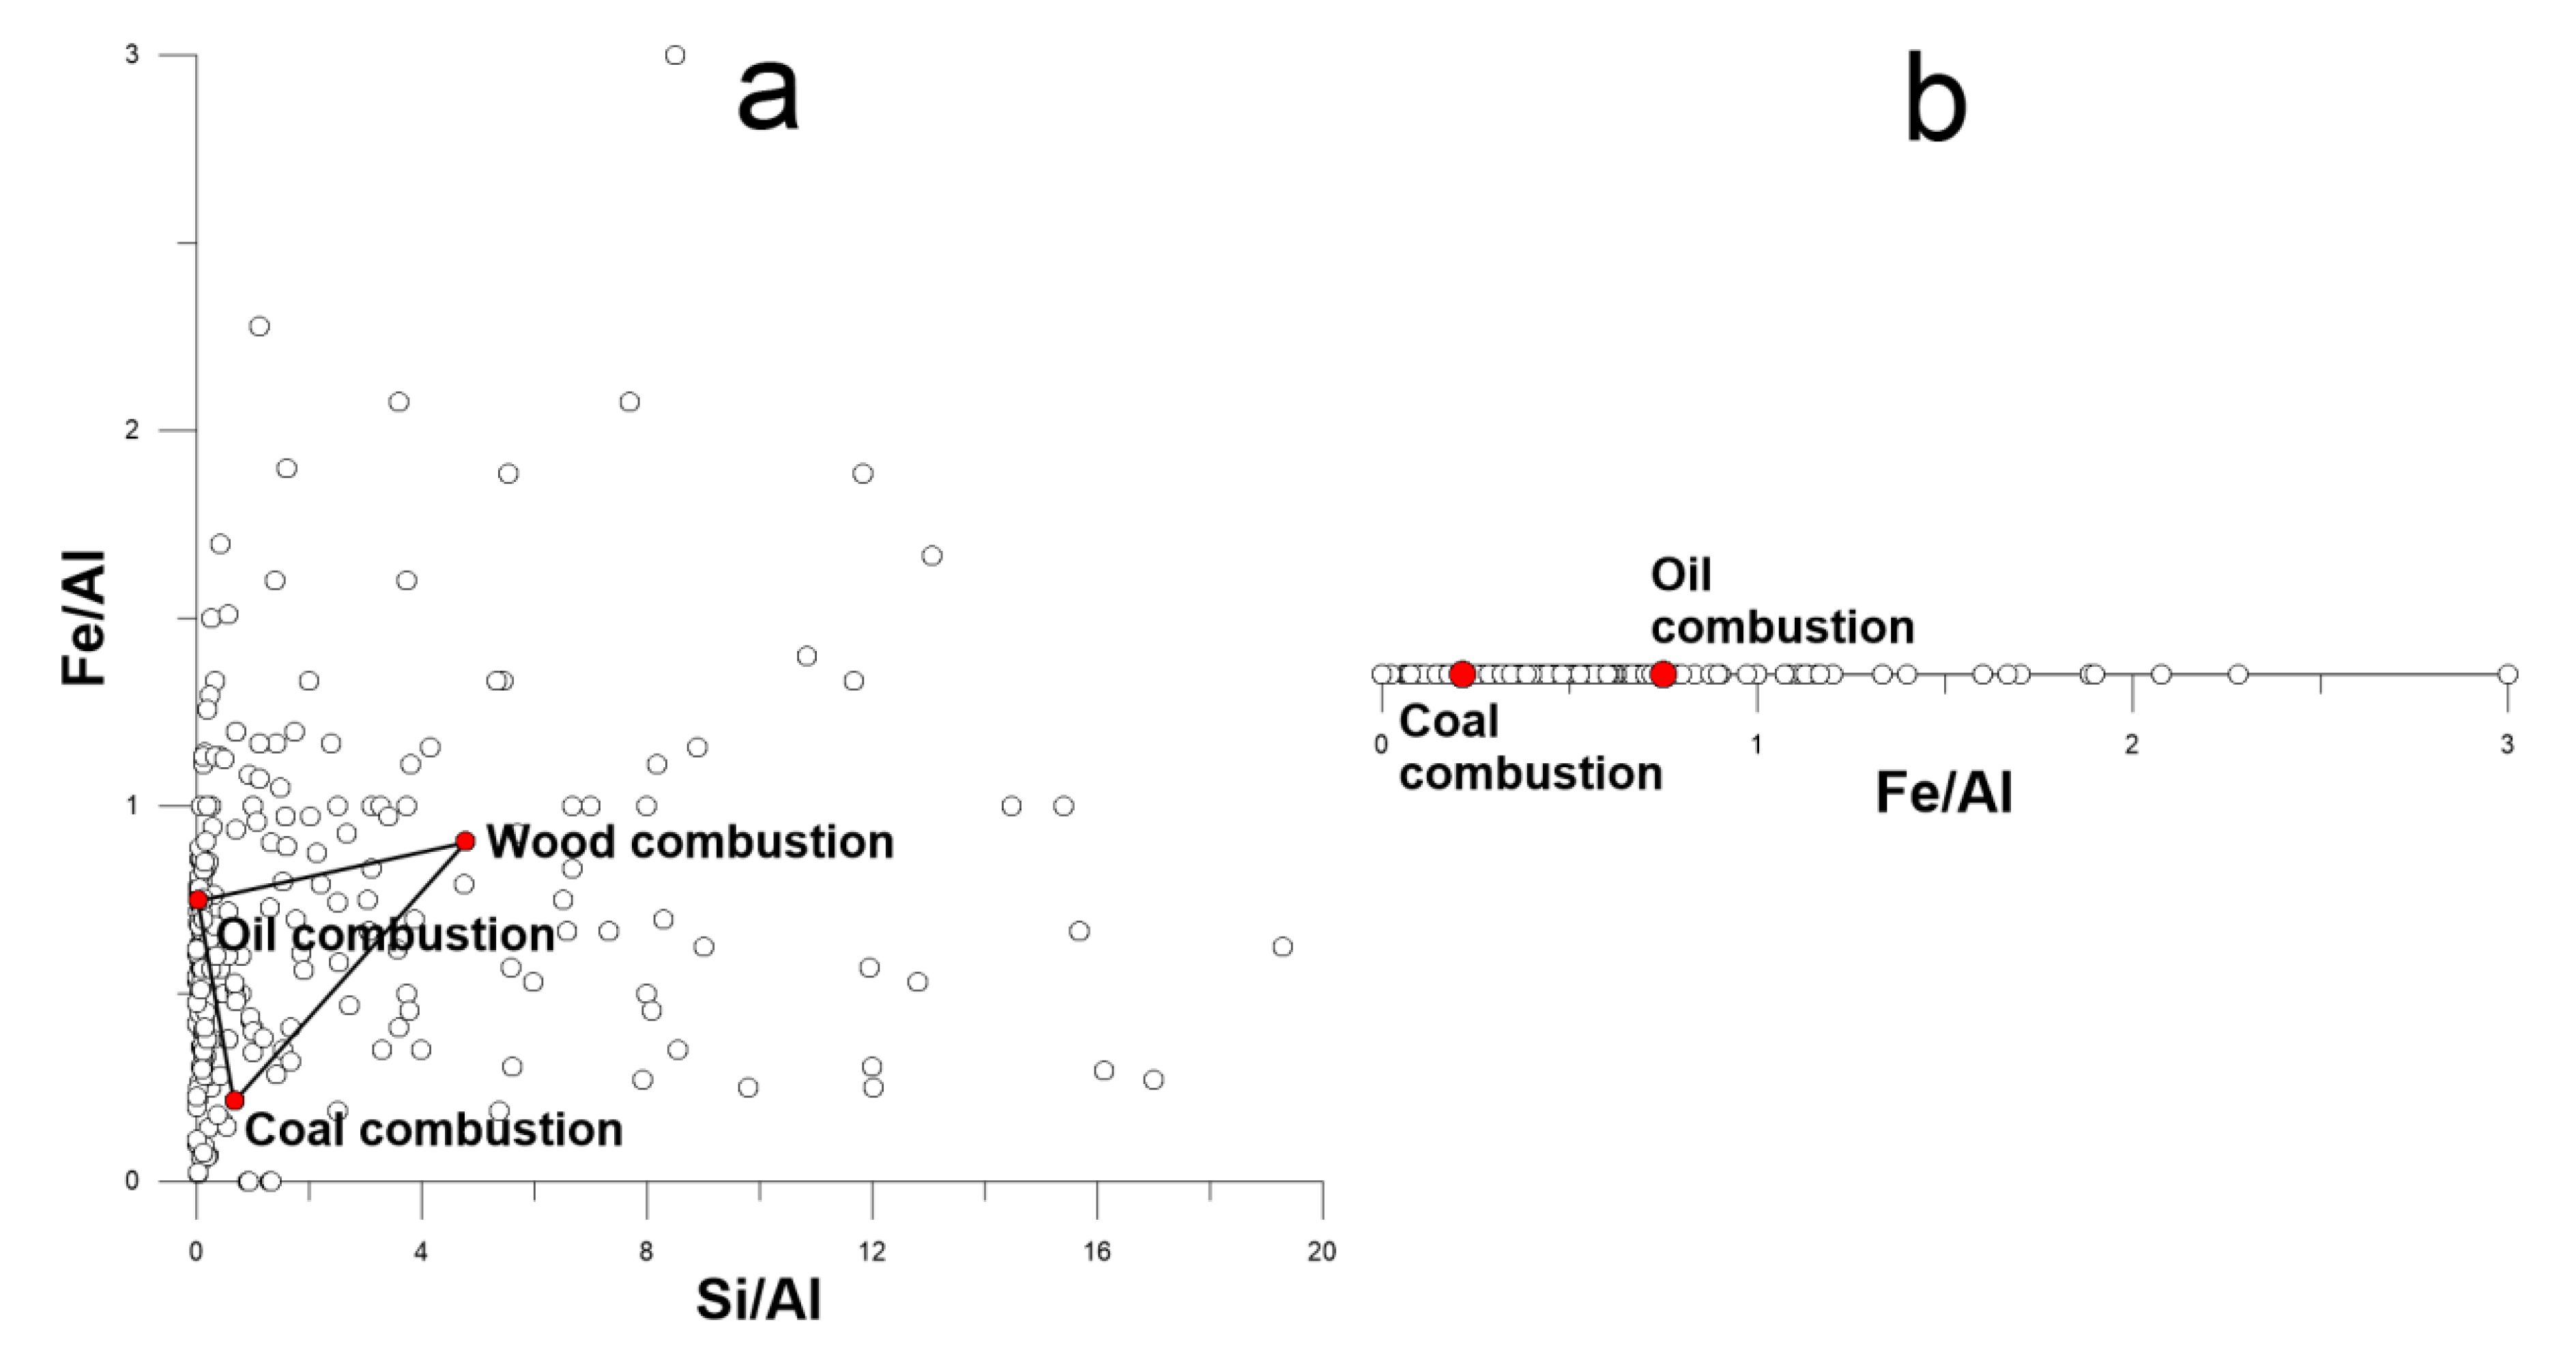
Thus, only three sources—namely, oil combustion, coal combustion, and wood combustion–were eligible for the three-component mixing model (Figure 6a). However, this does not mean that the sources which were not presented on mixing diagram did not influence the chemical composition of snow at all. The snow samples plotted above the “oil combustion” point along the Fe/Al axis probably contained steel rust (Figure 6a). The samples plotted to the right of the “wood combustion” point along the Si/Al axis were probably polluted with soil dust (aluminosilicates and quartz). The samples near the origin of the coordinates probably contained Al residuals emitted from aluminum plants or paper mills.
As can be seen from Figure 6a, the density of data points around the pollution sources decreases in the following order: oil combustion, coal combustion, wood combustion. At the same time, a substantial part of the snow sample points lay outside the mixing triangle. This probably means that the three-component mixing model does not adequately reflect the relative importance of pollution sources. It is very likely that wood combustion was a minor source, as it lies outside the array of data points, whereas oil combustion and coal combustion, which lay close to the array, were predominant sources. This is particularly so, as the number of data points between these two sources on the two-component mixing line (Figure 6b) was much higher than the number of data points inside the three-component mixing triangle.

3.4. Evaluation of Source Apportionment Results

To make sure that the two-component mixing model explained the relative importance of pollution sources more adequately than the three-component model, the source contributions to snow pollution were calculated and mapped. To understand the uncertainty of mapping, the combined uncertainty (U) in source contribution estimates for each sampling plot was evaluated. U was calculated using the uncertainties in element concentrations in snow samples obtained from all subplots:
U = u S i 2 + u A l   2 + u F e 2
where u S i 2 , u A l 2 , and u F e 2 are the squared uncertainties (standard deviations, σ) of the Si, Al, and Fe concentrations, respectively.
The standard deviations of mean Si, Al, and Fe concentrations in snow samples obtained from subplots varied in the ranges of 7–25%, 5–20%, and 8–25%, respectively. Thus, the obtained U values were in the range of 12–25% which makes the spatial distribution of source contributions distinguishable in most sampling locations.
Mapping the results of the three-component mixture resolution showed that the areas characterized by the highest contributions of oil combustion (Figure 7a) to air pollution occupied most of the surface of Lake Baikal. On the contrary, areas polluted with coal combustion (Figure 7b) and wood combustion (Figure 7c) residues were quite small and located away from densely populated areas. The map of source contributions calculated using two-component mixing equations shows a more reliable picture of the distribution of oil combustion (Figure 8a) and coal combustion (Figure 8b) residues.
Nevertheless, the contribution of coal combustion was much lower than expected, as coal is the most abundant heating fuel in the Lake Baikal watershed [8,79]. The low contribution of coal combustion was probably due to submicron and ultrafine soot particles, originated from multiple local point and nonpoint sources, of which diesel engines may be one.
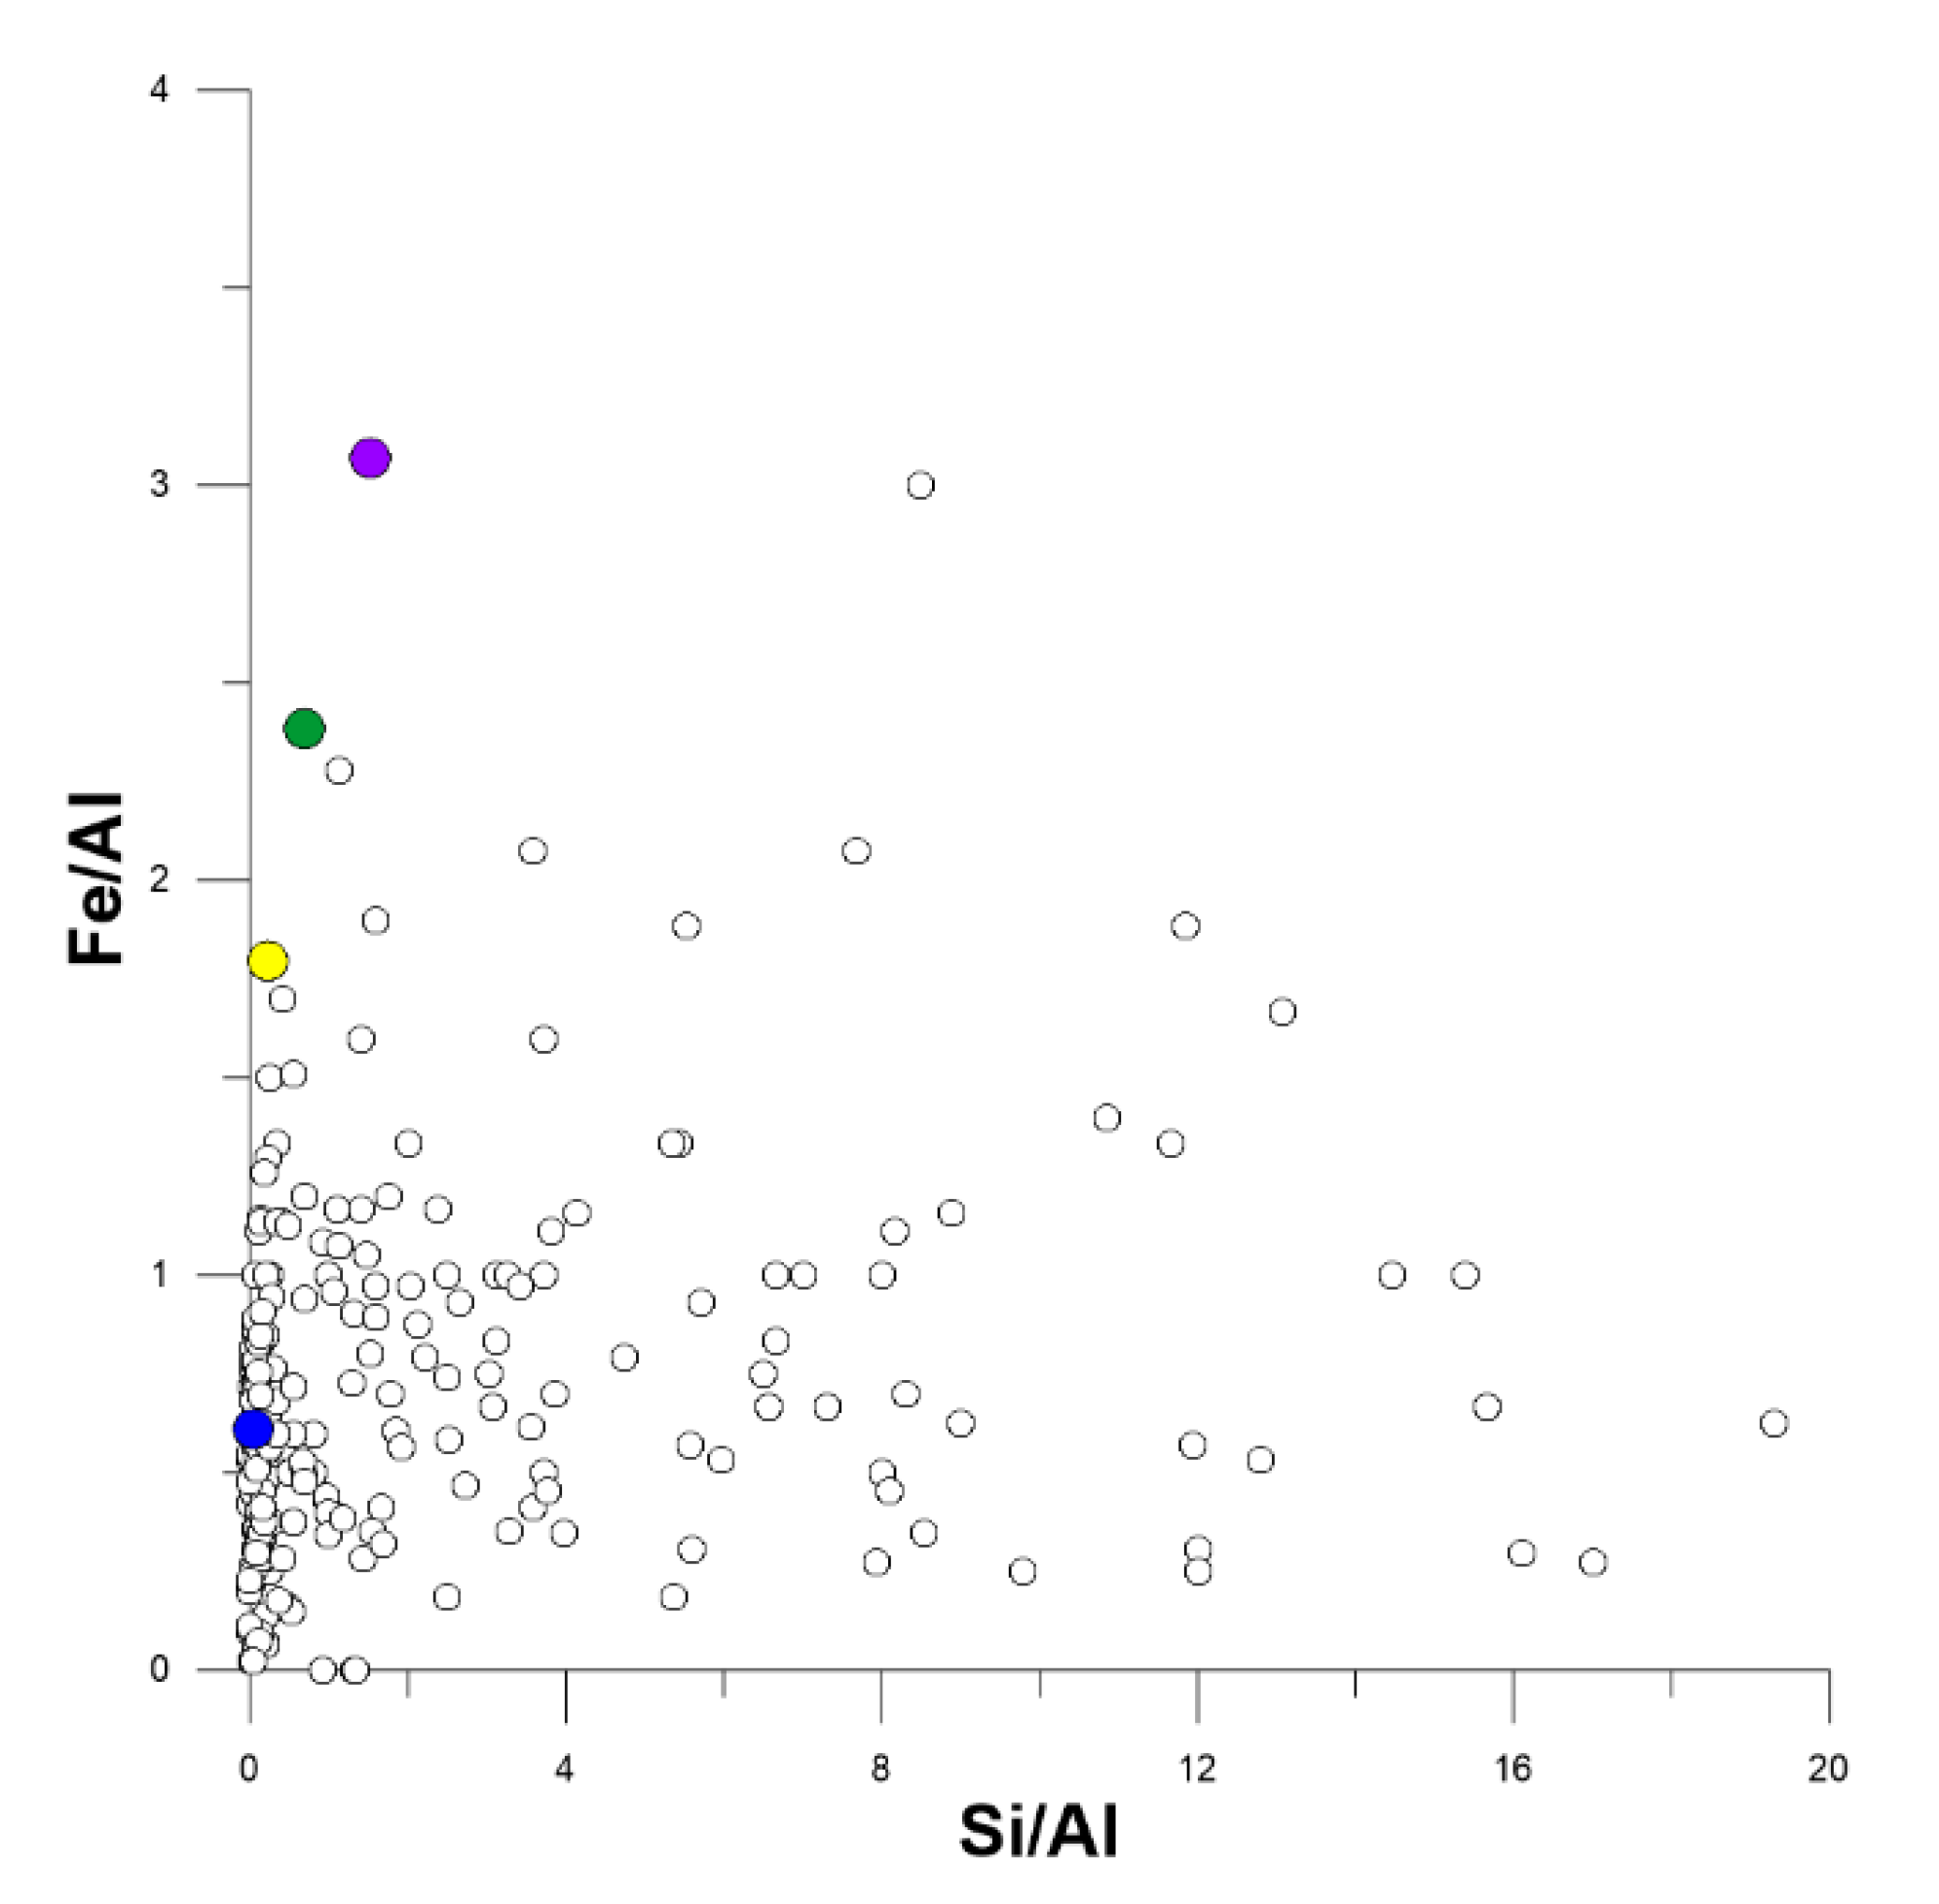
The elemental composition of products of diesel fuel combustion [80,81] is highly diverse (Figure 9). This diverse composition of combustion products is due to diverse fuel composition, combustion temperature, and degree of wear and tear of the engine incineration chambers. Nevertheless, all considered products were characterized by Si/Al and Fe/Al ratio values, enabling them to be the upper vertices of the mixing triangle (Figure 6a and Figure 10). The value of the Fe/Al ratio definitely depended on the age of the engine: the older the engine, the higher the relative concentration of aluminum and the lower the relative concentration of iron in particulate matter generated by engine. This can be due to the enhancement of friction of aluminum parts in the engine, such as pistons and cylinder barrels. However, it is more likely that the increase in Al/Fe ratio with engine age was due to wear and tear of exhaust treatment systems, as well as due to lowering the efficiency of oil combustion: the older the engine, the closer the chemical composition of the emitted soot was to that of crude oil. This is why the composition of soot from old heavy-duty diesel engine in Figure 9 was similar to that of fly oil ash emitted by an oil-fired boiler.
The replacement of “oil combustion” in Figure 6a with any of the “diesel engines” in Figure 10 resulted in a decrease in contribution of this source, as the distance between the array of data points and the corresponding angle of the mixing triangle was enlarged. However, despite the obviously overestimated contributions of oil combustion, it is premature to assert that diesel engines are the predominant pollution source in the area. Modern exhaust purification devices, such as diesel particulate filters and industrial scrubbers, make the particles emitted from different sources indistinguishable, from a chemical point of view.

4. Conclusions

The obtained results demonstrated the applicability of our approach, based on the chemical composition of snow being considered as a linear combination of emission source profiles and using the elements most abundant in the Earth’s crust as source tracers. Pollution sources were identified and grouped into categories according to their origin (natural or anthropogenic), industry group (energy production, metallurgy, etc.), and fuel type (oil, coal, or wood). Nevertheless, the number of sources for which contributions can be quantified using two tracer ratios (such as Si/Al and Fe/Al) is limited to three. Therefore, the Si/(Si+Al+Fe), Al/(Si+Al+Fe), and Fe/(Si+Al+Fe) ratios should be used as tracers to increase the number of sources to four. To quantify the contributions of a higher number of sources, additional tracer ratios calculated using the concentrations of the other elements most abundant in the Earth’s crust are necessary.
The Si/Al and Fe/Al ratio values used in this study to characterize types of pollution sources were similar to those reported in literature, which allowed the use of these values diagnostically, characteristic of the corresponding source types. Unfortunately, the Si/Al and Fe/Al ratios, as well as the concentration ratios of other elements most abundant in the Earth’s crust, can only be applied for source apportionment of natural and anthropogenic particulate matter in air and snow. Such ratios cannot be used to trace pollution sources of particulate matter in soil, water, or sediments, as the high natural concentrations of crustal elements in these environmental compartments mask the contributions of these elements from anthropogenic sources.
Mapping the source contributions and comparing the obtained maps with maps of settlement locations was recognized as an effective tool to validate the correctness of source identification. Nevertheless, to apportion sources more precisely, the obtained data set or sampling area should be divided into smaller pieces, as combinations of pollution sources are site-specific and may vary from place to place. Thus, the principles for delineation of areas affected by different source combinations should be the subject of further studies. Some uncertainty about minor source apportionment may also be due to atmospheric transport of pollution from distant sources. This may mean that Si/Al and Fe/Al ratios are suitable for tracing both local and regional sources.

Supplementary Materials

The following are available online at https://www.mdpi.com/2071-1050/12/8/3392/s1, Table S1. Chemical composition of snow meltwater.

Author Contributions

M.Y.S. designed the research, M.Y.S. and Y.M.S. analyzed the data, A.V.S. drew the sampling map, and L.A.B. performed the chemical analyses. All authors have read and agreed to the published version of the manuscript.

Funding

This work was supported by the Russian Academy of Sciences, Government contracts No. 0345-2019-0008 (АААА-А16-116122110065-4) and No. 0347-2019-0003 (АААА-А17-117041910172-4) (fieldwork), the Russian Fund of Basic Research, grants 17-29-05068, 20-45-380013 (chemical analyses and mapping) and 17-45-388054 (data analysis), and by the Government of Irkutsk Region.

Conflicts of Interest

The authors declare no conflict of interest.

References

  1. Watson, J.G.; Chen, L.W.A.; Chow, J.C.; Doraiswamy, P.; Lowenthal, D.H. Source apportionment: Findings from the U.S. supersites program. J. Air Waste Manag. Assoc. 2008, 58, 265–288. [Google Scholar] [CrossRef]
  2. Viana, M.; Kuhlbusch, T.A.J.; Querol, X.; Alastuey, A.; Harrison, R.M.; Hopke, P.K.; Winiwarter, W.; Vallius, M.; Szidat, S.; Prévôt, A.S.H.; et al. Source apportionment of particulate matter in Europe: A review of methods and results. J. Aerosol Sci. 2008, 39, 827–849. [Google Scholar] [CrossRef]
  3. Hopke, P.K. The application of receptor modeling to air quality data. Pollut. Atmos. 2010, 91–109. Available online: https://www.appa.asso.fr/wp-content/uploads/2020/02/Hopke_2010.pdf (accessed on 12 March 2020).
  4. Belis, C.A.; Karagulian, F.; Larsen, B.R.; Hopke, P.K. Critical review and meta-analysis of ambient particulate matter source apportionment using receptor models in Europe. Atmos. Environ. 2013, 69, 94–108. [Google Scholar] [CrossRef]
  5. Belis, C.A.; Larsen, B.; Amato, F.; El Haddad, I.; Favez, O.; Harrison, R.; Hopke, P.; Nava, S.; Paatero, P.; Prevot, A.; et al. European Guide on Air Pollution Source Apportionment with Receptor Models; JRC Reference Report EUR 26080 EN; Publications Office of the European Union: Luxembourg, 2014; ISBN 978-92-79-32513-7. [Google Scholar] [CrossRef]
  6. Belis, C.A.; Favez, O.; Mircea, M.; Diapouli, E.; Manousakas, M.-I.; Vratolis, S.; Gilardoni, S.; Paglione, M.; Decesari, S.; Mocnik, G.; et al. European Guide on Air Pollution Source Apportionment with Receptor Models–Revised Version 2019; EUR 29816 EN; Publications Office of the European Union: Luxembourg, 2019; ISBN 978-92-76-09001-4. [Google Scholar] [CrossRef]
  7. Aloyan, A.E.; Arutyunyan, V.O.; Yermakov, A.N.; Zagaynov, V.A.; Mensink, C.; De Ridder, K.; Van de Vel, K.; Deutsch, F. Modeling the regional dynamics of gaseous admixtures and aerosols in the areas of lake baikal (Russia) and antwerp (Belgium). Aerosol Air Qual. Res. 2012, 12, 707–721. [Google Scholar] [CrossRef] [Green Version]
  8. Obolkin, V.A.; Potemkin, V.L.; Makukhin, V.L.; Khodzher, T.V.; Chipanina, E.V. Long-range transport of plumes of atmospheric emissions from regional coal power plants to the South Baikal water basin. Atmos. Ocean. Opt. 2017, 30, 360–365. [Google Scholar] [CrossRef]
  9. Khodzher, T.V.; Zhamsueva, G.S.; Zayakhanov, A.S.; Dementeva, A.L.; Tsydypov, V.V.; Balin, Y.S.; Penner, I.E.; Kokhanenko, G.P.; Nasonov, S.V.; Klemasheva, M.G.; et al. Ship-based studies of aerosol-gas admixtures over lake baikal basin in summer 2018. Atmos. Ocean. Opt. 2019, 32, 434–441. [Google Scholar] [CrossRef]
  10. Belozertseva, I.A.; Vorobyeva, I.B.; Vlasova, N.V.; Lopatina, D.N.; Yanchuk, M.S. Snow pollution in Lake Baikal water area in nearby land areas. Water Res. 2017, 44, 471–484. [Google Scholar] [CrossRef]
  11. Belozertseva, I.A.; Vorobyeva, I.B.; Vlasova, N.V.; Janchuk, M.S.; Lopatina, D.N. Chemical composition of snow water of the water area of the southern hollow of Lake Baikal. Int. J. Appl. Fundam. Res. 2016, 10, 263–272. (In Russian) [Google Scholar]
  12. Belozertseva, I.A.; Vorobeva, I.B.; Vlasova, N.V.; Yanchuk, M.S.; Lopatina, D.N. Pollution of snow on the water area of the average hollow of Lake Baikal and the adjacent territory. Adv. Curr. Nat. Sci. 2016, 11, 96–105. (In Russian) [Google Scholar]
  13. Belozertseva, I.A.; Vorobeva, I.B.; Vlasova, N.V.; Yanchuk, M.S.; Lopatina, D.N. Pollution of snow on the water area of the northern hollow of Lake Baikal and the adjacent territory. Adv. Curr. Nat. Sci. 2016, 9, 97–103. (In Russian) [Google Scholar]
  14. Netsvetaeva, O.G.; Golobokova, L.P.; Obolkin, V.A.; Khodzher, T.V. Multiyear research of atmospheric deposition: Case study at the Listvyanka monitoring station (Southern Pribaikalye. Russia). Proc. SPIE 2018, 10833, 108333T. [Google Scholar] [CrossRef]
  15. Onishchuk, N.A.; Netsvetaeva, O.G.; Khodzher, T.V. The heavy metal content in precipitation at air monitoring sites Irkutsk and Listvyanka (Baikal Region. Russia). Proc. SPIE 2019, 11208, 112083I. [Google Scholar] [CrossRef]
  16. Yunker, M.B.; Macdonald, R.W. Composition and origins of polycyclic aromatic hydrocarbons in the Mackenzie River and on the Beaufort Sea shelf. Arctic 1995, 48, 118–129. [Google Scholar] [CrossRef]
  17. Zhou, F.; Guo, H.; Liu, L. Quantitative identification and source apportionment of anthropogenic heavy metals in marine sediment of Hong Kong. Environ. Geol. 2007, 53, 295. [Google Scholar] [CrossRef]
  18. Li, Y.; Gao, H.; Mo, L.; Kong, Y.; Lou, I. Quantitative assessment and source apportionment of metal pollution in soil along Chao River. Desalin. Water Treat. 2013, 51, 4010–4018. [Google Scholar] [CrossRef]
  19. Liu, Y.; Chen, L.; Huang, Q.H.; Li, W.Y.; Tang, Y.J.; Zhao, J.F. Source apportionment of polycyclic aromatic hydrocarbons (PAHs) in surface sediments of the Huangpu River. Shanghai. China. Sci. Total Environ. 2009, 407, 2931–2938. [Google Scholar] [CrossRef]
  20. Jin, Y.; O’Connor, D.; Ok, Y.S.; Tsang, D.C.W.; Liu, A.; Hou, D. Assessment of sources of heavy metals in soil and dust at children’s playgrounds in Beijing using GIS and multivariate statistical analysis. Environ. Int. 2019, 124, 320–328. [Google Scholar] [CrossRef]
  21. Shen, F.; Mao, L.; Sun, R.; Du, J.; Tan, Z.; Ding, M. Contamination evaluation and source identification of heavy metals in the sediments from the Lishui River Watershed. Southern China. Int. J. Environ. Res. Public Health 2019, 16, 336. [Google Scholar] [CrossRef] [PubMed] [Green Version]
  22. Chen, H.Y.; Teng, Y.G.; Wang, J.S. Source apportionment of polycyclic aromatic hydrocarbons (PAHs) in surface sediments of the Rizhao coastal area (China) using diagnostic ratios and factor analysis with nonnegative constraints. Sci. Total Environ. 2012, 414, 293–300. [Google Scholar] [CrossRef]
  23. Guan, Q.; Wang, F.; Xu, C.; Pan, N.; Lin, J.; Zhao, R.; Yang, Y.; Luo, H. Source apportionment of heavy metals in agricultural soil based on PMF: A case study in Hexi Corridor. Northwest China. Chemosphere 2018, 193, 189–197. [Google Scholar] [CrossRef]
  24. Hu, N.J.; Huang, P.; Liu, J.H.; Ma, D.Y.; Shi, H.F.; Mao, J.; Liu, Y. Characterization and source apportionment of polycyclic aromatic hydrocarbons (PAHs) in sediments in the Yellow River Estuary. China. Environ. Earth Sci. 2014, 71, 873–883. [Google Scholar] [CrossRef]
  25. Larsen, R.K.; Baker, J.E. Source apportionment of polycyclic aromatic hydrocarbons in the urban atmosphere: A comparison of three methods. Environ. Sci. Technol. 2003, 37, 1873–1881. [Google Scholar] [CrossRef]
  26. Cai, K.; Li, C. Street dust heavy metal pollution source apportionment and sustainable management in a typical city—Shijiazhuang China. Int. J. Environ. Res. Public Health 2019, 16, 2625. [Google Scholar] [CrossRef] [Green Version]
  27. Song, Y.; Li, H.; Li, J.; Mao, C.; Ji, J.; Yuan, X.; Li, T.; Ayoko, G.A.; Frost, R.L.; Feng, Y. Multivariate linear regression model for source apportionment and health risk assessment of heavy metals from different environmental media. Ecotoxicol. Environ. Saf. 2018, 165, 555–563. [Google Scholar] [CrossRef]
  28. Henry, R.C. Multivariate receptor modeling by N-dimensional edge detection. Chemom. Intell. Lab. Syst. 2003, 65, 179–189. [Google Scholar] [CrossRef]
  29. Semenov, M.Y.; Marinaite, I.I.; Bashenkhaeva, N.V.; Zhuchenko, N.A.; Khuriganova, O.I.; Molozhnikova, E.V. Polycyclic aromatic hydrocarbons in a small eastern siberian river: Sources. delivery pathways and behavior. Environ. Earth Sci. 2016, 75, 1–12. [Google Scholar] [CrossRef]
  30. Khalili, N.R.; Scheff, P.A.; Holsen, T.M. PAH source fingerprints for coke ovens, diesel and, gasoline engines, highway tunnels, and wood combustion emissions. Atmos. Environ. 1995, 29, 533–542. [Google Scholar] [CrossRef]
  31. Watson, J.G.; Robinson, N.F.; Chow, J.C.; Henry, R.C.; Kim, B.M.; Pace, T.G.; Meyer, E.L.; Nguyen, Q. The USEPA/DRI chemical mass balance receptor model. Environ. Softw. 1990, 5, 38–49. [Google Scholar] [CrossRef]
  32. Demir, S.; Saral, A. A new modification to the chemical mass balance receptor model for volatile organic compound source apportionment. Clean-Soil Air Water 2011, 39, 891–899. [Google Scholar] [CrossRef]
  33. Wang, G.A.Y.; Jiang, H.; Fu, Q.; Zheng, B. Modeling the source contribution of heavy metals in surficial sediment and analysis of their historical changes in the vertical sediments of a drinking water reservoir. J. Hydrol. 2015, 520, 37–51. [Google Scholar] [CrossRef]
  34. Pipalatkar, P.; Khaparde, V.V.; Gajghate, D.G.; Bawase, M.A. Source apportionment of PM2.5 using a CMB model for a centrally located Indian city. Aerosol Air Qual. Res. 2014, 14, 1089–1099. [Google Scholar] [CrossRef] [Green Version]
  35. Hopke, P.K. Theory and application of atmospheric source apportionment. In Air Quality and Ecological Impacts: Relating Sources to Effects; Allan, H.L., Ed.; Elsevier: Amsterdam, The Netherlands, 2009; pp. 1–33. [Google Scholar]
  36. Robinson, A.L.; Donahue, N.M.; Rogge, W.F. Photochemical oxidation and changes in molecular composition of organic aerosol in the regional context. J. Geophys. Res. 2006, 111. [Google Scholar] [CrossRef] [Green Version]
  37. Kastner, M.; Breuer-Jammali, M.; Mahro, B. Enumeration and characterization of the soil microflora from hydrocarbon-contaminated soil sites able to mineralize polycyclic aromatic hydrocarbons (PAH). Appl. Microbiol. Biotechnol. 1995, 41, 267–273. [Google Scholar] [CrossRef]
  38. Guthrie, E.A.; Pfaender, F.K. Reduced pyrene bioavailability in microbially active soils. Environ. Sci. Technol. 1998, 32, 501–508. [Google Scholar] [CrossRef]
  39. Wang, C.Y.; Gao, X.L.; Sun, Z.G.; Qin, Z.J.; Yin, X.N.; He, S.J. Evaluation of the diagnostic ratios for the identification of spilled oils after biodegradation. Environ. Earth Sci. 2013, 68, 917–926. [Google Scholar] [CrossRef] [Green Version]
  40. Tsapakis, M.; Stephanou, E.G. Collection of gas and particle semi-volatile organic compounds: Use of an oxidant denuder to minimize polycyclic aromatic hydrocarbons degradation during high-volume air sampling. Atmos. Environ. 2003, 37, 4935–4944. [Google Scholar] [CrossRef]
  41. Ravindra, K.; Sokhi, R.; Van Grieken, R. Atmospheric polycyclic aromatic hydrocarbons: Source attribution. emission factors and regulation. Atmos. Environ. 2008, 42, 2895–2921. [Google Scholar] [CrossRef] [Green Version]
  42. Tobiszewski, M.; Namiesnik, J. PAH diagnostic ratios for the identification of pollution emission sources. Environ. Pollut. 2012, 162, 110–119. [Google Scholar] [CrossRef]
  43. Semenov, M.Y.; Marinaite, I.I.; Golobokova, L.P.; Khuriganova, O.I.; Khodzher, T.V.; Semenov, Y.M. Source apportionment of polycyclic aromatic hydrocarbons in Lake Baikal water and adjacent air layer. Chem. Ecol. 2017, 33, 977–990. [Google Scholar] [CrossRef]
  44. Semenov, M.; Marinaite, I.; Zhuchenko, N.; Silaev, A.; Vershinin, K.; Semenov, Y. Revealing the factors affecting occurrence and distribution of polycyclic aromatic hydrocarbons in water and sediments of Lake Baikal and its tributaries. Chem. Ecol. 2018, 34, 901–916. [Google Scholar] [CrossRef]
  45. Christensen, E.R.; Li, A.; Ab Razak, I.A.; Rachdawong, P.; Karls, J.F. Sources of polycyclic aromatic hydrocarbons in sediments of the Kinnickinnic River. Wisconsin. J. Gt. Lakes Res. 1997, 23, 61–73. [Google Scholar] [CrossRef]
  46. Turnlund, J.R. The use of stable isotopes in mineral nutrition research. J. Nutr. 1989, 119, 7–14. [Google Scholar] [CrossRef]
  47. Hogan, J.F.; Blum, J.D. Tracing hydrologic flow paths in a small forested watershed using variations in (87)Sr(/8)6Sr. [Ca]/[Sr]. [Ba]/[Sr] and delta O-18. Water Resour. Res. 2003, 39, 1282. [Google Scholar] [CrossRef] [Green Version]
  48. Xue, D.; Botte, J.; De Baets, B.; Accoe, F.; Nestler, A.; Taylor, P.; Van Cleemput, O.; Berglund, M.; Boeckx, P. Present limitations and future prospects of stable isotope methods for nitrate source identification in surface- and groundwater. Water Res. 2009, 43, 1159–1170. [Google Scholar] [CrossRef] [PubMed]
  49. Brownlow, R.; Lowry, D.; Fisher, R.E.; France, J.L.; Lanoisellé, M.; White, B.; Nisbet, E.G. Isotopic ratios of tropical methane emissions by atmospheric measurement. Glob. Biogeochem. Cycles 2017, 31, 1408–1419. [Google Scholar] [CrossRef] [Green Version]
  50. Glibert, P.M.; Middelburg, J.J.; McClelland, J.W.; Vander Zanden, J.M. Stable isotope tracers: Enriching our perspectives and questions on sources. fates. rates. and pathways of major elements in aquatic systems. Limnol. Oceanogr. 2019, 64, 950–981. [Google Scholar] [CrossRef] [Green Version]
  51. Jung, H.; Koh, D.C.; Kim, Y.S.; Jeen, S.W.; Lee, J. Stable isotopes of water and nitrate for the identification of groundwater flowpaths: A review. Water 2020, 12, 138. [Google Scholar] [CrossRef] [Green Version]
  52. Cicchella, D.; De Vivo, B.; Lima, A.; Albanese, S.; McGill, R.A.R.; Parrish, R.R. Heavy metal pollution and Pb isotopes in urban soils of Napoli. Italy. Geochem. Explor. Environ. Anal. 2008, 8, 103–112. [Google Scholar] [CrossRef] [Green Version]
  53. Nazarpour, A.; Watts, M.J.; Madhani, A.; Elahi, S. Source. Spatial distribution and pollution assessment of Pb. Zn. Cu. and Pb. Isotopes in urban soils of Ahvaz city. A semi-arid metropolis in southwest Iran. Sci. Rep. 2019, 9, 5349. [Google Scholar] [CrossRef]
  54. Das, A.; Krishna, K.V.S.S.; Kumar, R.M.; Saha, C.; Sengupta, S.; Ghosh, J.G. Lead isotopic ratios in source apportionment of heavy metals in the street dust of Kolkata, India. Environ. Sci. Technol. 2018, 15, 159. [Google Scholar] [CrossRef]
  55. Vecchia, A.M.D.; de Lena, J.C.; Ladeira, A.C.Q. Application of multivariate statistic of U. Th and Pb concentrations and Pb isotopic signatures in the assessment of geogenic and anthropogenic sources in a U-mineralized area. J. Geosci. Environ. Prot. 2019, 7, 1–12. [Google Scholar] [CrossRef] [Green Version]
  56. Ault, W.U.; Senechal, R.G.; Erlebach, W.E. Isotopic composition as a natural tracer of lead in the environment. Environ. Sci. Technol. 1970, 4, 305–313. [Google Scholar] [CrossRef]
  57. Christophersen, N.; Neal, C.; Hooper, R.P.; Vogt, R.D.; Andersen, S. Modelling streamwater chemistry as a mixture of soil water end-members - a step towards second-generation acidification models. J. Hydrol. 1990, 116, 307–320. [Google Scholar] [CrossRef]
  58. Kokunov, V.L. The dependence of qualitative and technological characteristics of coals from Ircha-Borodinskoye deposit of Kansk-Achinsk basin on their petrologic composition. Bull. Tomsk Polytech. Inst. 1971, 177, 108–113. (In Russian) [Google Scholar]
  59. Bogdanov, A.V.; Shatrova, A.S.; Tyukalova, O.V.; Shkrabo, A.I. An environmentally-friendly technology for the processing of accumulated colloidal sludge-lignin precipitates in the Baikalsk pulp and paper mill. Izv. Vuzov. Prikl. Khimiya Biotekhnol. [Proc. Univ. Appl. Chem. Biotechnol.] 2018, 8, 126–134. (In Russian) [Google Scholar] [CrossRef]
  60. Krylov, D.A. Heavy metals in fly ash of TES. Evergy Econ. Tech. Ecol. 2010, 4, 44–50. (In Russian) [Google Scholar]
  61. Sorokina, I.D.; Dresvyannikov, A.F. Synthesis and assessment of using iron-aluminum coagulant for water purification. Bull. Kazan Technol. Univ. 2009, 4, 146–158. (In Russian) [Google Scholar]
  62. Nikitin, A.N.; Ermakova, E.V. Sludge wastes from fuel-fired power plants—Sources of air pollution and potential resources of mineral commodities. Bull. TulGU. Phys. Sect. 2006, 6, 96–111. [Google Scholar]
  63. Filimonova, L.M.; Parshin, A.V.; Bychinskii, V.A. Air pollution assessment in the area of aluminum production by snow geochemical survey. Russ. Meteorol. Hydrol. 2015, 40, 691–698. (In Russian) [Google Scholar] [CrossRef]
  64. Kaiser, H.F. The application of electronic computers to factor analysis. Educ. Psychol. Meas. 1960, 20, 141–151. [Google Scholar] [CrossRef]
  65. Liu, F.; Williams, M.; Caine, N. Source waters and flow paths in a seasonally snow-covered catchment, Colorado Front Range, USA. Water Resour. Res. 2004, 40. [Google Scholar] [CrossRef] [Green Version]
  66. Ahmad, I.; Khan, R.; Ishaq, M.; Khan, H.; Ismail, M.; Gul, K.; Ahmad, W. Catalytic pyrolysis of used engine oil over coal ash into fuel-like products. Energy Fuels 2016, 30, 204–218. [Google Scholar] [CrossRef]
  67. Li, F.; Fang, Y. Ash fusion characteristics of a high aluminum coal and its modification. Energy Fuels 2016, 30, 2925–2931. [Google Scholar] [CrossRef]
  68. Al-Degs, Y.S.; Ghrir, A.; Khoury, H.; Walker, G.M.; Sunjuk, M.; Al-Ghouti, M.A. Characterization and utilization of fly ash of heavy fuel oil generated in power stations. Fuel Process. Technol. 2014, 123, 41–46. [Google Scholar] [CrossRef]
  69. Aslam, Z.; Hussein, I.A.; Shawabkeh, R.A.; Parvez, M.A.; Ihsanullah, A.W. Adsorption kinetics and modeling of H2S by treated waste oil fly ash. J. Air Waste Manag. 2019, 69, 246–257. [Google Scholar] [CrossRef]
  70. Al-Malack, M.H.; Abdullah, G.M.; Al-Amoudi, O.S.B.; Bukhari, A.A. Stabilization of indigenous Saudi Arabian soils using fuel oil flyash. J. King Saud Univ. Eng. Sci. 2016, 28, 165–173. [Google Scholar] [CrossRef] [Green Version]
  71. Pitman, R.M. Wood ash use in forestry–A review of the environmental impacts. For. Int. J. For. Res. 2006, 79, 563–588. [Google Scholar] [CrossRef] [Green Version]
  72. Kalembkiewicz, J.; Galas, D.; Sitarz-Palczak, E. The physicochemical properties and composition of biomass ash and evaluating directions of its applications. Pol. J. Environ. Stud. 2018, 27, 2593–2603. [Google Scholar] [CrossRef]
  73. Van Ryssen, J.B.J.; Ndlovu, H. Wood ash in livestock nutrition: 1. Factors affecting the mineral composition of wood ash. Appl. Anim. Husb. Rural Dev. 2018, 11, 53–61. [Google Scholar]
  74. Kvande, H.; Drablos, P.A. The aluminum smelting process and innovative alternative technologies. J. Occup. Environ. Med. 2014, 56, 23–32. [Google Scholar] [CrossRef] [PubMed] [Green Version]
  75. Aarhaug, T.A.; Ratvik, A.P. Aluminium primary production off-gas composition and emissions: An overview. JOM 2019, 71, 2966–2977. [Google Scholar] [CrossRef] [Green Version]
  76. Jeong, G.Y.; Kim, J.Y.; Seo, J.; Kim, G.M.; Jin, H.C.; Chun, Y. Long-range transport of giant particles in Asian dust identified by physical, mineralogical, and meteorological analysis. Atmos. Chem. Phys. 2014, 14, 505–521. [Google Scholar] [CrossRef] [Green Version]
  77. Jeong, G.Y. Mineralogy and geochemistry of Asian dust: Dependence on migration path, fractionation, and reactions with polluted air. Atoms. Chem. Phys. 2020. [Google Scholar] [CrossRef] [Green Version]
  78. Sha, Y.; Shi, Z.; Liu, X.; An, Z. Distinct impacts of the Mongolian and Tibetan Plateaus on the evolution of the East Asian monsoon. J. Geophys. Res. Atmos. 2015, 120, 4764–4782. [Google Scholar] [CrossRef]
  79. Saneev, B.G.; Ivanova, I.; Maisyuk, E.P.; Tuguzova, T.F.; Ivanov, R.A. Energeticheskaya infrastructura tsentralnoy ecologicheskoy zony Baikalskoi prirodnoy territorii: Vozdeystviye na prirodnuyu sredu i puti ego snizheniya [The power generation infrastructure in the central ecological zone of the Baikal natural territory: The environmental impact and ways to mitigate it]. Geogr. Nat. Res. 2016, 5, 218–224. (In Russian) [Google Scholar]
  80. Popovicheva, O.B.; Kireeva, E.D.; Steiner, S.; Rothen-Rutishauser, B.; Persiantseva, N.M.; Timofeev, M.A.; Shonija, N.K.; Comte, P.; Czerwinski, J. Microstructure and chemical composition of diesel and biodiesel particle exhaust. Aerosol Air Qual. Res. 2014, 14, 1392–1401. [Google Scholar] [CrossRef]
  81. Bagi, S.; Sharma, V.; Patel, M.; Aswath, P.B. Effects of diesel soot composition and accumulated vehicle mileage on soot oxidation characteristics. Energy Fuels 2016, 30, 8479–8490. [Google Scholar] [CrossRef]
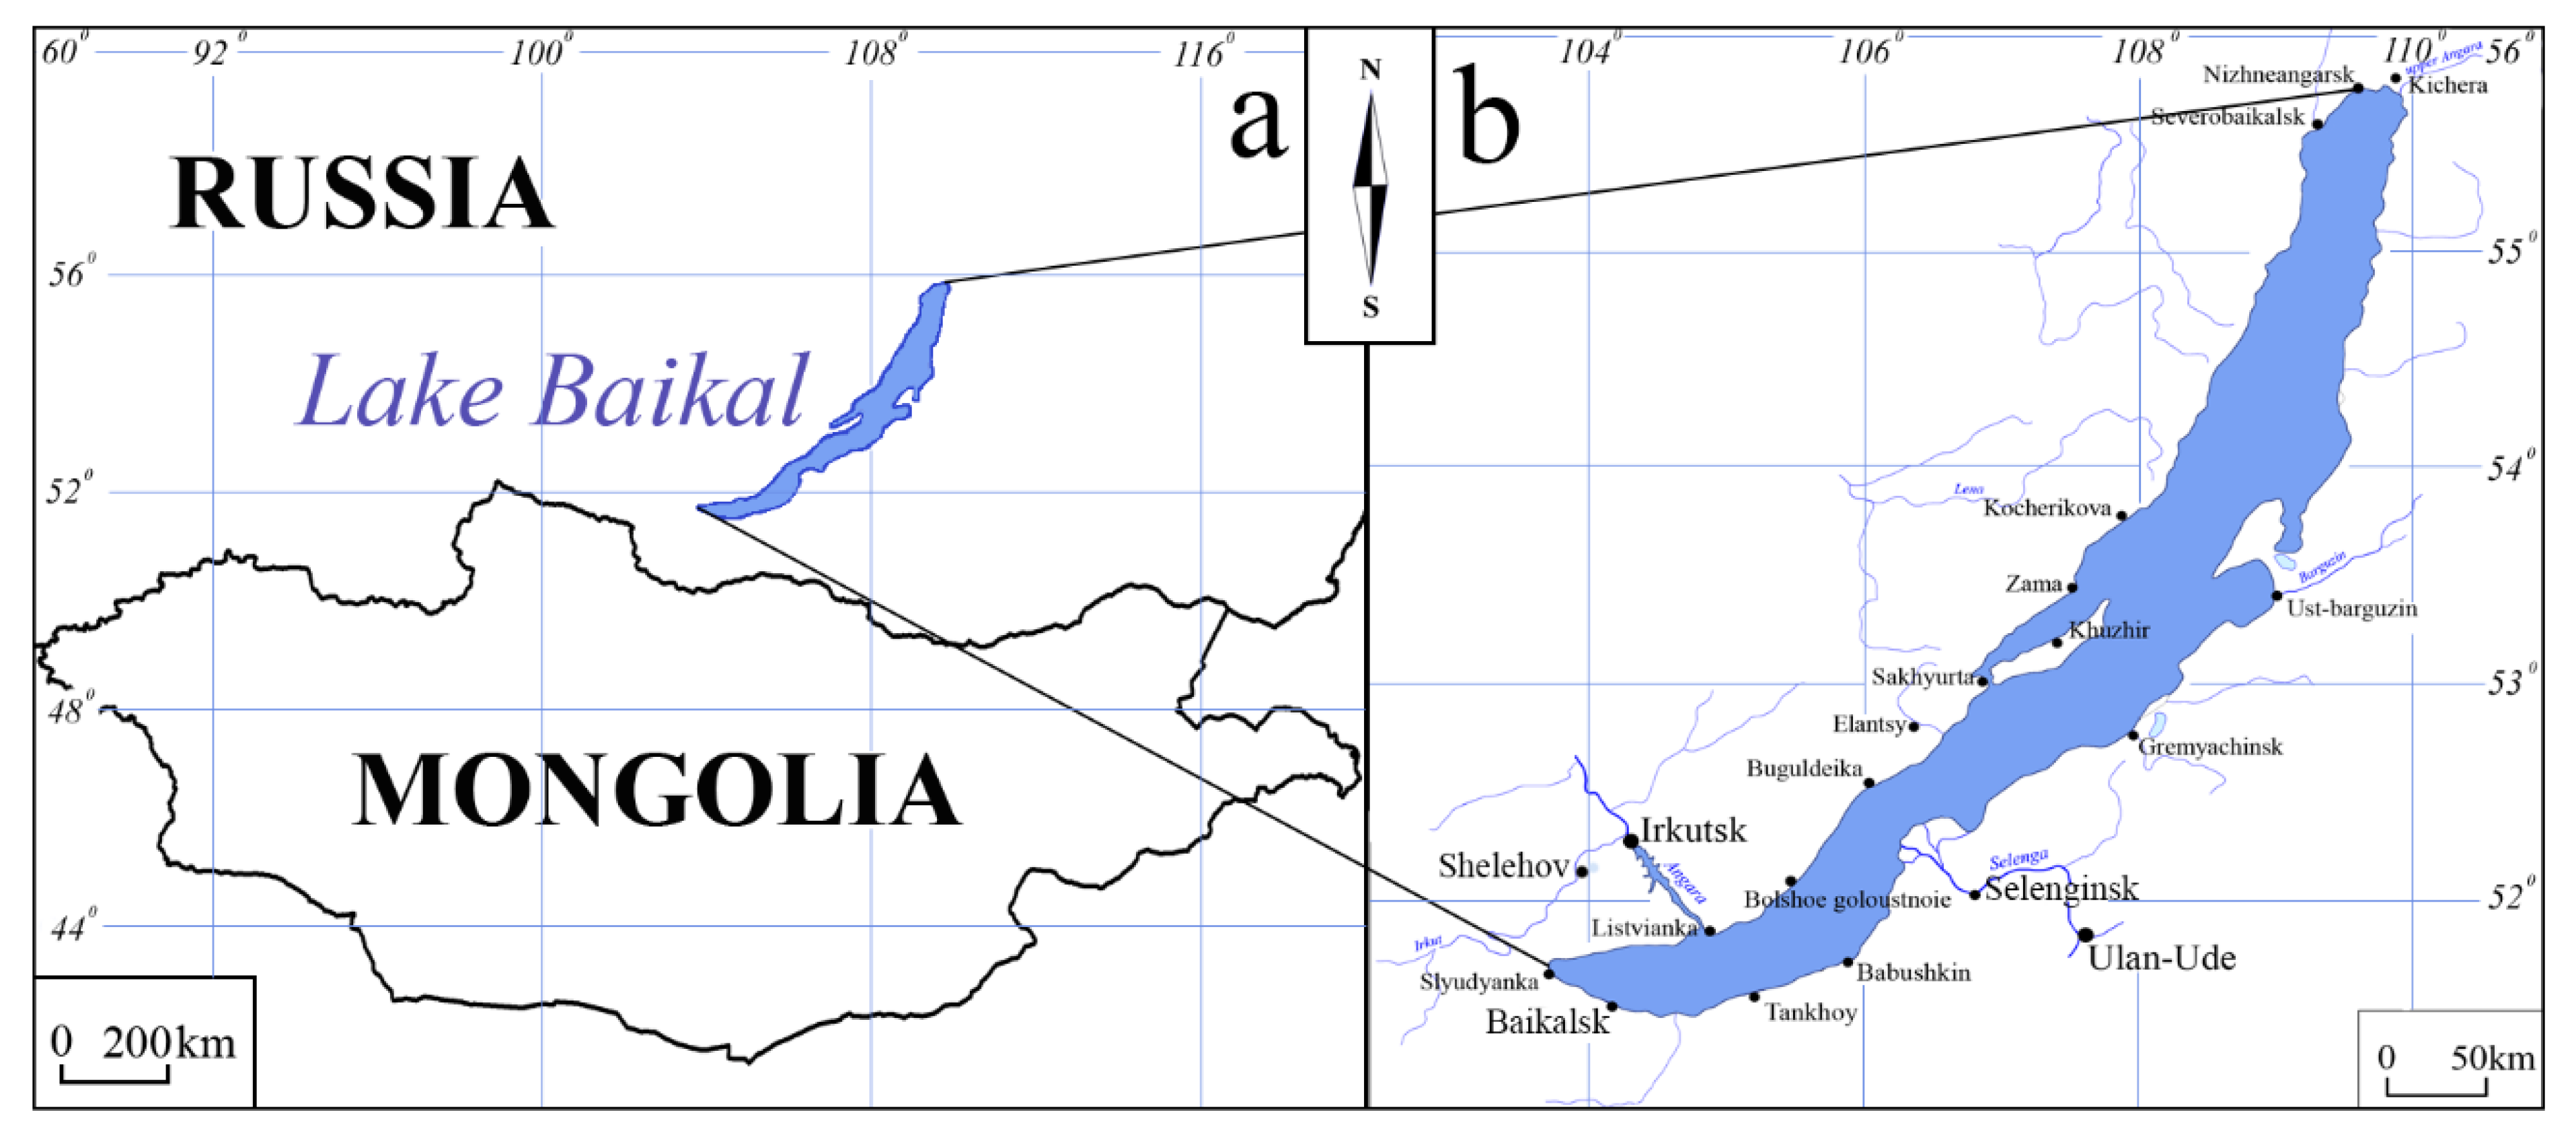
Figure 1. (a) The location of Lake Baikal on the Eurasian continent and (b) locations of settlements in the vicinity of the lake characterized by highest economic activity.
Sustainability 12 03392 g001
Figure 2. Map of winter winds at Lake Baikal.
Sustainability 12 03392 g002
Figure 3. Map of sampling locations (gray dots).
Sustainability 12 03392 g003
Figure 4. Principal components (PCs) governing the variability of elemental composition in snow.
Sustainability 12 03392 g004
Figure 5. Elemental fractional composition of snow meltwater samples and local particulate matter including source emissions; empty circles are snow samples, red circles are emission sources, and the red line delineates the samples with composition inherited from certain particle types [58,59,60,61,62,63].
Sustainability 12 03392 g005
Figure 6. Diagrams illustrating the mixing of pollutants from three (a) and two (b) emission sources; empty circles are snow samples, red circles are emission sources.
Sustainability 12 03392 g006
Figure 7. Spatial distribution of oil combustion (a), coal combustion (b), and wood combustion (c) contributions to pollution of Lake Baikal snowpack calculated using three-component mixing equations.
Sustainability 12 03392 g007
Figure 8. Spatial distribution of oil combustion (a) and coal combustion (b) contributions to pollution of Lake Baikal snowpack calculated using two-component mixing equations.
Sustainability 12 03392 g008
Figure 9. Elemental fractional composition of particulate matter from different fuel oil combustion sources [80,81]; LDDE is light duty diesel engine, HDDE is heavy duty diesel engine.
Sustainability 12 03392 g009
Figure 10. Chemical composition of combustion products from different fuel oil combustion sources, in terms of diagnostic ratios [80,81]; empty circles are snow samples, blue circle is soot from high mileage heavy duty diesel engine (HDDE), yellow circle is soot from medium mileage HDDE, green circle is soot from low mileage HDDE, and purple circle is averaged composition of particulate matter from light duty diesel engine (LDDE) exhaust.
Sustainability 12 03392 g010
Table 1. Basic statistical parameters of chemical composition of snow meltwater.
ElementMinimumMaximumMean ± Std. *Error of Mean
µg/L
Si3600183 ± 111
Al217731 ± 373
Fe26023 ± 242
Mo2328 ± 70.5
Mn13911 ± 90.6
Sr23712 ± 151
* Standard deviation.
Table 2. Results of principal component analysis (PCA).
PC
Number
Eigenvalue% of Total Variance
Explained
Cumulative
Eigenvalue
Cumulative %
of Variance
12.5241.942.5241.94
21.1819.723.7061.66
30.9916.464.6978.12
40.6310.525.3288.63
50.518.465.8397.09
60.172.916.00100.00