Article

Tyre Weights an Overlooked Diffuse Source of Lead and Antimony to Road Runoff

1
Waikato Regional Council, Private Bag 3038, Waikato Mail Centre, Hamilton 3240, New Zealand
2
Fakultät Architektur, Bauingenieurwesen und Umweltwissenschaften, Technischen Universität Braunschweig, 38106 Braunschweig, Germany
*
Author to whom correspondence should be addressed.
Sustainability 2020, 12(17), 6790; https://doi.org/10.3390/su12176790
Submission received: 18 June 2020 / Revised: 5 August 2020 / Accepted: 15 August 2020 / Published: 21 August 2020

Abstract

:
Lead (Pb) remains elevated in road runoff and roadside dust, which has been attributed to legacy lead in surface soils from leaded petrol. However, “lead” tyre weights, an alloy of 95% Pb and 5% Sb, may be a relatively unrecognised diffuse source of Pb and Sb as they are still used in many countries. An unknown number of these weights drop off tyre rims and deposit on the road where they are abraded and dispersed, potentially causing adverse environmental effects. The type, number and weight of tyre weights lost from motor vehicles were characterised for a range of roading infrastructures and motor vehicle intensities in a 38 month long study of a 6.9 km length of road in Hamilton City, New Zealand. Overall, 1070 tyre weights with a combined mass of 18.6 kg were collected. About 96.4% of the collected weights were made of “lead”, which is an alloy of 95% Pb and 5% Sb, indicating tyre weights can be a major source of Pb and Sb in urban areas. The tyre weight distribution on roads used in this study depended mainly on traffic density and the prevalence of “start stop” patterns in traffic flow influenced by roundabouts and intersections. “Lead” tyre weights should be phased out and replaced with environmentally benign materials.

Graphical Abstract

1. Introduction

Lead is a persistent environmental toxin that is regarded as a developmental neurotoxicant threat to human health and harmful to the wider environment [1,2]. It is still used in tyre weights in many countries of the world as Pb is dense, soft, relatively inexpensive and does not rust. However, it has been banned in European Union countries since 2005 and some States in the USA. In addition, Environment Canada has proposed phasing out the manufacturing and importing of lead wheel weights by 2020. Nevertheless, tyre weights remain a diffuse contamination source of lead in urban environments in many countries of the world.
“Lead” tyre weights are usually made of Pb-Sb alloy (about 95% Pb) and tyre weights may also be a source of Sb. [3] reported that Sb concentrations in roadside soils have increased eightfold compared to background concentrations despite the rather short history of Sb as a traffic-emitted metalloid. Bleiwas [4] suggested Sb could be used as a useful indicator in distinguishing this source of lead from other possible sources.
Tyre weights are usually clipped to the rims of motor vehicle wheels to balance tyres to avoid compromised handling (Figure 1, [4]). Alternatively, weights are glued to the inside of the rim with adhesive strips. These weights can come loose and drop off the tyre rims and deposit on the road, where they are abraded by vehicles driving over them (Figure 1, [5,6]). Eventually, Pb and Sb disperse as dust or wash into water ways in road runoff [5]. Most weights are lost in urban environments where hitting curbs and potholes, rapid acceleration and deceleration and sharp turning can cause clip-on weights and poorly applied adhesive-backed weights to come loose [4].
Both Pb and Sb are known to have environmental and health effects. The incidence of Pb poisoning remains high in urban areas of the U.S., and globally [7]. Soil dust has been identified as a major source of Pb in households and one of the primary pathways of lead exposure for children [8]. Lead has been identified as a toxin of importance to wildlife, including the endemic New Zealand parrot, the kaka (Nestor meridionalis) [9]. Lead is a neurotoxin but also elicits responses in an extraordinarily wide range of biological and biochemical tests; among these are tests for enzyme inhibition, fidelity of DNA synthesis, mutation, chromosome aberrations, cancer and birth defects. It reacts or complexes with many biomolecules and adversely affects the reproductive, nervous, gastrointestinal, immune, renal, cardiovascular, skeletal, muscular and hematopoietic systems as well as developmental processes [10]. Chronic exposures can permanently impair the brain’s functioning, thus limiting a child’s intellectual and social development [11]. Lead continues to influence the genetic structure of exposed plant and animal populations [10].
Toxic effects of Sb include respiratory and cutaneous effects, effects on the cardiovascular system, renal tubular acidosis, thrombocytopenia and pancreatitis [12]. It is a potential carcinogen and has an inhibitory role in DNA replication and metabolic processes [13]. However, the mechanism of toxicity of Sb compounds and the impacts of excessive Sb on the wider environment are not clearly understood. There is also little information available on the transformation and transport of Sb in different environmental compartments, all of which hinders the understanding, behaviour and fate of Sb [14].
Traffic-associated elements, such as Ba, Cd, Cu, Pb and Zn, are reported as correlating with each other [15,16] and are linked to traffic volume [15,17,18]. Lead deposited on an impervious surface, such as asphalt or concrete roads, became mobilised in road runoff, while Pb deposited on soil could be sorbed by carbonate and oxihydroxide fractions [7]. However, roadside Pb and Sb can be resuspended in dust by passing vehicles and more widely distributed across the environment [8,19]. Native Pb is more strongly sorbed on soil than petrol-sourced Pb and is less available [20,21].
The quantity of Pb lost from wheel weights has been previously estimated using the difference between inventory and retirement stocks [4,22], or by multiplying the concentration of Pb in wheel weights by an emission factor based on calculated average vehicle mileage [23], or by surveys collecting and weighing weights [5,24]. However, previous surveys had limited sampling programmes. One study [24] collected wheel weights on only 23 occasions over the period 2006–09, so weights abraded would have been missed. Painted weights were seeded onto the road to calculate the abrading rate, but the data shows only about half the weights were recovered and only these recovered weights were used in the abrading rate correction calculation. Road sampling length was also short, 1 km or less. Further questions of the methodology of [24] were also raised [6]. The earlier survey [5] consisted of one-off collection along eight street segments, totalling 19.2 km and a biweekly collection over 46 weeks of a 2.4 km street. All streets in the survey were six-lane divided roads with a speed limit of 65 km/h, so they are not representative of the range of streets found in an urban area. In addition, no assessment of the contribution of street infrastructure was carried out, although significantly greater deposition was reported around two blocks. Other studies provide information useful at the national scale but not at the city or town scale [4,22,23].
This study characterises the type, number and weight of tyre weights lost from motor vehicles for a range of roading infrastructures and motor vehicle intensities in the urban area of Hamilton City, New Zealand. It provides an estimate of the amount of Pb and Sb from tyre weights deposited on New Zealand roads, which can be taken as typical for urban areas in other urban centres in New Zealand and in countries with similar vehicle numbers and roading infrastructure.

2. Materials and Methods

Street segments totalling 6.9 km were surveyed visually for tyre weights over 38 months, from the beginning of December 2014 to the end of January 2018. The streets selected cover the range of streets and traffic intensities found in Hamilton, but no detailed statistical analysis of street types was carried out. Each working day, the route was inspected from a bicycle. Where weights were found, they were georeferenced by street and retrieved. Such regular surveying was expected to reduce losses due to abrading between the weight being deposited and collected. The regular surveying was also expected to reduce any impact from street cleaning, which occurs about 3-monthly. Weights were composited monthly. The monthly composite was assessed for lead and non-lead weights by number and weight. The route included a range of vehicle intensities and roading infrastructure types (Table 1). Data on traffic density was available for each street from local government surveys [25]. The weighted average traffic density over the whole route used in the study was 13,000 vmd (Equation (1)).
Equation (1)
A v e r a g e   t r a f f i c   d e n s i t y   ( v m d ) =   ( v m d   ×   s t r e e t   s e g m e n t   l e n g t h ) T o t a l   s t r e e t   l e n g h t
The method of inspecting the roads and collecting the weights had its weaknesses, which are likely to result in underreporting. Some of the soft lead weights may have been abraded between the inspections until they could no longer be identified, especially over the weekends. Some of the observed weights in our study could not be picked up since the passing vehicles posed too great a danger, something alluded to in a previous survey [5]. Weights in Hamilton, New Zealand were also incorporated into the asphalt road when a vehicle ran over them during hot weather (sunny and air temperatures > 28 °C) and some could not be retrieved. Weights can be completely buried but still visible and level with the road surface. Once the temperature drops, the bitumen solidifies and the weights cannot be removed without damaging the road. In a previous study, about 2.7% of the lead deposited each day was worn away by the next day and a “wear adjustment factor” was used to correct for this loss [5]. However, this correction factor seemed site specific as New Zealand traffic volume and makeup and road structure are quite different from those surveyed in the USA [5]. We chose to report the raw results without manipulation.

3. Results

3.1. Mass and Number of Weights

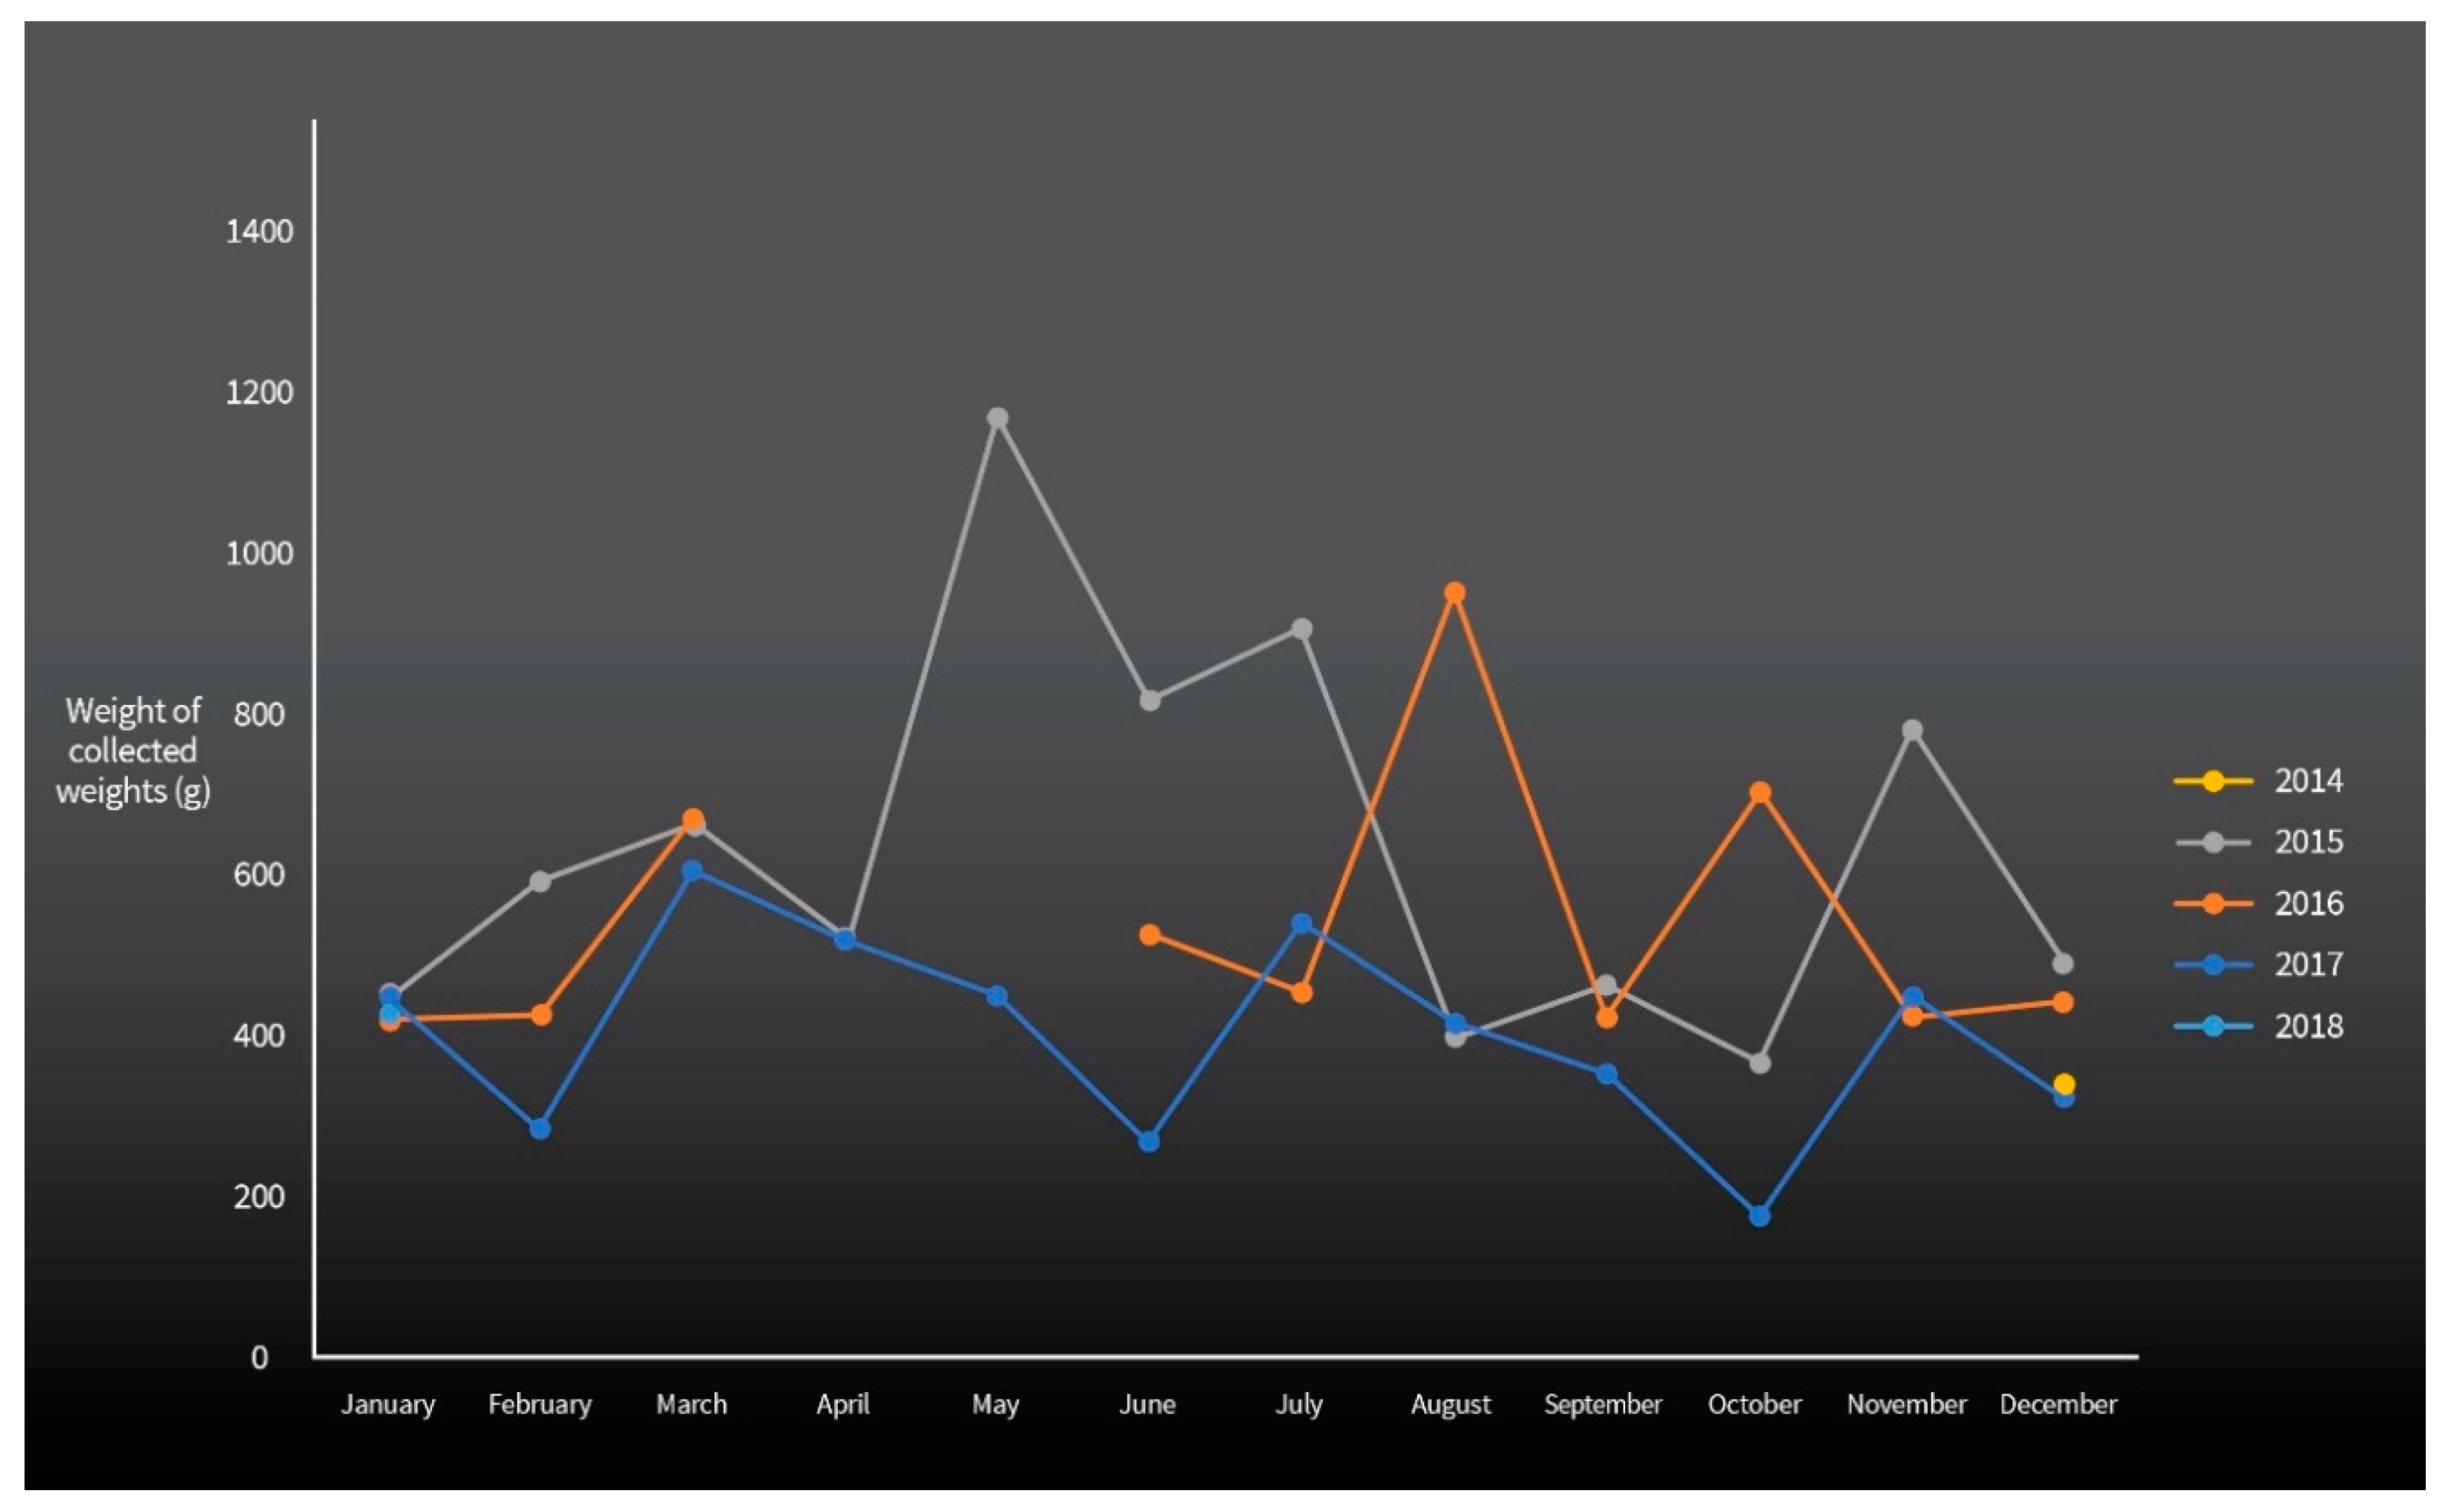
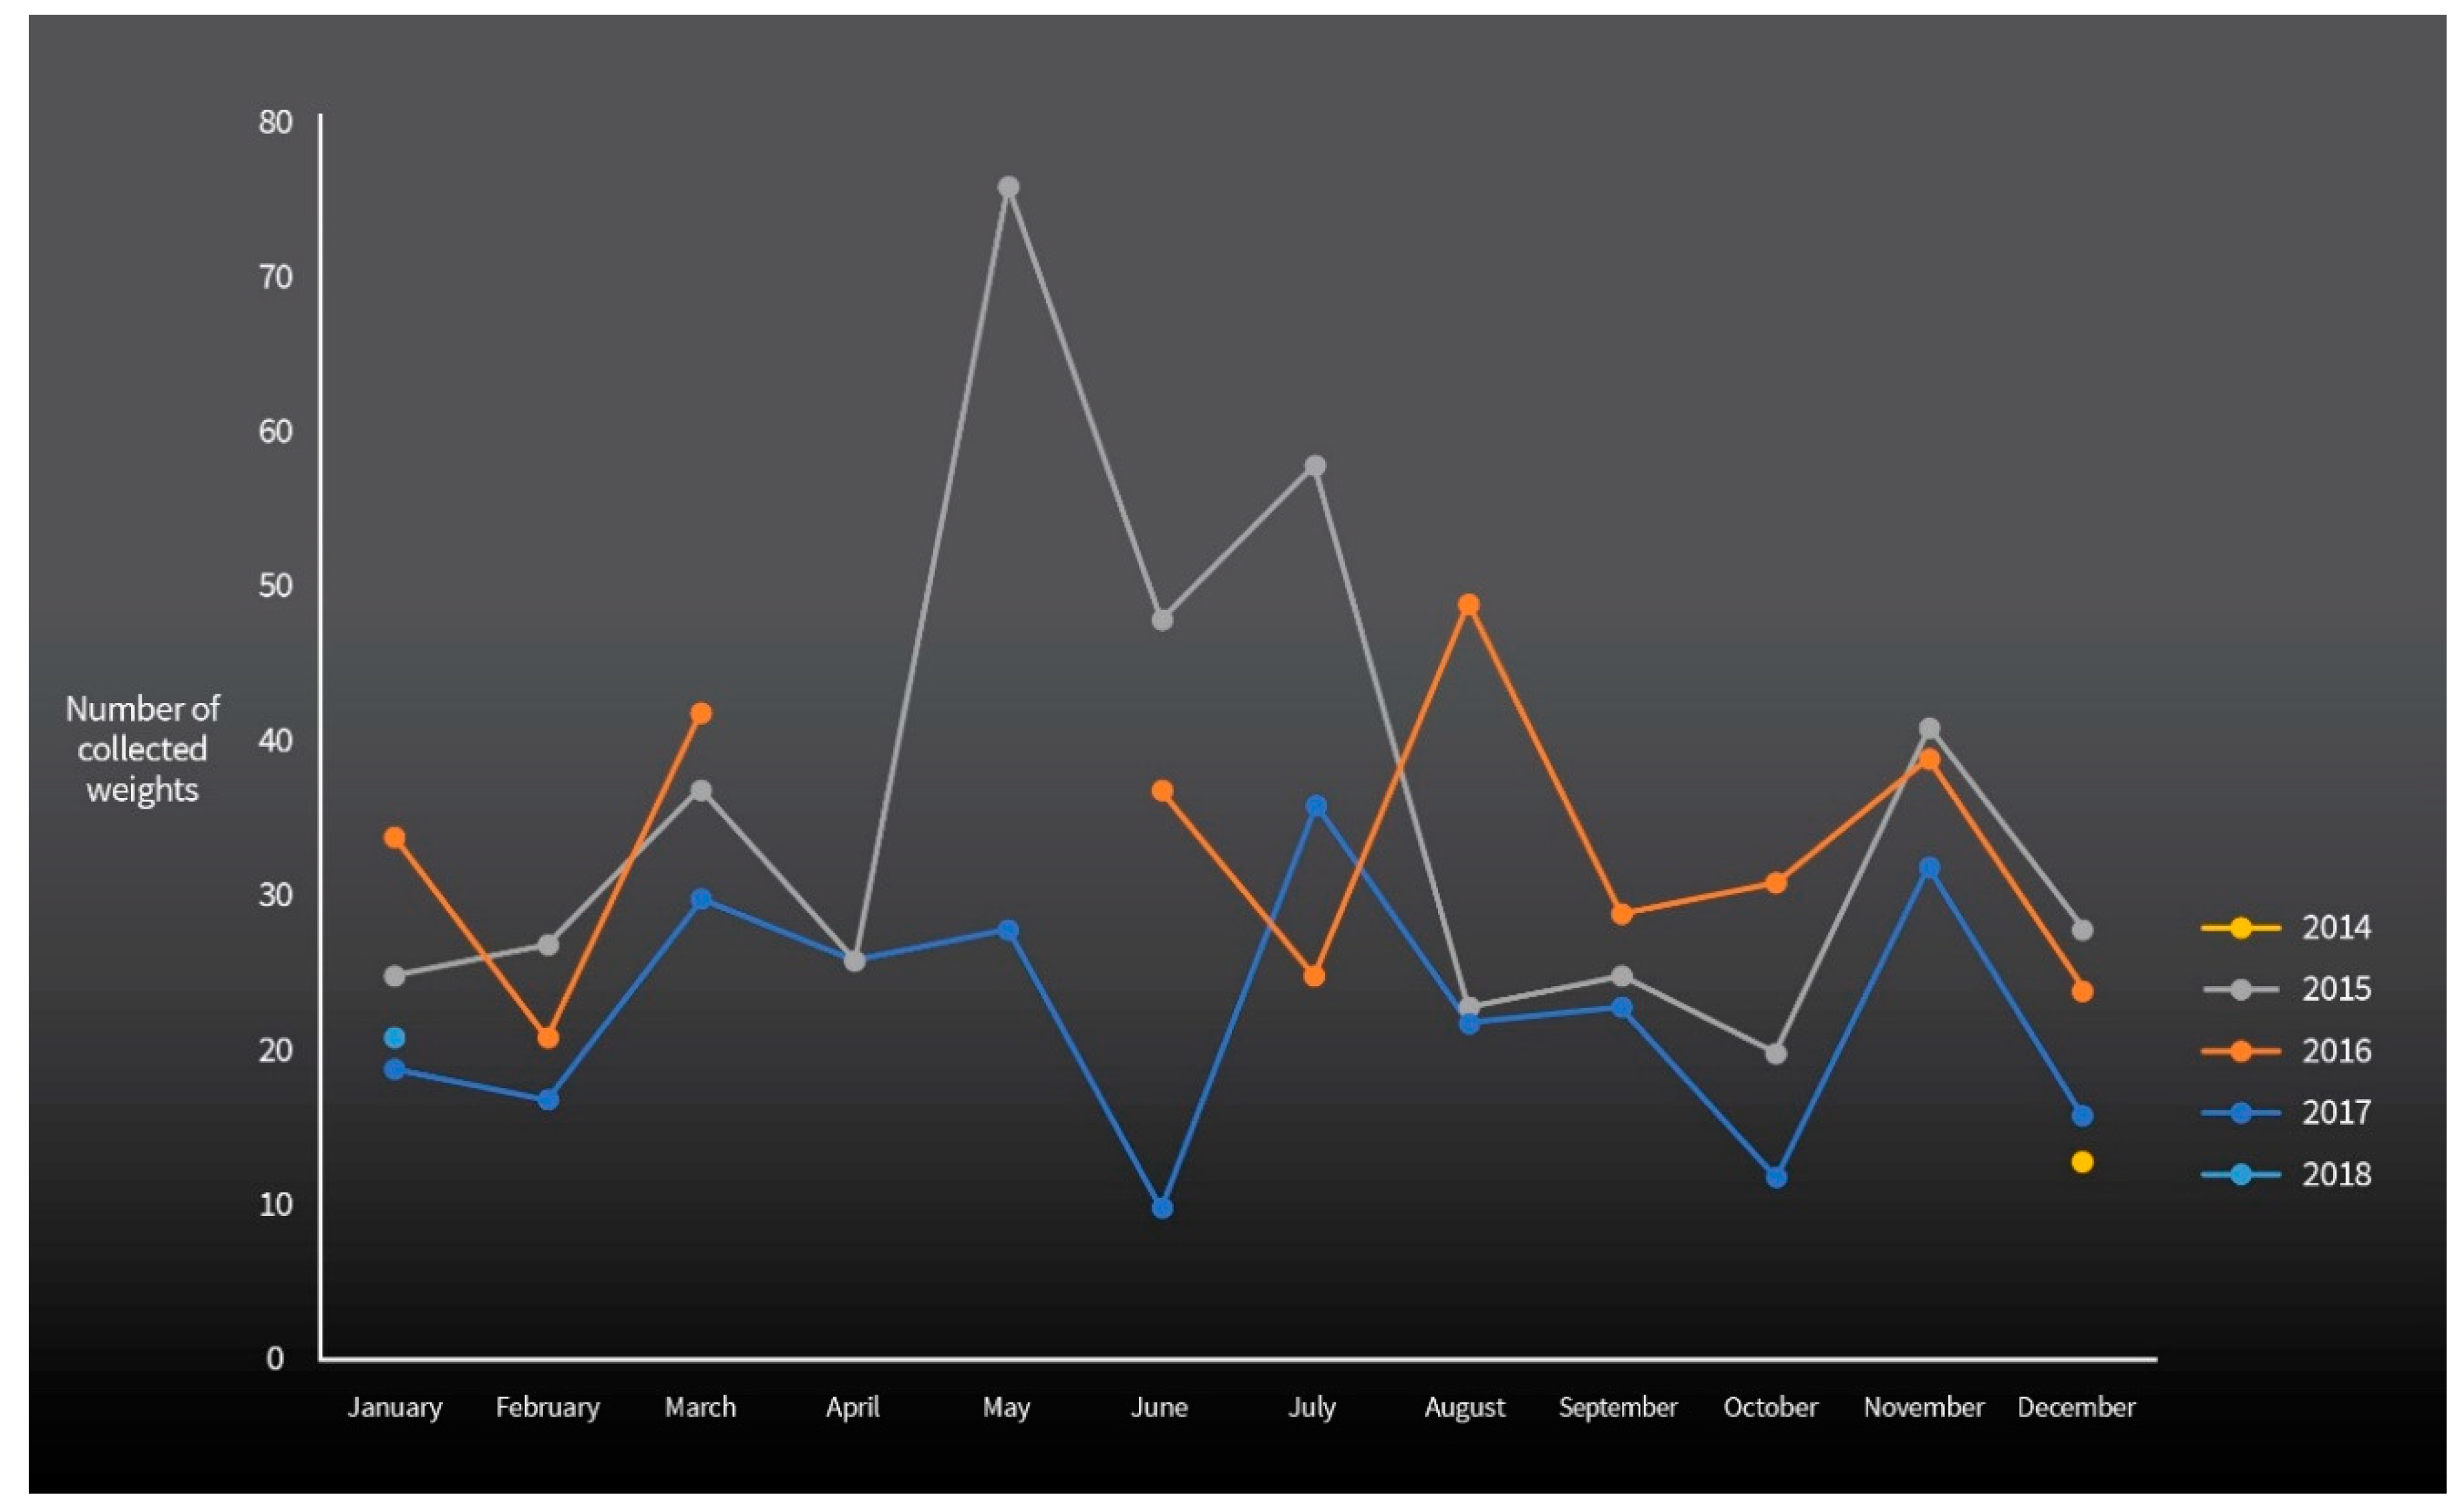
Overall, 1070 tyre weights with a combined mass of 18.6 kg were collected over the 38 months of the study on 6.9 km of roads (0.85 kg/km/year). The monthly median and average counts were 27 and 30 weights, while the monthly median and average masses were 450 and 517 g, respectively (Figure 2). About 96.4% of the collected weights were made of “lead” (1031 weights) with 2.5% Fe (27 weights), 0.7% Al (8 weights) and 0.4% Zn (4 weights). Thus, the average annual loads of metals to the environment from tyre weights in this study were 0.779 kg km−1 year−1 for Pb, 0.041 kg/km/year for Sb, 0.014 kg/km/year for Fe, 0.006 kg/km/year for Al and 0.004 kg/km/year for Zn.
May 2015 had the highest number and mass of tyre weights for any one month (76 weights, 1170 g, Figure 3 and Figure 4). However, no month or time of year consistently stood out as being high or low in number or mass of tyre weights and no trend could be observed over the different months. Some months with large numbers of weights were observed to be associated with wide diurnal ranges in temperature (>12°) and there were periods of no weights being deposited on the road when diurnal temperature ranges were closer. However, this was not consistent. Where diurnal ranges varied by >12 °C for several days, several weights could be deposited in an initial cluster followed by a decline in the number of weights to a more steady rate of deposition over subsequent days.

3.2. Influence of Traffic Density and Street Type

Traffic density and street type influenced the number and mass of tyre weights collected (Table 2). The two sections of road classified as “major intersections or roundabouts” showed the highest number of weights per area (310 and 219 weights/m2), while the three sections classified as “residential” had the lowest number of weights per area (0, 4, and 30 weights/m2), generally reflecting the number of vehicle movements. However, a higher number of weights were collected from Seddon Rd/Ward St. than was expected from the number of vehicle movements.

4. Discussion

Despite Pb being phased out of petrol in New Zealand in 1996, it remains elevated in road runoff and roadside dust [26,27]. It is commonly assumed that the elevated levels are due to legacy Pb in surface soils [7,8]. We contend that a considerable proportion of the Pb currently in roadside dust is from tyre weights and that this proportion will increase as Pb from other sources are phased out.
Tyre weights are a considerable source of Pb and Sb in urban areas, except in countries where lead tyre weights have been banned. It is assumed that the surveyed streets are representative of the Hamilton City urban area. The total urban local road length in Hamilton city is 641 km [28], so about 500 kg of Pb and 26 kg of Sb are deposited on streets in Hamilton annually. These estimations can be further extended assuming Hamilton City streets are representative of other cities in New Zealand. The total urban local road length in New Zealand is 18,531 km [28]. This leads to a total annual deposit of about 14,400 kg Pb and 760 kg Sb on urban local roads in New Zealand. This excludes state highways and rural local roads and is a conservative estimation since the survey method will likely miss some weights and the total urban local road length increases about 200 km per year with the last official data published for 2013/14 [28].
The tyre weight distribution on roads used in this study appeared to depend mainly on traffic density, the design of the street and street structures, such as roundabouts, that affect traffic flow. The positive correlation between the number of weights found on a street and the traffic density (Pearson R2 = 0.76, Table 2) is consistent with the correlation of roadside Pb with traffic density reported by many researchers [19,29,30]. The influence of street structures, such as roundabouts and intersections, on road-associated metals has also been previously reported [19,27]. Areas where cars change their momentum and show a “start stop” pattern in peak hours have been associated with higher numbers of lost tyre weights [5,31]. Roundabouts and intersections are such areas but a steep curve and hill on roads intersecting Seddon Rd/Ward St. (observed to have “start stop” traffic at peak times) may also contribute to the high proportion of weights lost here. It is likely that vehicles descending streets intersecting Seddon Rd/Ward St. had increased momentum compared with vehicles on flat streets. Thus, the change in momentum was greater at these intersections where free flowing traffic met up with “start stop” traffic.
Similar deposition of Pb and Sb likely occurs in all countries where “lead” wheel weights are used. The average deposition rate for Pb from tyre weights was calculated for known studies (Table 3). As expected, deposition rates were associated with traffic densities and/or street structures, such as intersections. Although the methodology of the previous surveys has at times been disputed [6,24], they appear to give reasonable estimates of Pb deposition when street structure and traffic density are considered. Importantly, very high deposition occurred where traffic density was > 15,000 and associated with street structures. Therefore, mitigation measures should be targeted at these areas.
Antimony emissions of 11 ± 7 and 86 ± 42 μg km−1 vehicle−1 for light and heavy-duty vehicles, respectively, have been reported for stop-and-go traffic in an urban street canyon [32]. Taking our annual loading of 0.041 kg km−1 year−1 and dividing by the average traffic density of 9700 vmd gives a loading of 4.2 μg km−1 vehicle−1. This value seems consistent with the earlier work which includes all vehicle sources of roadside Sb, e.g., brake linings.
Antimony has been used as a quantitative tracer of brake wear emissions to estimate the contribution of brake linings in roadside dust [33,34] as Sb concentrations were correlated with vehicle numbers and concentrations of Ba, Cu, Fe and Pb [35,36,37],. The sources identified were tyre wear particles, brake linings, exhaust particles from diesel engines, fire retardants and batteries. We suggest that Pb-Sb alloy tyre weights also add Sb to roadside dusts. Thus, the method of using Sb concentration to attribute the contribution of brake-linings to roadside dusts [34] would overestimate this contribution in countries where Pb-Sb alloy weights are used. Further work is needed to modify this method to allow for the input from tyre weights. Instead, Ba as a quantitative tracer of brake wear emissions should also be investigated [36].
It is unclear whether substitute materials for “lead” in tyre weights, such as Zn, are neutral in their environmental impacts [4] and this should be further investigated. Zinc in road runoff is already attributed to tyre wear [2] and Zn from tyre weights would add to that existing burden. Although Zn is an essential element for human health, at elevated concentrations it has been shown to cause a range of reproductive, developmental, behavioural and toxic responses resulting in reductions in ecological health and loss of functionality in species, soils and/or waters through toxicity; the development of widespread copper deficiency and the mobilisation of Cd through competition; and the promotion of antibiotic resistance in soil microorganisms [38,39,40,41].
We agree that abrasion of tyre weights leads to the formation of dust and the deposition of contaminants on and by roads [5]. Stormwater can carry roadside deposited metals to nearby streams and other surface waters where it can adversely affect water quality and aquatic ecosystems. Fugitive dust can contribute to the contaminant burden of humans and the wider environment.
There are several actions that can be taken to improve the situation. “Lead” tyre weights should be phased out and replaced with Al or Fe. Aluminium and Fe appear to be the most environmentally benign as they are already major constituents of soil. Laws phasing out “lead” tyre weights have been in place in Europe since 2005 [42] and in 9 US States [43,44] and could be a model for New Zealand to reduce the loadings of Pb and Sb to the environment. Evaluation of stormwater treatment options for traffic-related metals should be carried out, especially on deposition patterns, to inform the location and optimisation of treatment methods, and research to evaluate the effects to human and ecosystem health of exposure to tyre weight materials should be conducted. Regular removal of tyre weights and road dusts by road cleaning trucks should be carried out and debris should be disposed of at a suitable waste or recycling facility. The causes of tyre weight detachment should be investigated to inform the establishment of performance standards for the attachment of wheel weights to wheels.

5. Conclusions

A considerable proportion of the Pb currently in roadside dust in New Zealand cities is from tyre weights and this proportion will increase as Pb from other sources are phased out. The total annual weights of Pb and Sb currently deposited on urban local roads in New Zealand are estimated to be 14,400 kg and 760 kg, respectively. Similar deposition of Pb and Sb likely occurs in all countries where “lead” wheel weights are used. Therefore, tyre weights can be a major source of Pb and Sb in urban areas. Tyre weight distribution depends on traffic density and the prevalence of “start stop” patterns in traffic flow. “Start stop” patterns in traffic flow are influenced by street structures, such as roundabouts and intersections. “Lead” tyre weights should be phased out and replaced with Al or Fe, regular road cleaning should be carried out and debris disposed of at a suitable waste or recycling facility. Further research into the causes of tyre weight detachment to evaluate the effects on human and ecosystem health of exposure to tyre weight materials, and to evaluate stormwater treatment options, should be carried out.

Author Contributions

Conceptualization, M.T.; methodology, M.T.; formal analysis, N.K.; investigation, M.T.; resources, M.T.; data curation, M.T. and N.K.; writing—original draft preparation, N.K.; writing—review and editing, M.T.; supervision, M.T.; project administration, M.T.; All authors have read and agreed to the published version of the manuscript.

Funding

This research received no external funding.

Acknowledgments

We thank Jonathan Caldwell and the anonymous reviewers for helpful comments on the manuscript.

Conflicts of Interest

The authors declare no conflict of interest.

References

  1. US Food and Drug Administration. Q3D Elemental Impurities Guidance for Industry; US Department of Health and Human Services: Washington, DC, USA, 2015; p. 41.
  2. Buekers, J.; Redeker, E.S.; Smolders, E. Lead toxicity to wildlife: Derivation of a critical blood concentration for wildlife monitoring based on literature data. Sci. Total Environ. 2009, 407, 3431–3438. [Google Scholar] [CrossRef]
  3. Hjortenkrans, D.; Bergbäck, B.; Häggerud, A. New metal emission patterns in road traffic environments. Environ. Monit. Assess. 2006, 117, 85–98. [Google Scholar] [CrossRef]
  4. Bleiwas, D.I. Stocks and Flows of Lead-Based Wheel Weights in the United States; US Geological Survey Open-File Report, 1111(6); U.S. Geological Survey: Reston, VA, USA, 2006.
  5. Root, R. Lead Loading on Urban Streets by Motor Vehicle Wheel Weights. Environ. Health Perspect. 2000, 108, 937–940. Available online: https://ehp.niehs.nih.gov/doi/pdf/10.1289/ehp.00108937 (accessed on 20 August 2020). [CrossRef] [PubMed]
  6. Root, R.A. Analysis of a study of lead wheel weight deposition and abrasion in New Jersey. Water Air Soil Pollut. 2015, 226, 381. [Google Scholar] [CrossRef] [Green Version]
  7. Filippelli, G.M.; Risch, M.; Laidlaw, M.A.; Nichols, D.E.; Crewe, J. Geochemical legacies and the future health of cities: A tale of two neurotoxins in urban soils. Elem. Sci. Anth. 2015, 24, 000059. [Google Scholar] [CrossRef] [Green Version]
  8. Laidlaw, M.A.; Zahran, S.; Pingitore, N.; Clague, J.; Devlin, G.; Taylor, M.P. Identification of lead sources in residential environments: Sydney Australia. Environ. Pollut. 2014, 184, 238–246. [Google Scholar] [CrossRef]
  9. Sriram, A.; Roe, W.; Booth, M.; Gartrell, B. Lead exposure in an urban, free-ranging parrot: Investigating prevalence, effect and source attribution using stable isotope analysis. Sci. Total Environ. 2018, 634, 109–115. [Google Scholar] [CrossRef]
  10. Johnson, F.M. The genetic effects of environmental lead. Mutat. Res. Rev. Mutat. 1998, 410, 123–140. [Google Scholar] [CrossRef]
  11. Mielke, H.W. Lead in the inner cities: Policies to reduce children’s exposure to lead may be overlooking a major source of lead in the environment. Am. Sci. 1999, 87, 62–73. [Google Scholar] [CrossRef]
  12. Arai, Y. Arsenic and Antimony. In Trace Elements in Soils; Hooda, P.S., Ed.; Blackwell Publishing: Chichester, UK, 2010; pp. 383–407. [Google Scholar]
  13. Wilson, S.; Lockwood, P.; Ashley, P.; Tighe, M. The chemistry and behaviour of antimony in the soil environment with comparisons to arsenic: A critical review. Environ. Pollut. 2010, 158, 1169–1181. [Google Scholar] [CrossRef]
  14. Filella, M.; Belzile, N.; Chen, Y.W. Antimony in the environment: A review focused on natural waters: I. Occurrence. Earth Sci. Rev. 2002, 57, 125–176. [Google Scholar] [CrossRef]
  15. Cal-Prieto, M.J.; Carlosena, A.; Andrade, J.M.; Martinez, M.L.; Muniategui, S.; Lopez-Mahia, P.; Prada, D. Antimony as a tracer of the anthropogenic influence on soils and estuarine sediments. Water Air Soil Pollut. 2001, 129, 333–348. [Google Scholar] [CrossRef]
  16. Sternbeck, J.; Sjödin, Å.; Andréasson, K. Metal emissions from road traffic and the influence of resuspension—Results from two tunnel studies. Atmos. Environ. 2002, 36, 4735–4744. [Google Scholar] [CrossRef]
  17. Carrero, J.A.; Arrizabalaga, I.; Bustamante, J.; Goienaga, N.; Arana, G.; Madariaga, J.M. Diagnosing the traffic impact on roadside soils through a multianalytical data analysis of the concentration profiles of traffic-related elements. Sci. Total Environ. 2013, 458, 427–434. [Google Scholar] [CrossRef]
  18. Laidlaw, M.A.; Mohmmad, S.M.; Gulson, B.L.; Taylor, M.P.; Kristensen, L.J.; Birch, G. Estimates of potential childhood lead exposure from contaminated soil using the US EPA IEUBK Model in Sydney, Australia. Environ. Res. 2017, 156, 781–790. [Google Scholar] [CrossRef]
  19. Hjortenkrans, D. Road Traffic Metals: Sources and Emissions. Ph.D. Thesis, University of Kalmar, Kalmar, Sweden, 2008. [Google Scholar]
  20. Chlopecka, A.; Bacon, J.R.; Wilson, M.J.; Kay, J. Forms of cadmium, lead, and zinc in contaminated soils from southwest Poland. J. Environ. Qual. 1996, 25, 69–79. [Google Scholar] [CrossRef]
  21. Lee, P.-K.; Touray, J.C.; Baillif, P.; Ildefonse, J.P. Heavy metal contamination of settling particles in a retention pond long the A-71 motorway in Sologne, France. Sci. Total Environ. 1997, 201, 1–15. [Google Scholar] [CrossRef]
  22. Fiala, M.; Hwang, H.M. Development of a Static Model to Identify Best Management Practices for Trace Metals from Non-Exhaust Traffic Emissions. Environ. Process. 2019, 6, 377–389. [Google Scholar] [CrossRef]
  23. Campbell, P.M.; Corneau, E.; Nishimura, D.; Teng, E.; Ekoualla, D. Cost-benefit analysis for a lead wheel weight phase-out in Canada. Sci. Total Environ. 2018, 637, 79–90. [Google Scholar] [CrossRef] [PubMed]
  24. Aucott, M.; Caldarelli, A. Quantity of lead released to the environment in New Jersey in the form of motor vehicle wheel weights. Water Air Soil Pollut. 2012, 223, 1743–1752. [Google Scholar] [CrossRef]
  25. Hamilton City Council. Hamilton 2015 Traffic Flow Map Average Daily (24hrs) Traffic Volume. Available online: http://www.hamilton.govt.nz/our-services/transport/maintainingimproving/Documents/2015%20Traffic%20Flow%20Map.pdf (accessed on 20 August 2020).
  26. Land Transport New Zealand. Contaminant Characterization and Toxicity of Road Sweepings and Catchpit Sediments: Towards More Sustainable Reuse Options; Land Transport New Zealand Research Report 345; Land Transport New Zealand: Wellington, New Zealand, 2008.
  27. Pandey, S.; Taylor, M.D.; Lee, R. Reduction of Road Run Off Contaminants: Laboratory Experiments and Monitoring of Treatment Walls; Land Transport New Zealand: Wellington, New Zealand, 2005.
  28. Ministry of Transport. Infrastructure and Investment: Infrastructure Size 2015. Available online: https://www.transport.govt.nz/mot-resources/transport-dashboard/2-road-transport/ (accessed on 20 August 2020).
  29. De Silva, S.; Ball, A.S.; Huynh, T.; Reichman, S.M. Metal accumulation in roadside soil in Melbourne, Australia: Effect of road age, traffic density and vehicular speed. Environ. Pollut. 2016, 208, 102–109. [Google Scholar] [CrossRef] [PubMed]
  30. Rodriguez-Flores, M.; Rodriguez-Castellon, E. Lead and cadmium levels in soil and plants near highways and their correlation with traffic density. Environ. Pollut. B 1982, 4, 281–290. [Google Scholar] [CrossRef]
  31. Gómez, D.R.; Giné, M.F.; Bellato, A.C.S.; Smichowski, P. Antimony: A traffic-related element in the atmosphere of Buenos Aires, Argentina. J. Environ. Monit. 2005, 7, 1162–1168. [Google Scholar] [CrossRef] [PubMed]
  32. Bukowiecki, N.; Lienemann, P.; Hill, M.; Figi, R.; Richard, A.; Furger, M.; Rickers, K.; Falkenberg, G.; Zhao, Y.; Cliff, S.S.; et al. Real-world emission factors for antimony and other brake wear related trace elements: Size-segregated values for light and heavy duty vehicles. Environ. Sci. Technol. 2009, 43, 8072–8078. [Google Scholar] [CrossRef] [PubMed]
  33. Thorpe, A.; Harrison, R.M. Sources and properties of non-exhaust particulate matter from road traffic: A review. Sci. Total Environ. 2008, 400, 270–282. [Google Scholar] [CrossRef] [PubMed]
  34. Weckwerth, G. Verification of traffic emitted aerosol components in the ambient air of Cologne (Germany). Atmos. Environ. 2001, 35, 5525–5536. [Google Scholar] [CrossRef]
  35. Fujiwara, F.; Rebagliati, R.J.; Marrero, J.; Gómez, D.; Smichowski, P. Antimony as a traffic-related element in size-fractionated road dust samples collected in Buenos Aires. Microchem. J. 2011, 97, 62–67. [Google Scholar] [CrossRef]
  36. Gietl, J.K.; Lawrence, R.; Thorpe, A.J.; Harrison, R.M. Identification of brake wear particles and derivation of a quantitative tracer for brake dust at a major road. Atmos. Environ. 2010, 44, 141–146. [Google Scholar] [CrossRef]
  37. Ozaki, H.; Watanabe, I.; Kuno, K. As, Sb and Hg distribution and pollution sources in the roadside soil and dust around Kamikochi, Chubu Sangaku National Park, Japan. Geochem. J. 2004, 38, 473–484. [Google Scholar] [CrossRef]
  38. Alloway, B.J. Copper and Zinc in Soils: Too Little or Too Much? Paper Presented to the New Zealand Trace Elements Group Conference, University of Waikato, 13–15 February 2008. Available online: http://www.tracenz.net/conference2008/NZTEG2008_001.html (accessed on 20 August 2020).
  39. Chaney, R.L. Cadmium and zinc. In Trace Elements in Soils; Hooda, P.S., Ed.; Blackwell Publishing: Chichester, West Sussex, UK, 2010; pp. 409–440. [Google Scholar]
  40. Councell, T.B.; Duckenfield, K.U.; Landa, E.R.; Callender, E. Tire-wear particles as a source of zinc to the environment. Environ. Sci. Technol. 2004, 38, 4206–4214. [Google Scholar] [CrossRef]
  41. Vermeulen, V. Use of Zinc in Agriculture: An Assessment of Data for Evidence of Accumulation in Waikato Soils, Surface Water and Sediments. Master’s Thesis, Massey University, Wellington, New Zealand, 2015. [Google Scholar]
  42. Wallström, M. COMMISSION DECISION of 27 June 2002 Amending Annex II of Directive 2000/53/EC of the European Parliament and of the Council on End-of-Life Vehicles (Notified under Document Number C (2002) 2238). 2002. Available online: http://eur-lex.europa.eu/LexUriServ/LexUriServ.do?uri=OJ:L:2002:170:0081:0084:EN:PDF (accessed on 20 August 2020).
  43. Modern Tire Dealer. New Jersey Sets Six Months to Comply with Lead Wheel Weight Ban. Published on January 18, 2018. Available online: https://www.moderntiredealer.com/news/728134/new-jersey-sets-six-months-to-comply-with-lead-wheel-weight-ban (accessed on 20 August 2020).
  44. Modern Tire Dealer. Maryland Passes Lead Wheel Weight Law. Published on May 9, 2017. Available online: http://www.moderntiredealer.com/news/722352/maryland-passes-lead-wheel-weight-law (accessed on 20 February 2018).
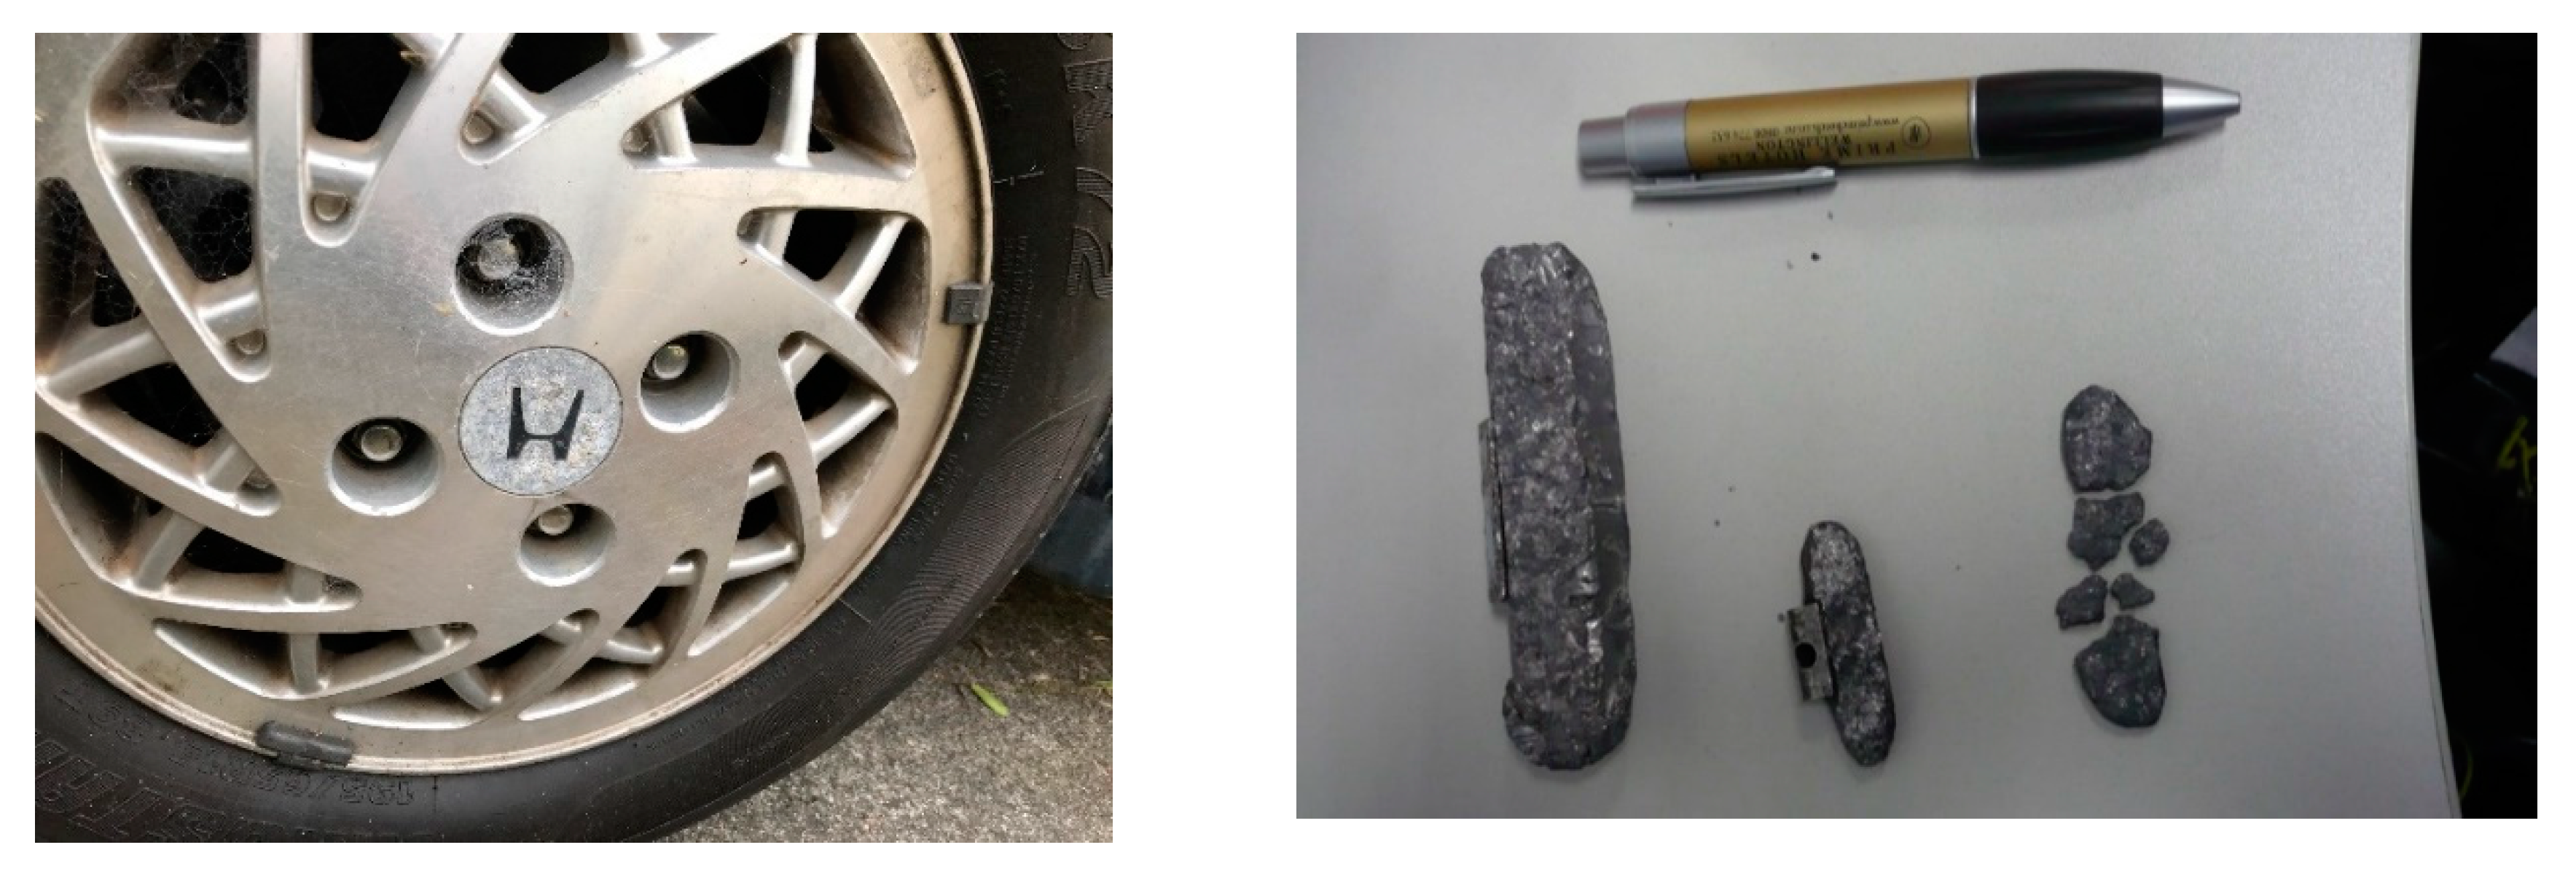
Figure 1. Tyre weights clipped to the rim of a wheel and weighs collected from the road.
Sustainability 12 06790 g001
Figure 2. Boxplots of monthly number and mass of tyre weights collected over 38 months from 7 km of roads, Hamilton City, New Zealand. The 25–75 percentile is represented by the box, while the whiskers represent the non-outliers. Outliers are represented by circles and an extreme value by an asterisk.
Sustainability 12 06790 g002
Figure 3. Monthly mass of collected weights over 38 months from 7 km of roads, Hamilton City, New Zealand.
Sustainability 12 06790 g003
Figure 4. Monthly number of collected weights over 38 months from 7 km of roads, Hamilton City, New Zealand.
Sustainability 12 06790 g004
Table 1. Characteristics of the roads monitored.
Road SegmentTypeLength (m)Area (m2)Vehicle Movements Per Day [25]
Colquhoun Pl.Residential 138966100
Aberdeen Dr.Residential 100570351000
Riflerange Rd.Residential855598510,000
Norton Rd.Main road1410987014,000
Founders roundabout Major intersection or roundabouts594623720,000 *
Seddon Rd/Ward St.Steep curve, following a valley bottom. Intersecting streets are descending on to Seddon St. Traffic often start stop.73251247000
Tristham St. and Cobham Dr.Major intersection or roundabouts149510,46518,000
Anzac Pd.Main road682477425,000
* Estimate based on vehicle movements per day on streets entering the roundabout.
Table 2. Number of collected weights on different street types and vehicle density.
Road SegmentClassificationVmd * (Hamilton City Council, 2015)Length [km]Number of Weights CollectedNumber of Weights Collected/kmNumber of Weights Collected/vmd
Colquhoun Pl.Residential1000.14000
Aberdeen Dr.Residential10001.00444
Riflerange Rd.Residential10,0000.8530353
Norton Rd.Main road14,0001.4014510310.4
Founders roundabout Norton Rd exitMajor intersection or roundabouts20,0000.601843109.2
Seddon Rd/Ward St.Steep curve, following a valley bottom. Intersecting streets are descending on to Seddon St. Traffic often start stop.70000.7311315416.1
Cobham Dr. And Tristham St.Major intersection or roundabouts18,0001.5032821918.2
Anzac Pd.Main road25,0000.6852762.1
* vmd = Vehicle movements per day.
Table 3. Average Pb deposition rates from tyre weights for the current and other known studies.
Source, Street StructureAverage Pb kg/km/y Traffic Density (vmd)
Average for this study0.789700
[5] six lane arterial road8.6545,000
[24] Commercial0.49-
[24] Mixed use0.08-
[24] Connector0.02-
[24] Heavy and intersection7.515,000–20,000 [5]
[4]0.29-
[23]0.12-
[22]0.62-
- data not supplied.