You are currently on the new version of our website. Access the old version .
SustainabilitySustainability
  • Article
  • Open Access

20 April 2020

Mapping the Sustainable Development Goals Relationships

,
and
1
Centre for Research & Development in Mechanical Engineering (CIDEM), School of Engineering of Porto (ISEP), Polytechnic of Porto, 4249-015 Porto, Portugal
2
Production and Systems Department & ALGORITMI Centre, Minho University, 4710-057 Braga, Portugal
3
Department of Business Administration in Foreign Languages (UNESCO Chair), Faculty of Business Administration in Foreign Languages, Bucharest Academy of Economic Studies, 010374 Bucharest, Romania
*
Author to whom correspondence should be addressed.
This article belongs to the Special Issue Sustainable Business Models and Innovation in the Knowledge Economy/Business Revolution in the Digital Era- Selected Papers from the 13th and 14th International Conference on Business Excellence

Abstract

Sustainable development addresses humanity’s aspiration for a better life while observing the limitations imposed by nature. In 2015, the United Nations General Assembly approved the 17 Sustainable Development Goals (SDGs) with the aim to foster the organizational operationalization and integration of sustainability and, therefore, to address the current and forthcoming stakeholder needs and ensure a better and sustainable future for all, balancing the economic, social, and environmental development. However, it is not entirely clear which are the mutual relationships among the 17 SDGs and this study aims to tackle this research gap. The results of the correlation confirm that Poverty elimination (SDG1) and Good health and well-being (SDG3) have synergetic relationships with most of the other goals. SDG7 (Affordable and clean energy) has significant relationships with other SDGs (e.g., SDG1 (No poverty), SDG2 (Zero hunger), SDG3 (Good health and well-being), SDG8 (Decent work and economic growth), SDG13 (Climate action)). However, there is a moderate negative correlation with SDG12 (Responsible consumption and production), which emphasizes the need to improve energy efficiency, increase the share of clean and renewable energies and improve sustainable consumption patterns worldwide. There is also confirmation that SDG12 (Responsible consumption and production) is the goal strongly associated with trade-offs. To sum up, this research suggests that change towards achieving the Sustainable Development Goals offers many opportunities for reinforcing rather than inhibiting itself. However, some SDGs show no significant correlation with other SDGs (e.g., SDG13 (Climate action) and SDG17 (Partnerships for the goals), which highlights the need for future research.

1. Introduction

Sustainable Development (SD) was first defined as “the development that meets the needs of the present without compromising the ability of future generations to meet their own needs,” in the document “Our Common Future” by the United Nations Commission on Environment and Development (Brundtland Commission). SD aims to address humanity’s aspirations of a better life within the limitations imposed by nature [1].
Subsequently, in 1997, the United Nations Agenda for Development building on the Brundtland SD definition and the Elkington [2] triple bottom line approach (people, planet, profit) approach, stated that: “Development is a multidimensional undertaking to achieve a higher quality of life for all people. Economic development, social development, and environmental protection are interdependent and mutually reinforcing components of sustainable development” [3]. Each of these factors has played a major role in recent years in terms of efforts for innovation, financing and global development. In terms of social development, besides the eradication of poverty and well-being of the population, quality education is another significant factor nowadays, that is bringing also innovation in ways of teaching, especially in terms of digital teaching, but also increased mobility of pupils and students, notably since the integration in the European Union and the Bologna process started [4]. In the economic field entrepreneurial entries, innovation, knowledge economy development and digitalization, such as the introduction of robotic automation processes for the business have become some of the main variables for enhancing competitiveness and further market and business development [5,6]. Another main focus point today is the environmental protection and sustainable development in the form of renewable energy, such as wind, solar and other forms of green energy, for which also a sustainable development has to be ensured through diverse support policies, community project inclusion and financing programs [7]. Moreover, research has shown that, at country level, there is high correlation (and a possible relationship) between social sustainability, innovation and competitiveness [8].
In 2015, the General Assembly of the United Nations (UN) formally adopted ‘‘The 2030 Agenda for Sustainable Development,” which provides a framework for ‘‘peace and prosperity for people and the planet, now and into the future” [9]. As part of this agreement, all United Nations Member States, after a participated process involving multiple stakeholders, agreed upon the Sustainable Development Goals (SDGs), which can be used to provide an indication and measure of progress towards the main objective of sustainable development [10]. The SDGs represent a shared expression of stakeholder needs at a global level balancing economic, social, and environmental development [11]. The 17 SDGs, presented in Table 1, comprehend themes such as ending world poverty to undertaking urgent action to combat climate change and its impacts by 2030, and are outlined in the UN’s document “Transforming our World: The 2030 Agenda for Sustainable Development” [9] and in the United Nations sustainable development goals platform [12]:
Table 1. Sustainable Development Goals (UN-SDGs, 2019).
The SDGs aim to inspire the operationalization and integration of Sustainability into organizations worldwide, addressing current and future stakeholder needs, and contributing to the achievement of sustainable development for society at large. However, although this global initiative is an authoritative source of inspiration, the different interpretation of the SDGs calls for further efforts by policymaking to improve the understanding and scientific resonance of future SDG-like initiatives, and there are still open issues regarding SDG performance measurements, operationalization, and interlinkages [13]. Assessment of the 17 SDGs has considerably focused on formulating appropriate targets and indicators for each goal [14]. Moreover, as outlined by Sachs [15] (p. 2206), the SDGs ‘‘aim for a combination of economic development, environmental sustainability, and social inclusion”, and thus, by definition, must embrace a wide range of targets and indicators. The interlinkages and integrated nature of the SDGs are critical to attaining sustainable development [16]. It is, therefore, relevant to research the possible relationships (trade-offs and complementarities) in achieving the various SDGs. After the introduction, a literature review of the SDGs relationships and the Sustainable Development Goal Index (SDG-I) is presented, followed by the methodology section. The paper ends with the results presentation and the discussion of the relevant findings and its implications and limitations.

2. Literature Review

2.1. The SDGs Relationships

The SDGs assume a significant role in the present sustainability and policy discussions concerning development as acknowledged by Scherera et al. [17]. It is recognized that there is some progress towards the SDGs. However, some critics, such as Des Gasper [18], argue that there are missing themes in the SDGs, such as migration, terrorism, capital flight, and democracy. However, rather than a judgment based on a conceptual and technical dimension, it should be acknowledged that collectively, according to Biggeri et al. [19], they represent a roadmap for a better future that inspires action and cooperation among diverse multilevel actors and agents of change with the freedom to adjust to different contexts and purposes.
Table 2, presented below, summarizes recent research contributions assessing potential relationships between SDGs. The results suggest that the understanding of the relationships between the SDGs remains limited [20]. Correlations between SDGs mainly point towards synergies, but also indicate trade-offs [21]. There are situations where the achievement of an SDG makes impossible the progress on another or where the success in an SDG is contingent on the success of another [22]. For example, since poverty and inequality are reflected in consumption volumes [23], the developments on poverty alleviation (SDG1) and reduction in inequalities (SDG10) might lead to increased environmental impact. This is due to the fact that most of the environmental effects can be attributed both directly and indirectly (via the supply chains) to the consumption by households [24]. It is, therefore, critical to understand which are the relationships between SDGs and their extent, and to realize (or not) that a specific achievement may impact positively or negatively on other SDGs and their targets [19].
Table 2. Observed relationships between SDGs.
The above research emphasizes the interlinked and integrated nature of the SDGs, which highlights the need to identify possible synergies and trade-offs to attend the different SDGs and make progress on all 17 goals to ensure sustainability, as posited by the UN [16] and authors such as Sachs [15] and Barbier and Burgess [10,14].
The literature review indicates that although progress across all 17 SGGs is possible, improvement toward one SDG may either reinforce or harm progress towards another goal. For example, economic expansion and industrial growth contributed to poverty or hunger reduction and the elimination of hunger, while improving access to clean water and sanitation, and ensuring good health and well-being. However, this economic and industrial development also had negative impacts on some environmental or social goals [14,21,25,26,28]. Such reported trade-offs and synergies amongst SDGs are in line with the United Nations’ report on progress in attaining the various 2030 SDG targets [16]. The UN report emphasizes the declines, since 2000, of extreme poverty, infant and maternal mortality rates, while the access to electricity has improved worldwide. However, the ‘‘material per capita footprint” of developing countries has grown up, and the sustainably of fish, and forest area stocks have declined. Other investigations also stressed the potential interactions among attaining different SDGs, e.g., with SDG 07 (Affordable and clean energy) [25,28].
Some studies aim to investigate the synergies and trade-offs between all the 17 SDGs, while others focus on some of the 17 SDGs or the 169 other goals and are not comparable between themselves. In a nutshell, SDG 01 (No poverty) and SDG 07 (Affordable and clean energy) show the most relationships with other SDGs, whereas SDG12 (Responsible consumption and production) is the goal mostly associated with trade-offs.

2.2. The Sustainable Development Goal Index

The Sustainable Development Goal Index (SDG-I), has been developed by Jeffrey Sachs et al. [29] on behalf of Bertelsmann Stiftung and the Sustainable Development Solutions Network (SDSN). It aims to develop and apply a single unified indicator for monitoring progress towards the SDGs at the global level and support the identification of priority areas for action, follow the overall development, and allow for international comparisons and benchmarking.
The SDG-I relies on available data from several publicly accessible sources, encompassing all the 193 member states of the United Nations since 2016. It derives from a scoring system that uses the arithmetic mean to aggregate indicators relating to each of the 17 SDGs in turn, before ‘averaging’ the results into a single metric [19]. A system of equal weights is deliberately employed to reflect international commitments ‘‘to treat each SDG equally and as an integrated and indivisible set of goals” (Sachs et al. [29] p. 41). The SDG-I is not intended to replace the global dashboard of indicators for monitoring the SDGs (Sachs et al. [30] p. 32). However, it does have enormous potential (like other well-known composite indicators) for identifying priority areas for action, tracking overall progress, and making international comparisons.

3. Methodology

This research aims to map the relationships between the SDGs, supported on a correlation analysis of the results of 17 SDGs for all the 193 UN member states, selected as the source of data for the subsequent correlation analysis.
Due to its conceptual complexity, it is challenging to translate some of the SDGs into measurable indicators. Moreover, the data is not always available, and some countries have difficulty reporting these indicators with reliability, making it difficult for cross-country comparability, or agreed-upon methodologies for measurement.
To overcome these limitations, and considering its international legitimacy and acceptance, the Sustainable Development Goal Index (SDG-I) [
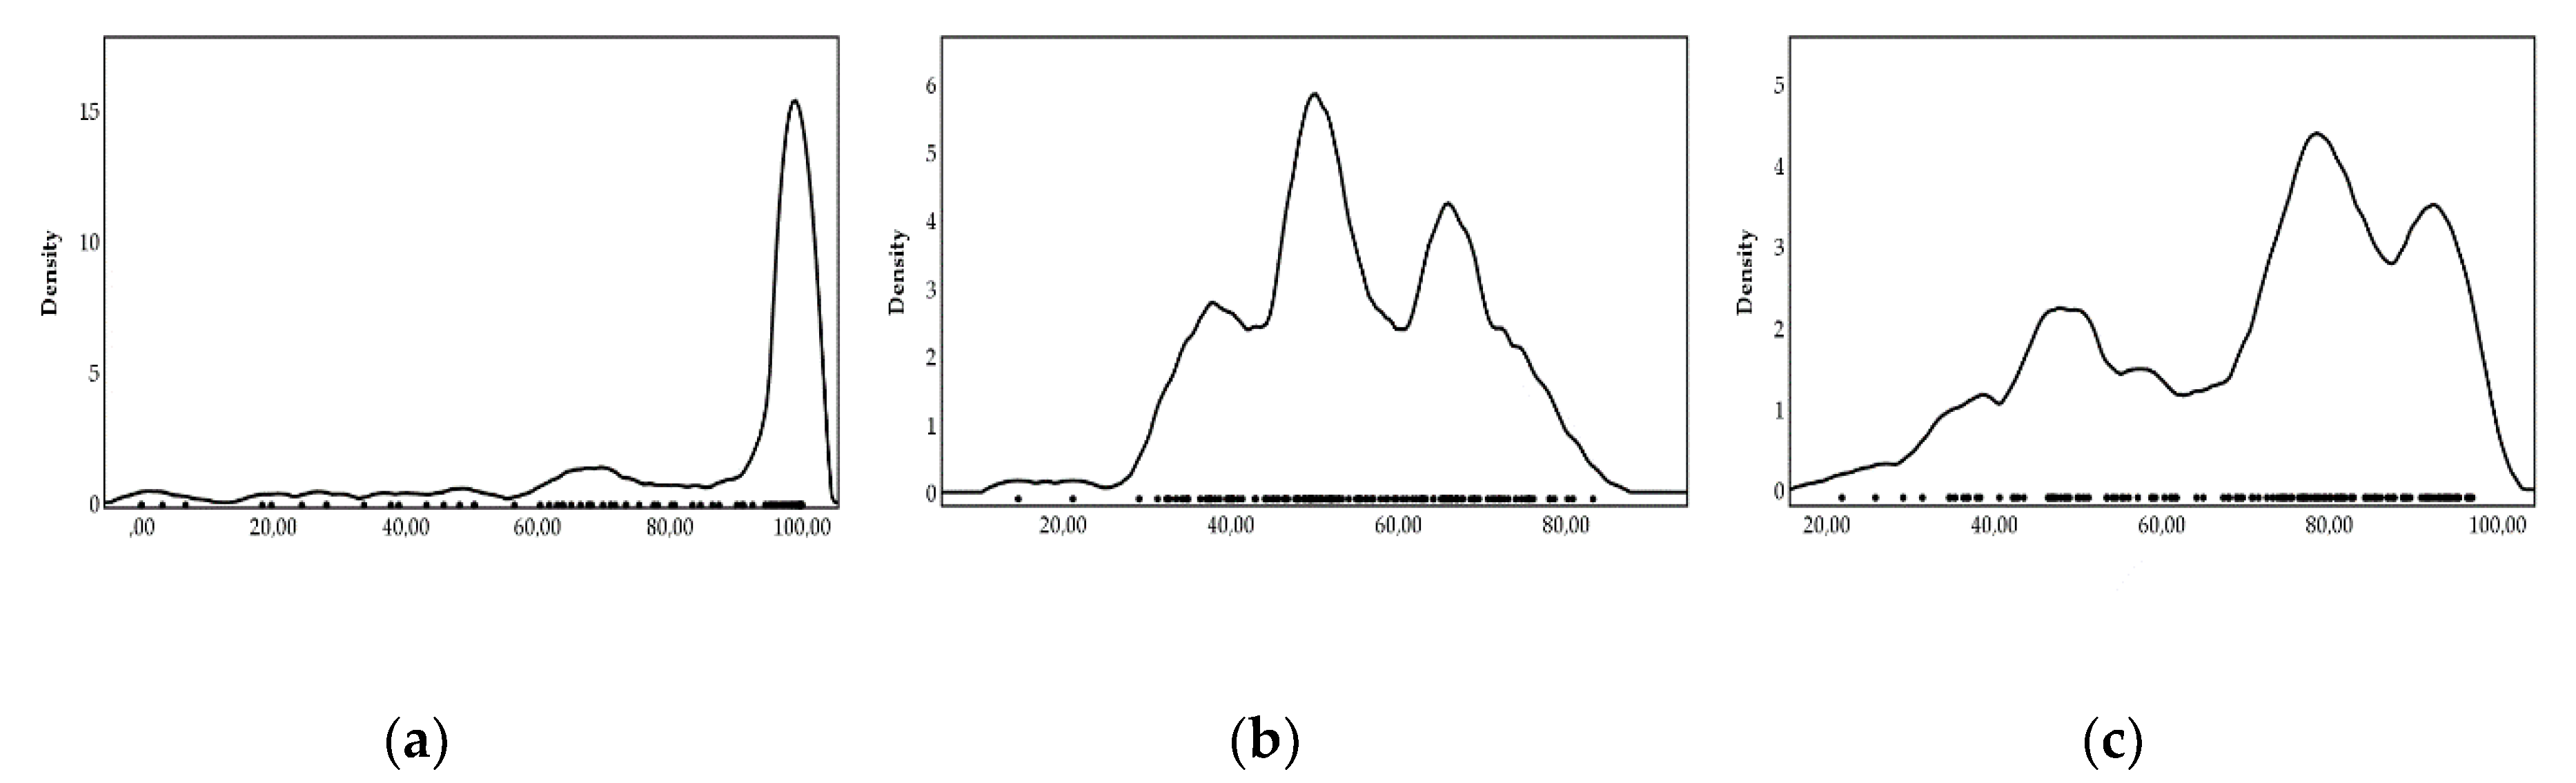
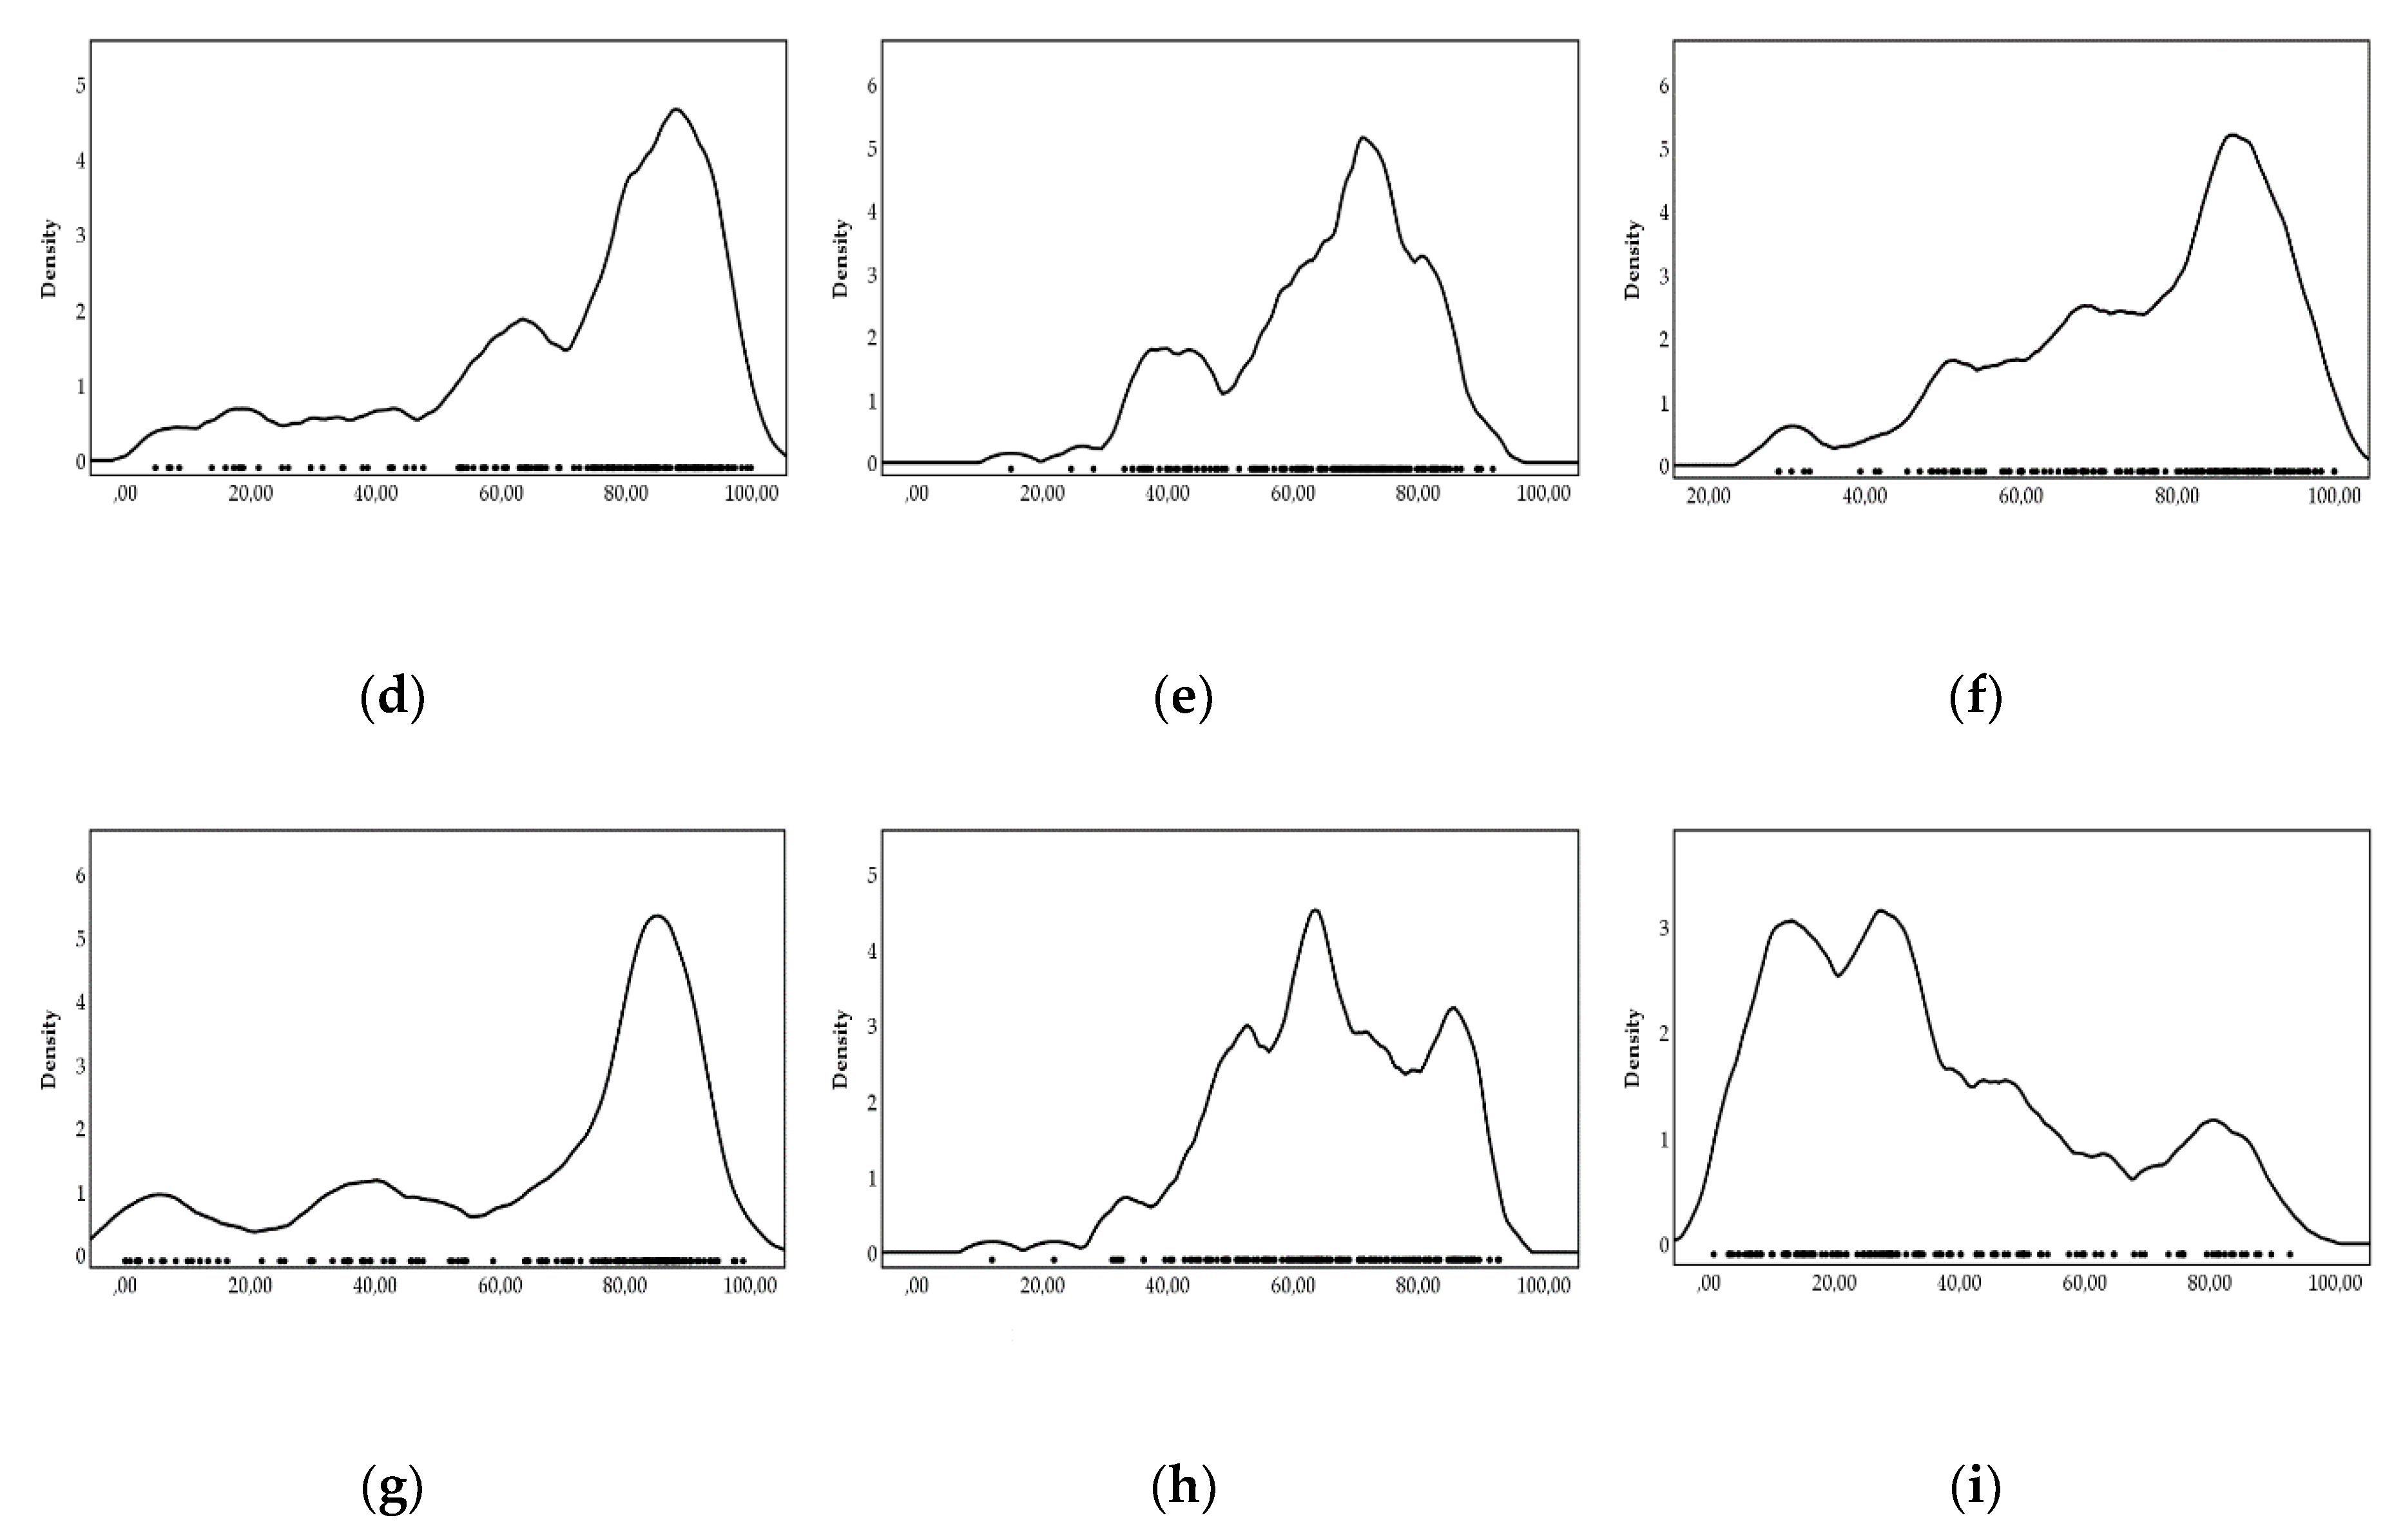
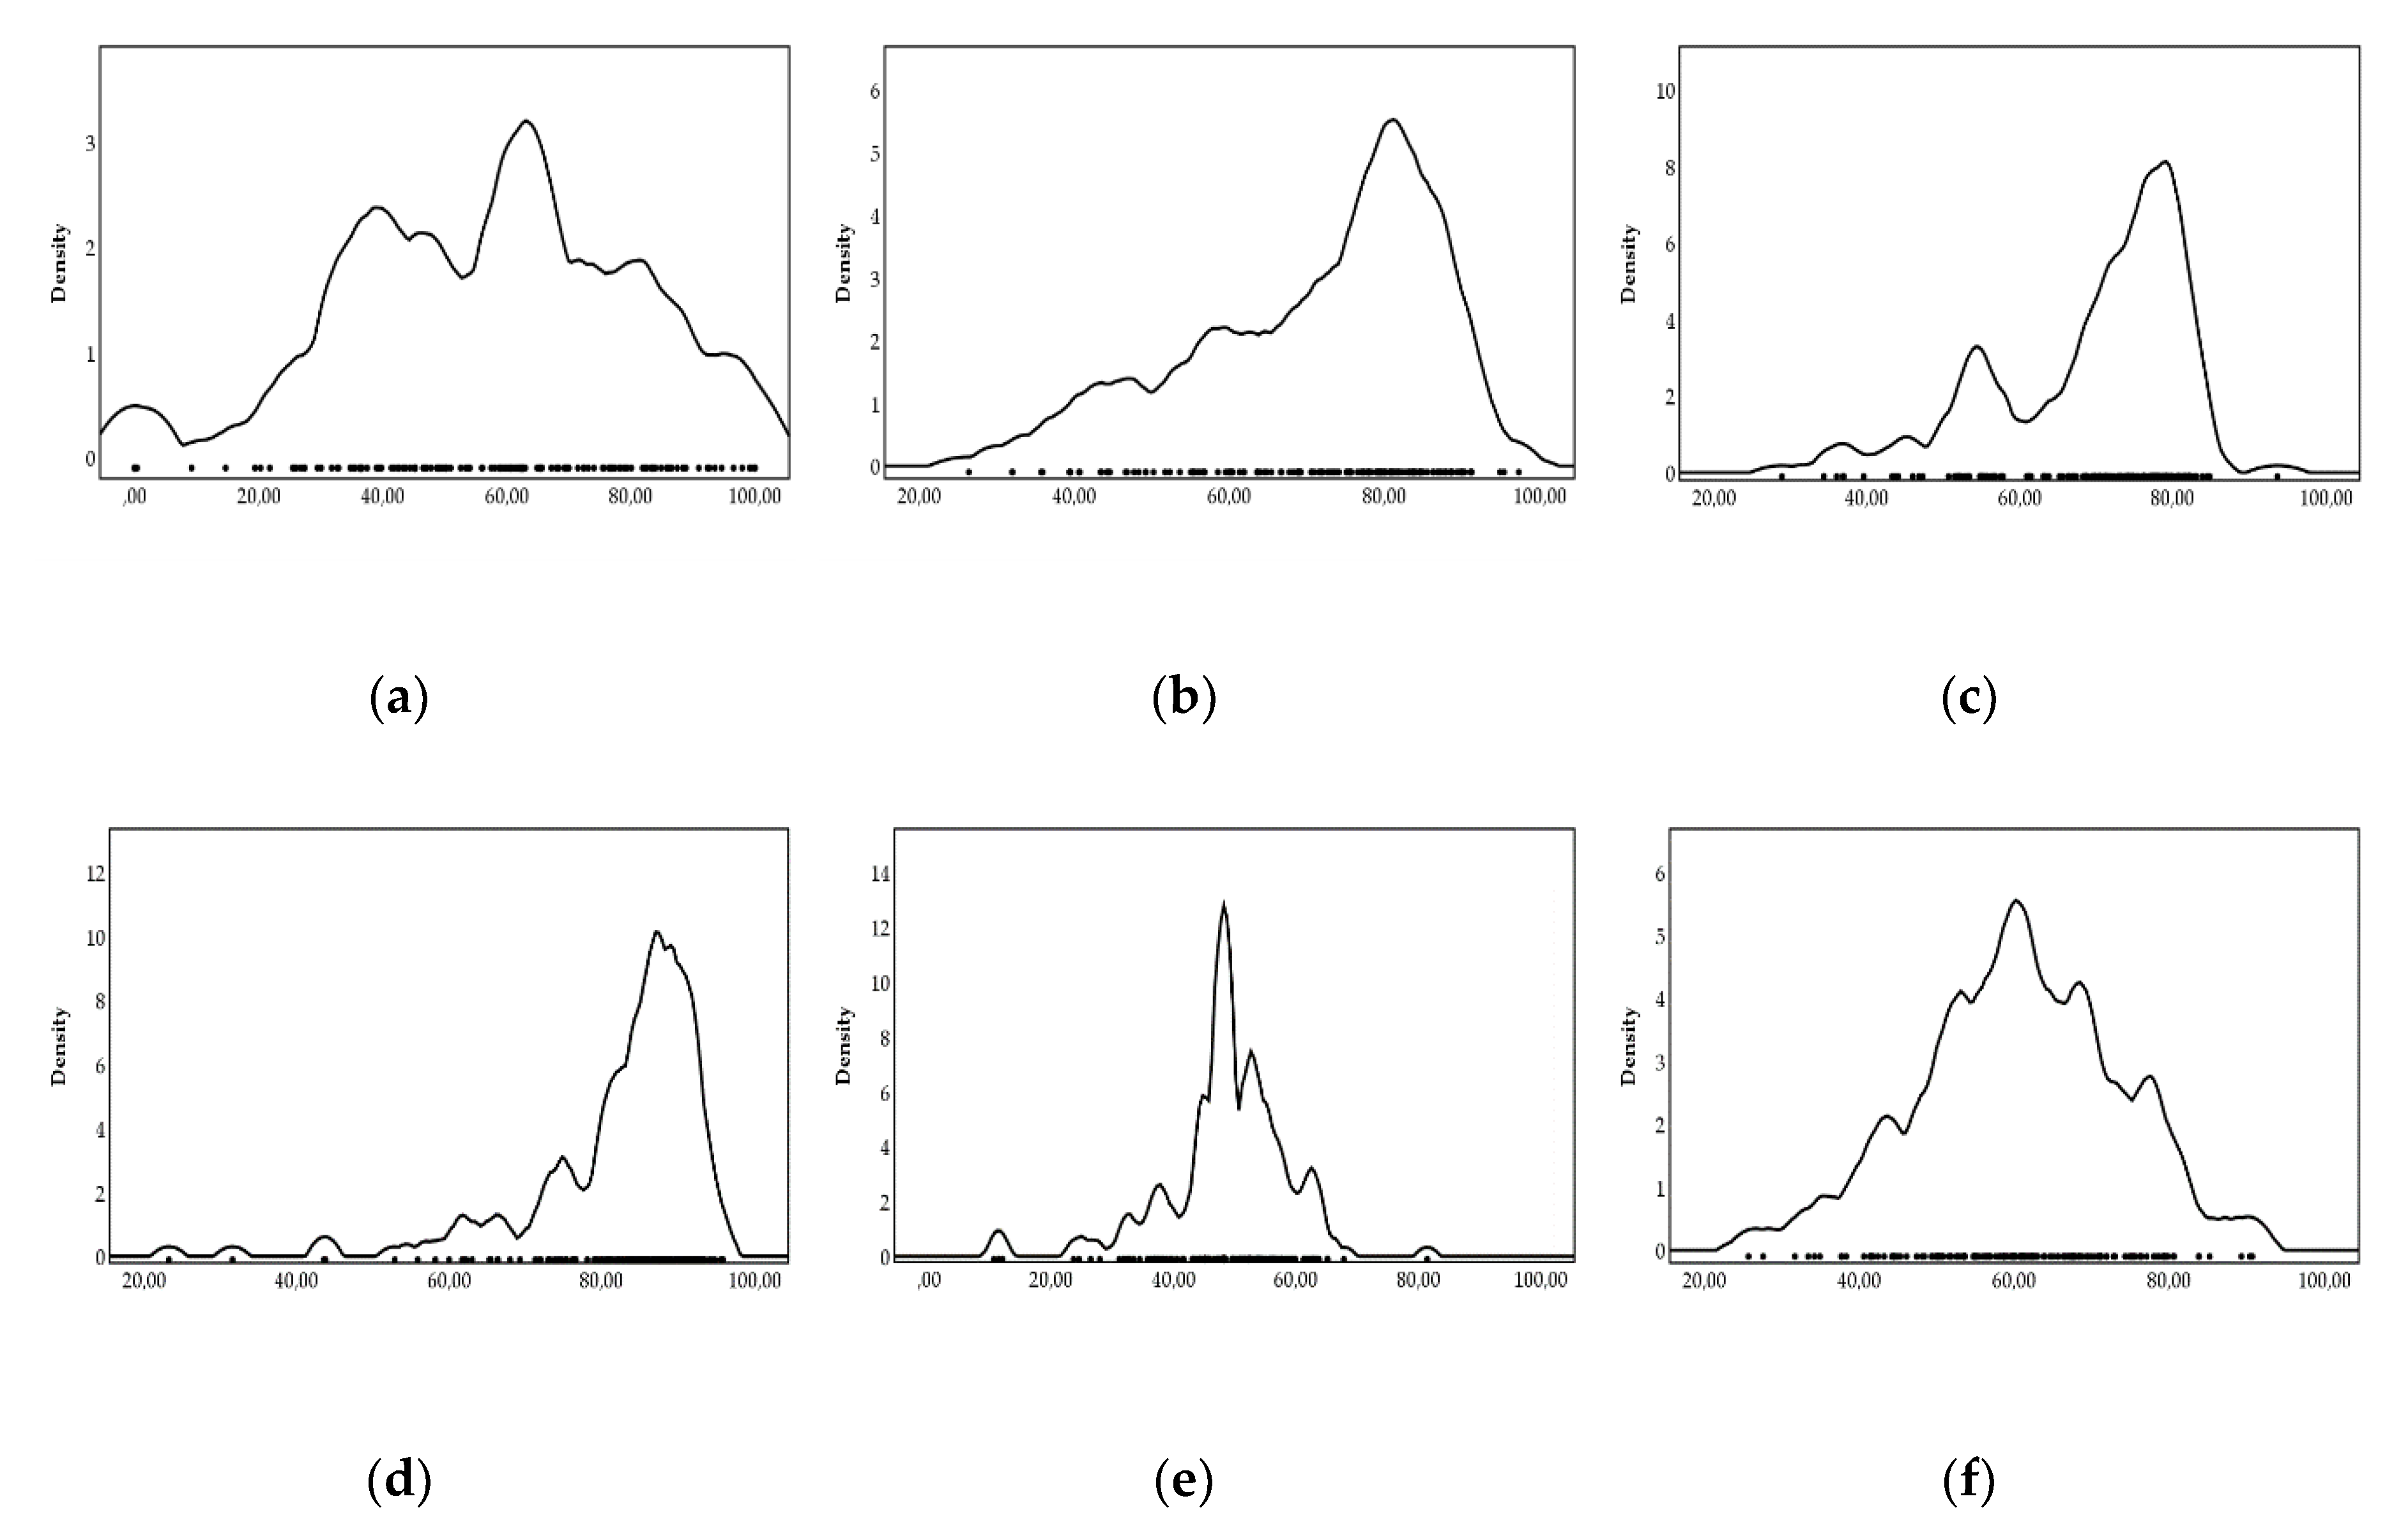
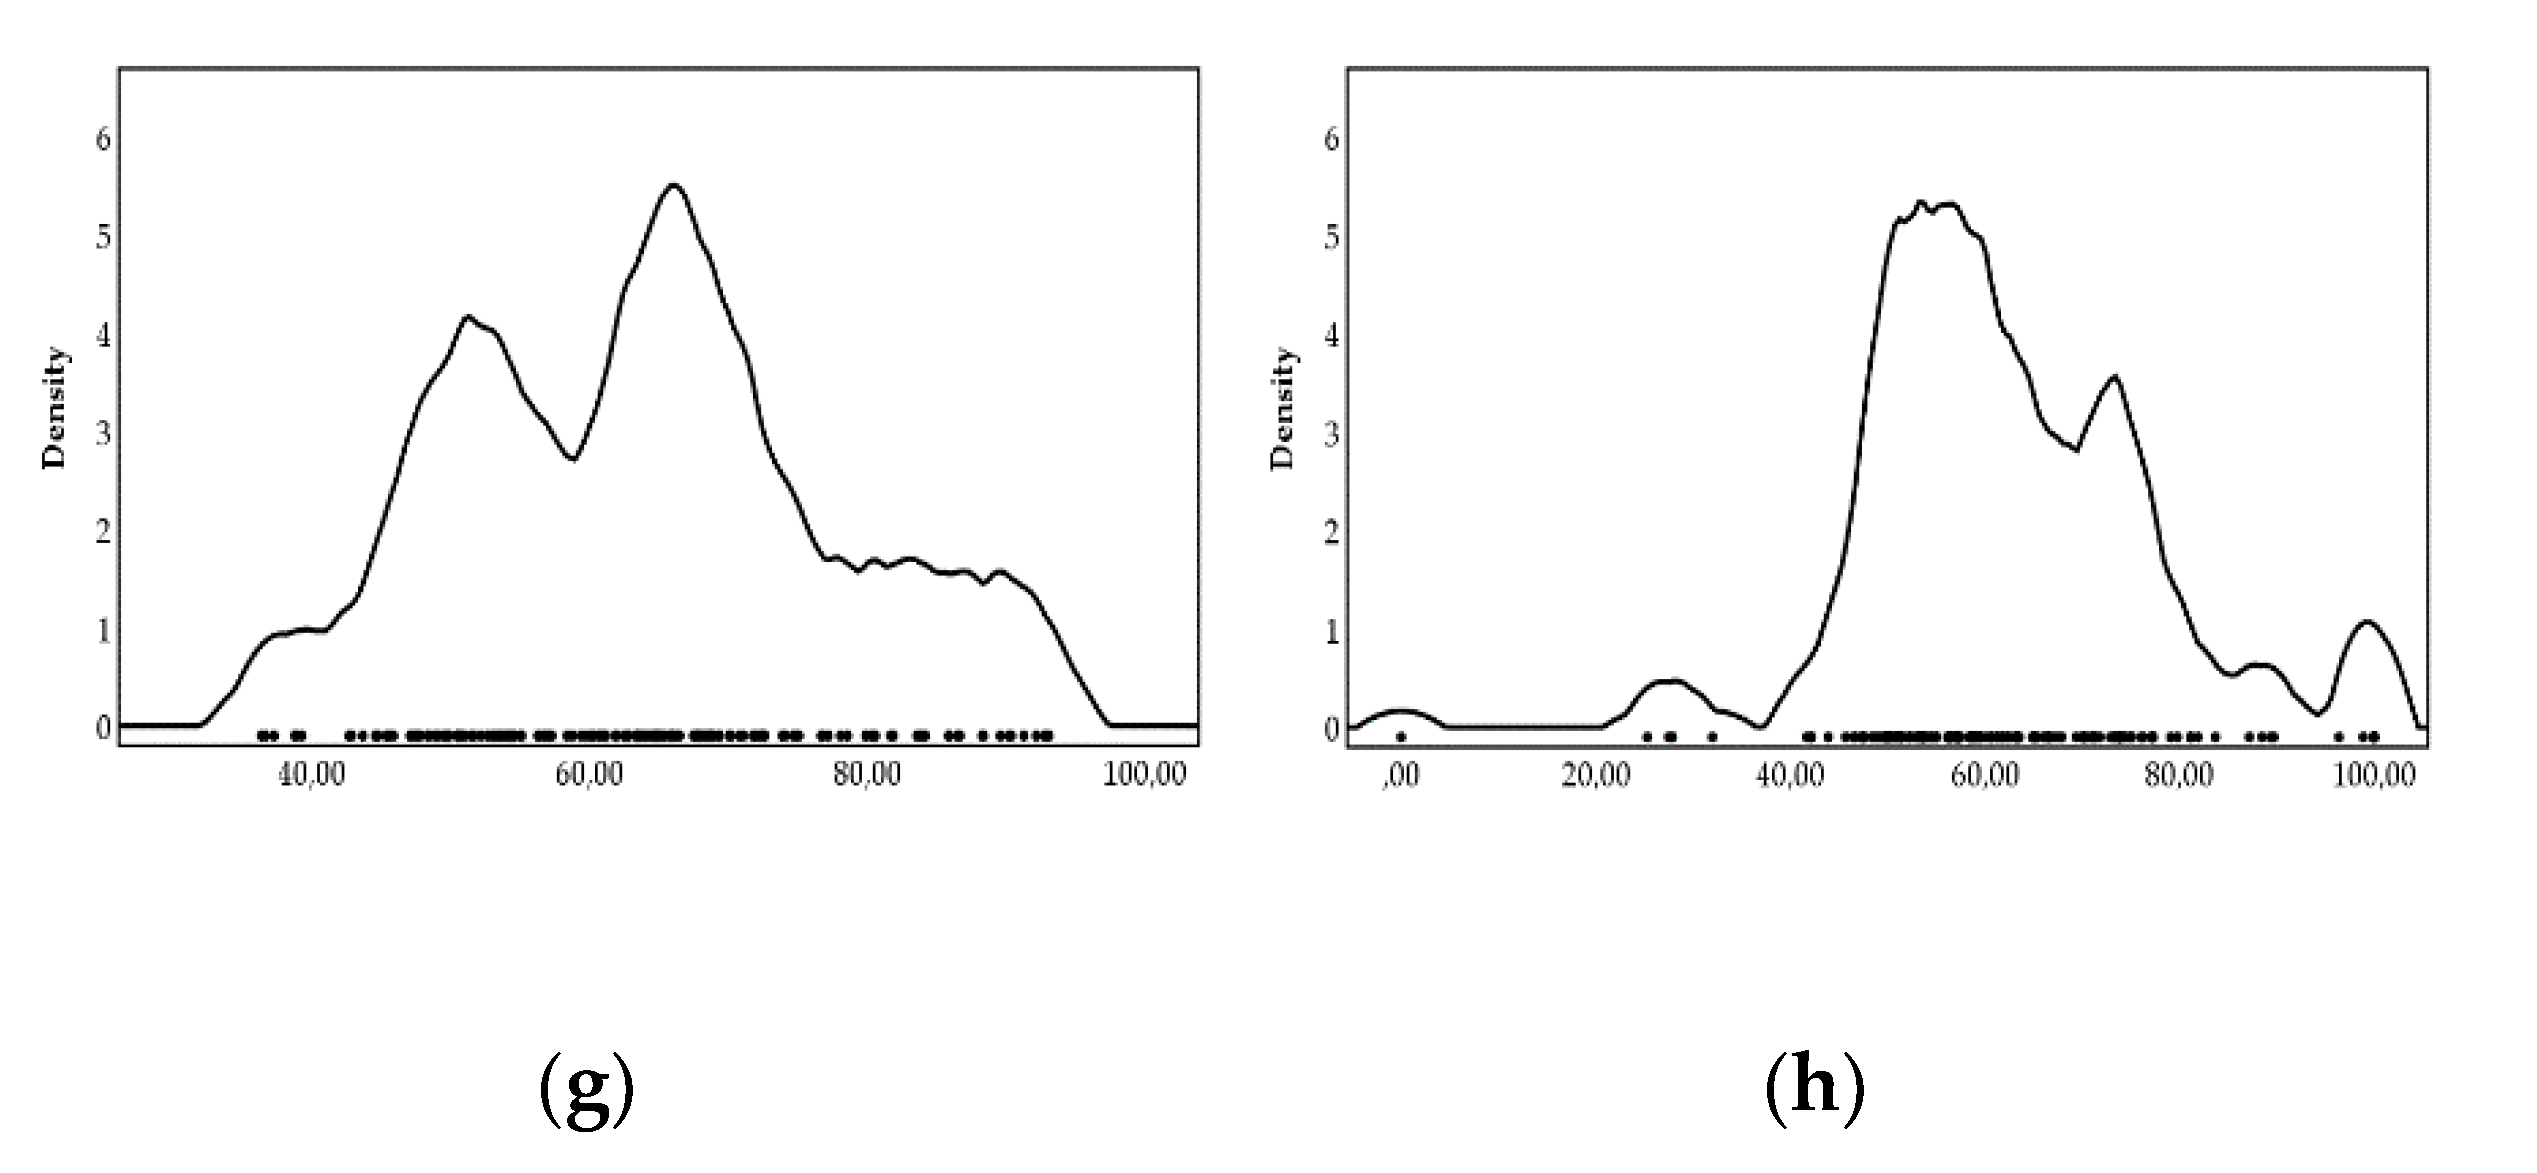
29] was chosen as data source for this analysis. The SDG-I aggregates indicators relate to each of the 17 SDGs and ‘average’ the results into a single metric. To check data normality, Kolmogorov-Smirnov Test was applied. The results of the K-S normality test highlighted that most SDGs do not follow a normal distribution (Table 3), so correlation coefficient Spearman’s Rho (that does not require normally distributed data and provides more robust results) was adopted.
Table 3. Kolmogorov-Smirnov test results.
In order to clarify the Kolmogorov-Smirnov test results, the Kernel density (a variation of the histogram) of each SDG variable was plotted. The Kernel density plots are visually depicted as smoothed curves estimating the probability density function of a continuous variable from a set of scores (likely comprising some error) (Figure 1 and Figure 2).
Figure 1. Kernel density and rug plots: (a) SDG1; (b) SDG2; (c) SDG3; (d) SDG4; (e) SDG5; (f) SDG6; (g) SDG7; (h) SDG8; (i) SDG9.
Figure 2. Kernel density and rug plots: (a) SDG10; (b) SDG11; (c) SDG12; (d) SDG 13; (e) SDG14; (f) SDG15; (g) SDG16; (h) SGD17.
The correlation coefficient measures the intensity of the relationship between ordinal variables and varies between -1 e 1. As near the values are from these extremes, the stronger is the linear association between the variables. The sign indicates the direction of the association between X (the independent variable) and Y (the dependent variable). If Y tends to increase when X increases, the correlation coefficient is positive. If Y tends to decrease when X increases, the correlation coefficient is negative. If the value is zero, this means there is no linear relationship between the variables. Statistical analysis was carried with SPSS Statistics Version 26, and the overall results, showing the existence of several significant relationships, are presented in Table 4.
Table 4. SDGS correlation analysis.

4. Results and Discussions

4.1. Kolmogorov-Smirnov Test Results

Based on the results presented in Table 3, there is not statistical evidence (considering a p-value < 0.05) that the variables SDG8, SDG10, SDG16 and SDG17 do not follow a normal distribution. However, these results do not provide a great deal of information on the actual statistical distribution, so the Kernel densities were plotted (Section 4.2).

4.2. Kernel Density and Rug Plots

Figure 1 and Figure 2 present the Kernel density plots and the rug plots for each SDG. It is possible to highlight that SDG1 (Figure 1a) is the benchmark based on the latest available results, i.e., a high density of countries report scores near the upper limit of the scale (positive asymmetry). Concerning the SDG8 (K-S test did not rule out a normal distribution) (Figure 1h), it is possible to observe that, indeed, the statistical distribution is not so asymmetric as the other variables in Figure 1 but a multimodal feature seems to be present. In addition, the visual representation of the data supported on the Kernel density function suggests that SDG9 (Figure 1i) presents the worst scores, i.e., a relevant negative asymmetry.
Concerning Figure 2 (variables SDG 10—Figure 2a to SDG 17—Figure 2h), it is possible to observe that, although the K-S test did not ruled out a Gaussian distribution regarding variables SDG10, SDG 15 and SDG 16, the actual statistical distribution seems to encompass several modes. In addition, a great deal of the statistical distributions depicted seem to present a positive asymmetry.

4.3. Correlation Analysis

The results of the correlation analysis identified several significant correlations between the SDGs, as presented in Table 4. With the purpose of allowing for an overall overview of the phenomenon, the correlation coefficients’ levels were classified according to the literature, as shown in Table 5 (Hinkle, Wersma and Jurs, [31]) and coded with colors for easy identification.
Table 5. Correlation levels classification.
Based on a meta-analysis of 65 global assessments comprising United Nations reports and international scientific assessments, and 112 scientific articles published since between 2015 and 2019 with explicit reference to the Sustainable Development Goals, the UN’s “The Future is Now: Science for Achieving Sustainable Development” report [28], identified a set of interactions (co-benefits to be harnessed) among the SDGs and the relative importance of the potential trade-offs among the SDGs. This analysis supports the view that there is a dominance of positive over negative interactions between the SDGs. However, there are significant gaps in knowledge. The result of this analysis is summarized in Table 6 below, overlapping the previous correlation analysis of Table 4 with the synoptic presented in Table 7.
Table 6. SDGs correlation analysis and UN (2019) SDGs’ interactions [28] (x axis influenced, y axis influencing goals) overlap analysis.
Table 7. Legend for interaction between SDGs (UN, 2019 [28]).
These results highlight that there is indeed dominance of positive over negative interactions between the SDGs, which is in line with “The Future is Now: Science for Achieving Sustainable Development” report [28]. The results also indicate that SDG2 (Zero hunger), SDG3 (Good health and well-being), SDG4 (Quality education), SDG7 (Affordable and clean energy), SDG8 (Decent work and economic growth), SDG9 (Industry, innovation, and infrastructure) and SDG11 (Sustainable cities and communities), present the highest number of strong positive correlation with other SDGs. While concerning trade-offs, SDG12 (Responsible consumption and production) is the one that shows more strong and moderate negative correlations with other SDGs.

5. Conclusions

The literature review and the assessment of the SDGs’ relationships confirm that there are indeed relevant interactions between the SDGs. However, the existence of blind spots recommends the need for further research on those interactions. While positive, the interactions between the SDGs are more numerous than the negative ones, considering such a complex system of relationships, synergies, and trade-offs represent a challenge for planners and decision-makers. In support of this view, the IPPC simulations show that there is no simulation where all the SDGs are reached [32]. Nevertheless, the relationships identified in these investigations represent an opportunity for policy and decision-makers, by suggesting the frequently linear development paths of economic growth ahead of social equity and environmental protection might be challenged by other systemic approaches, that offer multiple solutions and drivers for different contexts, as suggested by Biggeri et al. [19].
Barbier and Burgess [10] recommend prioritizing SDGs associated with the highest monetary returns and contributions to social welfare, e.g., childhood health, that generates significant returns due to long-term gains. Another possible approach is to prioritize the conservation of supporting ecosystems to avoid irreversible effects (e.g., actions to address climate change and global warming), and then optimize socio-economic goals taking into consideration the environmental constraints. Breuer et al. [33] identified several models and approaches that can support policy-makers to prioritize the SDGs. The World in 2050 model [34] conceptualizes the SDGs as delineated by the planetary boundaries, with global partnerships for sustainable development (SDG17) and governance (SDG16) providing the framework for the other SDGs, clustered into five main categories of SDGs: social and economic development (SDGs 8, 9, 11), universal values (SDGs 4, 5, 10), basic human needs (SDGs 1, 2, 3), and sustainable resource use (SDGs 6, 7, 12). However, the priorities can change within different development contexts, e.g., basic conditions of life in more developing countries, or sustainable resource use in more developed ones. Other simulation models like the World Economic Forecasting Model (WEFM), the iSDG model, developed by the Millennium Institute, can also support decision-makers and civil society stakeholders to visualize the long-term trajectory of their country’s current development path and help them to devise coherent alternative policies that are better suited to achieving the SDGs [33].
At the micro level, organizations emphasize the need to adopt more flexible and innovative approaches with a more substantial open systems perspective (influence of the environment, dynamic environment, need for survival), e.g., within those that adopt ISO International Standard Management Systems [35]. Moreover, authors such as Domingues et al. [36], Poltronieri et al. [37], and Rebelo et al. [38], stress the need for a systemic approach while reporting the efforts carried out to operationalize this integration process among the organizations, taking into account the needs and expectations of the stakeholders. The adoption of systemic and integrated approaches is, therefore, recommended at both the macro and the micro level to contribute to the SDGs.
Specifically concerning the correlation study, the results support Pradhan et al.’s [21] conclusions that Poverty elimination (SDG1) and health and well-being (SDG3) have a synergetic relationship with most of the other goals. There is also confirmation that SDG12 (Responsible consumption and production) is the goal most associated with trade-offs.
Accordingly, with the literature, SDG7 (Affordable and clean energy) has a significant relationship with other SDGs (e.g., SDG1 (No poverty), SDG2 (Zero hunger), SDG3 (Good health and well-being), SDG8 (Decent work and economic growth) and SDG13 (Climate action)), requiring coordinated policy interventions to protect the vulnerable, ensure equity and manage competing demands over natural resources to support sustainable development [26,28]. The correlation study confirmed the existence of strong positive correlations between SDG7 and SDG2 (Zero hunger), SDG3 (Good health and well-being), SDG4 (Quality education) and SDG9 (Industry, innovation, and infrastructure), highlighting the importance of the access to affordable and clean energy for economic, environmental and social performance. However, there is a moderate negative correlation with SDG12 (Responsible consumption and production), which emphasizes the need to improve energy efficiency, increase the share of clean and renewable energies and improve sustainable consumption patterns worldwide.
While there is also consistency between the correlation analysis and the UN study [28], e.g., relating to the relationships addressing synergies between SDG1 (Zero hunger), SDG01 (No poverty) and SDG3 (Good health and well-being), no significant relationships between SDG13, SDG14, SDG15 and SDG17 with other SDGs was found. Particularly in the case of SDG13 (Climate action), it is surprising no significant correlation with other SDGs was found. This is in line with Stafford-Smith et al. [13] who argue that there are still open issues regarding SDG performance measurements, operationalization, and interlinkages.
Relating to the existence of negative relationships (trade-off), the correlation result supports Pradhan et al. [21], since SDG12 (Responsible consumption and production) is the goal most associated with trade-offs. However, the trade-offs identified in the UN study [28] are not confirmed by the correlation results.
An overall conclusion is that effective action for the advancement of the SDGs and, ultimately, sustainable development for all, demands that the relationships between the SDGs must be identified and tackled, e.g., the connections between No poverty and Zero hunger, and Good health and well-being, or between climate change and human health. This should lead to the increased relevance of SDG17 (Partnerships for the goals) and more intense and effective cooperation between governments, institutions, agencies, private sector and public organizations, and society at large, across different industries, locations, and levels.
A common support of that relevance is developing a sustainable intellectual capital [39], based on knowledge dynamics [40], at the organizations’ and communities’ levels.
To sum up, this research suggests that change towards achieving the Sustainable Development Goals offers many opportunities for reinforcing rather than inhibiting itself. Moreover, as The World Health Organization (WHO) declared a public health emergency of international concern over the global outbreak of COVID-19 (30th January 2020) and escalated it to a global pandemic on 11th March 2020 [41], we are once more reminded that we do live in one global and interconnected world. Hence the relevance of the SDGs’ framework. The limitation of the correlation analysis, and the potential problems related to the use of an index based on the arithmetic mean (which assumes that different targets and indicators are perfect substitutes for each other, without accounting for positive synergies or negative externalities, as stated by Biggeri et al. [19]) should be acknowledged. These limitations recommend the replication of this investigation with more powerful statistical techniques and a longitudinal perspective.

Author Contributions

Conceptualization, L.M.F.; methodology, L.M.F.; software, J.P.D. carried out the data analysis through the IBM SPSS 26; validation, formal analysis, investigation, resources and data curation, L.M.F., J.P.D., and A.M.D.; writing—original draft preparation, L.M.F. and A.M.D.; writing—review and editing, visualization, supervision, project administration and funding acquisition, L.M.F., J.P.D., and A.M.D.. All authors have read and agreed to the published version of the manuscript.

Funding

CIDEM: R&D unit is funded by the FCT—Portuguese Foundation for the Development of Science and Technology, Ministry of Science, Technology, and Higher Education, under the Project UID/EMS/0615/2019. Pedro Domingues (ALGORITMI Research Centre) benefited from financial support by FCT–Fundação para a Ciência e Tecnologia within the R&D Units Project Scope: UIDB/00319/2020.

Acknowledgments

Acknowledgements are due to the “how2stats” Youtube channel (https://www.youtube.com/user/how2stats/featured).

Conflicts of Interest

The authors declare no conflict of interest.

References

  1. United Nations Brundtland Report. Report of the World Commission on Environment and Development: Our Common Future. 1987. Available online: http://www.undocuments.net/our-common-future.pdf (accessed on 19 November 2019).
  2. Elkington, J. Cannibals with Forks: The Triple Bottom Line of 21st Century Business; John Wiley and Sons: London, UK, 1987. [Google Scholar]
  3. United Nations. Agenda for Development; UN: New York, NY, USA, 1997. [Google Scholar]
  4. Dima, A.M.; Brătianu, C.; Glaser-Segura, D.; Voges, K. Bologna process trade-offs. The perception of the Romanian academic staff. Manag. Mark. Chall. Knowl. Soc. 2011, 6, 123–138. [Google Scholar]
  5. Păunescu, C. Challenges of entering the business market: The pre-entry knowledge and experience. Manag. Mark. Chall. Knowl. Soc. 2013, 8, 63–78. [Google Scholar]
  6. Anagnoste, S. Robotic Automation Process—The next major revolution in terms of back office operations improvement. In Proceedings of the 11th International Conference on Business Excellence; De Gruyter: Berlin, Germany, 2017; pp. 676–686. [Google Scholar] [CrossRef]
  7. Tanţău, A.D.; Nichifor, M.N. Specific business models in the wind energy field in the European Union: Comparative study on Romania and Germany. Manag. Mark. Chall. Knowl. Soc. 2014, 9, 301–316. [Google Scholar]
  8. Fonseca, L.; Lima, V. Countries three Wise Men: Sustainability, Innovation, and Competitiveness. J. Ind. Eng. Manag. 2015, 8, 1288–1302. [Google Scholar] [CrossRef]
  9. Transforming Our World: The 2020 Agenda for Sustainable Development; United Nations General Assembly: New York, NY, USA, 2015.
  10. Barbier, E.B.; Burgess, J.C. The Sustainable Development Goals and the Systems Approach to Sustainability; Economics Discussion Papers, No 2017-28; Kiel Institute for the World Economy: Kiel, Germany, 2017. [Google Scholar]
  11. Fonseca, L.; Carvalho, F. The Reporting of SDGs by Quality, Environmental, and Occupational Health and Safety-Certified Organizations. Sustainability 2019, 11, 5797. [Google Scholar] [CrossRef]
  12. UN-SDGs. United Nations Sustainable Development Goals Platform. 2019. Available online: https://sustainabledevelopment.un.org/?menu¼1300 (accessed on 4 February 2020).
  13. Stafford-Smith, M.; Griggs, D.; Gaffney, O.; Ullah, F.; Reyers, B.; Kanie, N.; Stigson, B.; Shrivastava, P.; Leach, M.; O’Connell, D. Integration: The key to implementing the Sustainable Development Goals. Sustain. Sci. 2017, 12, 911–919. [Google Scholar] [CrossRef]
  14. Barbier, E.B.; Burgess, J.C. Sustainable development goal indicators: Analyzing trade-offs and complementarities. World Dev. 2019, 122, 295–305. [Google Scholar] [CrossRef]
  15. Sachs, J.D. From millennium development goals to sustainable development goals. Lancet 2012, 379, 2206–2211. [Google Scholar] [CrossRef]
  16. United Nations. The Sustainable Development Goals Report 2018; United Nations: New York, NY, USA; Available online: https://unstats.un.org/sdgs/report/2018 (accessed on 4 February 2020).
  17. Scherera, L.; Behrensa, P.; De Koninga, A.; Heijungsa, R.; Sprechera, B.; Tukkera, A. Trade-offs between social and environmental Sustainable Development Goals. Environ. Sci. Policy 2018, 90, 65–72. [Google Scholar] [CrossRef]
  18. Des Gasper. The road to the Sustainable Development Goals: Building global alliances and norms. J. Glob. Ethics 2019, 15, 118–137. [Google Scholar] [CrossRef]
  19. Biggeri, M.; Clark, D.A.; Ferrannini, A.; Mauro, V. Tracking the SDGs in an integrated manner: A proposal for a new index to capture synergies and trade-offs between and within goals. World Dev. 2019, 122, 628–647. [Google Scholar] [CrossRef]
  20. Allen, C.; Metternicht, G.; Wiedmann, T. Initial progress in implementing the Sustainable Development Goals (SDGs): A review of evidence from countries. Sustain. Sci. 2018, 13, 1453–1467. [Google Scholar] [CrossRef]
  21. Pradhan, P.; Costa, L.; Rybski, D.; Lucht, W.; Kropp, J.P. A systematic study of Sustainable Development Goal (SDG) interactions. Earth’s Future 2017, 5, 1169–1179. [Google Scholar] [CrossRef]
  22. Nilsson, M.; Griggs, D.; Visbeck, M. Policy: Map the interactions between Sustainable Development Goals. Nature 2016, 534, 320–322. [Google Scholar] [CrossRef]
  23. Aguiar, M.; Bils, M. Has consumption inequality mirrored income inequality? Am. Econ. Rev. 2015, 105, 2725–2756. [Google Scholar] [CrossRef]
  24. Ivanova, D.; Stadler, K.; Steen-Olsen, K.; Wood, R.; Vita, G.; Tukker, A.; Hertwich, E.G. Environmental impact assessment of household consumption. J. Ind. Ecol. 2016, 20, 526–536. [Google Scholar] [CrossRef]
  25. Fuso-Nerini, F.; Tomei, J.; To, L.S.; Bisaga, I.; Parikh, P.; Black, M.; Mulugetta, Y. Mapping synergies and trade-offs between energy and the Sustainable Development Goals. Nat. Energy 2017, 3, 10–15. [Google Scholar] [CrossRef]
  26. ICSU. A Guide to SDG Interactions: From Science to Implementation; International Council for Science: Paris; Available online: https://council.science/publications/a-guide-to-sdg-interactions-from-science-to-implementation/ (accessed on 11 September 2019).
  27. Singha, G.G.; Cisneros-Montemayora, A.M.; Swartzb, W.; Cheunga, W.; Guyc, J.A.; Otak, Y. A rapid assessment of co-benefits and trade-offs among Sustainable Development Goals. Mar. Policy 2018, 93, 223–231. [Google Scholar] [CrossRef]
  28. Development Report. In The Future is Now—Science for Achieving Sustainable Development; United Nations: New York, NY, USA, 2019; Available online: https://sustainabledevelopment.un.org/content/documents/24797GSDR_report_2019.pdf (accessed on 4 February 2020).
  29. Sachs, J.; Schmidt-Traub, G.; Kroll, C.; Lafortune, G.; Fuller, G. SDG Index and Dashboards Report 2018; Bertelsmann Stiftung and Sustainable Development Solutions Network: New York, NY, USA, 2018. [Google Scholar]
  30. Sachs, J.; Schmidt-Traub, G.; Kroll, C.; Durand-Delacre, D.; Teksoz, K. SDG Index and Dashboards Report 2017; Bertelsmann Stiftung and Sustainable Development Solutions Network (SDSN): New York, NY, USA, 2017. [Google Scholar]
  31. Hinkle, D.E.; Wiersma, W.; Jurs, S. Applied Statistics for the Behavioral Sciences, 5th ed.; Houghton Mifflin: Boston, MA, USA, 2003. [Google Scholar]
  32. IPCC. Special Report: Global Warming of 1.5 C 2018. Available online: https://www.ipcc.ch/sr15/ (accessed on 4 April 2020).
  33. Breuer, A.; Janetschek, H.; Malerba, D. Translating Sustainable Development Goal (SDG) Interdependencies into Policy Advice. Sustainability 2019, 11, 2092. [Google Scholar] [CrossRef]
  34. The World in 2050 (TWI2050). A Global Research Initiative in Support of a Successful Implementation of the United Nations 2030 Agenda. Brochure, International Institute for Applied Systems Analysis (IIASA), Laxenburg, Austria. Available online: http://www.iiasa.ac.at/web/home/research/twi/TWI2050_brochure.pdf (accessed on 20 February 2019).
  35. Fonseca, L.M. ISO 9001 quality management systems through the lens of organizational culture. Qual. Access Success 2015, 16, 54–59. [Google Scholar]
  36. Domingues, P.; Sampaio, P.; Arezes, P. Integrated Management Systems Assessment: A maturity model proposal. J. Clean. Prod. 2016, 124, 164–174. [Google Scholar] [CrossRef]
  37. Poltronieri, C.F.; Ganga, G.M.D.; Gerolamo, M.C. Maturity in management system integration and its relationship with sustainable performance. J. Clean. Prod. 2019, 207, 236–247. [Google Scholar] [CrossRef]
  38. Rebelo, M.F.; Santos, G.; Silva, R. Integration of management systems: Towards a sustained success and development of organizations. J. Clean. Prod. 2016, 127, 96–111. [Google Scholar] [CrossRef]
  39. Bratianu, C. Intellectual capital research and practice: 7 myths and one golden rule. Manag. Mark. Chall. Knowl. Soc. 2018, 13, 859–879. [Google Scholar] [CrossRef]
  40. Bratianu, C.; Bejinaru, R. Knowledge dynamics: A thermodynamics approach. Kybernetes 2020, 49, 6–21. [Google Scholar] [CrossRef]
  41. Coronavirus Disease (COVID-19) Outbreak. Available online: https://www.who.int (accessed on 22 March 2020).

Article Metrics

Citations

Article Access Statistics

Multiple requests from the same IP address are counted as one view.