A Typhoon Shelter Selection and Evacuee Allocation Model: A Case Study of Macao (SAR), China

Abstract
1. Introduction
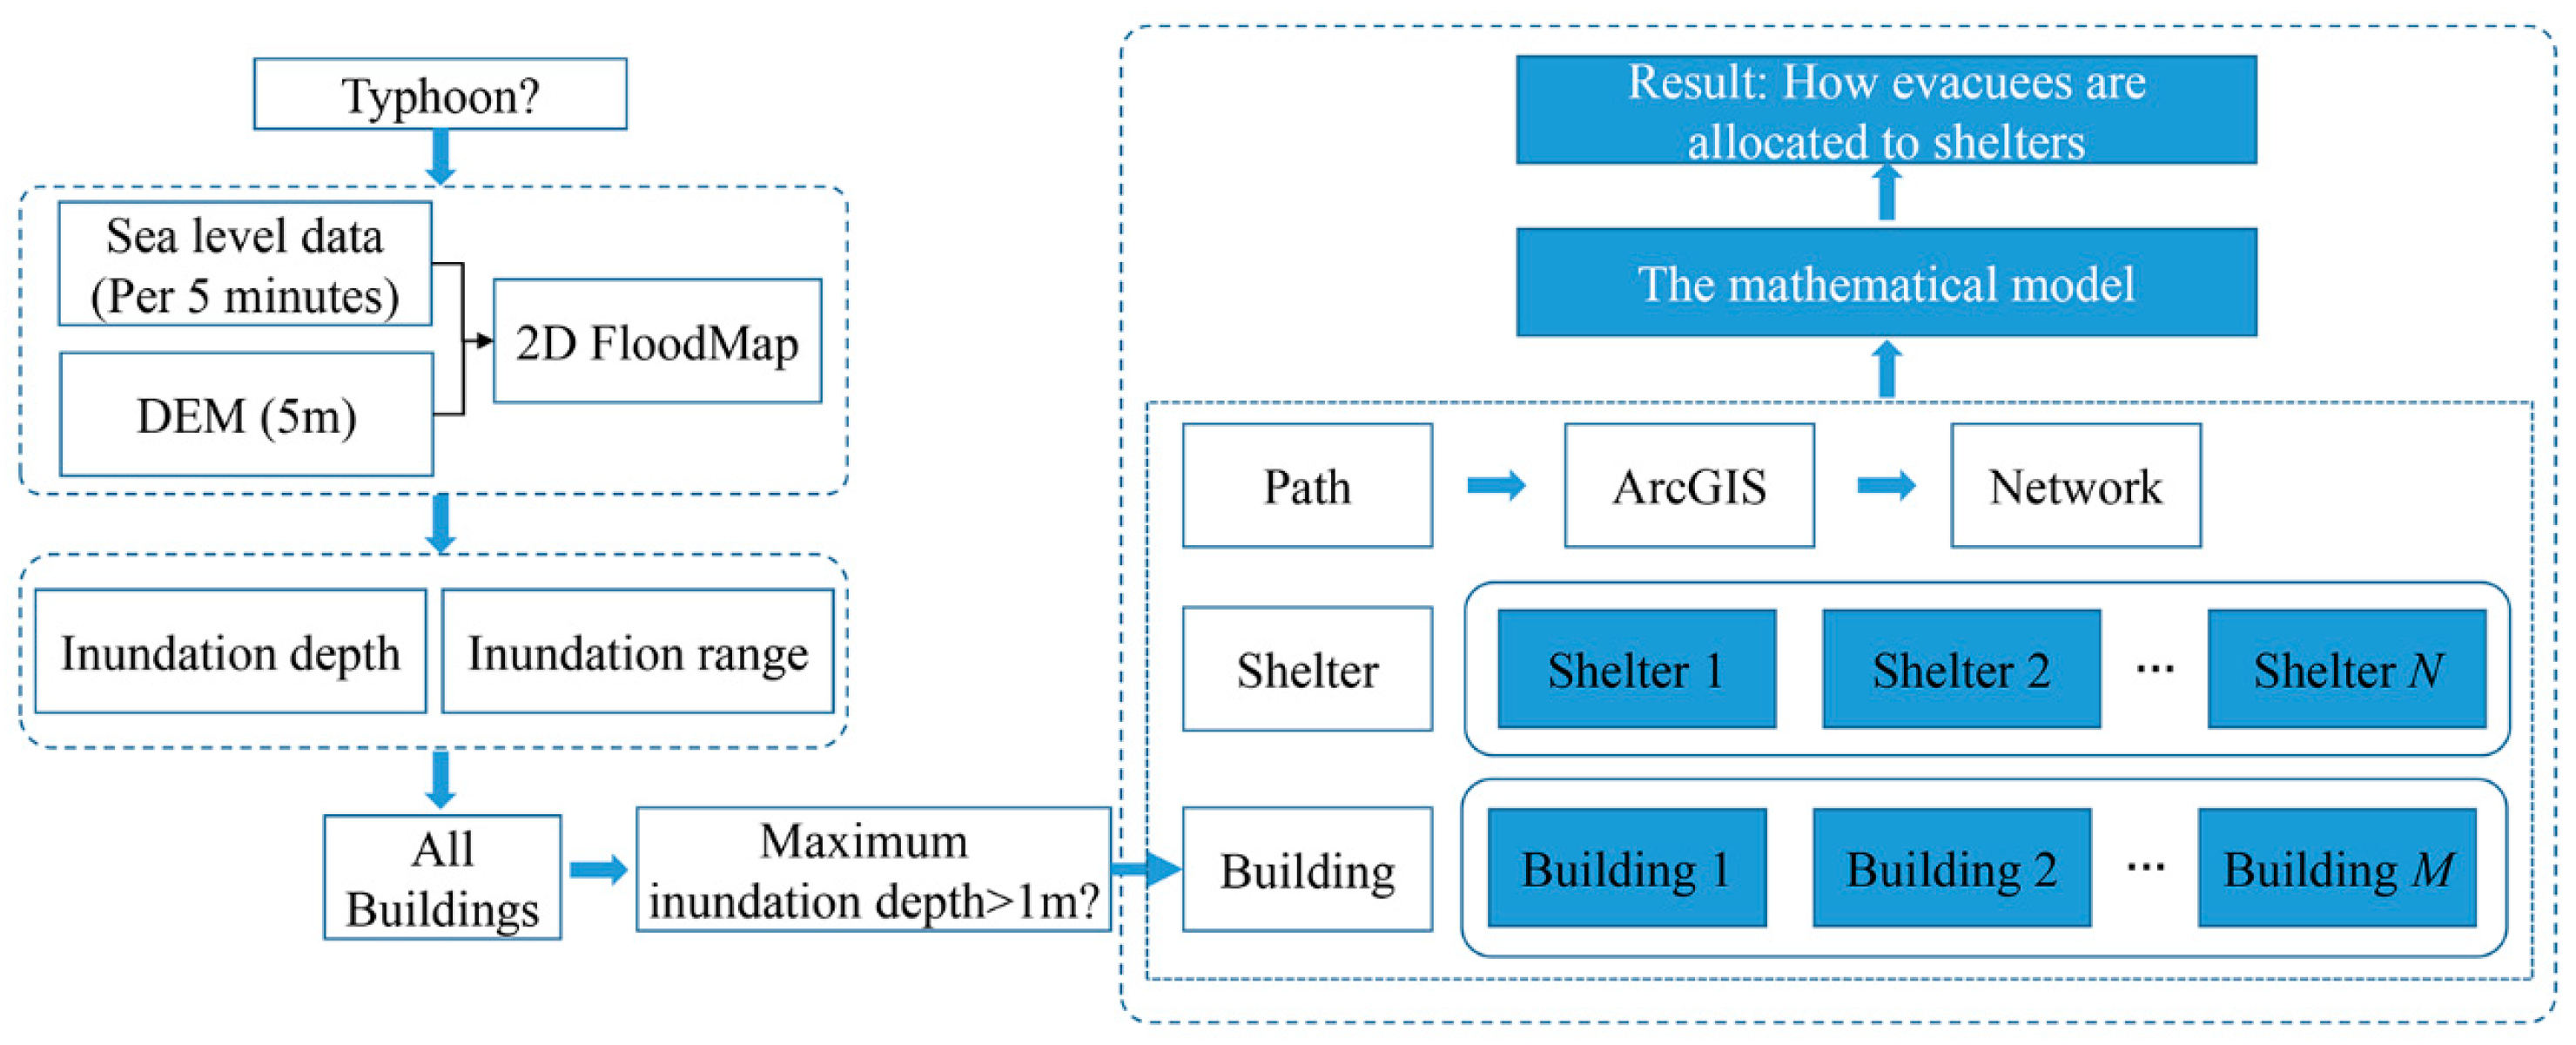
2. Method
- (1)
- Residents of a given building will be allocated to the same shelter;
- (2)
- Residents will go to their assigned shelters along the shortest possible route;
- (3)
- Residents will be allocated to shelters if the maximum inundation depths of their buildings exceed 1 m.
2.1. Mathematical Model for Evacuee Allocation
- j: Index of building, equal to 1, 2, …, M
- k: Index of shelter, equal to 1, 2, …, N
- dkj: Shortest evacuation route distance from building j to shelter k
- Bkj: Whether building j is assigned to shelter k (1 = yes, 0 = no)
- Dj: The maximum evacuation distance that residents in building j can travel
- Xk: Whether shelter k is selected (1 = yes, 0 = no)
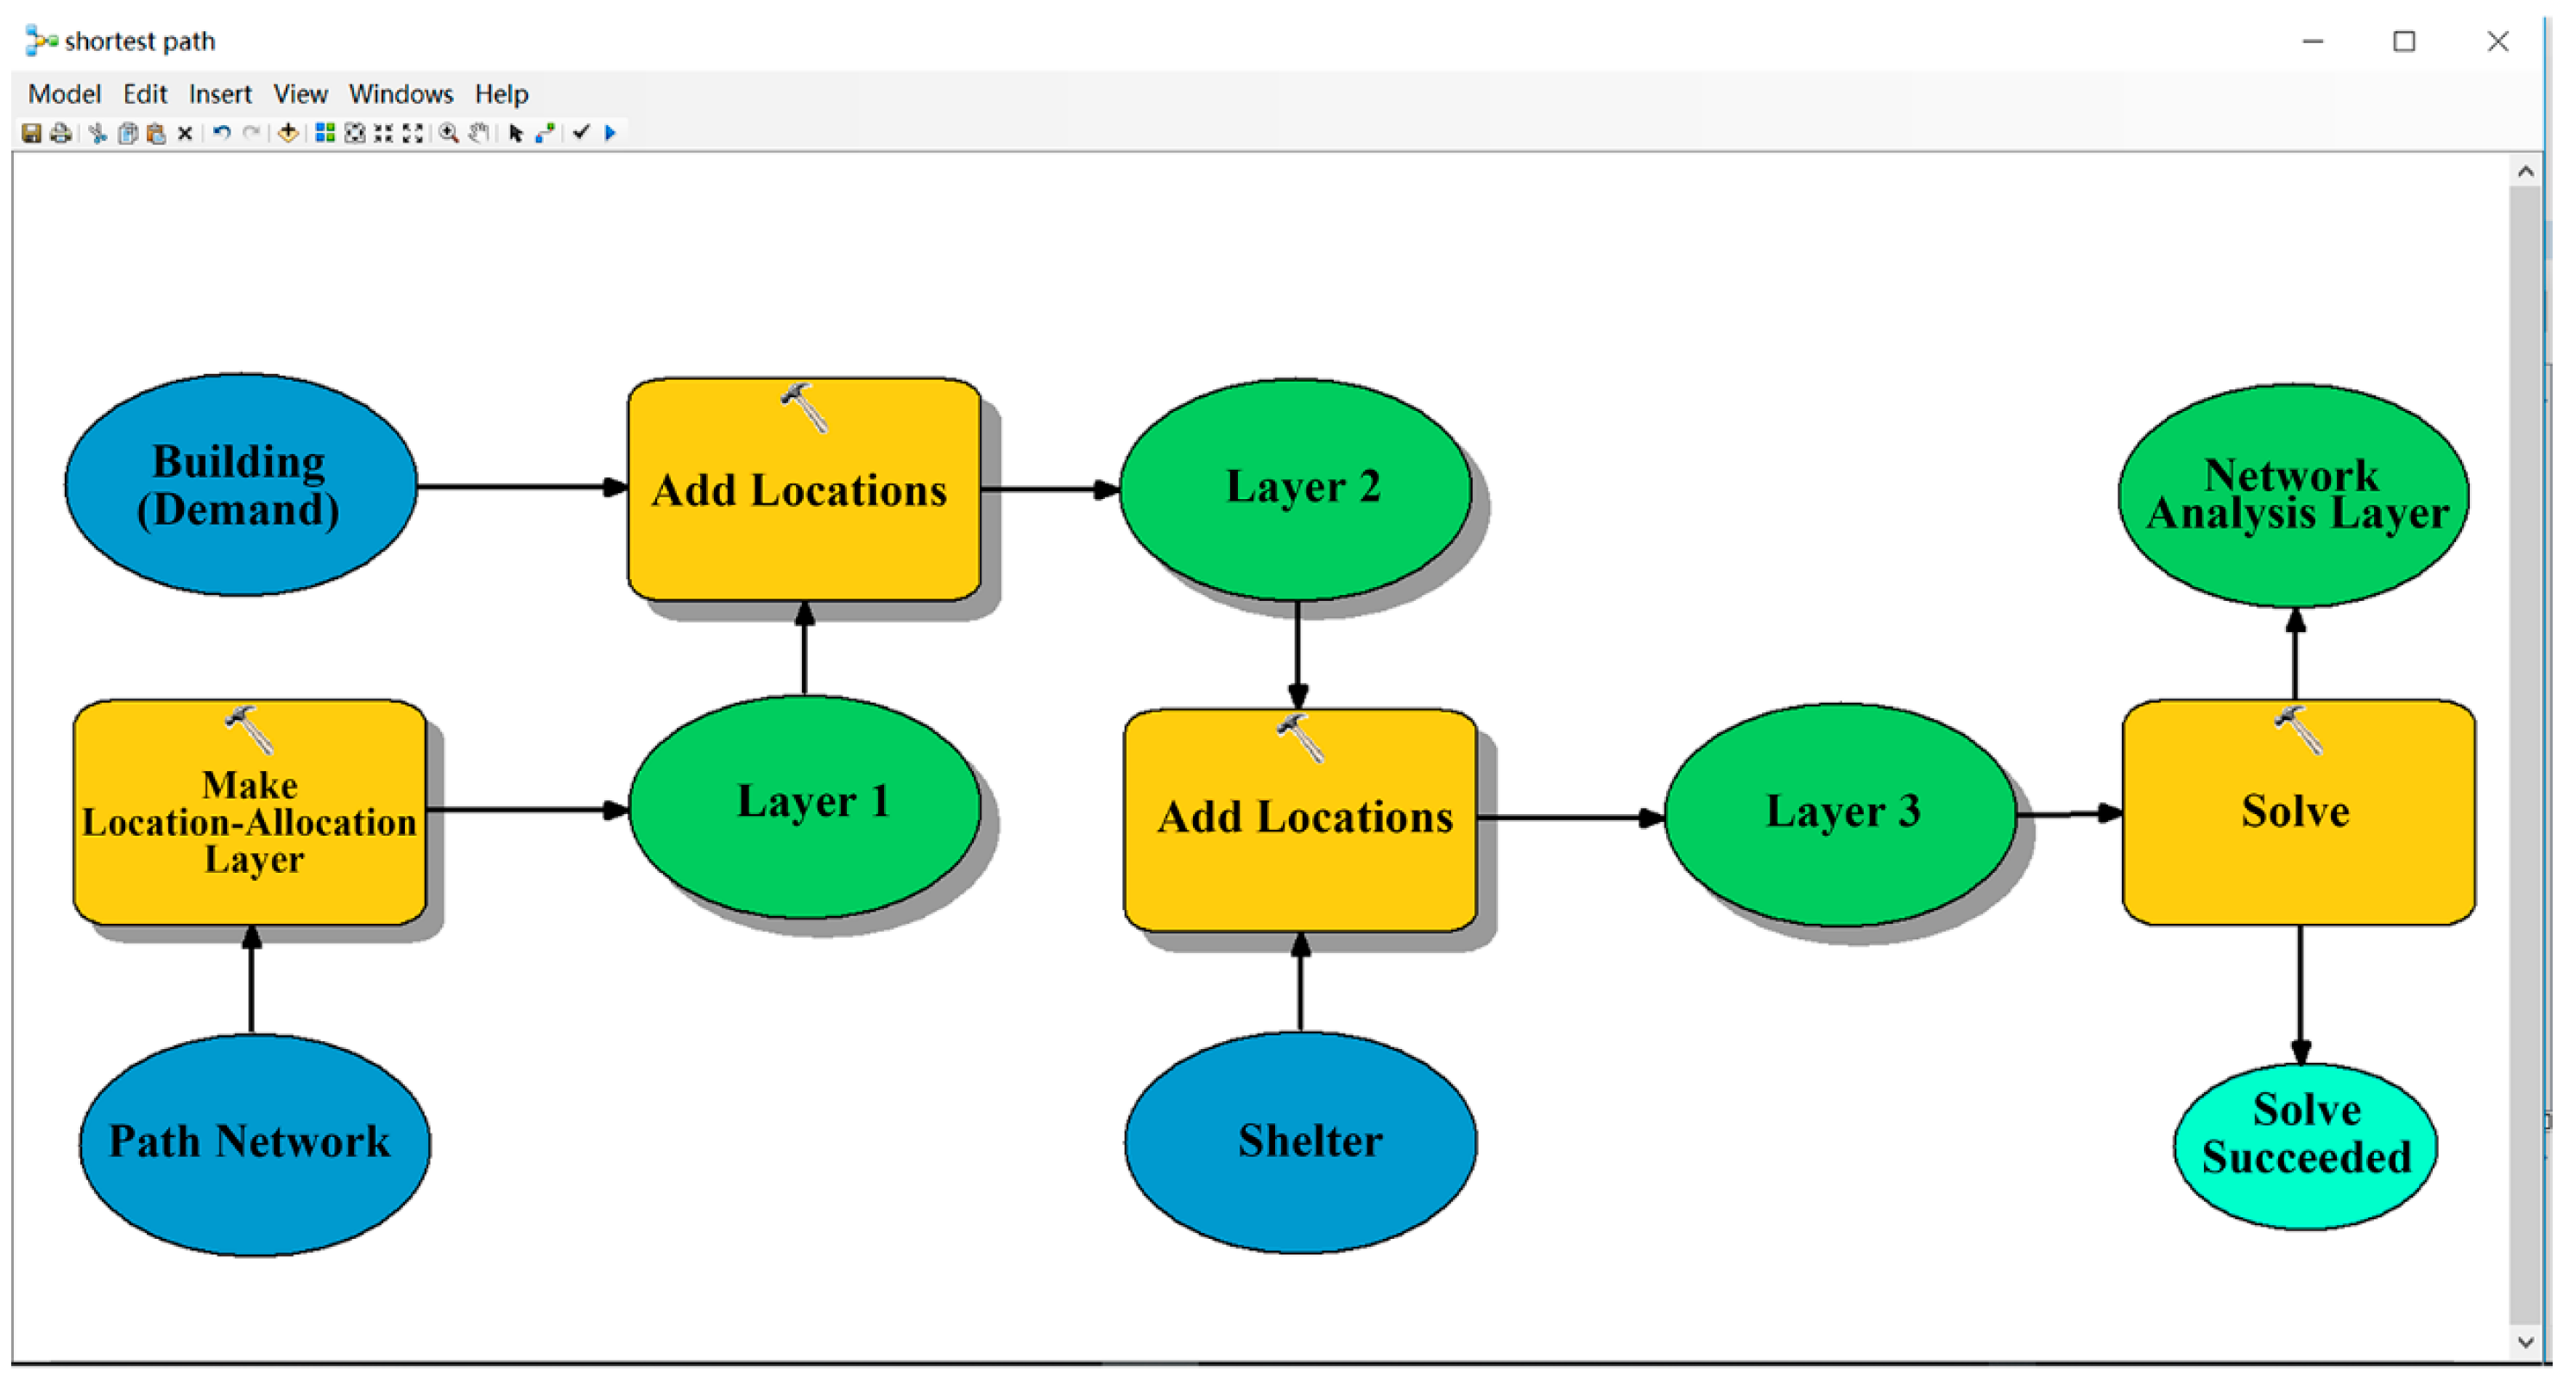
2.2. Solver Model Made by GIS Model Builder
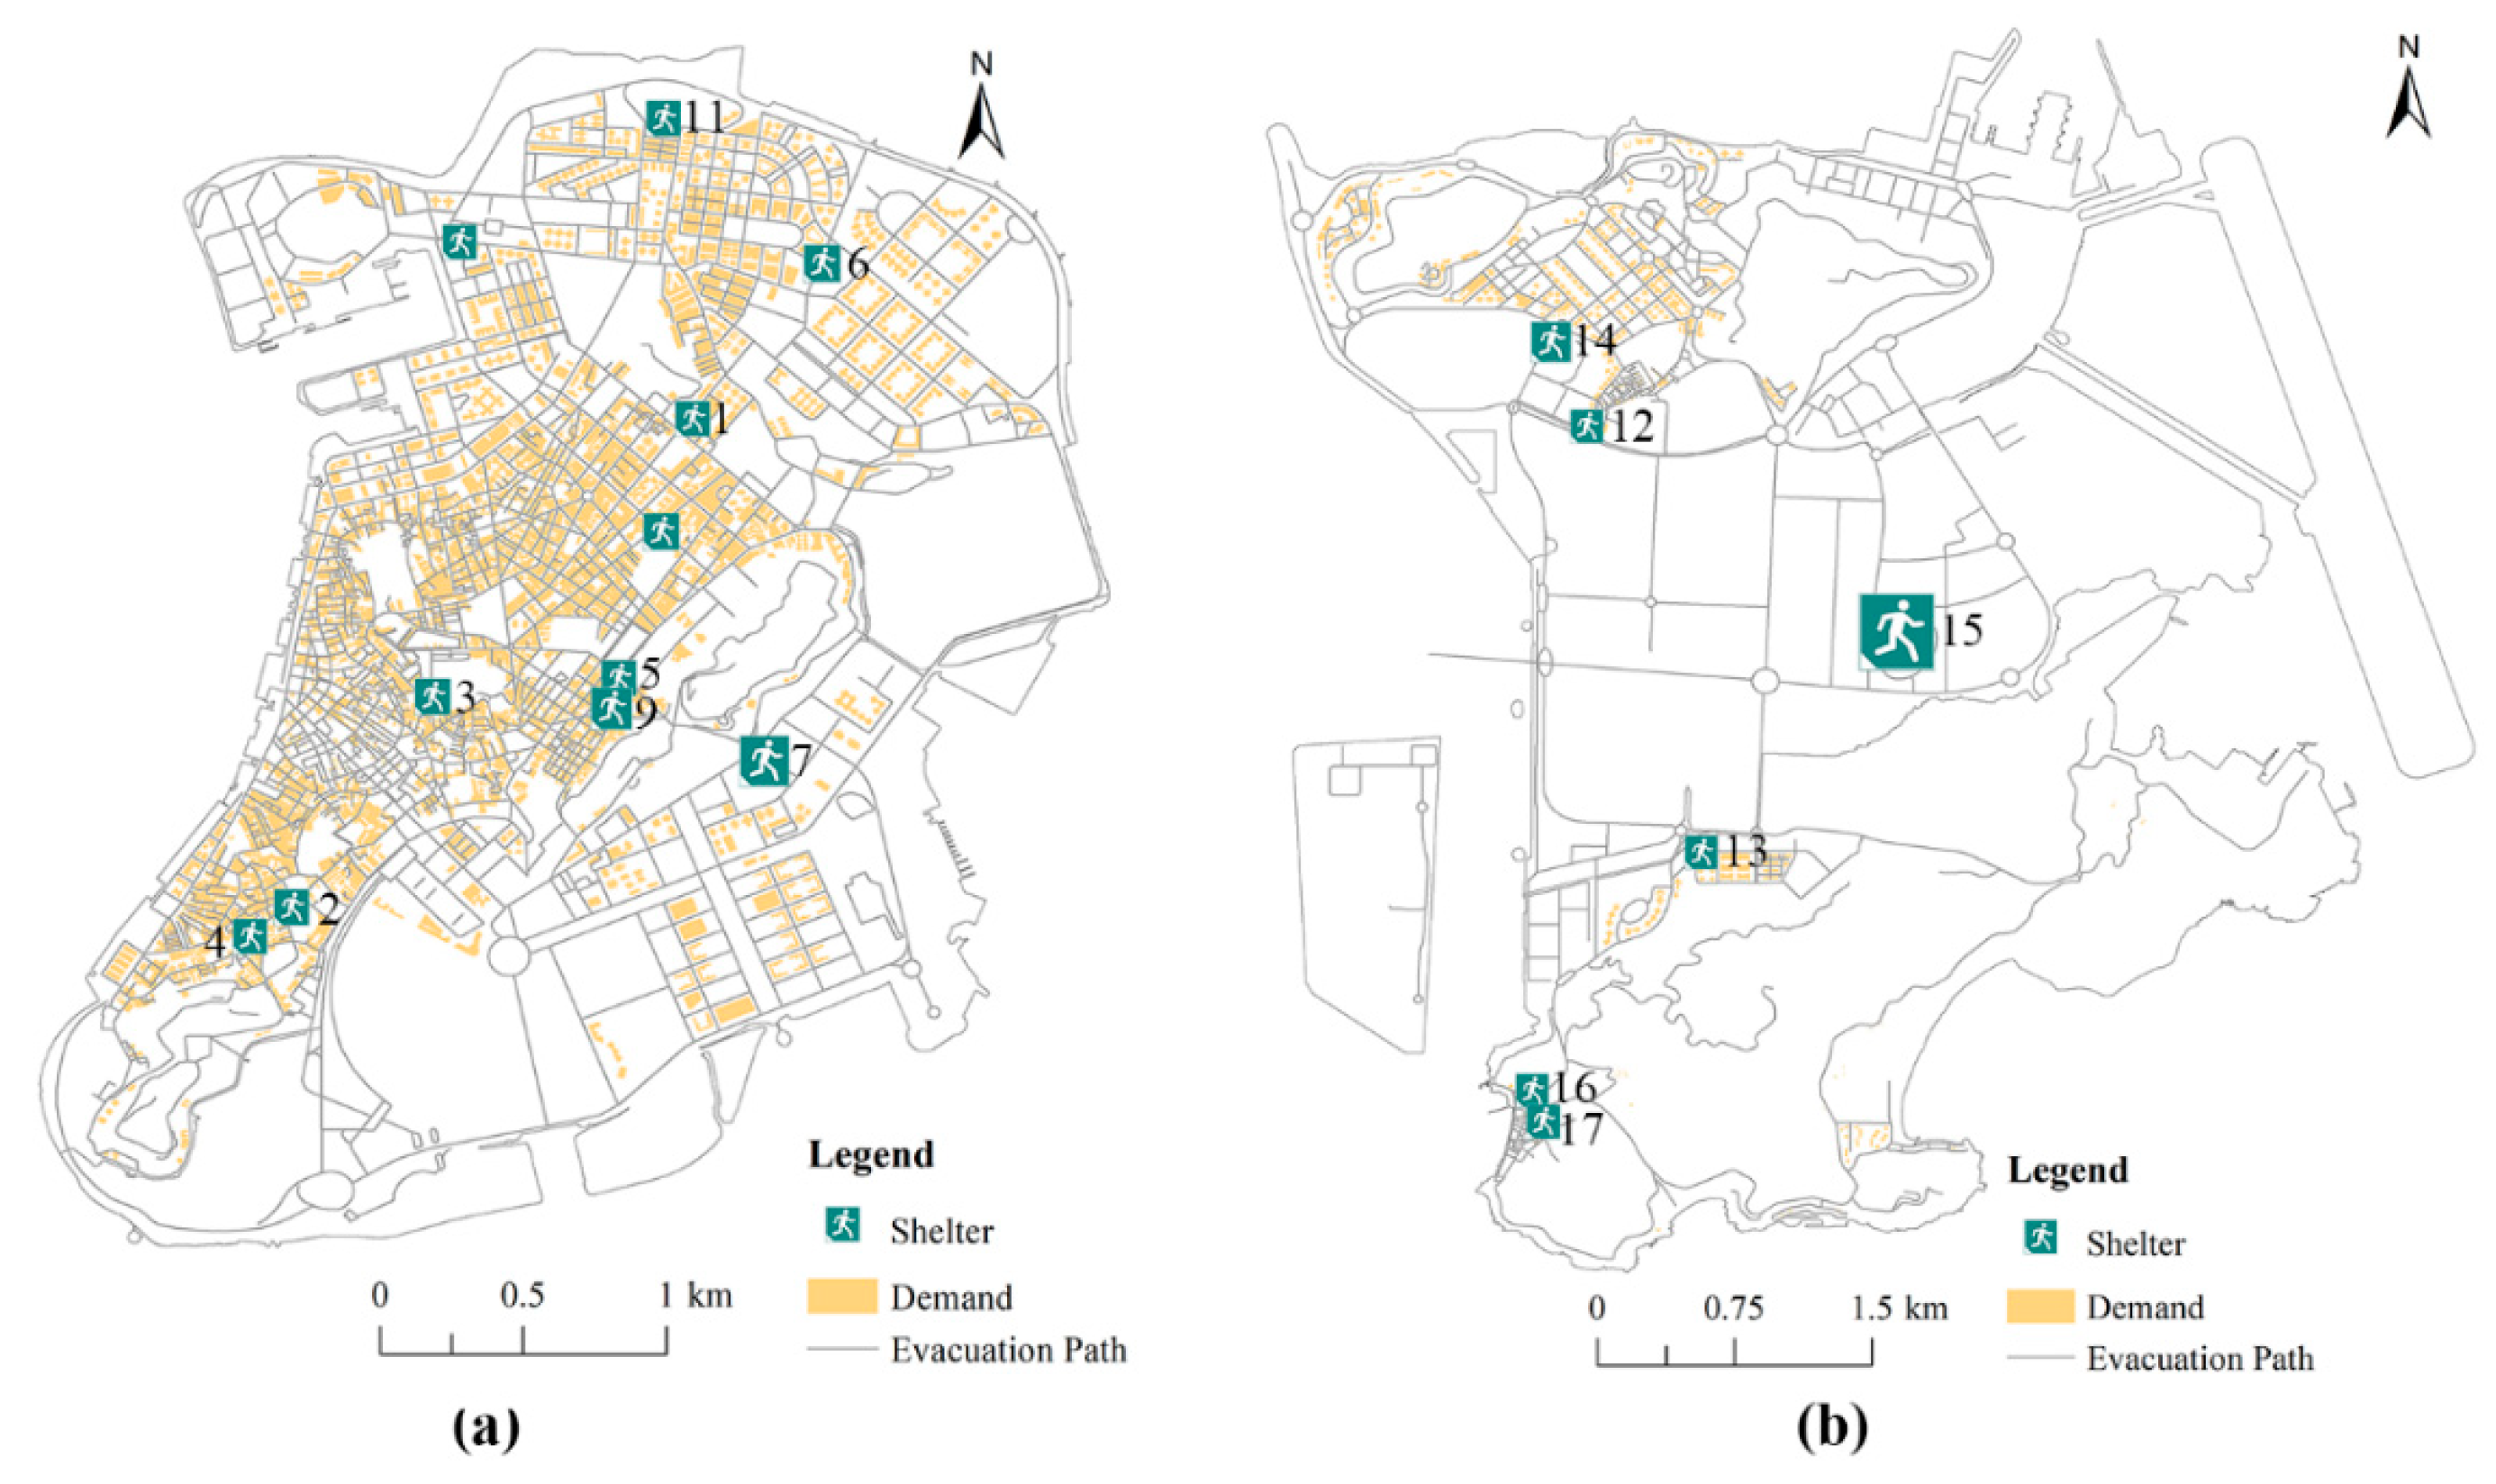
3. Case Study
4. Results and Discussion
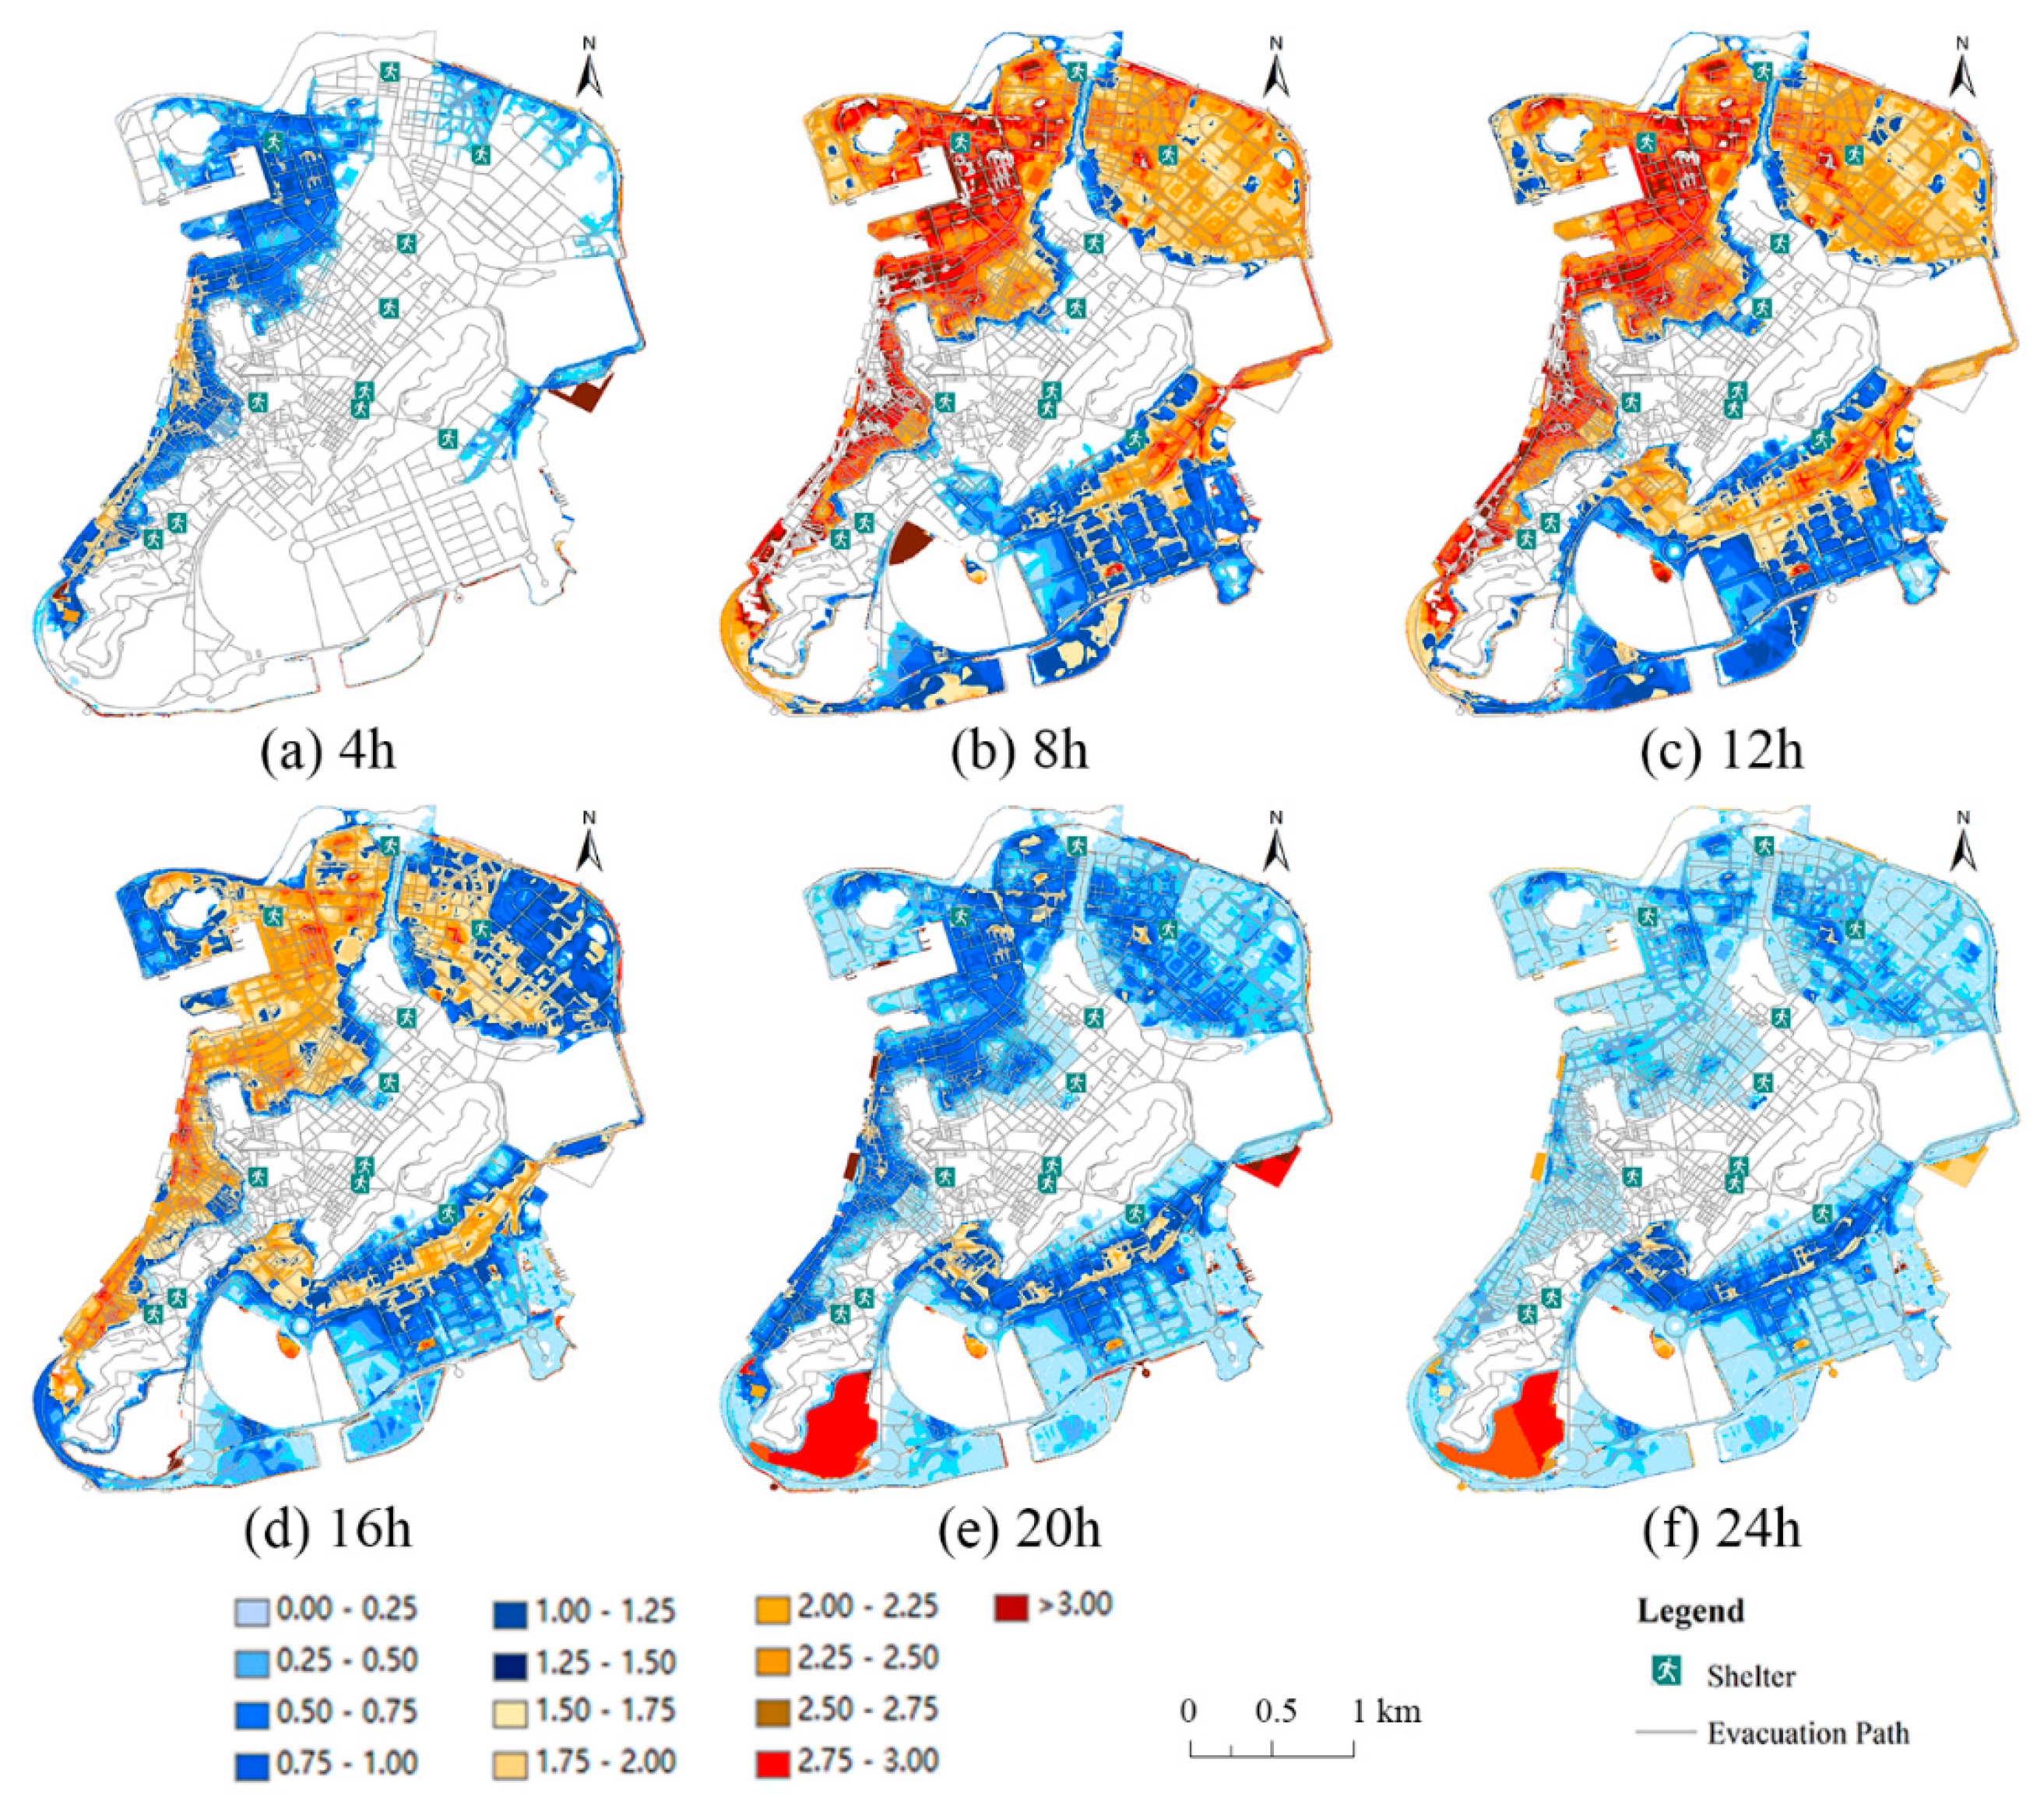
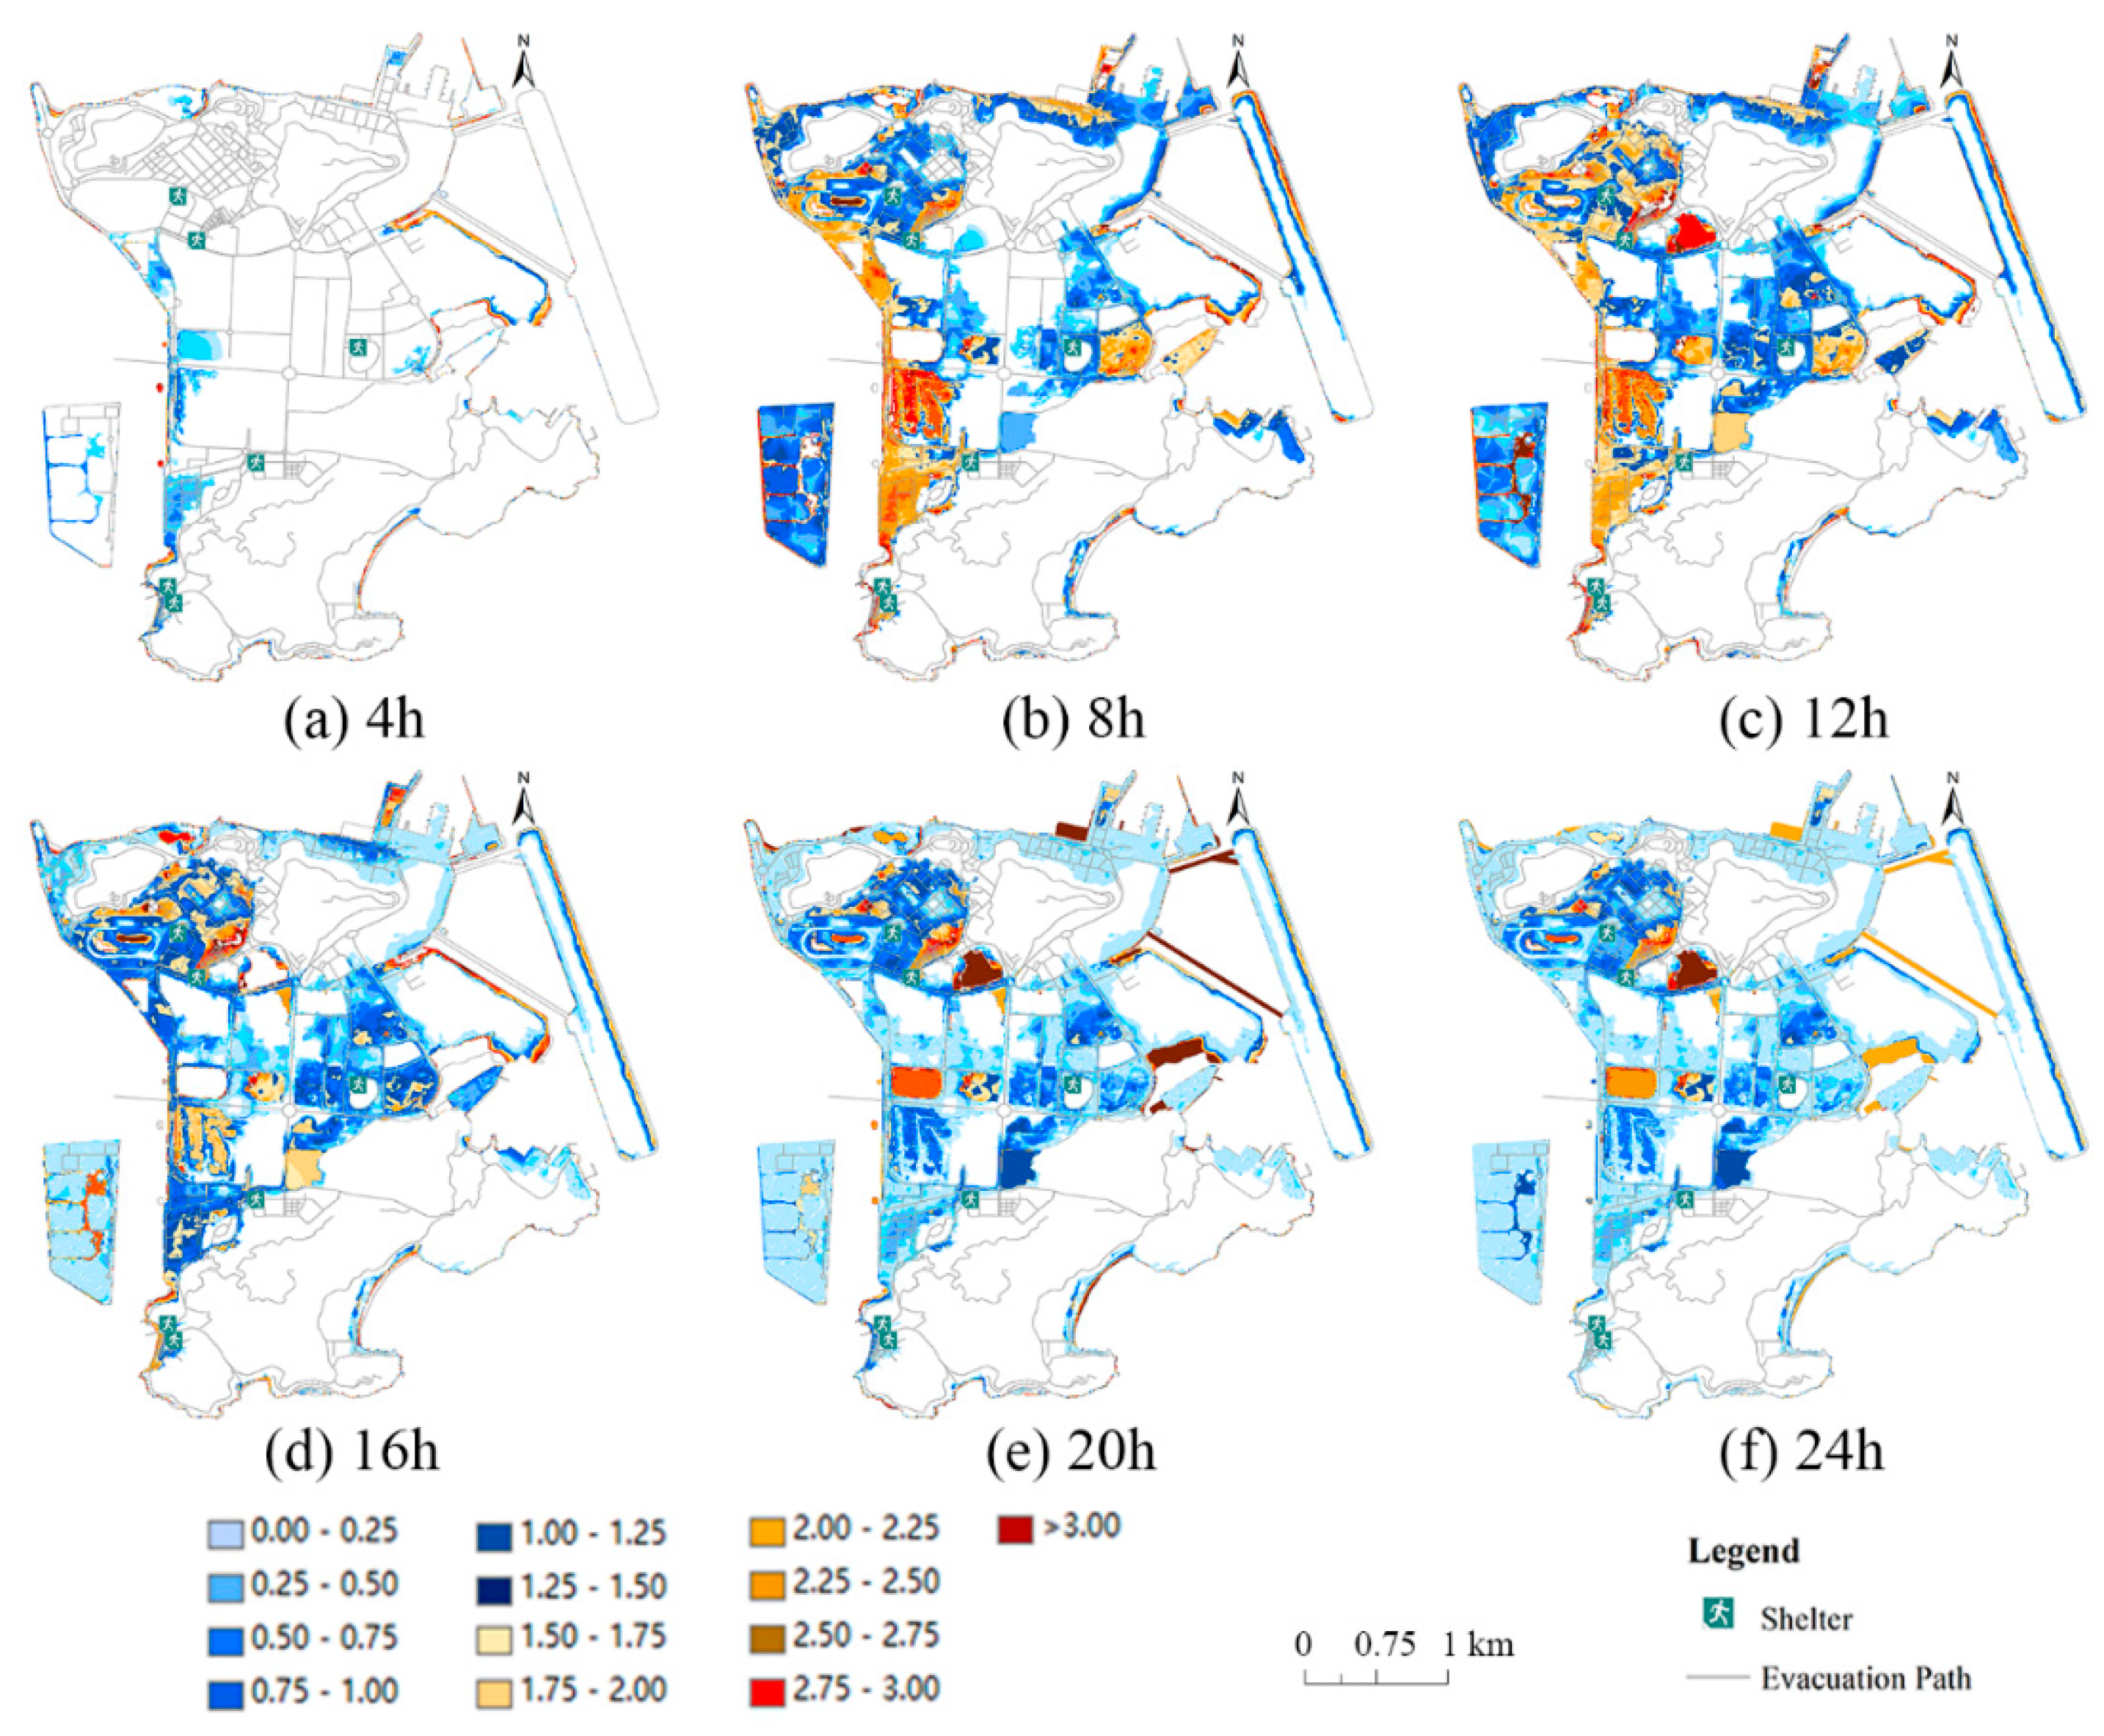
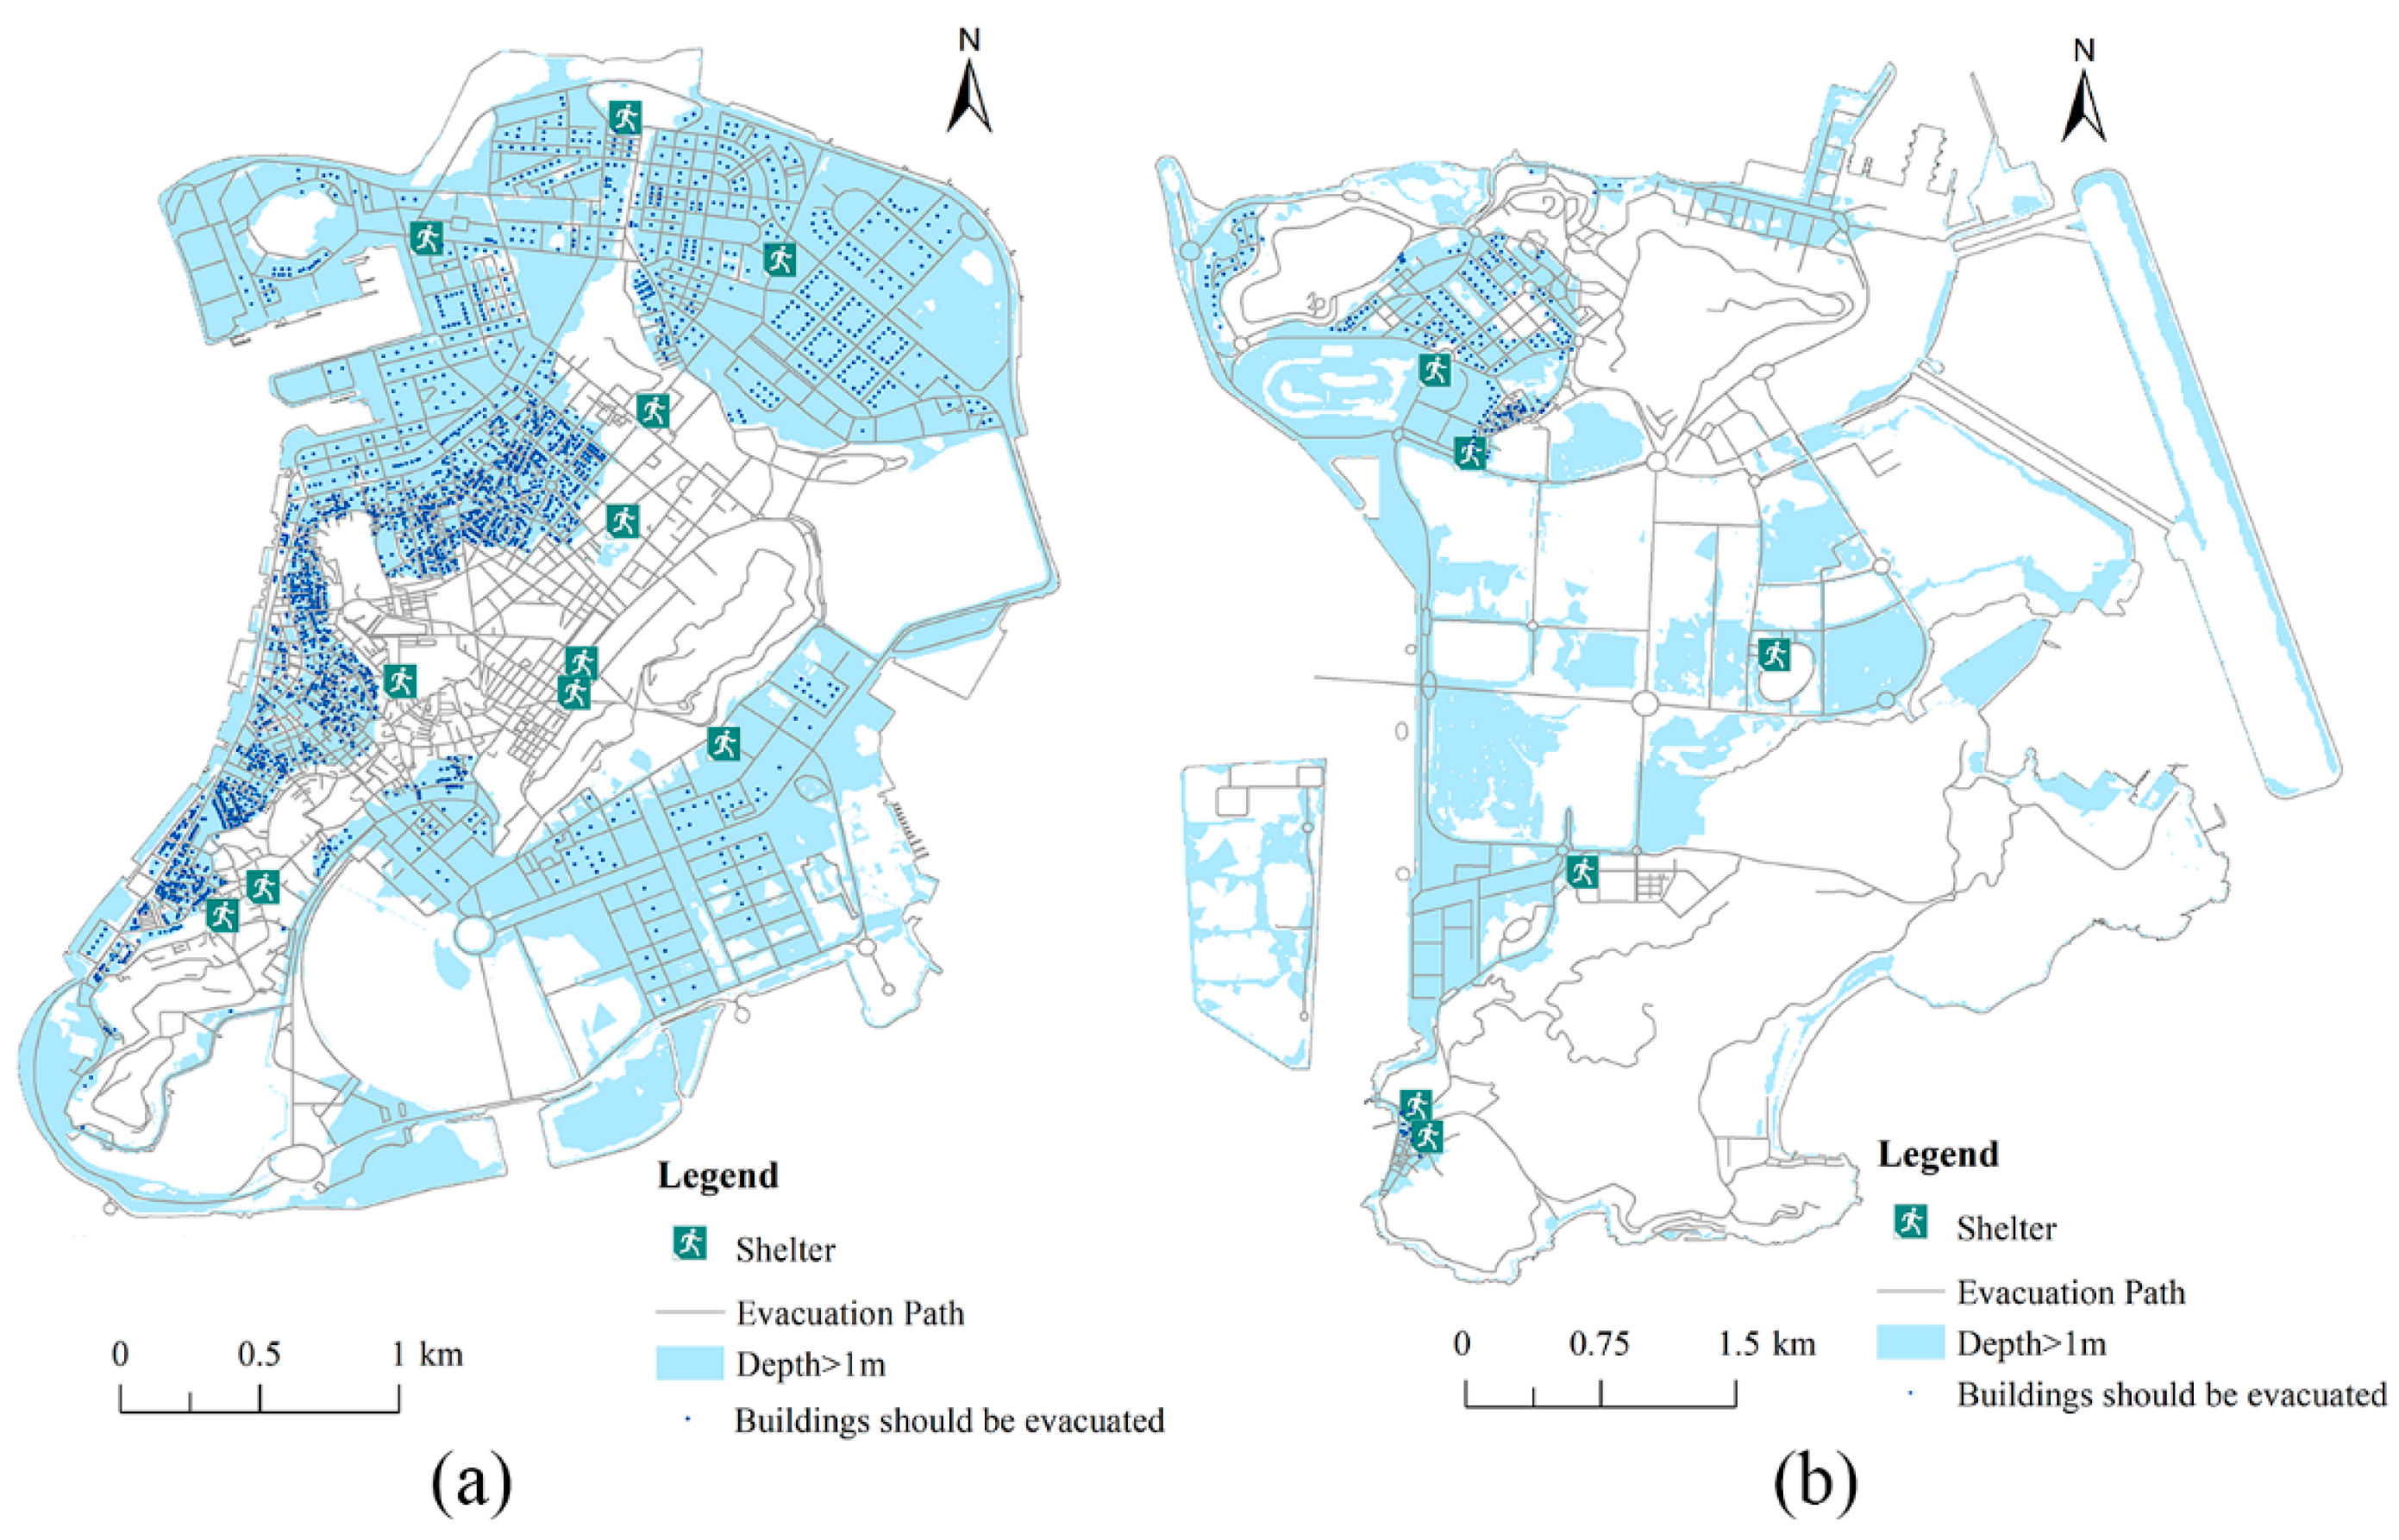
4.1. Affected Building
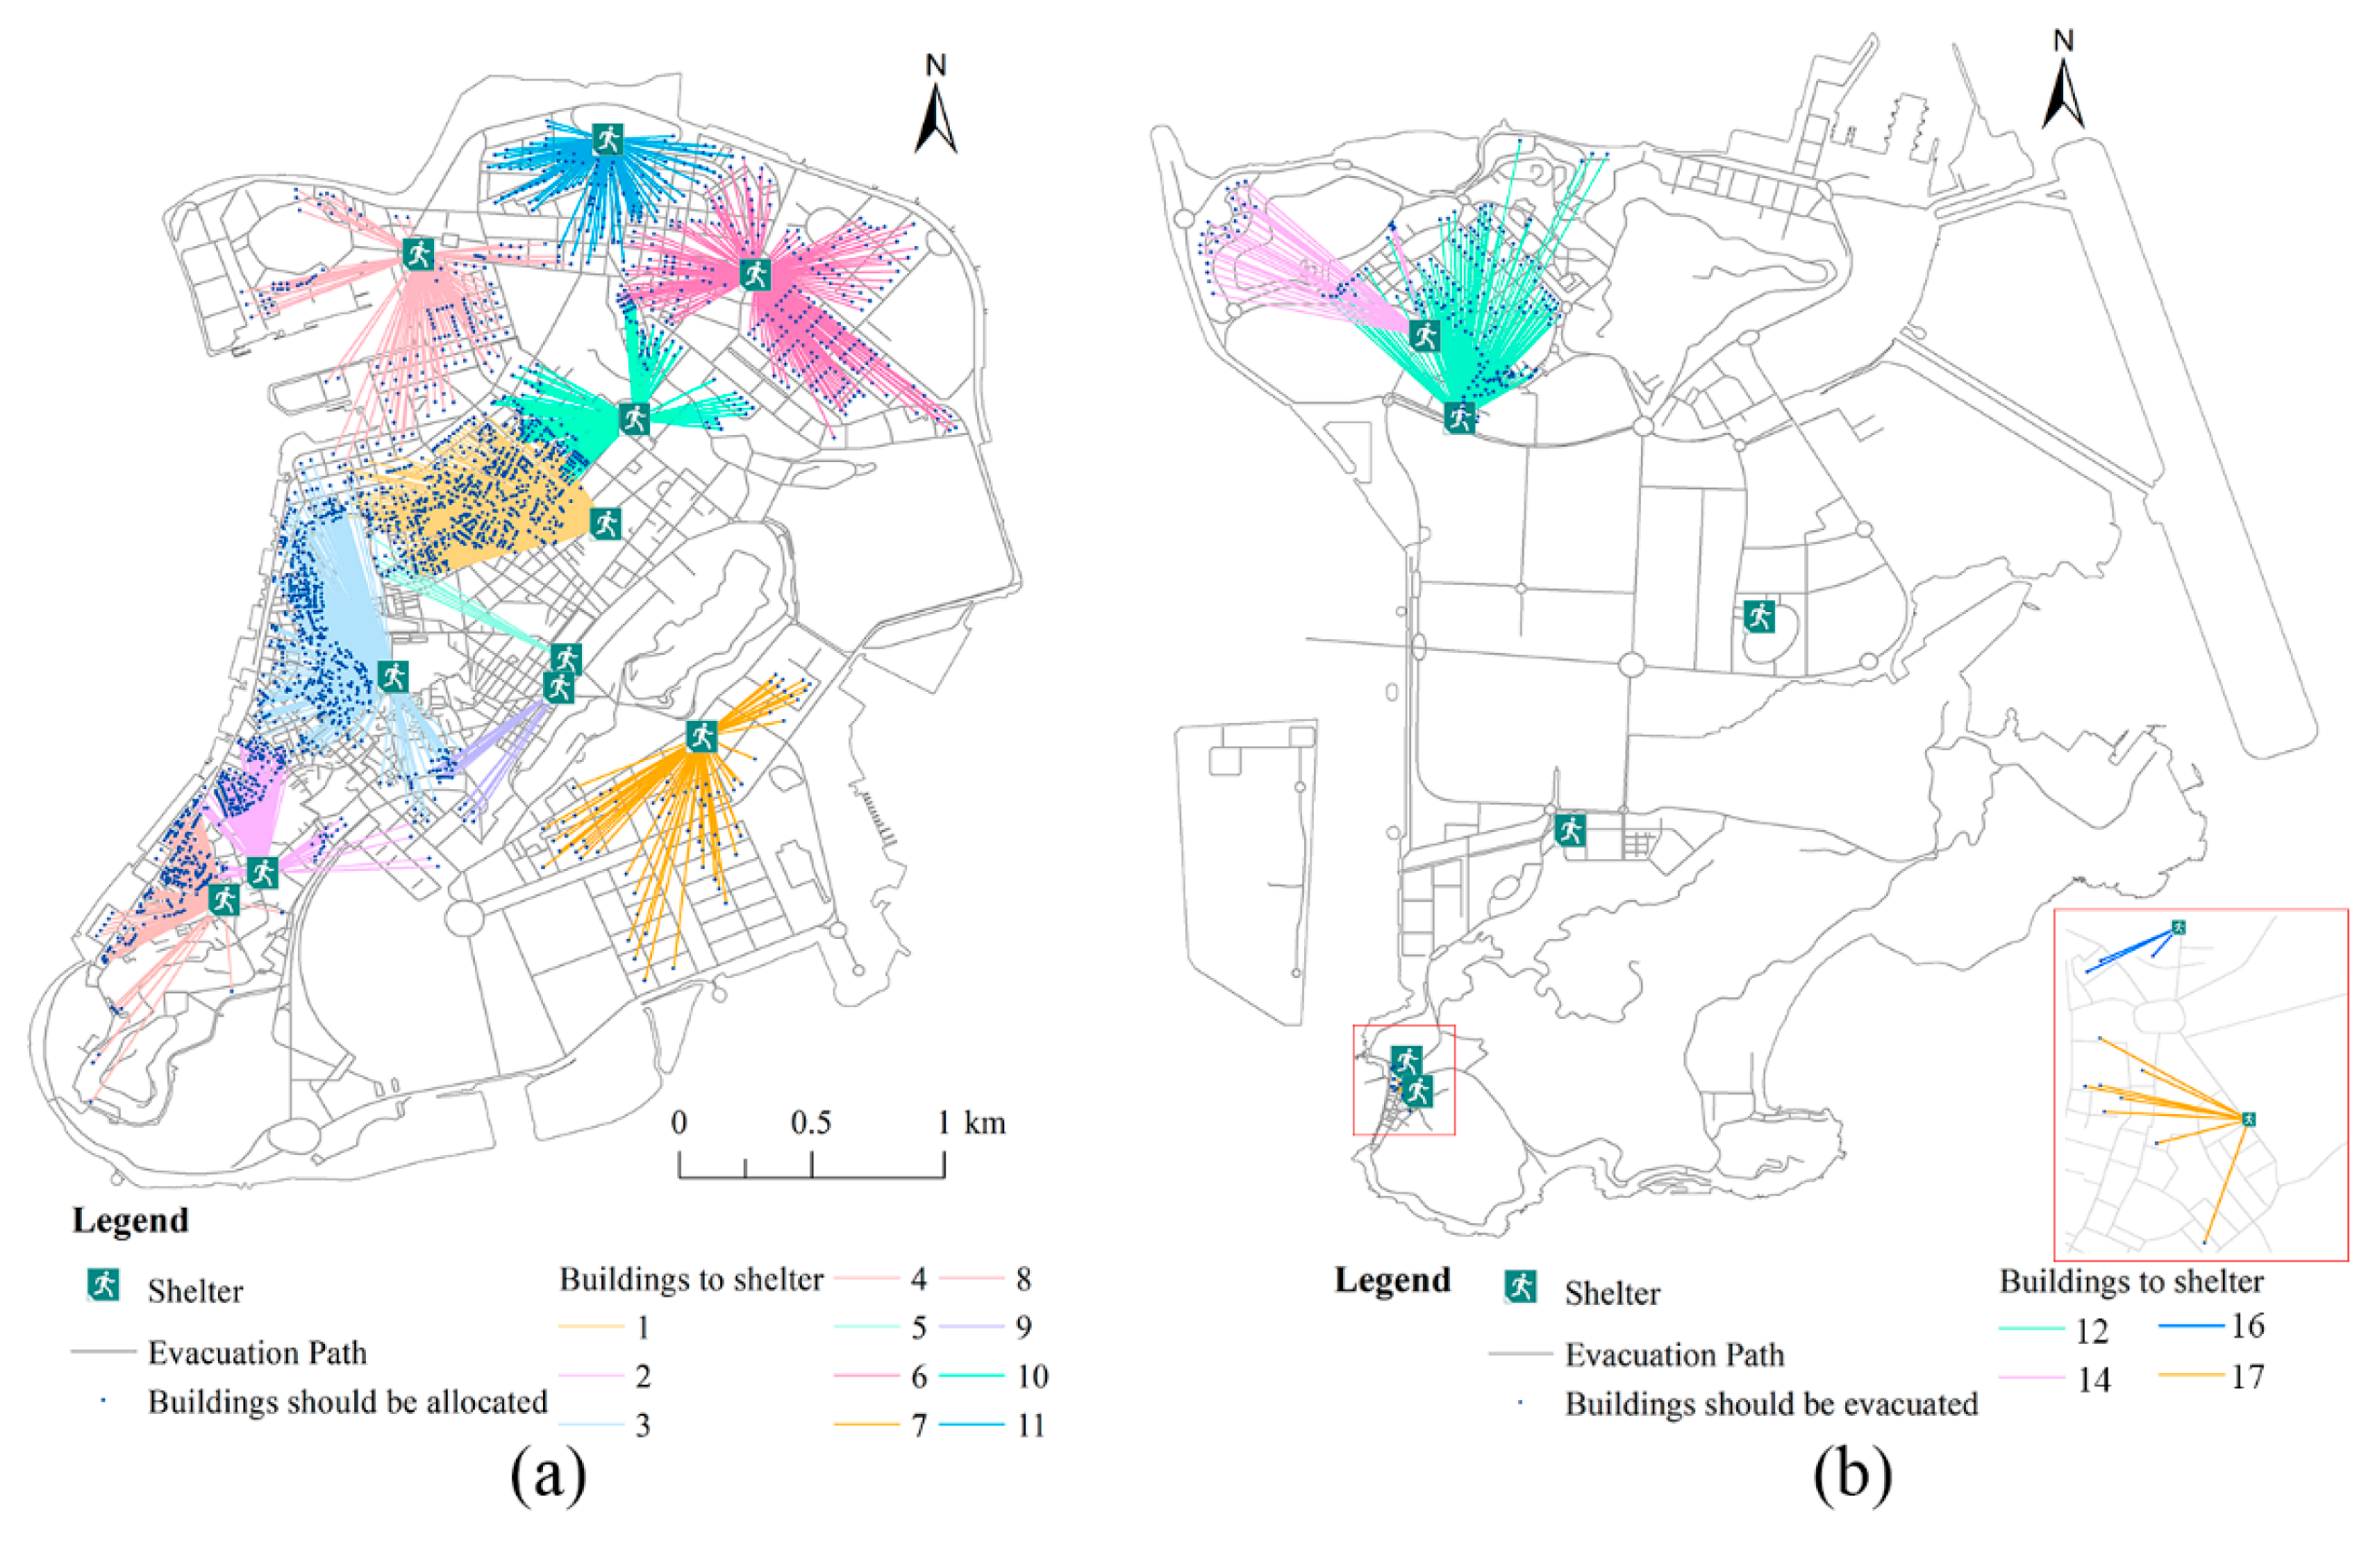
4.2. Evacuee Allocation
4.3. Discussion
5. Conclusions
Author Contributions
Funding
Acknowledgments
Conflicts of Interest
References
- Diffenbaugh, N.S.; Singh, D.; Mankin, J.S.; Horton, D.E.; Swain, D.L.; Touma, D.; Charland, A.; Liu, Y.; Haugen, M.; Tsiang, M.; et al. Quantifying the influence of global warming on unprecedented extreme climate events. Proc. Natl. Acad. Sci. USA 2017, 114, 4881–4886. [Google Scholar] [CrossRef] [PubMed]
- Tsuboki, K.; Yoshioka, M.K.; Shinoda, T.; Kato, M.; Kanada, S.; Kitoh, A. Future increase of supertyphoon intensity associated with climate change. Geophys. Res. Lett. 2015, 42, 646–652. [Google Scholar] [CrossRef]
- Mei, W.; Xie, S.P. Intensification of landfalling typhoons over the northwest Pacific since the late 1970s. Nat. Geosci. 2016, 9, 753–757. [Google Scholar] [CrossRef]
- Chen, W.-F.; Scawthorn, C. Earthquake Engineering Handbook; CRC Press: Boca Raton, FL, USA, 2003; Volume 332, ISBN 0849309581. [Google Scholar]
- Ng, M.W.; Park, J.; Waller, S.T. A Hybrid Bilevel Model for the Optimal Shelter Assignment in Emergency Evacuations. Comput. Civ. Infrastruct. Eng. 2010, 25, 547–556. [Google Scholar] [CrossRef]
- Zhao, X.; Xu, W.; Ma, Y.; Hu, F. Scenario-based multi-objective optimum allocation model for earthquake emergency shelters using a modified particle swarm optimization algorithm: A case study in Chaoyang District, Beijing, China. PLoS ONE 2015, 10, 1–16. [Google Scholar] [CrossRef]
- Bayram, V.; Tansel, B.T.; Yaman, H. Compromising system and user interests in shelter location and evacuation planning. Transp. Res. Part B Methodol. 2015, 72, 146–163. [Google Scholar] [CrossRef]
- Qin, L.; Xu, W.; Zhao, X.; Ma, Y. Typhoon track change-based emergency shelter location-allocation model: A case study of Wenchang in Hainan province, China. Inj. Prev. 2019, 1–8. [Google Scholar] [CrossRef]
- Sherali, H.D.; Carter, T.B.; Hobeika, A.G. A location-allocation model and algorithm for evacuation planning under hurricane/flood conditions. Transp. Res. Part B 1991, 25, 439–452. [Google Scholar] [CrossRef]
- Zhao, X.; Coates, G.; Xu, W. A hierarchical mathematical model of the earthquake shelter location-allocation problem solved using an interleaved MPSO–GA. Geomat. Nat. Hazards Risk 2019, 10, 1712–1737. [Google Scholar] [CrossRef]
- Li, G.; Ma, D.; Su, J. Weighted Voronoi Diagrams for Responsibility Space Regionalization of Urban Earthquake Emergency Shelters (In Chinese). Build. Sci. 2006, 22, 55–59. [Google Scholar]
- Tai, C.a.; Lee, Y.L.; Lin, C.Y. Earthquake disaster prevention area planning considering residents’ demand. In Proceedings of the 2nd International Conference on Advanced Computer Control (ICACC 2010), Shenyang, China, 27–29 March 2010. [Google Scholar]
- Wu, W.; Zhu, S.; Zhang, W. Optimal Allocation of Emergency Shelter Facilities in Beijing (In Chinese). Hum. Geogr. 2010, 25, 41–44. [Google Scholar]
- Zhu, P.; Zhang, J.; Xiao, H.; Tian, H. Emergency refuge function of urban green space GIS-based pattern optimization (In Chinese). J. Nat. Disasters 2010, 19, 34–42. [Google Scholar]
- Hakimi, S.L. Optimum locations of switching centers and the absolute centers and medians of a graph. Oper. Res. 1964, 12, 450–459. [Google Scholar] [CrossRef]
- Hakimi, S.L. Optimum Distribution of Switching Centers in a Communication Network and Some Related Graph Theoretic Problems. Oper. Res. 1965, 13, 462–475. [Google Scholar] [CrossRef]
- Toregas, C.; Swain, R.; ReVelle, C.; Bergman, L. The Location of Emergency Service Facilities. Oper. Res. 1970, 19, 1363–1373. [Google Scholar] [CrossRef]
- Saadatseresht, M.; Mansourian, A.; Taleai, M. Evacuation planning using multiobjective evolutionary optimization approach. Eur. J. Oper. Res. 2009, 198, 305–314. [Google Scholar] [CrossRef]
- Barzinpour, F.; Esmaeili, V. A multi-objective relief chain location distribution model for urban disaster management. Int. J. Adv. Manuf. Technol. 2014, 70, 1291–1302. [Google Scholar] [CrossRef]
- Rodríguez-Espíndola, O.; Gaytán, J. Scenario-based preparedness plan for floods. Nat. Hazards 2015, 76, 1241–1262. [Google Scholar] [CrossRef]
- Xu, W.; Zhao, X.; Ma, Y.; Li, Y.; Qin, L.; Wang, Y.; Du, J. A multi-objective optimization based method for evaluating earthquake shelter location-allocation. Geomat. Nat. Hazards Risk 2018, 9, 662–677. [Google Scholar] [CrossRef]
- Chang, M.S.; Tseng, Y.L.; Chen, J.W. A scenario planning approach for the flood emergency logistics preparation problem under uncertainty. Transp. Res. Part E Logist. Transp. Rev. 2007, 43, 737–754. [Google Scholar] [CrossRef]
- Li, L.; Jin, M.; Zhang, L. Sheltering network planning and management with a case in the Gulf Coast region. Int. J. Prod. Econ. 2011, 131, 431–440. [Google Scholar] [CrossRef]
- Li, A.C.Y.; Nozick, L.; Xu, N.; Davidson, R. Shelter location and transportation planning under hurricane conditions. Transp. Res. Part E Logist. Transp. Rev. 2012, 48, 715–729. [Google Scholar] [CrossRef]
- Widener, M.J.; Horner, M.W. A hierarchical approach to modeling hurricane disaster relief goods distribution. J. Transp. Geogr. 2011, 19, 821–828. [Google Scholar] [CrossRef]
- Zhao, X.; Coates, G.; Xu, W. Solving the earthquake disaster shelter location-allocation problem using optimization heuristics. In Proceedings of the 14th International Conference on Information Systems for Crisis Response and Management (ISCRAM 2017), Albi, France, 21–24 May 2017. [Google Scholar]
- Pan, A. The applications of maximal covering model in typhoon emergency shelter location problem. In Proceedings of the IEEM2010 IEEE International Conference on Industrial Engineering and Engineering Management, Macao, China, 7–10 December 2010; pp. 1727–1731. [Google Scholar]
- Xu, W.; Ma, Y.; Zhao, X.; Li, Y.; Qin, L.; Du, J. A comparison of scenario-based hybrid bilevel and multi-objective location-allocation models for earthquake emergency shelters: A case study in the central area of Beijing, China. Int. J. Geogr. Inf. Sci. 2017, 32, 1–21. [Google Scholar] [CrossRef]
- Dalal, J.; Mohapatra, P.K.J.; Mitra, G.C. Locating cyclone shelters: A case. Disaster Prev. Manag. 2007, 16, 235–244. [Google Scholar] [CrossRef]
- Yu, D.; Lane, S.N. Urban fluvial flood modelling using a two-dimensional diffusion-wave treatment, part 1: Mesh resolution effects. Hydrol. Process. 2006, 20, 1541–1565. [Google Scholar] [CrossRef]
- Yu, D.; Lane, S.N. Urban fluvial flood modelling using a two-dimensional diffusion-wave treatment, part 2: Development of a sub-grid-scale treatment. Hydrol. Process. 2006, 20, 1567–1583. [Google Scholar] [CrossRef]
- Macao SAR government. Final Report of Typhoon Hato Assessment Summary and Suggestions on Optimizing Emergency Management System; Macao SAR Government: Macao, China, 2018.


| ID | Name | Capacity |
|---|---|---|
| 1 | Pui Ching Middle School | 794 |
| 2 | Instituto Salesiano | 319 |
| 3 | Colégio Mateus Ricci | 633 |
| 4 | Escola Catòlica Estrela do Mar | 179 |
| 5 | Tap Seac Multisport Pavilion-Pavilion B | 372 |
| 6 | Multisport Pavilion, Escola Luso-Chinesa Técnico-Profissional | 1094 |
| 7 | Multisport Pavilion, Polytechnic Institute | 3924 |
| 8 | Ilha Verde Refuge Center | 111 |
| 9 | Tap Seac Multisport Pavilion-Pavilion A | 2944 |
| 10 | Keang Peng School | 169 |
| 11 | Macao Federation of Trade Unions Workers Statidum | 189 |
| 12 | Taipa Refugee center | 28 |
| 13 | Taipa and Coloane Social Service Center | 28 |
| 14 | Olympic Sports Center (Taipa) | 1883 |
| 15 | Macao East Asian Games Dome (Coloane) | 10,878 |
| 16 | Macao Academy of Public Security Forces | 50 |
| 17 | Training Base of Macao Flying Eagle Association | 250 |
| Shelter ID | Number of Buildings | Number of People | Number of Evacuees |
|---|---|---|---|
| 1 | 563 | 132,206 | 14,690 |
| 2 | 180 | 15,387 | 1710 |
| 3 | 433 | 34,446 | 3827 |
| 4 | 182 | 27,205 | 3023 |
| 5 | 9 | 2516 | 280 |
| 6 | 231 | 66,004 | 7334 |
| 7 | 68 | 7931 | 881 |
| 8 | 135 | 34,721 | 3858 |
| 9 | 14 | 1338 | 149 |
| 10 | 136 | 27,825 | 3092 |
| 11 | 105 | 25,520 | 2836 |
| 12 | 165 | 47,322 | 5258 |
| 13 | 0 | 0 | 0 |
| 14 | 28 | 8455 | 939 |
| 15 | 0 | 0 | 0 |
| 16 | 3 | 942 | 105 |
| 17 | 6 | 2845 | 316 |
| ID | Capacity | Number of Evacuees Allocated to the Shelter | Unutilized Capacity | Approach |
|---|---|---|---|---|
| 1 | 794 | 14,690 | −13,896 | Enlarge |
| 2 | 319 | 1710 | −1391 | Enlarge |
| 3 | 633 | 3827 | −3194 | Enlarge |
| 4 | 179 | 3023 | −2844 | Enlarge |
| 5 | 372 | 280 | 92 | Enough |
| 6 | 1094 | 7334 | −6240 | Enlarge |
| 7 | 3924 | 881 | 3043 | Enough |
| 8 | 111 | 3858 | −3743 | Enlarge |
| 9 | 2944 | 149 | 2795 | Enough |
| 10 | 169 | 3092 | −2923 | Enlarge |
| 11 | 189 | 2836 | −2647 | Enlarge |
| 12 | 28 | 5258 | −5230 | Enlarge |
| 13 | 28 | 0 | 28 | Enough |
| 14 | 1883 | 939 | 944 | Enough |
| 15 | 10,878 | 0 | 10,878 | Enough |
| 16 | 50 | 105 | −55 | Enlarge |
| 17 | 250 | 316 | −66 | Enlarge |
© 2020 by the authors. Licensee MDPI, Basel, Switzerland. This article is an open access article distributed under the terms and conditions of the Creative Commons Attribution (CC BY) license (http://creativecommons.org/licenses/by/4.0/).
Share and Cite
Zhao, X.; Du, P.; Chen, J.; Yu, D.; Xu, W.; Lou, S.; Yuan, H.; Ip, K.P. A Typhoon Shelter Selection and Evacuee Allocation Model: A Case Study of Macao (SAR), China. Sustainability 2020, 12, 3308. https://doi.org/10.3390/su12083308
Zhao X, Du P, Chen J, Yu D, Xu W, Lou S, Yuan H, Ip KP. A Typhoon Shelter Selection and Evacuee Allocation Model: A Case Study of Macao (SAR), China. Sustainability. 2020; 12(8):3308. https://doi.org/10.3390/su12083308
Chicago/Turabian StyleZhao, Xiujuan, Peng Du, Jianguo Chen, Dapeng Yu, Wei Xu, Shiyan Lou, Hongyong Yuan, and Kuai Peng Ip. 2020. "A Typhoon Shelter Selection and Evacuee Allocation Model: A Case Study of Macao (SAR), China" Sustainability 12, no. 8: 3308. https://doi.org/10.3390/su12083308
APA StyleZhao, X., Du, P., Chen, J., Yu, D., Xu, W., Lou, S., Yuan, H., & Ip, K. P. (2020). A Typhoon Shelter Selection and Evacuee Allocation Model: A Case Study of Macao (SAR), China. Sustainability, 12(8), 3308. https://doi.org/10.3390/su12083308