Article

Multi-Criteria Location Model of Emergency Shelters in Humanitarian Logistics

1
School of Economics and Management, Beijing Jiaotong University, Beijing 100044, China
2
School of Artificial Intelligence, Hebei University of Technology, Tianjin 300401, China
*
Author to whom correspondence should be addressed.
Sustainability 2020, 12(5), 1759; https://doi.org/10.3390/su12051759
Submission received: 12 January 2020 / Revised: 21 February 2020 / Accepted: 25 February 2020 / Published: 27 February 2020
(This article belongs to the Special Issue Sheltering and Housing Displaced Populations)

Abstract

:
Natural disasters can cause serious casualties and economic losses, and emergency shelters are effective measures to reduce disaster risks and protect lives. At present, the location models of refuge facilities often ignore the diversion of shelter from the perspective of humanitarian logistics and the needs of victims. Such models also seldom consider the impact of the pre-storage of relief materials on the location of shelters. In this study, on the basis of the different needs of disaster victims, shelters are divided into two types—basic life and psychological medical service guarantees. While considering the full coverage of shelter needs, capacities, and budget constraints, the shelter distance, the optimized distribution of refugees, and the pre-stock quantity of goods are optimized. The facility service quality is optimized on the basis of qualitative factors. This study proposes a multi-standard constrained site selection model to optimize the pre-disaster shelter site-allocation problem. The model is helpful for decision makers to influence shelter siting and victims’ allocating process through their expertise and to obtain a solution that compromises multiple objectives. In this study, several basic cases are generated from the actual data of certain areas in Sichuan Province, a disaster-prone region in China, to verify the effectiveness of the model.

1. Introduction

The International Federation of Red Cross and Red Crescent Societies defines a disaster as a sudden, catastrophic event that severely undermines the function of a community or society and causes human, material, economic, or environmental damage beyond the capacity of the community or society to use its own resources [1]. Every year, many people are made homeless by natural disasters. The mitigation of the damage caused by these disasters requires planning and measures [2]. Humanitarian logistics focuses on the problem of supply and demand matching following disasters [3]. The degree of supply and demand matching affects the whole relief operation up to 80% [4]. Optimizing the location and quantity of relief materials to meet the urgent needs of victims with the shortest time and the least resources to reduce the vulnerability of groups is imperative. Emergency shelters, as “life shelters,” are important infrastructures to ensure public safety. They can provide food, accommodation, or medical care for the affected people, reduce the harm of secondary disasters, and improve the ability to resist diseases to save lives. However, in the planned emergency measures, most cities or regions separately consider the storage of emergency supplies and the location of shelters and only use the existing relatively spacious and empty places as emergency shelters. Seeking shelters by diversion according to victims’ needs is difficult. Ignoring the impact of the pre-storage of materials in certain shelters and the distribution of surrounding facilities to meet material reserve requirements on site selections can result in the deprivation of immediate relief following disasters.
To address the needs of affected people for different types of relief resources after disasters, scholars have considered the impact of material supply on the location of emergency shelters [5,6]. In emergency events, relevant policy makers must be in an uncertain and dynamic environment and develop a plan to meet multiple conflicting needs and requirements. However, many studies and applications to solve the problem are focused on quantitative factors to achieve optimal evacuation distance and minimize the number of emergency facilities or maximize the range of facilities [7]. Quantitative and qualitative factors in emergency facility location are seldom considered together. Shelter location is a multi-standard site selection optimization problem, which should be classified and optimized according to the basic living and psychological medical service guarantees provided by the facilities. It combines with the material storage and shelter condition. This study considers shelter location, relief supplies storage, and the distribution of disaster victims. The research method comprehensively uses fuzzy hierarchical analysis, fuzzy TOPSIS, and multi-objective optimization. Optimized schemes are helpful toward the pre-disaster shelter planning and can cover the refuge necessities of all victims to realize the rapid response after disasters and improve rescue efficiency.
The remainder of this paper is organized as follows: Section 2 briefly summarizes and reviews relevant literature. Section 3 defines the research problem and builds a mathematical model to solve it. Section 4 introduces the overall situation and characteristics of the case studied. Section 5 analyzes the results of the application of the model in the case study, emphasizes the applicability of the model, and points out the impact on the practical application. Section 6 summarizes the research conclusions and points out possible future research areas.

2. Literature Review

Humanitarian action aims to alleviate the suffering and save the lives of those affected by disasters, that is, to provide services by meeting the needs of victims [8]. Humanitarian logistics focuses on the personal welfare of affected people following disasters to alleviate the suffering caused by the lack of relief materials or services [9]. The impact of humanitarian logistics on emergency facility location is an important part of the current research. By defining the time satisfaction function of emergency supplies, Yu constructed the transit transportation model of emergency supplies on the basis of time satisfaction to maximize victims’ satisfaction with the timeliness of emergency relief [10]. Zheng et al. added the index of fairness of material distribution to optimize the site selection of emergency facilities and the distribution of materials following earthquakes. Such an addition was based on the characteristics of the different degrees of urgency of post-disaster victims for materials [11]. Other scholars have obtained site selection schemes that are close to the personal welfare of victims from the perspective of their needs and the service quality of emergency facilities [12,13].
However, most literature on the optimization of emergency facility location merely considers certain characteristics of humanitarian logistics minimizing transportation distances or time [14,15]. Perez [16] and Jaller [17] pointed out that non-monetary costs and the sufferings of affected populations should be considered in humanitarian assistance. Therefore, the objective functions and constraints in the optimization model are combined with the characteristics of humanitarian logistics. The model also covers all the needs of the victims and optimizes the quality of shelter services to ensure the equitable distribution of the victims among different shelter facilities.
In the post-disaster response stage, two kinds of victims with different needs exist—one needs only basic supplies, and the other needs medical or psychological help. Therefore, this study divides shelters into two types. One type of shelter only gives basic living supplies to provide shelter function for the affected victims; the other type not only provides basic living services but also medical or psychological assistance. Shelters should be able to provide affected people with food, accommodation, or medical care; reduce the risk of secondary disasters; and resist diseases in situations where the population can have multiple needs and require different services. Emergency shelters should reserve part of emergency supplies on site or store relief supplies in stores, supermarkets, and health and medical units around the shelter facilities. This practice can guarantee the supply of emergency supplies in the short term and ensure the supply of various materials to meet the minimum survival needs of affected people [18,19].
Certain studies have built multi-level optimization models to support shelter location selection and post-disaster evacuation decision making. Most of them jointly optimize the objective functions [20,21,22] or rank the objectives [23]. A few scholars have focused on facility optimization at different levels. Yuan et al. realized that the single-level emergency center has an insufficient rescue capacity. Considering the construction of a two-level emergency center to allocate emergency service facilities for nearby victims is necessary [24]. Ozkapici et al. conducted a joint site optimization for emergency facilities with different functions; doing so is conducive to the rapid distribution of materials from different countries or international relief agencies following disasters [25]. Other studies have considered coping with the risk of disruption in distribution centers after disasters while optimizing the location of two facilities with different reliability. These facilities include secure infrastructures and facilities that may be disrupted to ensure the smooth distribution of post-disaster relief supplies [26]. However, the issue of considering shelters that can provide different types of services to meet the needs of different asylum seekers has been largely ignored [27].
Certain scholars have explored and studied the problem of shelter location according to various types of needs. In the post-disaster response phase, the most important thing is to meet multiple needs and ensure the transfer of victims to the shelters that provide the corresponding assistance [7]. Emphasis is placed on the rapid delivery of different items stored in warehouses to the victims for ensuring the availability of food, water, and medical supplies in shelters [28,29]. Kılcı et al. also considered the need to purchase materials from markets and supermarkets. Thus, in the optimization scheme of shelter location, alternative points close to the supermarket warehouses and hospitals or clinics are often chosen [30]. However, no study has been conducted to consider the storage and location of shelter materials together. Hence, this aspect is discussed in the current research.
Most studies have translated influencing factors into constraints in mathematical models and realized them, whereas a few scholars have combined them for qualitative analysis. For example, Li constructed an evaluation index system for the adaptability of emergency shelters. The author pointed out that, in addition to ensuring the safety of victims in shelters, the accessibility of shelters, medical care, supplies, and other facilities should also be considered to fully improve the relief efficiency of post-disaster shelters [31]. In view of the above analysis, in shelter location, the present study not only combines with victims’ demand distribution but also resource allocation. Qualitative and quantitative analyses are also conducted. Therefore, the current research optimizes the needs distribution of disaster victims, the storage of materials, and the allocation of disaster victims. Doing these facilitates the rapid delivery of multiple services and meets the needs of different disaster victims.

3. Problem Formulation

To fully consider the various aspects related to humanitarian logistics, two different types of needs exist, that is, basic necessities and medical or psychological needs. Both can emerge from affected people. On the basis of whether medical or psychological relief services are provided in addition to basic living services, the constructed model divides shelter functions into two types. Moreover, it simultaneously optimizes the storage of materials and the distribution of victims. This study mainly considers tents, quilts, medical equipment, and other non-perishable relief materials. To realize immediate post-disaster relief, this study also guarantees medical facilities and large commercial and supermarket warehouses within the limited scope for the candidate shelters that cannot store relief materials in advance. The methods of fuzzy analytic hierarchy process (AHP), fuzzy technique for order performance by similarity to ideal solution (TOPSIS), and multi-objective weighted optimization are used to solve the problem of shelter location and optimize the shelter location–allocation scheme. The proposed multi-standard location method for emergency shelters is shown in Figure 1.
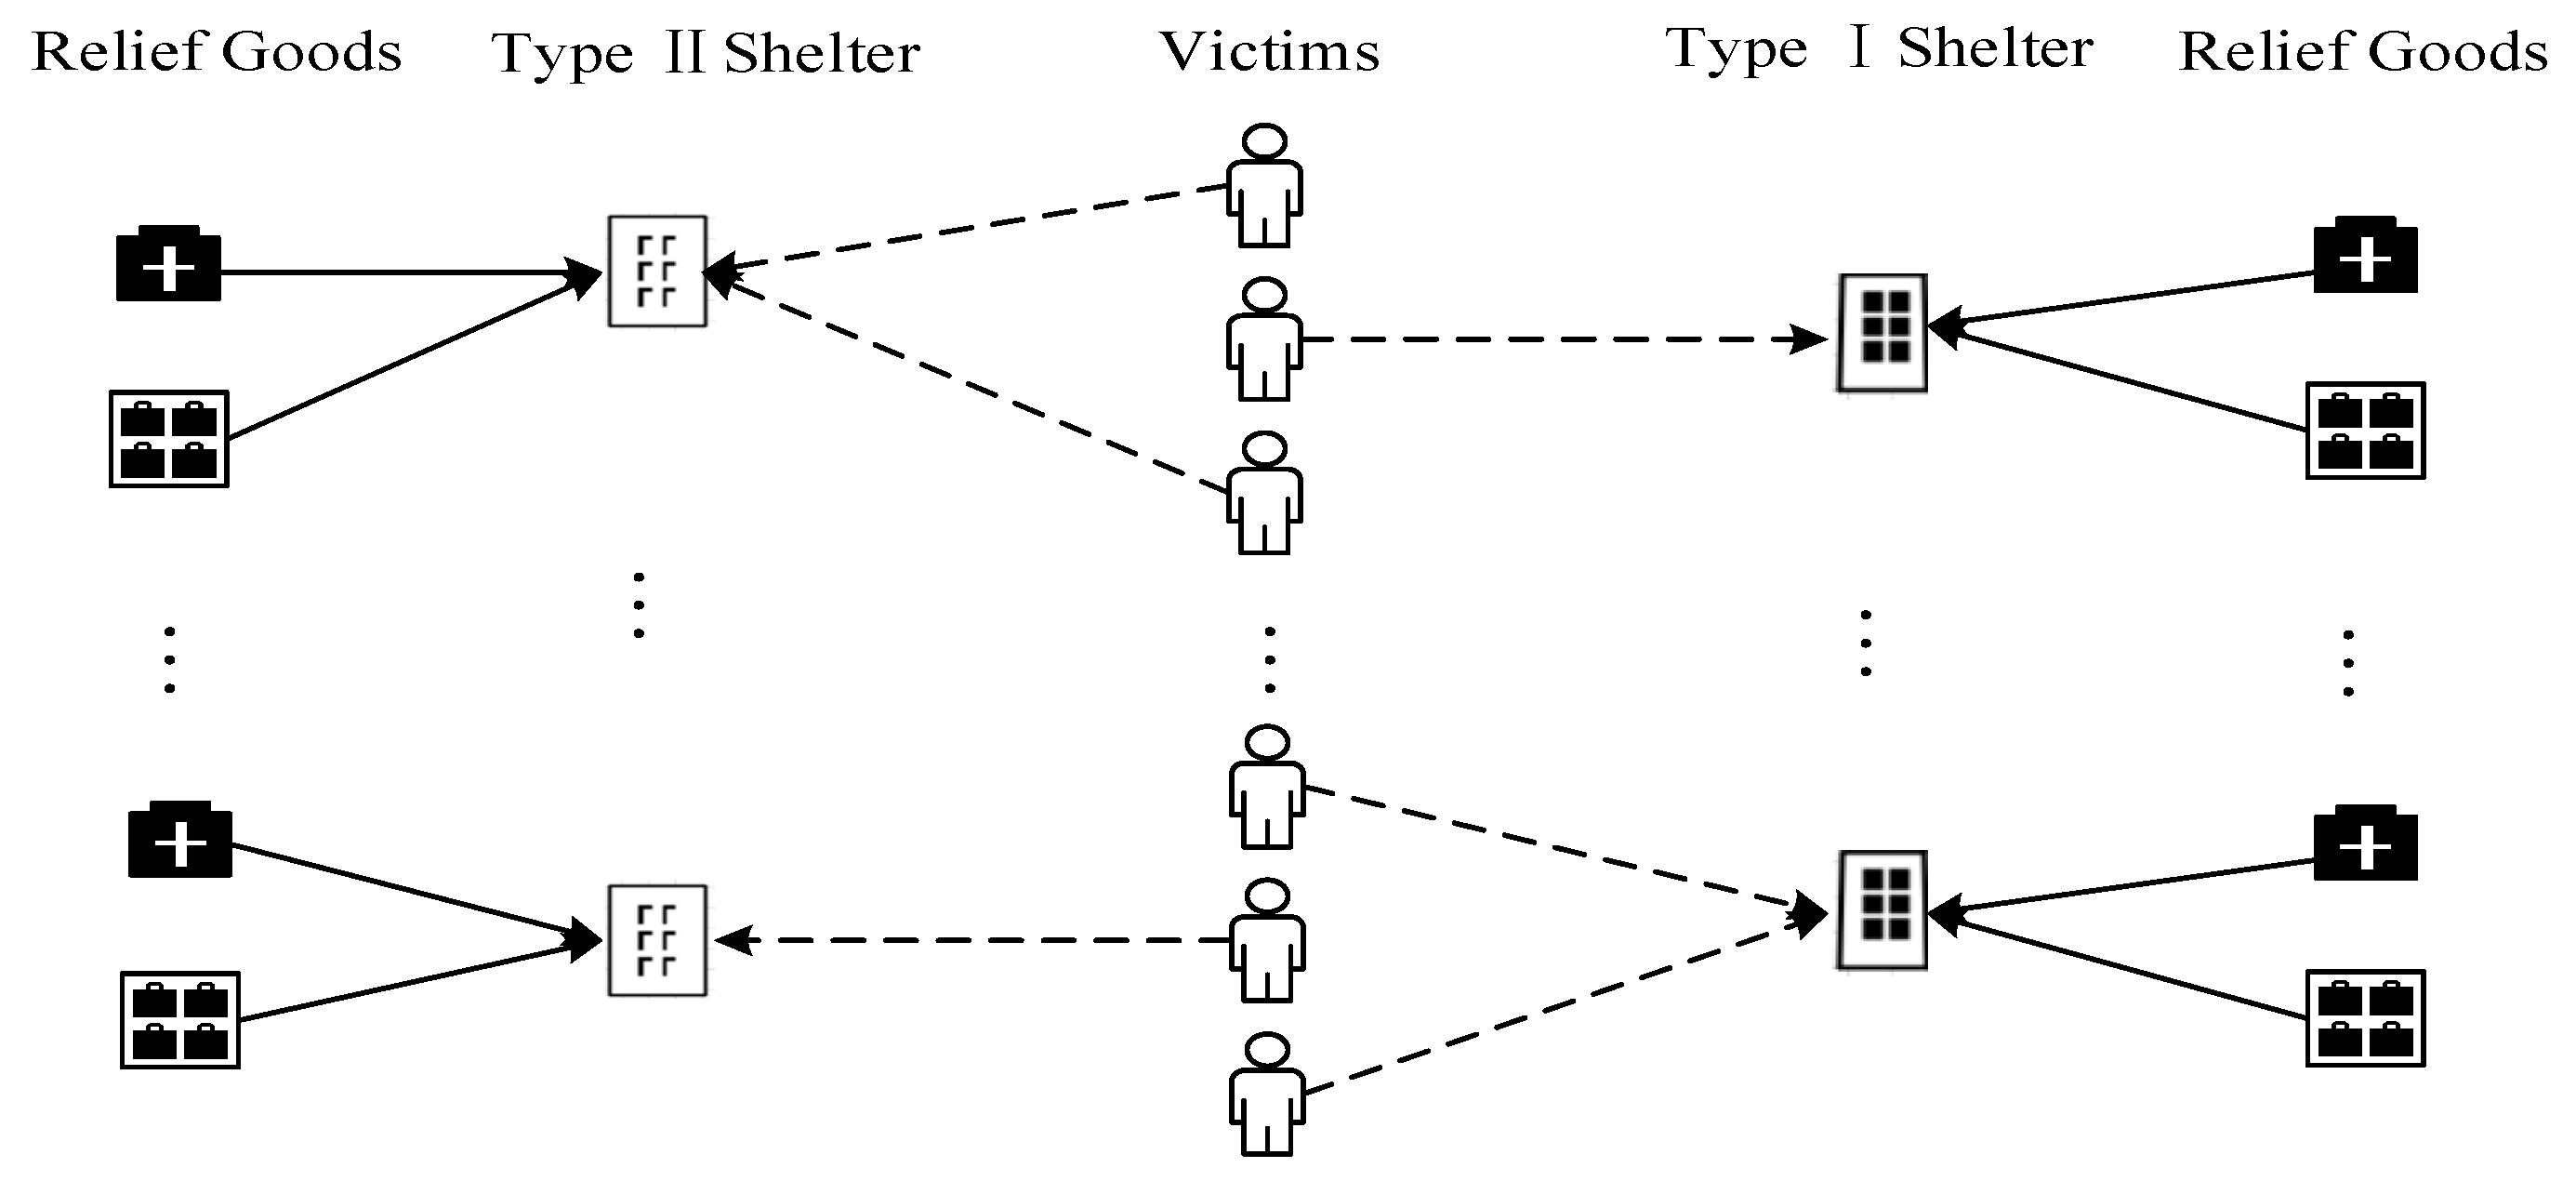
There are two different kinds of needs that will emerge for the victims after the disaster, namely basic needs for living materials and medical or psychological assistance. Under the limited budget, shelters are divided into various types depending on the different needs of victims: Type I shelters provide only basic living services, while Type II shelters provide life and medical assistance services. There is a continuously contained hierarchy in which Type II shelters include two services. Meanwhile, the location of shelters and storage of materials are optimized to ensure the supply of relief materials immediately after disasters and improve the service quality of shelters. Figure 2 illustrates the portion of the study question.

3.1. Criteria for Choosing Emergency Shelters

Multiple qualitative factors must be considered when selecting emergency shelters, and candidate sites should avoid areas of potential risks. Topography, geological type, and slope are important factors to be considered when planning shelter location [7,30,31,32,33]. Shelters are better protected from secondary disasters, such as floods and landslides on the plain than on the hills. Candidate sites should avoid fault lines, and slopes should not exceed 7%, preferably between 2% and 4% [22]. Concurrently, in rainy areas, the existence of vegetation helps consolidate the soil and prevent debris flow [19,21,26]. Electricity is an important guarantee for maintaining daily living. Many equipment and communication cannot operate without electricity. Therefore, shelters should have basic power facilities [5,19,24,26]. Shelters must also provide clean drinking water to maintain normal daily living, and sewage treatment facilities are highly important for refugees [19,21,22]. On the basis of Chinese national standards, Turkish Red Crescent standards, and related studies, the six qualitative factors affecting the location of emergency shelters are identified, namely, topography, geological type, slope, vegetation, power facilities, and sanitation system. Table 1 shows the literature sources of qualitative influencing factors.
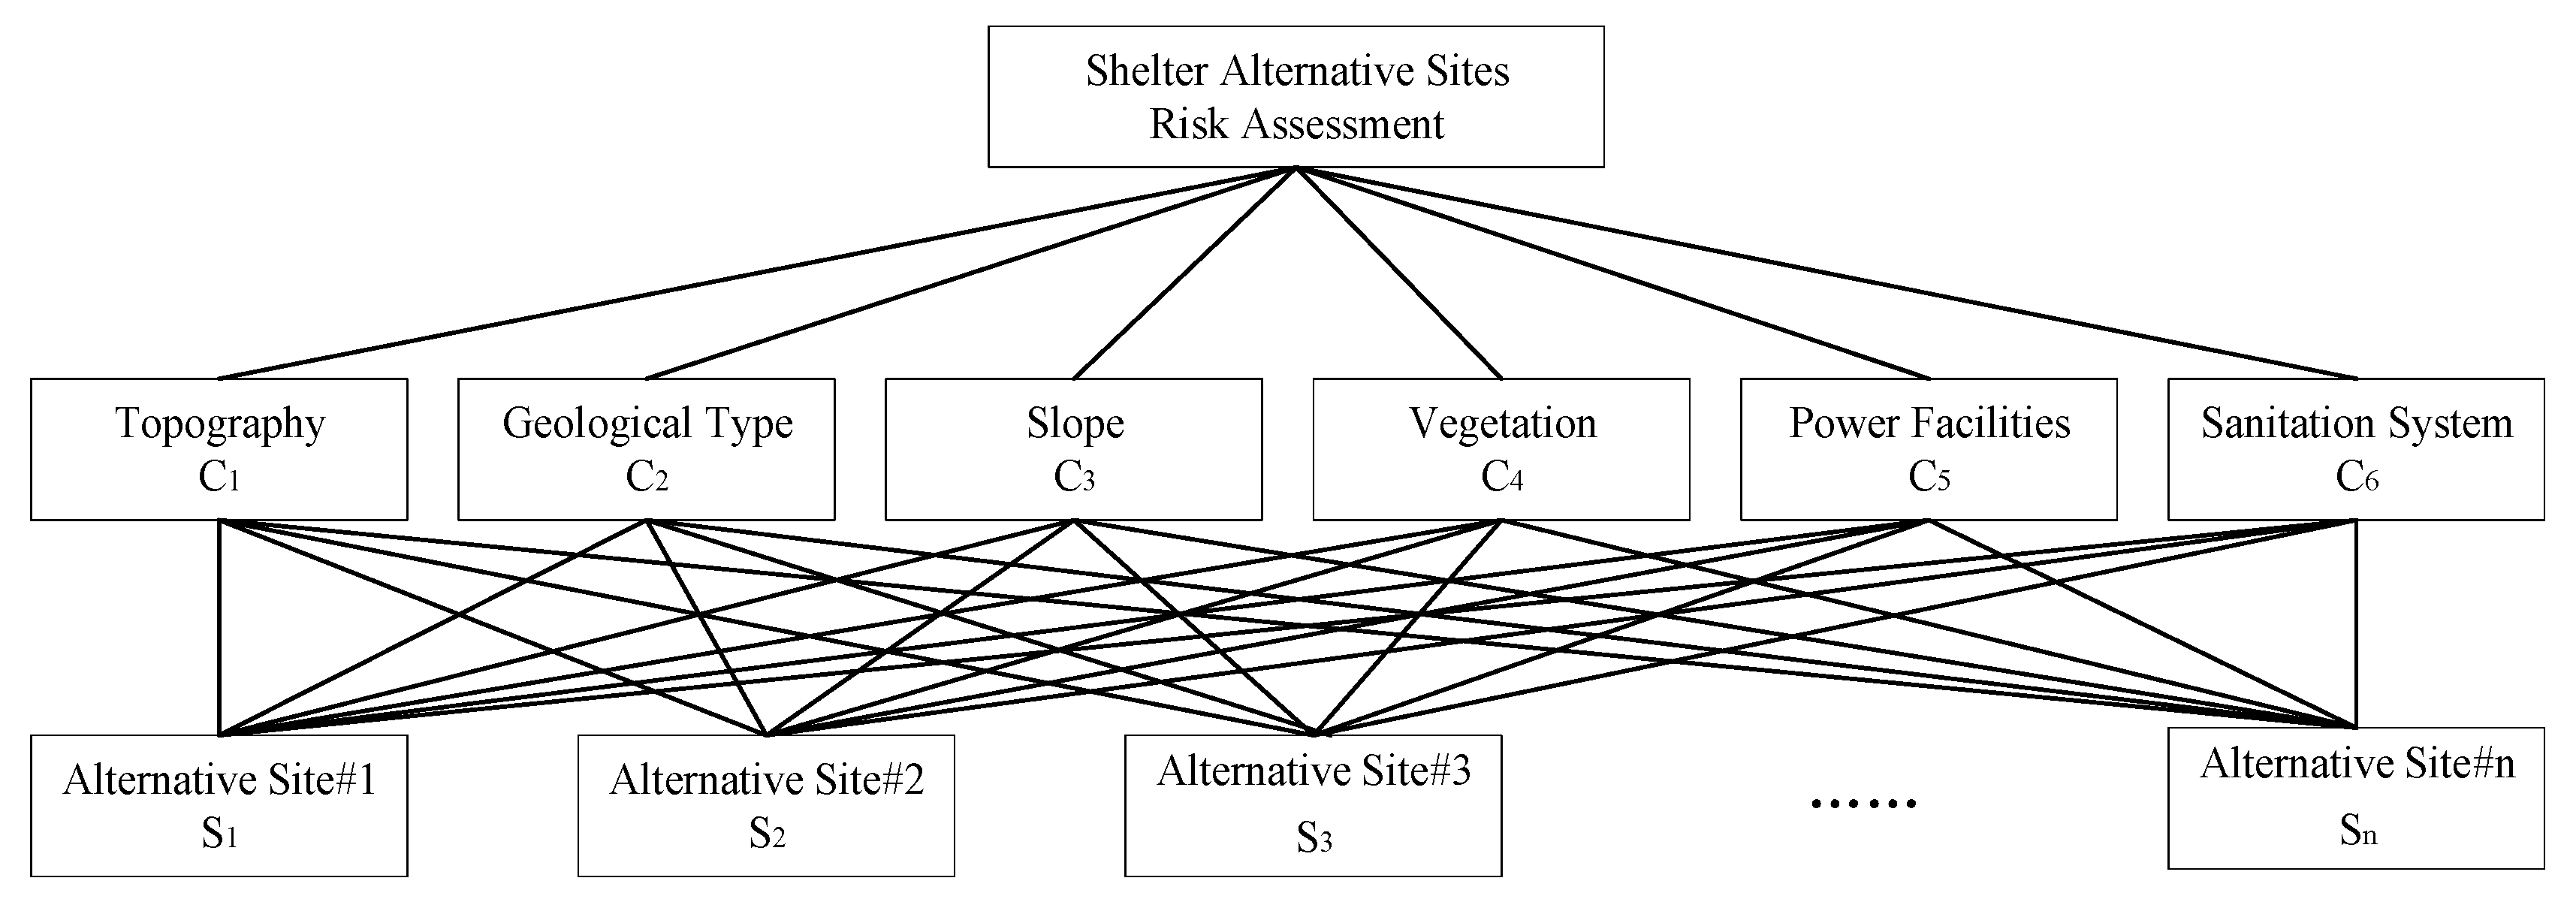
A committee composed of experts with experience in evaluating the selection criteria and recorded personal preferences through questionnaires is employed. Table 2 presents the representation method of transforming language variables into numerical variables. Decision makers who analyze candidate sites include experts in emergency management, local government planners, and surrounding residents. In this study, the alternative sites of shelters are evaluated and ranked by fuzzy AHP and fuzzy TOPSIS method to reduce investment and construction risks. The hierarchy of the decision-making process is displayed in Figure 3. Other quantitative factors are analyzed in the next stage.

3.2. Fuzzy AHP for Determining Standard Weights

AHP is a decision-making method based on the combination of actual measurement and subjective preference proposed by Saaty [34]. Due to the ambiguities of qualitative criteria, fuzzy decision making has become a powerful tool in uncertain environments [35]. AHP’s fuzzy extension has been widely used in multi-standard decision making, resource allocation and conflict resolution [36]. Fuzzy AHP systematically combines fuzzy number theory and hierarchical structure analysis to solve the problem of hierarchical division in fuzzy multi-standard decision making [37]. In the judgment matrix, the fuzzy numbers are compared to determine the reasonable weight of the qualitative criteria.
In this study, fuzzy triangle numbers were used for quality evaluation criteria, and used as weights for qualitative assessment of fuzzy TOPSIS method. Therefore, let X = { x 1 , x 2 , , x n } be a decision set, according to the extension analysis method proposed by Veerabathiran and Srinath [38], each standard in the set is taken, and the extension analysis was conducted for each evaluation criterion. The m number of extended analysis value for each object can be expressed as Equation (1). M i j   ( j = 1 , 2 , , m ) in Equation (1) is triangular fuzzy number. We assume that M i j k = ( m i j k L , m i j k M , m i j k U ) ( i = 1 , 2 , , m ; j = 1 , 2 , , m ; k = 1 , 2 , , h ) represents the relative importance of the k-th decision maker in judging the i-th and j-th criteria. The triangular fuzzy number in group judgement matrix M i j = ( m i j L , m i j M , m i j U ) is from the following Equations (2)–(4).
M i 1 ,   M i 2 ,   ,   M i m   i = 1 , 2 , , n .
m i j L = min ( m i j k L ) .
m i j M = Π k m i j k M . k
m i j U = max ( m i j k U ) .
The extension analysis steps proposed by Veerabathiran and Srinath are shown below [38]. Through Equations (5)–(8), the fuzzy number addition operation is performed on m × m analysis values in the specific decision matrix. The inverse of the vector is solved to obtain standard initial weight β c i ( i = 1 ,   2 ,   ,   m ).
j = 1 m M i j = ( j = 1 m m i j L , j = 1 m m i j M , j = 1 m m i j U ) ,   i = 1 , 2 , , m .
i = 1 m j = 1 m M i j = ( i = 1 m j = 1 m m i j L , i = 1 m j = 1 m m i j M , i = 1 m j = 1 m m i j U ) .
[ i = 1 m j = 1 m M i j ] 1 = ( 1 i = 1 m j = 1 m m i j L , 1 i = 1 m j = 1 m m i j M , 1 i = 1 m j = 1 m m i j U ) .
β c i = j = 1 m M i j [ i = 1 m j = 1 m M i j ] 1
Let M 1 = ( m 1 L , m 1 M , m 1 U ) and M 2 = ( m 2 L , m 2 M , m 2 U ) be two triangular fuzzy numbers, and the membership degree of the possibility of M 2 M 1 can be expressed by Equation (9) where d is the ordinate of the intersection point between the membership degrees μ M 1 and μ M 2 . β c i is compared pairwise according to Formula (9) to obtain μ ( d ) .
V ( M 2 M 1 ) = h g t ( M 1 M 2 ) = μ M 2 ( d ) = {     1                                                                                   m 2 M m 1 M     0                                                                                     m 1 L m 2 U m 2 L m 2 U ( m 2 M m 2 U ) ( m 1 M m 1 L )                                   o t h e r
The possibility that a convex fuzzy number M is greater than k convex fuzzy numbers M 1 , M 2 , , M k is expressed by Equation (10). Assume d ( A i ) = m i n   V ( M i M k ) for k = 1 , 2 , ,   m ;   k i , and the overall weight is shown in Equation (11).
V ( M M 1 , M 2 , , M k ) = V   [ ( M M 1 ) ( M M k ) ]   =   m i n V   ( M M i )   i          = 1 ,   2 ,   ,   k
W = ( d ( C 1 ) , d ( C 2 ) , , d ( C m ) ) T
After normalizing W , the standard weight vector is expressed as
W = ( d ( C 1 ) , d ( C 2 ) , , d ( C m ) ) T

3.3. Analysis of Shelters by Fuzzy TOPSIS Method

The TOPSIS method was proposed by Hwang and Yoon, which is an effective method commonly used in multi-standard decision analysis [39]. It selects the solution with the smallest distance from the positive ideal solution and the largest distance from the negative ideal solution. This method can be used to evaluate the impact factors, service quality, and satisfaction [40,41]. As a continuation of fuzzy AHP, fuzzy TOPSIS method is appropriate for solving group decision-making problems in fuzzy environments [42]. In many problems, it is difficult for decision makers to provide accurate numerical judgments about the probability and consequences of each event. Therefore, fuzzy linguistic variables and their term sets were used to assess the quality of service at the shelter candidate. It is beneficial to include ambiguity and uncertainty in the decision-making process of shelter location.
In Section 3.2, decision makers used importance level of standards ratings to reach conclusions about their decisions. Based on six criteria ( C 1 , C 2 , , C 6 ), decision makers evaluated the results of shelter alternatives ( S 1 , S 2 , , S n ). The collected information was further transformed into the decision matrix D = ( d i j ) n × m shown in Equation (13). This step is to transform qualitative variables into quantitative variables as output parameters. The element d i j of the matrix D represented by triangular fuzzy numbers in Table 3 refers to the performance rating of the i-th candidate shelter relative to the j-th standard.
D = S 1 S 2 S n C 1 C 2 C m [ d 11 d 12 d 1 m d 21 d 22 d 2 m                 d n 1 d n 2 d n m ] .
Under the overall fuzzy language criterion, the term sets determined for alternative shelters evaluation are different and given in Table 3. Zadeh proposed combinational inference rules and applied them to derive conclusions from the fuzzy rule sets [43]. In order to unify the conclusions of experts, this study uses the best-known maximum–minimum compositional rule approach to establish a fuzzy decision matrix.
Then, the normalized ratings were calculated using Equation (14), which was used for vector normalization and computing a i j . The weighted normalized value b i j was calculated by b i j = w j × a i j where i = 1 , 2 , , n ;   j = 1 , 2 , m . w j represents the weight of the j-th standard. The positive ideal fuzzy solution B + and the negative ideal fuzzy solution B were determined by Equation (15) in terms of weighted normalized values.
a i j = d i j i = 1 n d i j 2   i = 1 , 2 , , n ; j = 1 , 2 , m
B + = { ( m a x B i j | i I ) | j = 1 , 2 , , m } = { b 1 + , b 2 + , , b m + } ,    B = { ( m i n B i j | i I ) | j = 1 , 2 , , m } = { b 1 , b 2 , , b m } .
Separation measures were calculated in next step. The distance between the candidate point to the positive ideal solution and the negative ideal solution was calculated by Euclidean distance. The separation of each candidate point from the positive ideal solution B + was determined by Equation (16), and the separation from the negative ideal solution B is calculated by Equation (17).
d i + = j = 1 n ( b i j b j + ) 2   i = 1 , 2 , .. , n
d i = j = 1 n ( b i j b j ) 2   i = 1 , 2 , .. , n
Equation (18) can calculate the relative closeness F i of each solution and the ideal solution and sort them. In this study, the greater the degree of closeness, the higher the evaluation of the candidate points, that is, the closer to the positive ideal solution, the farther from the negative ideal solution.
F i = d i d i + + d i   i = 1 , 2 , .. , n

3.4. Multi-Objective Optimization Model Construction

Finally, this section combines the performance evaluation results obtained by fuzzy TOPSIS with a multi-objective optimization model to maximize the weight function and improve the quality of shelter services on the basis of the relative weight of candidate points obtained from subjective evaluation. Simultaneously, the distance from the affected families to the shelters is minimized, and the number of shelters opened is optimized. These goals are achieved while considering the victims’ needs, rescue budgets, facility capacity, and coverage boundary constraints. Models are constructed with the avoidance of hazardous areas to ensure the safety of selected shelters.
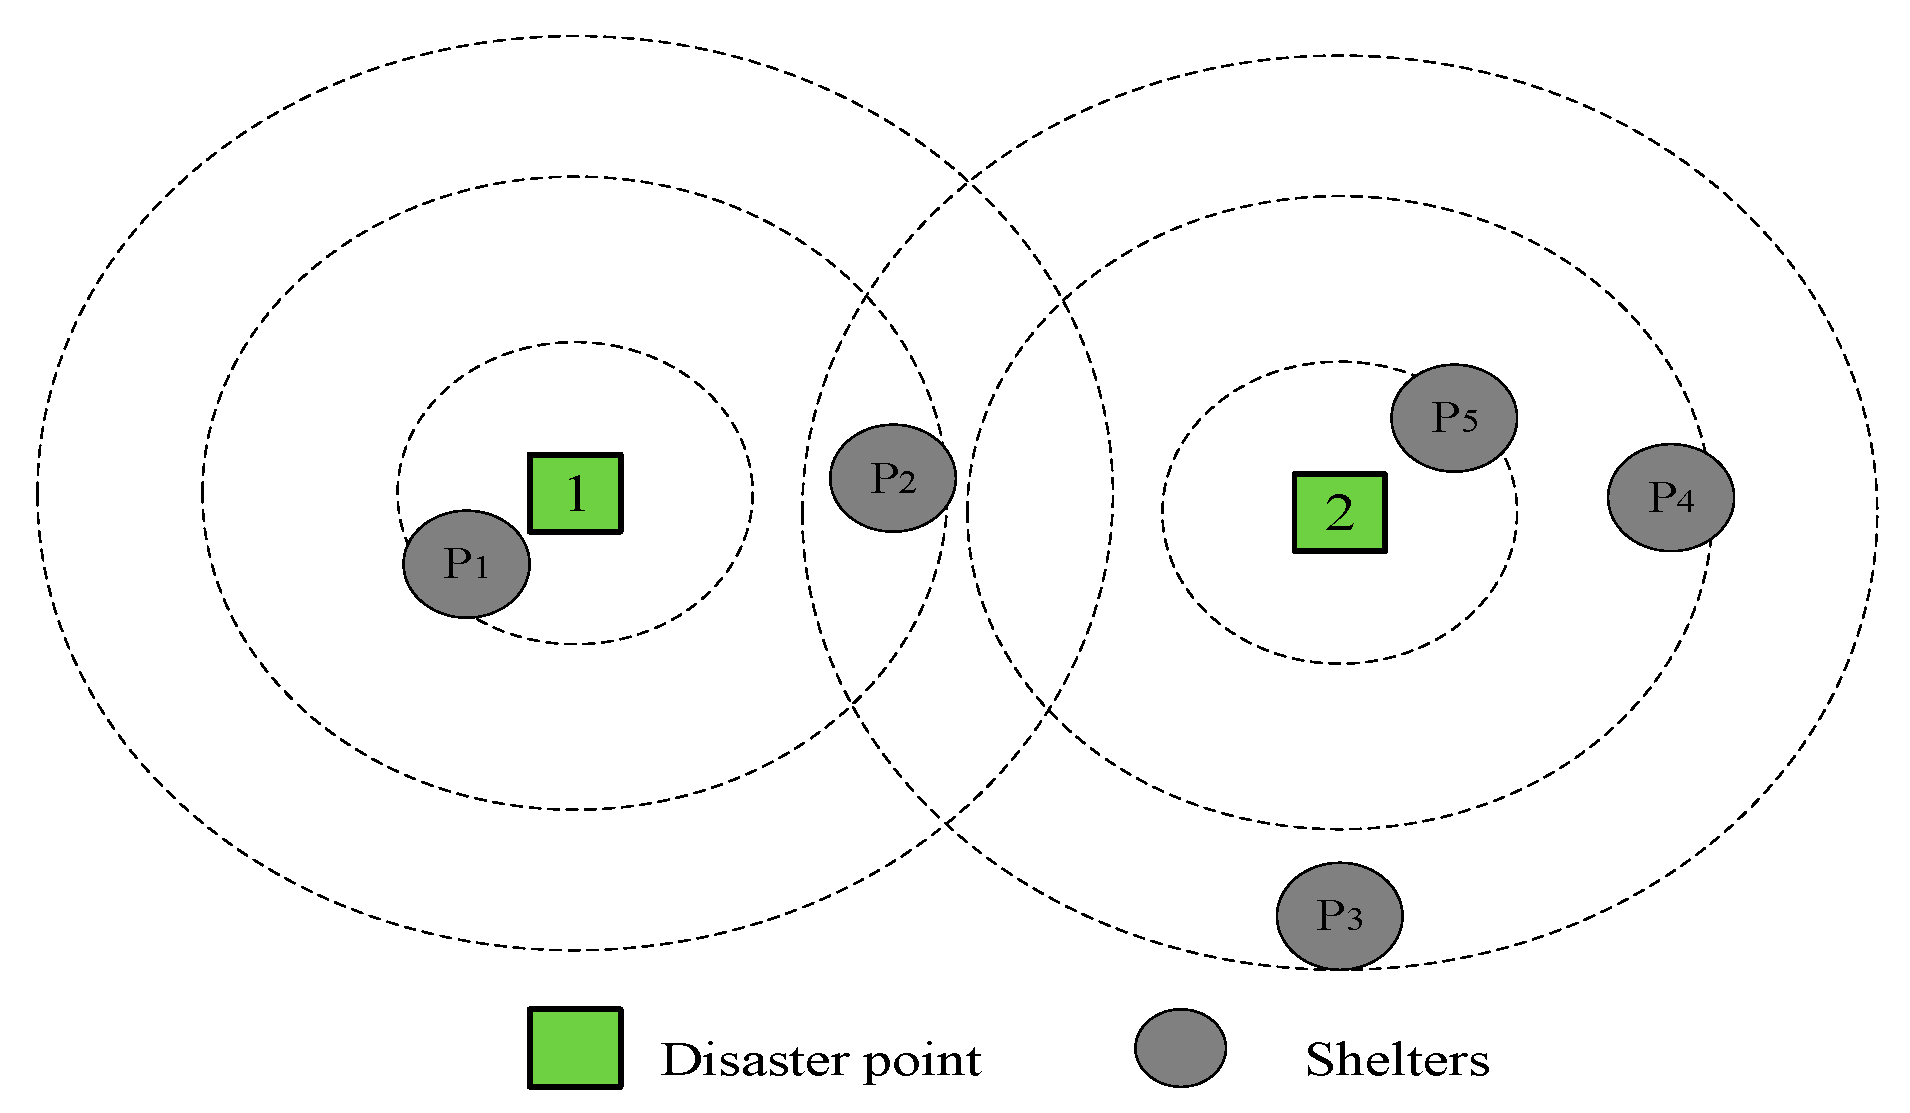
In this study, the multi-layer coverage idea proposed by Berman and Krass is used to construct the boundary coverage function [44]. As the distance between evacuation facility i and disaster point j increases, the proportion of evacuation demand allocated to point i by point j decreases. Given the distance relationship 0 < d 1 < d 2 < < d k , d k is the maximum evacuation distance set by the local government. The evacuation demand at point j is D j , and p k represents the proportion of demand that can be covered by facilities with a distance from disaster point j in the interval ( d k 1 , d k ). The total demand that can be covered by disaster point j is p k D j , where 1 > p 1 > p 2 > > p k > 0 . The specific situation of the boundary cover function is shown in Figure 4. The effective coverage can be divided into three levels. The demand of disaster point 1 is D 1 , and the requirements of facilities P1 and P2 in the first and second overlay layers that can cover disaster point 1 at most are m i n { p 1 D 1 + p 2 D 1 , D 1 } . The demand for another point 2 is D 2 . The demand for the facility P5 in the first level, the facility P4 in the second level, and the facilities P1 and P3 in the third level can cover at most disaster site 2   m i n { p 1 D 2 + p 2 D 2 + p 3 D 2 , D 2 } . The maximum demand that can be covered at a certain level is only related to the size of the demand and has nothing to do with the number of facilities selected.
For example, the third coverage layer of demand point 2 contains two facilities, namely, P2 and P3. Whether both are available or only one is available, the upper limit of demand that can be covered is p 3 D 2 .
The details and symbols of the multi-objective optimization model are as follows:
Sets
  • I Set of affected area, i I
  • S Set of emergency shelter candidates, s S
  • F Set of types of evacuation services, f = 1 means basic living services, f = 2 represents medical and psychological services
  • M Set of different types of relief supplies, m = L represents life supplies to implement service 1, whereas m = P signifies medical supplies to implement service 2
  • T Set of shelter types, t = I provides victims with service Type 1, whereas t = II provides victims with service Types 1 and 2.
Parameters
  • F s  Result of the subjective evaluation of the shelter candidate point sS
  • W g G-th objective function weight
  • D i  Number of households in affected area i I
  • α i f  Proportion of victims in disaster area i I who need refuge service f F
  • A m f  Amount of relief materials m M needed by disaster victim who need refuge service f F
  • C s  Maximum material storage for candidate refuge s S
  • P s  Maximum victim capacity for candidate shelter s S
  • F C s  Fixed construction cost of opening a shelter at candidate point s S
  • V C m  Unit cost of purchasing relief materials m M
  • O C f  Variable construction cost per additional capacity of service f F for each candidate point
  • B Total available rescue budget
  • θ k  Radius of k-th coverage level from a disaster point
  • d i s  Distance between affected area   i I and candidate shelter s S
  • d h s  Distance between candidate shelter s S and the nearest hospital
  • d w s  Distance between candidate shelter s S and the nearest commercial and supermarket warehouses
  • d h  Distance restriction between the shelter and the nearest hospital
  • d w  Distance restriction between the shelter and the nearest commercial and supermarket warehouses
  • p k  Proportion of demand covered by shelters in the interval ( d k 1 , d k ) from the affected area
  • γ  Proportion of Type 1 services available in Type II shelters
  • N  A large positive number
Decision variables
  • y s t  The establishment of a type t T shelter at candidate point s S has a value of 1, otherwise it is 0
  • x i s f  Number of victims from sheltered area i I to shelter s S that require shelter service f F
  • β s m  Number of supplies m M stored in shelter s S
    m i n   Z 1 = i I s S ( x i s 1 + x i s 2 ) d i s
    m a x Z 2 = t T s S y s t F s  
    m i n Z 3 = t T s S y s t
Subject to:
i I x i s 1 P s y s I + γ   P s y s I I
i I x i s 2 ( 1 γ   ) P s y s I I
m M β s m C s
β s m A m f i I x i s f
s S x i s f D i α i f
t T y s t 1
i I x i s 1 ( y s I + y s I I ) N
i I x i s 2 y s I I N
d h s t T y s t d h
d w s y s t d w
f F s | θ k 1 < d i s < θ k x i s f p k D i
t T s S F C s y s t + f F s S i I O C f x i s f +   m M s S V C s m β s m B
x i s f ,   β s m Z +   i I ,   s S ,   m M ,   f F
y s t { 0 , 1 }     s S ,   t T
Objective function (19) minimizes the distance between the victims and the shelters under the limited rescue budget. Objective function (20) maximizes the subjective evaluation performance of the shelters on the basis of qualitative factors. Objective function (21) optimizes the number of open shelters. Constraints (22) and (23) stipulate that the number of households allocated to each refuge center cannot exceed the capacity of the facility. Among them, in natural disasters with high destructiveness and casualties, victims who need psychological or medical assistance must receive considerable concern. Therefore, γ should take the small value. Constraint (24) restricts the number of refuges that can store rescue supplies not exceeding their maximum storage capacity. Constraint (25) guarantees that the amount of materials stored in shelters or surrounding facilities must meet the demand. Constraint (26) restricts disaster victims of different needs can receive it. Constraint (27) ensures that each shelter can be associated with only one type. Constraints (28) and (29) ensure that only selected shelters can provide services for the victims. Constraints (30) and (31) indicate that for candidate shelters, if no medical facilities and commercial supermarket warehouses are available within the prescribed threshold, then they cannot be selected. Constraint (32) is a boundary cover function that limits the number of victims who can be allocated to shelters in the k-th coverage level of affected area i . Constraint (33) limits shelter costs to existing budgets, including fixed construction, variable, and material procurement costs. Constraints (34) and (35) define decision variables.
This study uses weight W g to deal with the multi-objective shelter location model and defines the relative importance of objective functions Z 1 and Z 2 . Decision makers can assign specific values, as shown in Equation (36). Among them,   Z 1 ( x ) , Z 2 ( x ) , and Z 3 ( x )   are the optimal values for single-objective optimization.
max Z = ( 2 w 1 Z 1 ( x ) Z 1 ( x ) ) + w 2 Z 2 ( x ) Z 2 ( x ) + ( 2 w 3 Z 3 ( x ) Z 3 ( x ) )

4. Case Study: Wenchuan Earthquake in Sichuan Province, China

This section first briefly reviews the earthquakes that occurred in Wenchuan, China in 2008. Then, the characteristics of the study area and the acquisition of model parameters are introduced.

4.1. The Earthquake of May 2008 in Wenchuan

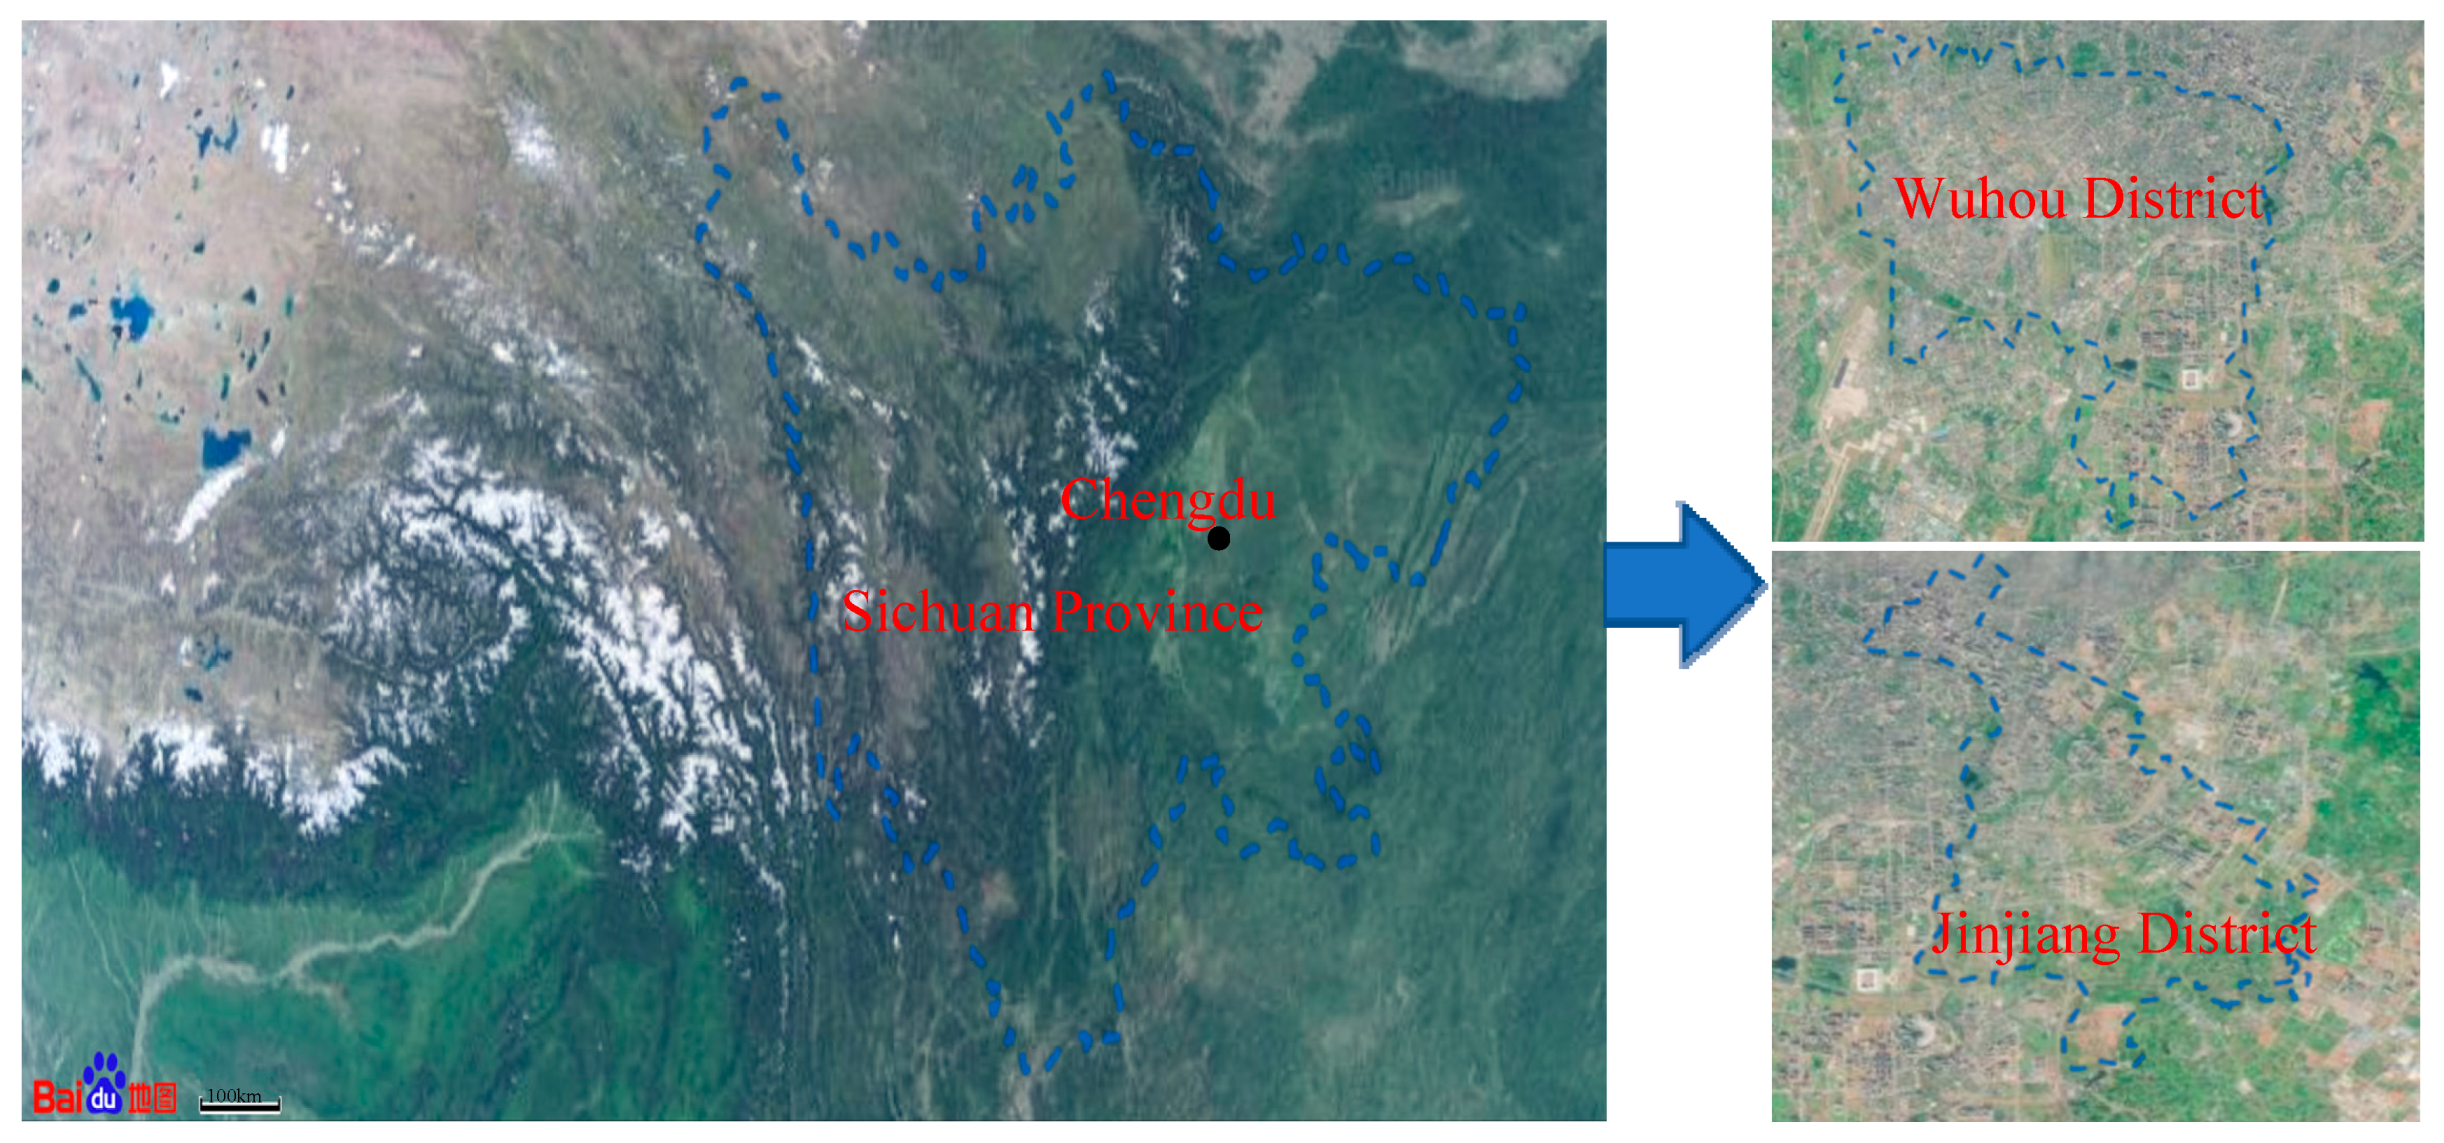
The risk of natural disasters, such as earthquakes, floods, and landslides in southwestern China, is high, and the local population and infrastructure are vulnerable to devastating effects. Chengdu, Sichuan Province is located at 30.38 °N, 104.03 °E and is one of provincial capitals in China. It is famous for its history and tourist attractions and belongs to the middle of the Sichuan Basin that is relatively flat. The total area of Chengdu is 14,605 km2, and it is the most populous city in Sichuan Province, with approximately 16.33 million inhabitants (statistics for 2019). The geographical location is shown in Figure 5 left half. Chengdu faces an extremely high risk of natural disasters. The Longquanshan fault zone passes through Chengdu. Since 1967, a total of 20 earthquakes of 4.0 magnitude or more have occurred in it. The worst was an 8.0 magnitude earthquake in Sichuan Province on 12 May 2008, and successive aftershocks and secondary disasters caused thousands of families to be homeless. In addition, many people suffered varying degrees of physical and psychological harm. For example, certain hospitals in Chengdu, the capital of Sichuan Province, were severely damaged. Many families did not receive immediate medical assistance following the disaster, and a large number of families were transferred to hospitals in other regions for treatment. The disaster had a massive impact, among which the Sichuan government took certain actions. In response to the lack of emergency shelters, facilities, and open spaces in cities, special urban plans were formulated. Prior to destructive disasters, strategic infrastructure and services are planned strategically.
Next, Section 4.2 discusses the detailed information of Wuhou District and Jinjiang District of Chengdu City, Sichuan Province, and explains the characteristics of the different research areas.

4.2. Characteristics of the Geographic Zone and Parameter Defining

By analyzing Wuhou District and Jinjiang District of Chengdu, Sichuan Province, the model construction process defined in Section 3 is explained. The location of study area is shown in Figure 5. Families and house characteristics in the study area are obtained from the National Bureau of Statistics database, geospatial data cloud, and field surveys. Shelters can meet basic living needs and provide psychological or medical services before ample relief supplies arrive. According to the standards of emergency shelter operations and supporting facilities formulated, candidate emergency shelters must avoid natural disaster-prone areas and are located on flat terrains, which can facilitate post-disaster evacuation and material transportation [18,19].
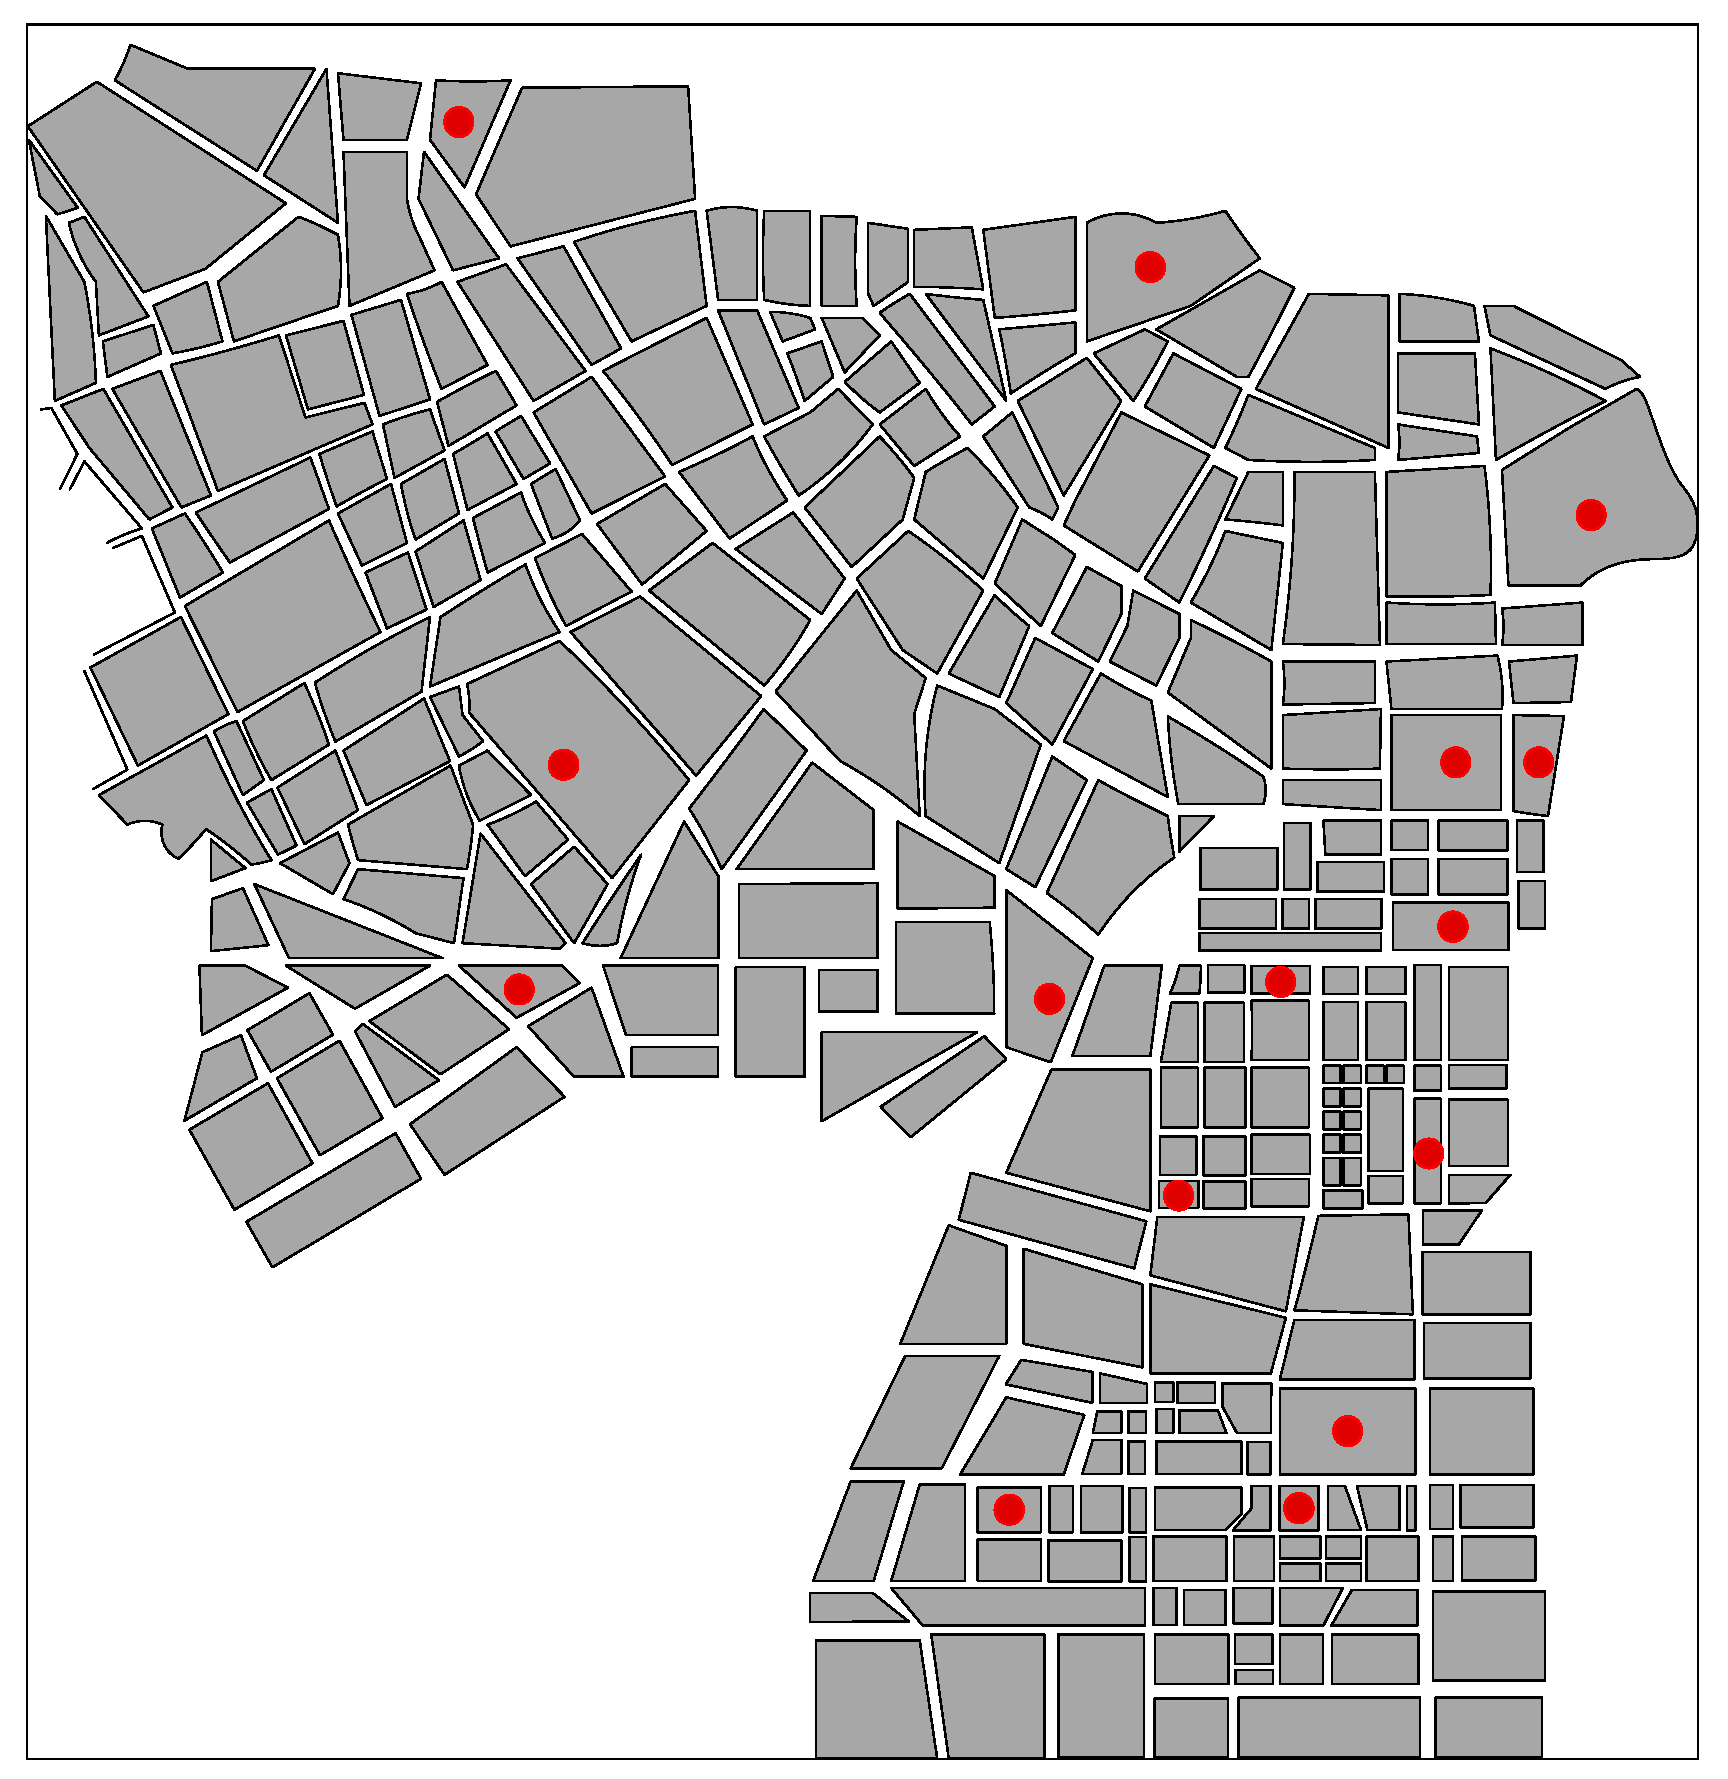
Wuhou District is the most populous county in Chengdu. As of the end of 2018, the resident population was 1.087 million, with a GDP of 109.14 billion RMB. With the rapid economic development, the area is facing a high risk of earthquake disaster. The special layout plan of Chengdu makes full use of existing large open spaces, such as parks, green spaces, squares, school playgrounds, stadiums, and other places to plan and construct emergency shelters. To combine the facility’s own advantages, warehouses are also considered, and 15 locations eligible for evaluation as candidate shelters are identified, among which the indoor facilities are S12, S13, S14, and S15. Figure 6 shows the distribution of candidate points in this area. Given the different services provided by the shelters, additional spaces and resources are needed for the protection of psychological medical services. Thus, the ability to provide psychological medical services is lower than basic living services.
For the loss function, after considering the disaster warning, victims must reach the evacuation facility within half an hour and divide the refuge center into three coverage levels. The coverage radius of each open facility includes 1000, 2000, and 3000 meters, assuming p 1 = 100 % , p 2 = 75 % , and p 3 = 50 % , respectively. The emergency rescue life and medical supplies are packaged according to standards. The assumed demand for the supplies L and P for the victims who need basic living services is assumed to be 1 and 0.5. The assumed demand for the supplies L and P for the victims who require medical or psychological assistance is assumed to be 1 and 1. For shelters that are unsuitable for storing materials and providing psychological medical assistance, the study assumes distance to the surrounding material storage facilities, such as supermarkets and warehouses, is less than 1000 meters to increase rescue speed. Moreover, its distance from medical facilities should be less than 1000 meters. The study area includes 50 sites with asylum needs. The number of victims in need of psychological or medical assistance depends on two situations. The first is based on the number of children under the age of nine and the elderly over the age of 70. The second is the proportion of disabled persons at various demand points [45,46]. Considering the great impact of the earthquake disaster, γ = 30% is set, the proportion of basic living services provided by Type II shelters is 30%. All cost parameters used in the following experiments are shown in Table 4.
To estimate the priorities of the criteria for the selection of emergency shelters, a questionnaire is distributed to 10 experts with extensive field and research experience in emergency management. The selected experts possess an average of 10 years of experience in disaster relief and management. After careful consideration, the selection of experts can pass the consistency test, and they have consensus on the priority of indicators. Through the aggregation of the priorities, a standard priority vector is calculated. Candidate sites must be evaluated by the rescue agency staff who understand the local situation. Therefore, a group of seven professionals who have participated in rescue operations in Sichuan evaluate alternatives by using fuzzy language term sets and indicator priorities. Table 5 displays the final weighted results of the candidate points.
To further prove the robustness of the model, this study also takes another severely affected area during the Wenchuan earthquake as an example. Jinjiang District is the smallest area in Chengdu and its surface area is 61.12 square kilometers. In 2018, Jinjiang District had a GDP of 103.477 billion RMB and a population of approximately 566,400 (2017 Census). According to the layout plan of emergency shelters in the central urban area of the local government, nine sites are selected as candidate shelters, among which the indoor venues are S7, S8, and S9. The distance from the residential area to the evacuation facility is estimated from geographic coordinates.

5. Results and Analysis

Using the relative weights of candidate points as model input parameters, MATLAB2018b is employed to solve a mixed integer multi-objective optimization model on a PC with a 3.60-GHz Intel Core i7-4790 CPU and 8 GB of RAM, running Windows® 10 OS.

5.1. Results for the Case Study

In the case study of Wuhou District, the model is run by considering each target individually to determine the optimal value for the target. In addition, when a single target is given the same weight, the results of the evacuation site selection are shown in Table 6.
Table 6 shows that two of the 15 candidate points (S5 and S9) are selected as Type I shelters, and seven are chosen as Type II shelters. The third line refers to the number of victims who need service 1 to be allocated to open shelters (Allocation 1). Similarly, the fourth line shows the number of victims who need service 2 to be allocated to open shelters (Allocation 2). S5 and S9 are only Type I shelters, so assigning victims who need mental health services to these locations is impossible. The last two lines indicate the amounts of living and medical materials stored in indoor shelters or surrounding facilities.
The difference between the achieved target and the single target optimal value is presented in Table 7. Given that the Objective (19) function value for optimizing the evacuation distance is in the order of magnitude, the original value is rounded down to log base e. It can be seen from Table 7 that the evacuation distance obtained from the optimization solution is 25.95 instead of 25.15. The evacuation distance optimization result is the best among the three target values, which is slightly different from the ideal value. The optimal number of refuge centers is nine, one more than the minimum number of shelters. The result of the subjective weight optimization finally deviates greatly from the optimal target value. When the subjective weight is as important as the other two target values, it is difficult to achieve better results. Considering that the parameter W g in the model may affect the optimization result, different values are used to reflect the influence on the solution. The results of the optimization under the other five different weights are shown in Table 8.
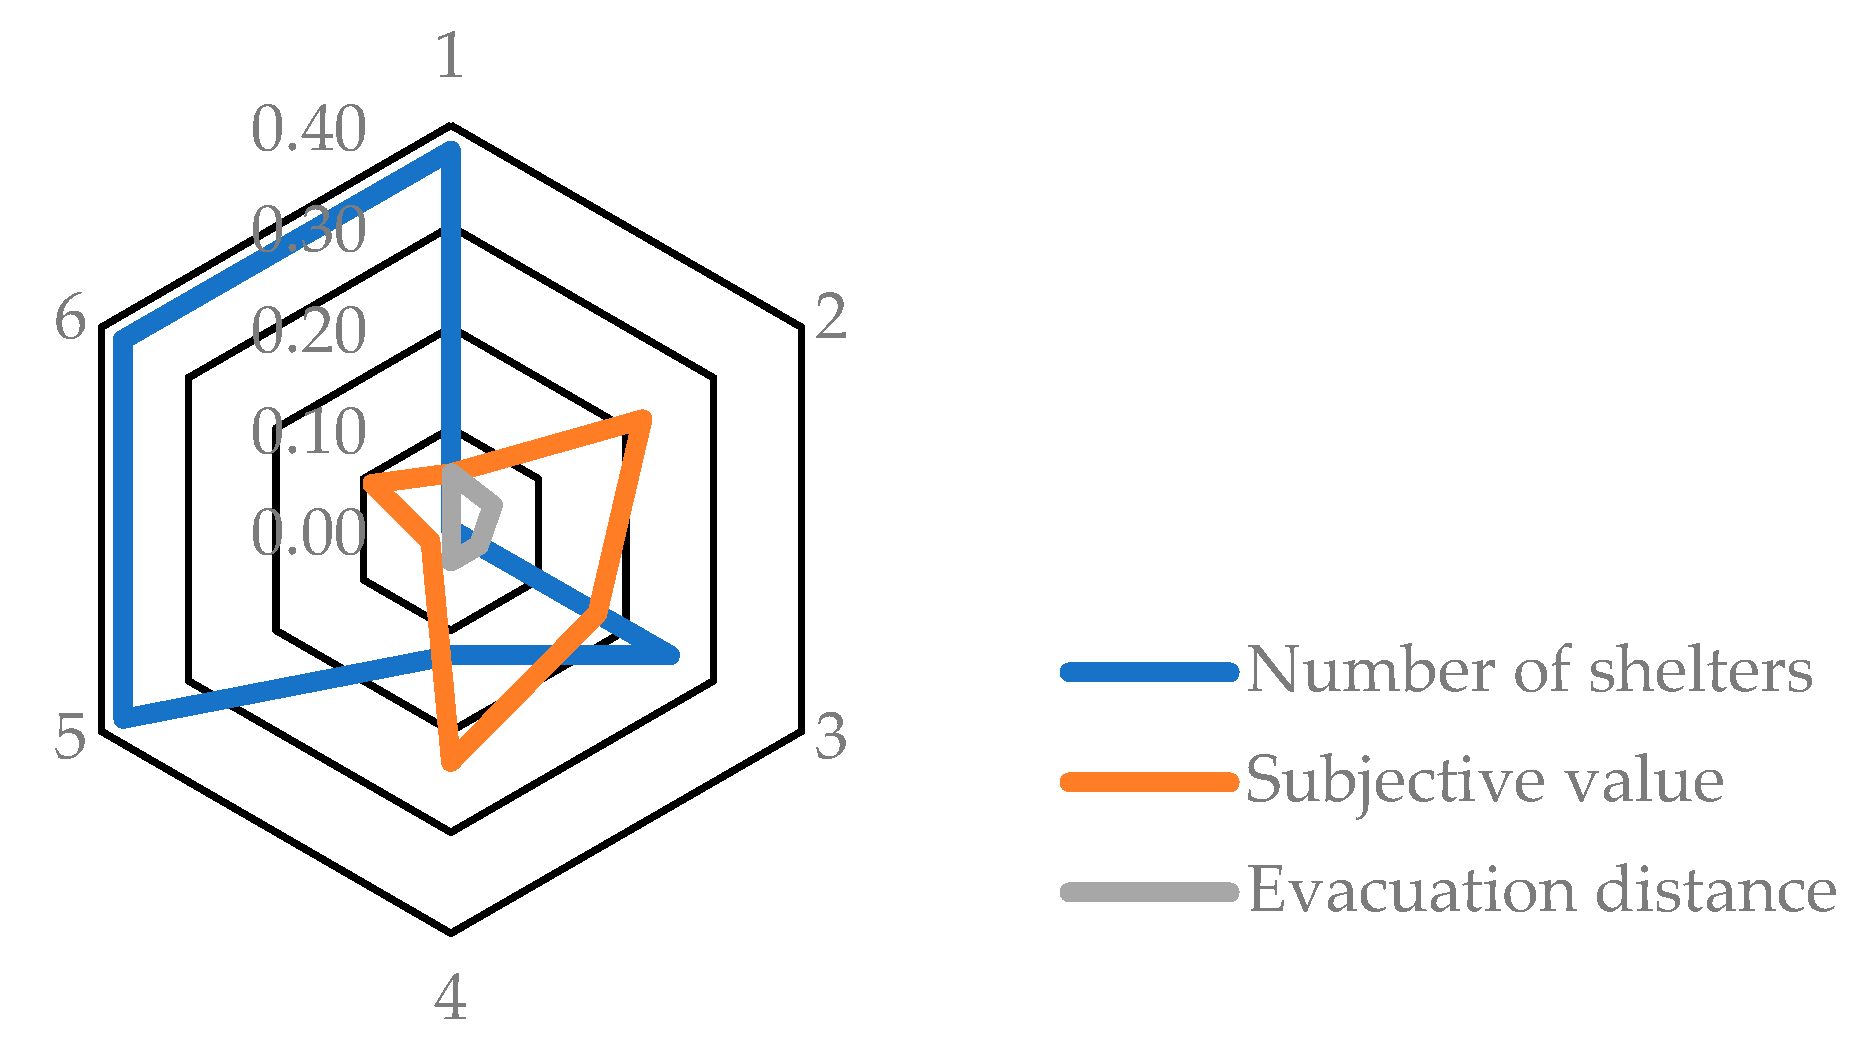
The radar chart in Figure 7 illustrates the effect of changes in target weights on target deviation. Radar charts indicate that the total objective function is sensitive to changes in subjective weights. The process of shelter selection and the importance of qualitative factors are considered. The combination of qualitative and quantitative factors makes the site selection decision reasonable. This illustrates the importance of combining qualitative dimensions with quantifiable factors, while locations with poor service quality are unlikely to be selected as open shelters. The optimization results are also sensitive to changes in the number of shelters. It can be seen that the model is very sensitive to the site of the shelter while considering the number of open shelters. When the number of shelters is taken seriously, deviations can even be eliminated. The rational planning of the number of shelters has an important impact on site selection results, and the results are least sensitive to changes in shelter distances.
It can also be seen from Table 8 that when the deviation of the number of shelters decreases, the deviations of the evacuation distance and subjective weight increase. However, when the deviation of the number of shelters increases, deviation of the remaining two objective function values can be reduced. Therefore, increasing the number of open shelters is beneficial for optimizing the distance and quality of shelters.
To further evaluate the impact of rescue budget and coverage ratio on rescue effectiveness, we set the budget amount to vary from 7,500,000 to 8,500,000, different coverage distances ( θ ) and coverage ratios ( p ): θ 1 = 1000   m ,   2000   m ,   3000   m ; θ 2 = 750   m ,   1500   m ,   3000   m ; p 1 = 100 % ,   75 % ,   50 % ; p 2 = 100 % ,   65 % ,   45 % . The experimental results are shown in Table 9, Table 10, Table 11 and Table 12 below.
By comparing the results in Table 9, Table 10, Table 11 and Table 12, we can conclude that when the budget amount increases, the deviation of the subjective weights slightly decreases. This condition may signify that additional funds can be used to open other shelters with improved subjective evaluation performance, thereby increasing the overall quality of service. Similarly, the distance between victims and shelters is close to the optimal value in the case of single goals. Although there is a large deviation between the number of open shelters and the case of single-objective optimization, the increase in rescue budget is an effective method to improve the rescue effect when the number of alternative shelters is sufficient.
Table 9 and Table 10 present that changing the coverage rate of different distance levels of the shelters can increase the subjective weight of the shelters, although the deviation of the shelters increases. In this way, life and psychological medical services are well provided to the victims. The same distance and reduced coverage ratio have a great impact on the evacuation distance. In the case of multi-objective optimization, the evacuation distance is even without deviation from the single-objective solution. The same conclusion can also be drawn from Table 11 and Table 12.
Observing Table 9 and Table 11, we can find that the distance between victims and shelters is further restricted when coverage ratios are constant. With the limited rescue budget, the effect is not obvious, and the evacuation distance deviation has increased. When funds are sufficient, the deviation of the distance to the shelters are significantly improved. The reason is that excess funds are available to open additional shelter facilities, which is reflected in the increased deviation of the number of open shelters. By reducing the distance covered by shelters, the overall quality of shelter services has also improved. Similar observations can also be made by Table 10 and Table 12. Setting stricter shelter coverage is beneficial to improve rescue results.
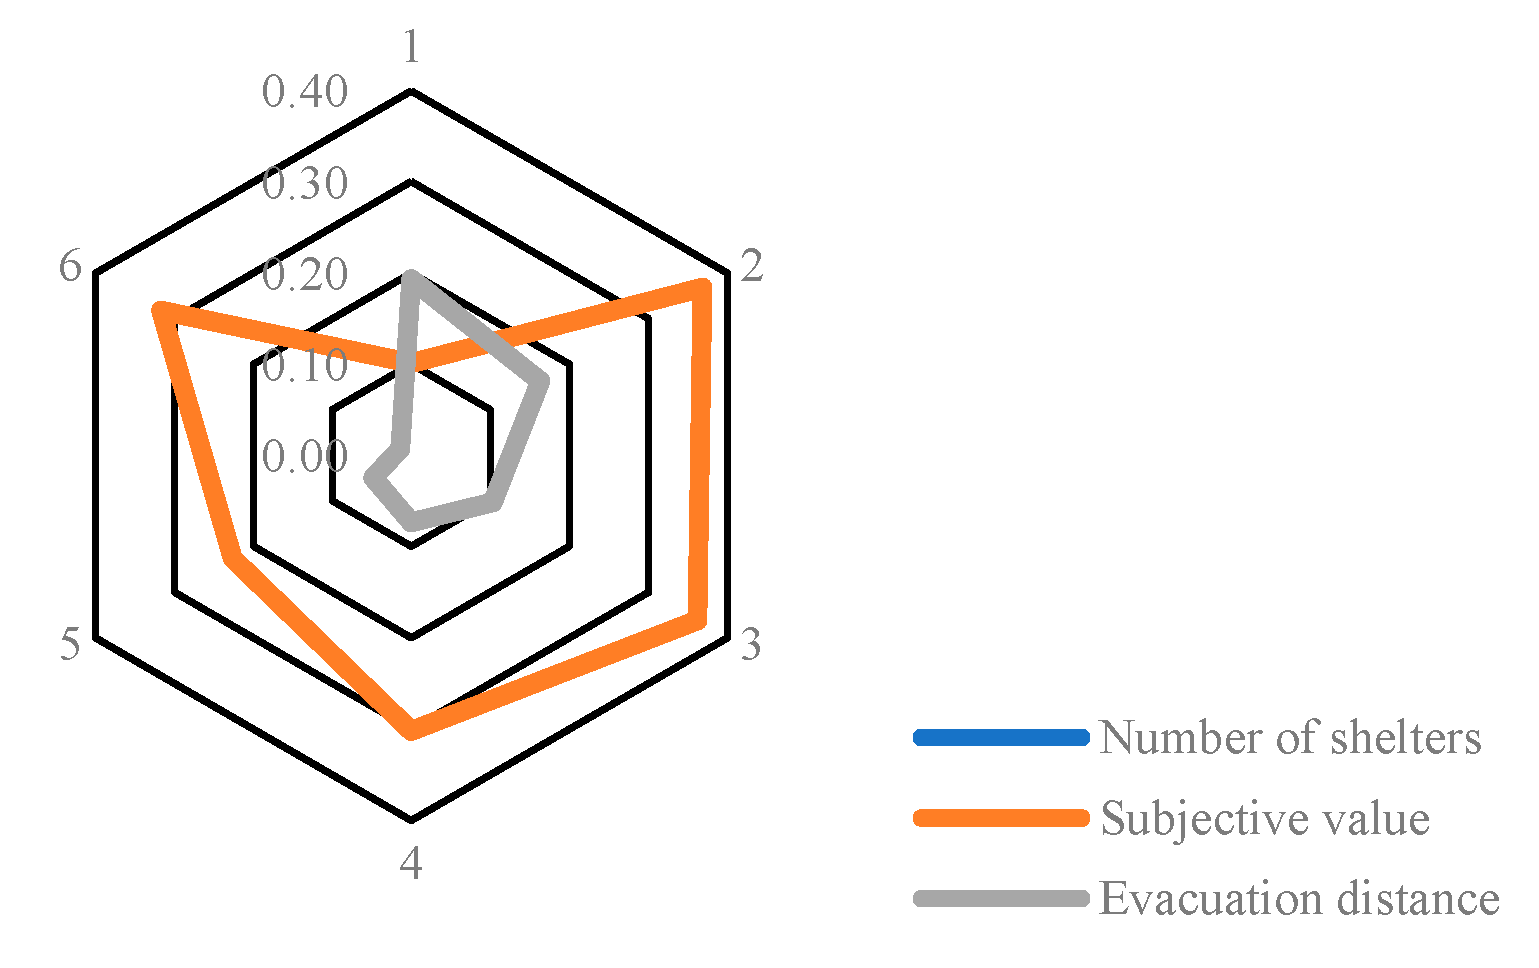
In the Jinjiang District case study, the model is calculated by assigning the same priority to the three targets to obtain a compromised result. The results of the most preferred sites and allocations are shown in Table 13. One of the nine candidate points (S7) is selected as a Type I shelter, and four are chosen as Type II shelters. Table 14 shows the optimal values of achieved and single goals. The deviation of the evacuation distance target value is small, and the number of open shelters is optimal. The largest deviation is the distance from the victims to shelters. The deviation of different target weights in Table 8 is illustrated in Figure 8.
Similarly, to clarify once again the impact of rescue budget and shelter coverage ratio on the overall rescue effect, the budget amount is set to vary from 4,500,000 to 5,500,000, and different coverage distances ( θ ) and coverage ratios ( p ): θ 1 = 1000   m ,   2000   m ,   3000   m ; θ 2 = 750   m ,   1500   m ,   3000   m ; p 1 = 100 % ,   75 % ,   50 % ; p 2 = 100 % ,   65 % ,   45 % . The experimental results are shown in Table 15, Table 16, Table 17 and Table 18 below.

5.2. Guidelines for Using Optimization Models

In real life, victims often randomly choose an evacuation site nearby after a disaster. However, these unplanned locations cannot immediately meet their needs. Authorities have difficulty using the scarce rescue resources to provide emergency relief, and in the long run, they cannot conveniently live for a while. No plan was implemented for the migration of affected people after the Wenchuan earthquake. Most shelters were spontaneously selected without considering the different needs of victims. Therefore, since 2008, planning and construction of emergency shelters has received increasing attention throughout the country. By solving the results of these two cases, the effectiveness and importance of the model in selecting opened shelters, allocating victims, and relocating supplies are emphasized.
The proposed multi-criteria decision-making model considers all the important influencing factors necessary for people’s lives and medical processes after the disaster. The model also aims to be a planning tool for improving the decision-making ability of disaster managers in location and allocation. Existing high subjective evaluation warehouses are included in the candidate points set, and an attempt is made to find a suitable facility location in the requisition and use of emergency humanitarian logistics [28,47].
The model has optimized three different goals at the same time. The first goal attempts to take into account the victims’ relocation to the nearest shelter. The model also ensures that victims are placed in the most appropriate shelters selected based on qualitative criteria. The final goal is to keep the number of open shelters to a minimum for better management in costs and logistics. The model performs single-objective optimization to propose specific target values for different targets, and reduces deviations to finally determine an effective solution. Therefore, it may be beneficial to address the evacuation of people and the attention to victims at shelters.
In different disaster-prone areas, the relative importance of different targets can change. In some cases, convenient logistics is the most important factor, while in other cases, evacuation nearby is more popular than others. Therefore, the constructed model can satisfy decision makers to set weights for each objective function and specify preferences to determine the best evacuation location and personnel and material allocation plan. By performing a sensitivity analysis on the model, the available rescue budget and coverage of different refuge levels are identified as key parameters. By observing the effect of parameter value changes on the optimization results of the objective function, determining and selecting “important” shelters are suggested. Therefore, the proposed evacuation site selection model is helpful for reasonable planning and immediate rescue after disasters.

6. Conclusions and Future Work

In recent years, various natural disasters have occurred frequently. In such emergencies, authorities must use existing living and medical resources to provide emergency assistance for strengthening their disaster response capabilities. Therefore, in this study, we have considered the full coverage of the needs of victims and determined the location of shelters and the allocation of affected people to use certain facilities in large-scale emergencies for distributing supplies. The obtained solution can meet the different needs of victims to the greatest extent with limited rescue funds.
In this study, we have solved the problem of the location of temporary shelters and the allocation of victims after disaster. We have also determined the amount of materials stored. The inclusion of available warehouses in the available candidate set can help effectively arrange rescue resources to meet demands in case of large-scale emergencies. Such an arrangement is more important than accurately determine how to allocate supplies among facilities. The relevant literature has been reviewed, and qualitative factors have been taken as important factors to construct a mathematical model, which reflects the rationality of multi-criteria decision and group decision making in the optimization of evacuation sites. Fuzzy AHP and fuzzy TOPSIS methods involve vagueness with the subjective judgment of decision makers. It also helps decision makers to benefit from the comprehensive expertise of multiple decision-making experts, using their knowledge to optimize shelter locations and allocation processes. Finally, a comprehensive consideration of qualitative and quantitative factors is used to solve the problem of site selection and relocation of the victims. The analysis has identified multiple site selection criteria and three objectives to select the best shelter location from a set of candidate points. The model has matched the different needs of victims with nearby shelters, considering the level of refuge and limited relief funds. The model has also been tested and sensitively analyzed using data from parts of Chengdu during the Wenchuan earthquake. The established model has obtained the optimal solution after a compromise, and the results have significantly changed as important parameters change.
In this work, the model is limited to single-cycle post-disaster location-allocation decisions and does not involve the subsequent displacement of victims. Future studies will establish a multi-stage optimization model, combining the impact and uncertainty of secondary disasters, to provide optimization solutions in different periods. Future research should also consider mitigation strategies from the perspective of different stakeholders in natural disaster risk management [48,49]. Similarly, reducing damage from disasters through retrofitting and purchasing insurance is an important measure [50].

Author Contributions

S.G. designed and revised this paper; S.G. and S.Z. collected and analyzed the data and wrote the paper; H.H. provided valuable research insights into the analysis and investigation. All authors have read and agreed to the published version of the manuscript.

Funding

This research was funded by the Fundamental Research Funds for the Central Universities, grant number 2019YJS061.

Acknowledgments

Thanks to the anonymous peer reviewers and the editors for their critical comments, which helped to improve significantly the quality of this paper.

Conflicts of Interest

The authors declare no conflict of interest.

References

  1. IFRC. What is a Disaster? Available online: http://www.ifrc.org/en/what-we-do/disaster-management/about-disasters/what-is-a-disaster/ (accessed on 12 September 2019).
  2. Trivedi, A.; Singh, A.; Chauhan, A. Analysis of key factors for waste management in humanitarian response: An interpretive structural modelling approach. Int. J. Disaster Risk Red. 2015, 14, 527–535. [Google Scholar] [CrossRef]
  3. Day, J.M.; Melnyk, S.A.; Larson, P.D.; Davis, E.W.; Whybark, D.C. Humanitarian and disaster relief supply chains: A matter of life and death. J. Supply Chain Manag. 2012, 48, 21–36. [Google Scholar] [CrossRef]
  4. Duque, P.A.M.; Dolinskaya, I.S.; Sörensen, K. Network repair crew scheduling and routing for emergency relief distribution problem. Eur. J. Oper. Res. 2016, 248, 272–285. [Google Scholar] [CrossRef]
  5. Zhu, L.; Ding, J.; Ma, Z. Collaborative Optimization of heterogeneous transportation problems under emergency. Chin. J. Manag. Sci. 2018, 15, 309–316. [Google Scholar] [CrossRef]
  6. Gu, J.; Zhou, Y.; Das, A.; Moon, I.; Lee, G.M. Medical relief shelter location problem with patient severity under a limited relief budget. Comput. Ind. Eng. 2018, 125, 720–728. [Google Scholar] [CrossRef]
  7. Trivedi, A.; Singh, A. A hybrid multi-objective decision model for emergency shelter location-relocation projects using fuzzy analytic hierarchy process and goal programming approach. Int. J. Proj. Manag. 2017, 35, 827–840. [Google Scholar] [CrossRef]
  8. Blecken, A. Logistics in the Context of Humanitarian Operations. In International Heinz Nixdorf Symposium; Springer: Heidelberg, Berlin, 2010; pp. 85–93. [Google Scholar] [CrossRef]
  9. Holguín-Veras, J.; Jaller, M.; Van, W.L.N.; Perez, N.; Wachtendorf, T. On the unique features of post-disaster humanitarian logistics. J. Oper. Manag. 2012, 30, 494–506. [Google Scholar] [CrossRef]
  10. Yu, W. Transshipment model for emergency materials based on time satisfaction criterion. J. Syst. Manag. 2013, 22, 882–887. [Google Scholar] [CrossRef]
  11. Zheng, B.; Ma, Z.; Zhou, Y. Bi-level model for dynamic location-transportation problem for post-earthquake relief distribution. J. Syst. Manag. 2017, 26, 326–337. [Google Scholar]
  12. Zhang, M.; Zhang, L. System of evaluation indices of emergency facility location and model based on facility failure scenarios. Chin. J. Manag. Sci. 2017, 24, 129–136. [Google Scholar] [CrossRef]
  13. Yu, D.; Gao, L.; Zhao, S. Location-allocation optimization model for emergency facilities and algorithm with maximum time satisfaction. Syst. Eng. 2018, 36, 95–102. [Google Scholar]
  14. Perez, R.N. Inventory Allocation Models for Post-Disaster Humanitarian Logistics with Explicit Consideration of Deprivation Costs. PhD Thesis, Rensselaer Polytechnic Institute, Troy, MA, USA, 2011. [Google Scholar]
  15. Martelo, M.A.J. Resource Allocation Problems during Disasters: Points of Distribution Planning and Material Convergence Control. PhD Thesis, Rensselaer Polytechnic Institute, Troy, MA, USA, 2011. [Google Scholar]
  16. Holguín-Veras, J.; Pérez, N.; Jaller, M.; Van, W.L.N.; Aros-Vera, F. On the appropriate objective function for post-disaster humanitarian logistics models. J. Oper. Manag. 2013, 31, 262–280. [Google Scholar] [CrossRef]
  17. Holguín-Veras, J.; Jaller, M.; Wachtendorf, T. Comparative performance of alternative humanitarian logistic structures after the Port-au-Prince earthquake: ACEs, PIEs, and CANs. Transp. Res. Part A Policy Pract. 2012, 46, 1623–1640. [Google Scholar] [CrossRef]
  18. GB 21734-2008. Emergency Shelter for Earthquake Disasters-Site and its Facilities; China National Standardizing Committee: Beijing, China, 2008. [Google Scholar]
  19. GB/T 33744-2017. Emergency Shelter for Earthquake Disasters-Guidelines on the Operation and Management; China National Standardizing Committee: Beijing, China, 2017. [Google Scholar]
  20. Wang, H.; Du, L.; Hu, D.; Wang, J. Location-routing problem for relief distribution in emergency logistics under uncertainties. J. Syst. Manag. 2015, 24, 828–834. [Google Scholar]
  21. Li, A.C.Y.; Nozick, L.; Xu, N.; Davidson, R. Shelter location and transportation planning under hurricane conditions. Transp. Res. Part E 2012, 48, 715–729. [Google Scholar] [CrossRef]
  22. Kınay, Ö.B.; Saldanha-da-Gama, F.; Kara, B.Y. On multi-criteria chance-constrained capacitated single-source discrete facility location problems. Omega 2019, 83, 107–122. [Google Scholar] [CrossRef]
  23. Wu, F.; Cheng, T. Dynamic decision support for emergency response under uncertain environment. Sof. Sci. 2014, 28, 26, 29+34. [Google Scholar] [CrossRef]
  24. Yuan, W.; Peng, Y.; Yang, F. Two-level emergency centers location model based on the hazardous chemicals‘ accidents. Syst. Eng. Theory Pract. 2015, 35, 728–735. [Google Scholar]
  25. Ozkapici, D.B.; Ertem, M.A.; Aygüneş, H. Intermodal humanitarian logistics model based on maritime transportation in Istanbul. Nat. Hazards 2016, 83, 345–364. [Google Scholar] [CrossRef]
  26. Yahyaei, M.; Bozorgi-Amiri, A. Robust reliable humanitarian relief network design: An integration of shelter and supply facility location. Ann. Oper. Res. 2019, 283, 897–916. [Google Scholar] [CrossRef]
  27. Amideo, A.E.; Scaparra, M.P.; Kotiadis, K. Optimising shelter location and evacuation routing operations: The critical issues. Eur. J. Oper. Res. 2019, 279, 279–295. [Google Scholar] [CrossRef]
  28. Boonmee, C.; Arimura, M.; Asada, T. Facility location optimization model for emergency humanitarian logistics. Int. J. Disaster Risk Red. 2017, 24, 485–498. [Google Scholar] [CrossRef]
  29. Zhao, X.; Ma, Y.; Liang, P.; Qin, L.; Zhou, H.; Yuan, Y.; Xu, W. Analysis of earthquake emergency shelter location selection based on particle swarm optimization algorithm: Wenping of Ludian in Yunnan Province as a case. J. Beijing Norm. Univ (Nat. Sci.) 2018, 54, 217–223. [Google Scholar] [CrossRef]
  30. Kılcı, F.; Kara, B.Y.; Bozkaya, B. Locating temporary shelter areas after an earthquake: A case for Turkey. Eur. J. Oper. Res. 2015, 243, 323–332. [Google Scholar] [CrossRef]
  31. Li, J. Research on Strategic Decision Models of Service Areas and Method for Optimize Addressing of the Urban Shelters. PhD Thesis, Wuhan University, Wuhan, China, 2011. [Google Scholar]
  32. Xu, J.; Yin, X.; Chen, D.; An, J.; Nie, G. Multi-criteria location model of earthquake evacuation shelters to aid in urban planning. Int. J. Disaster Risk Red. 2016, 20, 51–62. [Google Scholar] [CrossRef]
  33. Hosseini, S.M.A.; Fuente, A.; Pons, O. Multicriteria decision-making method for sustainable site location of post-disaster temporary housing in urban areas. J. Constr. Eng. Manag. 2016, 142, 04016036. [Google Scholar] [CrossRef] [Green Version]
  34. Saaty, T.L. How to make a decision: The analytic hierarchy process. Eur. J. Oper. Res. 1990, 48, 9–26. [Google Scholar] [CrossRef]
  35. Önüt, S.; Efendigil, T.; Kara, S.S. A combined fuzzy MCDM approach for selecting shopping center site: An example from Istanbul, Turkey. Expert. Syst. Appl. 2010, 37, 1973–1980. [Google Scholar] [CrossRef]
  36. Li, C.Z.; Hong, J.; Xue, F.; Shen, G.Q.; Xu, X.; Mok, M.K. Schedule risks in prefabrication housing production in Hong Kong: A social network analysis. J. Clean Prod. 2016, 134, 482–494. [Google Scholar] [CrossRef] [Green Version]
  37. Wang, J.W.; Cheng, C.H.; Huang, K.C. Fuzzy hierarchical TOPSIS for supplier selection. Appl. Sof. Comput. 2009, 9, 377–386. [Google Scholar] [CrossRef]
  38. Veerabathiran, R.; Srinath, K.A. Application of the extent analysis method on fuzzy AHP. Int. J. Eng. Sci. Technol. 2012, 4, 3472–3480. [Google Scholar] [CrossRef]
  39. Hwang, C.; Yoon, K. A State of the Art Survey. In Multiple Attribute Decision Making: Methods and Applications; Sprinnger-Verlag: New York, NY, USA, 1981. [Google Scholar]
  40. Awasthi, A.; Chauhan, S.S.; Omrani, H.; Panahi, A. A hybrid approach based on SERVQUAL and fuzzy TOPSIS for evaluating transportation service quality. Comput. Ind. Eng. 2011, 61, 637–646. [Google Scholar] [CrossRef]
  41. Yadav, S.P.; Kumar, S.A. Multi-Criteria Interval-Valued Intuitionistic Fuzzy Group Decision Making for Supplier Selection with TOPSIS Method. In Proceedings of the Rough Sets, Fuzzy Sets, Data Mining and Granular Computing, 12th International Conference (RSFDGrC 2009), Delhi, India, 15–18 December 2009. [Google Scholar]
  42. Taylan, O.; Bafail, A.O.; Abdulaal, R.M.S.; Kabli, M.R. Construction projects selection and risk assessment by fuzzy AHP and fuzzy TOPSIS methodologies. Appl. Sof. Comput. 2014, 17, 105–116. [Google Scholar] [CrossRef]
  43. Zadeh, L.A. Learning Systems and Intelligent Robots. In The Concepts of a Linguistic Variable and Its Application to Approximate Reasoning; Springer: New York, NY, USA, 1975. [Google Scholar]
  44. Berman, O.; Krass, D. The generalized maximal covering location problem. Comput. Oper. Res. 2002, 29, 563–581. [Google Scholar] [CrossRef]
  45. Pérez-Galarce, F.; Canales, L.J.; Vergara, C.; Candia-Vejar, A. An optimization model for the location of disaster refuges. Socio-Econ. Plan. Sci. 2017, 59, 56–66. [Google Scholar] [CrossRef]
  46. Zhao, L.; Li, H.; Sun, Y.; Huang, R.; Hu, Q.; Wang, J.; Gao, F. Planning emergency shelters for urban disaster resilience: An integrated location-allocation modeling approach. Sustainability 2017, 9, 2098. [Google Scholar] [CrossRef] [Green Version]
  47. Ma, Y.; Xu, W.; Qin, L.; Zhao, X. Site Selection Models in Natural Disaster Shelters: A Review. Sustainability 2019, 11, 399. [Google Scholar] [CrossRef] [Green Version]
  48. Shan, X.; Peng, J.; Kesete, Y.; Gao, Y.; Kruse, J.; Davidson, R.A.; Nozick, L.K. Market insurance and self-insurance through retrofit: Analysis of hurricane risk in north carolina. ASCE-ASMEJ RiskUncertain Eng. Syst. Part A Civ. Eng. 2016, 3. [Google Scholar] [CrossRef] [Green Version]
  49. Peng, J.; Shan, X.G.; Gao, Y.; Kesete, Y.; Davidson, R.A.; Nozick, L.K.; Kruse, J. Modeling the integrated roles of insurance and retrofit in managing natural disaster risk: A multi-stakeholder perspective. Nat. Hazards 2014, 74, 1043–1068. [Google Scholar] [CrossRef]
  50. Shan, X.; Felder, F.A.; Coit, D.W. Game-theoretic models for electric distribution resiliency/reliability from a multiple stakeholder perspective. IISE Trans. 2017, 49, 159–177. [Google Scholar] [CrossRef]
Figure 1. Multi-standard location method for emergency shelter.
Sustainability 12 01759 g001
Figure 2. Frame diagram of the research problem.
Sustainability 12 01759 g002
Figure 3. Hierarchy of shelter alternative site decisions.
Sustainability 12 01759 g003
Figure 4. Boundary covering function.
Sustainability 12 01759 g004
Figure 5. The areas in question.
Sustainability 12 01759 g005
Figure 6. Distribution of candidate points in the study area.
Sustainability 12 01759 g006
Figure 7. Deviation of target values under different weights.
Sustainability 12 01759 g007
Figure 8. Deviation of target values under different weights.
Sustainability 12 01759 g008
Table 1. Qualitative factors of shelter location.
FactorReference
TopographyTrivedi and Singh [7], Kılcı et al. [30], Li [31], Xu [32], Hosseini [33]
Geological typeTrivedi and Singh [7], Xu et al. [32], Hosseini et al. [33]
SlopeTrivedi and Singh [7], GB/T 33744-2017 [19], Kılcı et al. [30]
VegetationGB/T 33744-2017 [19], Li et al. [21], Yahyaei and Bozorgi-Amiri [26]
Power facilitiesZhu et al. [5], GB/T 33744-2017 [19], Yuan et al.[24], Yahyaei and Bozorgi-Amiri [26]
Sanitation systemGB/T 33744-2017 [19], Li et al. [21], Kınay et al. [22]
Table 2. Language variables and trigonometric fuzzy values.
DefinitionFuzzy Value
Equally important(0, 1, 1)
Quite important(1, 3, 5)
Very important(3, 5, 7)
Extremely important(5, 7, 9)
Especially Important(7, 9, 9)
Table 3. Evaluation level language terminology.
DefinitionFuzzy Value
Very low(0, 1, 3)
Low(1, 3, 5)
General(3, 5, 7)
High(5, 7, 9)
Very high(7, 9, 9)
Table 4. Cost parameters in the experiment.
CostValue
Fixed construction costs for open shelters$10,000
Variable construction costs per unit of living service provided$50
Variable construction cost per additional capacity of medical or psychological assistance provided$100
Purchasing expenses for daily supplies$30
Procurement costs of medical supplies$50
Table 5. Candidate point weights.
Candidate PointWeight
S10.1636
S20.1608
S30.1673
S40.1350
S50.1522
S140.1456
S150.1314
Table 6. Location and allocation of different types of shelters.
LocationS1S2S3S4S5S6S7S8S9S10S11S12S13S14S15
Type I000010001000000
Type II111000010001110
Allocation 1479538626238060820041766248001360353015370
Allocation 244873748460700002969000767151310290
Living Materials9282761010845060820071456248002126504325660
Medical Materials688556807730030410050573124001446328018000
Table 7. Deviations between target and optimal values.
ObjectiveTarget ValueSingle Objective Optimal ValueDeviation (%)
Distance to shelters25.9525.153.18%
Subjective weight1.191.8123%
Number of shelters9812.5%
Table 8. Effect of different weights on the compromise.
NumberObjective WeightDistance to SheltersSubjective WeightNumber of Shelters
1(0.1, 0.65, 0.25)5.57%5.52%37.5%
2(0.15, 0.05, 0.8)4.77%21.84%0%
3(0.3, 0.15, 0.55)3.18%16.71%25%
4(0.33, 0.33, 0.33)3.18%23%12.5%
5(0.5, 0.35, 0.15)0%2.37%37.5%
6(0.7, 0.15, 0.15)0%8.99%37.5%
Table 9. Deviations of goal optimization results under θ 1 and p 1 .
BudgetDistance to SheltersSubjective WeightNumber of Shelters
7,500,0003.18%34.03%12.5%
8,000,0000.08%30.91%12.5%
8,500,0000.44%23%25%
Table 10. Deviations of goal optimization results under θ 1 and p 2 .
BudgetDistance to SheltersSubjective WeightNumber of Shelters
7,500,0000.44%32.27%11.11%
8,000,0000%27.78%22.22%
8,500,0000%25.91%22.22%
Table 11. Deviations of goal optimization results under θ 2 and p 1 .
BudgetDistance to SheltersSubjective WeightNumber of Shelters
7,500,0003.5%30.15%25%
8,000,0000%24.65%25%
8,500,0000%17.9%37.5%
Table 12. Deviations of goal optimization results under θ 2 and p 2 .
BudgetDistance to SheltersSubjective WeightNumber of Shelters
7,500,0003.01%27.34%22.22%
8,000,0000%24.72%22.22%
8,500,0000%14.69%25%
Table 13. Location and allocation of different types of shelters.
LocationS1S2S3S4S5S6S7S8S9
Type I000000100
Type II111100000
Allocation 1587725925193306400378300
Allocation 2269714803151146400000
Living Materials857440728344452800378500
Medical Materials563527765748299500189300
Table 14. Deviations between target and optimal values.
ObjectiveTarget ValueSingle Objective Optimal ValueDeviation (%)
Distance to shelters17.7816.577.29%
Subjective weight0.921.3230.19%
Number of shelters550%
Table 15. Deviations of goal optimization results under θ 1 and p 1 .
BudgetDistance to SheltersSubjective WeightNumber of Shelters
4,500,0007.29%30.19%0%
5,000,0005.75%28.64%0%
5,500,0000.94%15.33%20%
Table 16. Deviations of goal optimization results under θ 1 and p 2 .
BudgetDistance to SheltersSubjective WeightNumber of Shelters
4,500,0005.72%34.73%0%
5,000,0003.93%25.67%20%
5,500,0000.3%10.09%20%
Table 17. Deviations of goal optimization results under θ 2 and p 1 .
BudgetDistance to SheltersSubjective WeightNumber of Shelters
4,500,0006.73%36.8%0%
5,000,0004.21%29.23%20%
5,500,0000.74%18.7%20%
Table 18. Deviations of goal optimization results under θ 2 and p 2 .
BudgetDistance to SheltersSubjective WeightNumber of Shelters
4,500,0005.01%27.73%0%
5,000,0003.87%23.17%20%
5,500,0000.66%18.55%20%