1. Introduction
The application of information and communication technologies and innovations in a company is the main factor for successful business operations in the conditions of today’s economic and political globalization. This application has a major impact on the decision-making process in companies by facilitating and speeding up the process, changing the business direction and strategy in order to increase profits [
1]. The great importance of small- and medium-sized enterprises (SMEs) arises from the fact that they are considered as drivers of economic and employment growth [
2]. Many authors [
3,
4,
5,
6,
7] see the role of innovation as vital in the state of economic development. Innovation and innovative activities play an important role in maintaining a stable economy, strengthening and maintaining a high level of company performance, building industrial competitiveness, and improving living standards. Authors Hauser and colleagues [
8,
9] state that innovation is the basis on which world economies compete in the global market. Lambooy [
10] defines innovation as a machine that is the basis of capitalism. Continuous innovative activities in a company contribute to its long-term successful business [
11]. Authors Arc and others [
12] state that, due to the increased level of competition and reduced product life, a company’s ability to innovate by improving performance and maintaining a competitive edge can be more important than ever.
Innovation capability is key for providing superior value for a company and its clients [
13,
14]. It is generally accepted that all companies need to innovate regardless of their size and sector to build competitive advantage and survive on the market [
15,
16,
17,
18]. Therefore, innovation and innovative activities are a key factor for the success and survival of companies on the market [
19,
20,
21,
22,
23], and sustainable competitive advantage [
24,
25,
26,
27]. In spite of the great importance of innovation for all companies, research on innovation is mainly carried out by companies involved in the development of new technologies and the manufacturing industry [
28,
29]. For several years, the measurement of service innovation has been one of the top ten research topics by scientists [
30,
31]. There is a great gap in knowledge and methods of measuring service innovation [
32,
33] because the method of measuring product innovation cannot be applied to service innovation [
34,
35,
36]. The service innovation sector emphasizes the development of non-technological innovations, such as the process of management, marketing, design, and more customized solutions. The balanced scorecard model (BSC model) has the ability to provide a practical and efficient interaction between innovation and control and to facilitate business in all businesses independent of the industry in which they operate. The authors Spano and others propose a new custom innovation-oriented BSC. They also propose the introduction of new metrics, intending to adapt and apply them to different sectors. Better communication, more measurements, and more assessments contribute to better corporate governance [
37].
Earlier research was mostly based on financial parameters (tangible perspectives of companies). The innovative ability of an enterprise is one of the most difficult factors to be measured, but it is a very important factor. The interest in measuring it is great and finding an adequate measurement model is significant. Therefore, a key factor for the efficiency and success of small companies is innovation. Some famous companies, such as Starbucks, Apple Computers, Dell, etc., started as small- and medium-sized companies, but they quickly began to grow [
38]. These companies maintain good communication with their customers; their key feature is the flexibility to quickly respond to the sophisticated and changing demands of their customers. The speed of responding to the needs of their clients enables companies to gain a competitive advantage. But this quick response to clients’ requests, as well as market demands, can pose a problem for some companies [
39,
40,
41].
Small- and medium-sized companies have two options when it comes to innovation [
42]. The first option is independent work on innovations through their own research and development. The second option is the application of one or several innovation management practices, such as human resource management, teamwork, and the search for external sources and co-operation. The fourth industrial revolution is a transition from a simple phase of digitization to innovations created from different materials, digital and biological technologies. Information and communication technologies are at the epicenter of this fourth industrial revolution and are considered the main driver of economic and social change [
43]. However, large companies, in most cases, have their own well-equipped research centers, and thus have an advantage over SMEs. However, SMEs can communicate with clients more easily; they have an informal decision-making process and greater flexibility, which gives them a kind of advantage over large companies in terms of introducing innovations. As a company grows in size, the probability of innovation increases as well [
44,
45]. The fact is that having their own research centers is a big advantage for large companies. Small- and medium-sized companies have limited internal knowledge and resources according to the studies of Sen and Haq [
46]. However, if they acted together on the market, synergy would change the flow of business and encourage cooperation, making them more successful.
Thirty years ago, two authors [
47,
48,
49] studied how successful world-famous companies worked and what they had in common, i.e., which characteristics other companies could apply to become successful. In recent studies, Canadian companies with more than 20 employees have been analyzed by Cozzarin [
50], whereas Spanish companies with more than 20 employees have been analyzed by Huergos and Jaumandreu [
51], showing the link between industry and innovation. Knowledge and innovation evolve the way industry and technologies evolve over time due to various external and internal influences. The introduction of new products increases the financial performance and market value of a company in the long run [
52,
53,
54]. A survey conducted by Hamilton [
55] showed that the products that did not exist three years ago, on average, account for one-third of the income of the companies in different industrial branches. Old models of performance measurement, which are mostly based on financial indicators of business operations, are losing importance.
The purpose of this study is to determine the impact of innovation and innovation activities in enterprises, to what extent they affect the business of the enterprise, and if it is necessary to conduct research on innovation activities and their measurement and to review the current state of the economy in order to assess the applicability of the model and make recommendations for improvement. It is not enough to just create something new, it is very important to commercialize and market the new products/services on favorable terms. Today, a superior product is no guarantee of business success—the consumer needs to accept it. Customers are very important for a successful business and understanding their needs is essential. By improving communication with customers, businesses can come up with new ideas and respond more quickly to market demands. Improvement in the way of doing business can contribute to narrowing the gap between different companies and markets. The main goal of this study is to verify the validity of the modified BSC model and its applicability for evaluating and monitoring the innovative activities of small- and medium-sized companies. The starting hypothesis is whether the BSC model is applicable in small- and medium-sized companies in R. Serbia and R. Slovakia, as a tool for the evaluation and monitoring of innovative activities. This should be considered based on the created questionnaire, which is as follows: what factors, according to the BSC model, significantly influence the business of the company, as well as to evaluate the connection between the factors from all perspectives of the company. Based on the results of the study, suggestions could be made for a better business strategy that can help in practice and contribute to improving the competitiveness and innovation of the company. The practical application of the model obtained in small- and medium-sized enterprises, to increase their innovation, is the main reason for creating this model.
The Republic of Slovakia and the Republic of Serbia are similar countries, but very different in terms of the success of their economies. Interestingly, the Republic of Slovakia has strengthened its economy with direct foreign investments. In 2016, there were most investments in the production of motor vehicles and trailers, electricity, gas, steam, and banking operations [
56,
57,
58]. The arrival of the large multinational companies, such as Volkswagen Slovakia (it has been operating in the R. Slovakia since 1991), PSA Peugeot Citroën (since 2003), and Kia Motors (since 2004), has boosted the car industry and allowed SMEs to operate better and to cooperate with large companies. The Republic of Serbia has a predisposition to encourage this industry, but reforms are needed to strengthen this sector. Such reforms had been implemented by the Republic of Slovakia before it became a prominent member of the European Union. The similarities between these two countries are numerous. A similar culture, a similar climate, and natural wealth mean that the areas of potential development are similar too, including the agriculture and food industry, construction, transport, tourism, health, social welfare, the banking sector, insurance companies, and education. Slovakia has a large number of thermal springs and healing spas, and this is one potentially strong sector that needs to be encouraged [
59]. The Republic of Serbia, which has similar geographical predispositions and natural resources, develops the tourism industry insufficiently. Strengthening SMEs is necessary, as well as perceiving the success of their business on the market.
This paper should also consider the real relationship between the business performance of enterprises, their needs, and the effects of the innovative activities carried out in the enterprises. The obtained data provide important information about the factors that hinder, facilitate, slow down, or accelerate the business performance of a company, which are of immense significance. The successful realization of the business activities of a company requires a well-designed development strategy that would make SMEs more competitive and innovative and thus improve their market position, their development, and thereby ensure their survival. Monitoring and mapping the innovation and innovation potential of the company is of utmost importance for the sustainability and development of enterprises in the market. Innovation is of great importance, not only on a global level but also on a regional level, or a country level, or the level of a particular industry, and after all, on the level of a company itself, since it provides the possibility to assess competitive advantages. Such assessment is one of the effective means for achieving the sustainable prosperity of a particular economy and the economy as a whole. The application of the modified BSC model to business operations of an enterprise improves the overall business performance of the company and provides important information regarding the particular steps that should be taken to improve the company strategy. Improving the strategic development of a company results in the enhanced production capacity, which leads to higher quality and introduction of new processes in the business. It also encourages research and development within a company, and all these make a company more competitive, thus contributing to the growth and development of a company and an increase in the profits.
This paper is designed to first provide the theoretical background of the world literature as well as the BSC model and its application. Then, the hypotheses are outlined and the research conducted is described. The results and a discussion of the results are described later. The limitations that exist in the literature that were encountered during the research are also listed. Finally, conclusions are outlined and directions for further research are presented.
2. The State of Art (Literature Background)
Constant market changes are forcing businesses to find new, different solutions to adapt to change and to become more innovative. Small- and medium-sized enterprises (SMEs) need help to be able to follow and respond to these changes. SMEs are a key factor in every economy in every successful and developed country. Encouraging the development of the innovative activities of small- and medium-sized enterprises, the connection of academic institutions, scientific centers, and the economy, and improving the conditions for job creation have a positive impact on employment and the state’s competitiveness. The creator and key theorist in the field of innovation is considered to be Joseph Schumpeter, who recognized the importance of innovation and in his work stated that economic change is happening because of innovation and entrepreneurial activity. There are numerous definitions of innovation in the literature. The structure of the definition has changed over the years, but the essence has remained the same: it is a novelty, some new idea that brings in financial gain/profit. The most commonly cited definition of innovation, cited by the OECD in its handbook, is as follows: innovation is the application of a new or significantly improved product, service or process, marketing method, or new organizational method in a business, work organization, or business entity relationship with the environment [
60]. In order for businesses to innovate, many innovative activities must be implemented that affect all performance in the enterprise. Innovation is a multidimensional and complex activity, which can be measured using measurable (tangible) parameters and intangible (harder to measure) parameters. There are many other factors, mostly intangible (more difficult to measure) that need to be explored, related to the innovative activities of businesses but also to the possibilities of measuring them more effectively. In order for the impact of the innovation activities carried out to have positive effects on the enterprise, a way must be found to measure them. By looking at different enterprise performance adequately, it is possible to create a business-applicable model that could be used to evaluate innovative performance in developing countries. Transition countries generally try to implement all reforms at the same time, so governments in such cases map and introduce economic priorities and instruments implemented in developed countries. This results in an incorrectly defined strategy and its implementation, as the situation with the actual situation on the ground differs [
61]. Innovative activities have a significant impact on employment, but a longer timeframe for their implementation is needed to show their real impact, so innovative activity is more important for less diverse countries than for leaders [
62]. Measuring and evaluating innovative activities is important for businesses, especially when market conditions impose new standards and a new way of doing business. As early as 1883, Lord Kelvin wrote that if something cannot be measured, then something cannot even be improved. [
63] Later, the creators of the BSC model, Kaplan and Norton, introduced in their book the postulate that if something cannot be measured, it will not even be manageable [
64]. When we measure something and present it numerically, we can define the correct way of expressing it and derive it from the rule; if we can measure something, we can then control and improve it. A clear picture of the planned and realized actions is crucial, as control at all times of all the performance of the company is very important to be able to effectively manage the company. If we cannot measure something and it does not work properly, it cannot be fixed, the business of the company will stagnate, and, instead of the upward path, it will go down and eventually the business will collapse. This implies the need to develop models for evaluating the innovative activities of SMEs.
There has been some research on SMEs on this topic, but there is still little. Most of the research has been conducted in Australia, Finland, the United Kingdom, and Germany. Studies have been conducted in SMEs but only with a focus on innovation in general, without the evaluation of the effects of innovative activities carried out on business operations [
65]. SMEs have limited financial resources to analyze the data but also a small amount of key data that they can adequately analyze.
Table 1 shows which values of activity in enterprises are measured by each of the ten most widely used models in the literature.
The most used tools to help businesses do better and get better results are reported by Bain and Company in
Management Tools and Trends journal [
67]. The research conducted by this journal shows that, in recent years, the BSC model has proven to be, in all aspects, a good tool for assessing the performance of an enterprise. It is very important to select and adjust indicators that measure the performance of the company. The area under consideration is also important because there is no universal model to evaluate entire performance, and, because of this adaptation and selection of indicators, the BSC is becoming increasingly popular.
There are many tools on the market today that can evaluate a company’s performance. However, the tool used in developed economies cannot be copied and used to evaluate the performance of businesses in the same way as in developing countries, as it is not a comparable situation and situation in enterprises, nor are the conditions in which those businesses operate, because the differences depend on a characteristic of the environments in which businesses operate. The requirements of the market, but also the state of the enterprise in which they are located, as well as the production process itself, are not the same in developed and less developed countries; tools that measure business performance require modification and adaptation to the market. The number of factors and indicators used to evaluate performance in businesses can be very large, so it is impossible to capture them in a single survey. A model that is quite well received in the market and that aligns its needs with businesses to get the best performance rating for a business is the balanced scorecard model—the BSC model. Adaptability to the market in which the performance of companies is evaluated according to this model is important because the business efficiency of companies in developing countries is a necessary condition for achieving a high level of state development. Measuring enterprise performance should help and facilitate the management of the enterprise and above all, managers and top-level executives, as well as provide guidance for business development. SMEs have to respond to market demands quickly and efficiently.
Table 2 shows the conclusions of some authors’ research of the BSC model.
By appropriately adapting the balanced scorecard (BSC) model proposed by Kaplan and Norton in 1992, this model can be used as a tool for good and efficient strategic enterprise management through which it can be fostered with innovative enterprise activities. The main objective of the introduction of the original balanced scorecard (BSC) was to bring together all the performance of the company and to give equal importance to all aspects of the business operations, not just financial. One of the main reasons why enterprise performance measurement was problematic is related to the fact that measuring all performance is valued solely by financial ratios [
73]. The BSC model is a true tool for measuring different types of enterprise innovation [
70] and is useful for integrating strategic management and communicating with all organizational levels in the enterprise about measures taken that should foster innovation in order to improve the development of common goals and habits [
74]. With the modified BSC model used in this paper, it is possible not only to evaluate the impact of innovation on business but also to align innovative projects with the strategic goals of the company. It is possible to communicate with all departments in the company, achieve a balance between financial and non-financial indicators that measure success, and it is possible to get a detailed presentation of information, which can provide adequate guidance on what needs to change in the business of the company. The real measurement of business achievement is also possible with the BSC model, because using well-defined relationships and relationships that build performance in the enterprise means that it is easier to determine the success or failure of individual sectors in enterprises. It is necessary for the company to have a good information system in order for communication to be possible between all departments within the enterprise as well as with clients. Monitoring the effects of innovative activities is very important to see a change in a company’s business, be it positive or negative. Keeping track of these changes makes it easier to analyze the current state of the business, identify the obstacles encountered more quickly, and find the solution to the new situation faster. Therefore, the indicators used to evaluate innovative activities must be carefully selected, measurable, measuring exactly what they are designed for, as well as reliable, simple, cost-effective, and significant, as they depend on the decisions made in the enterprise.
Balanced Scorecard (BSC) Model and Its Application in the Companies
The increasing use of the BSC model in companies has been recorded in scientific publications, especially since 2002 [
75,
76]. This topic is gaining in importance and there are more and more scientific papers that explore the application of the balanced scorecard (BSC) model in companies as a model for measuring the performance of a company. There are more and more users who are satisfied with the results of the balanced scorecard (BSC) model in companies, and this is precisely the reason why this model has been chosen for this research as the starting, basic model for measuring the performance of companies and assessing the implementation of innovative activities in companies.
Authors and creators of the balanced scorecard (BSC) model, Robert Kaplan and David Norton [
77,
78,
79], conducted a survey in three major companies (“Rockwater”, “Apple”, and “Advanced Micro Devices AMD”) and presented their results in their research papers [
80,
81,
82]. The authors state that the BSC model is not just a new model for measuring the performance of a company but can also be seen as a new integrated enterprise management system. It aims to create synergy at the whole-enterprise level. This model is constantly evolving and improving, and therefore the idea to create a modified model for the needs of this research has emerged. The measurement of the introduction and implementation of innovative activities in companies does not have a standardized procedure and thus the application of the classic model is not appropriate. The BSC model involves reviewing the performance of a company from four perspectives that are equally important and interdependent, whereas, in previous years, only the finances mattered. The BSC model shows that the finances depend on the customer perspective, which is firmly linked to the perspective of internal processes and the perspective of learning and development, as well as innovation. There cannot be a successful business without one of these four components.
The survey was conducted to obtain a realistic picture of today’s SMEs and to provide guidelines for improving their business, as well as checking the implementation of the BSC model in SMEs as a model that focuses on assessing the innovations that have been carried out. The balanced scorecard model has been imposed as a proven and efficient tool for measuring the overall characteristics of a company because it connects four different perspectives of the company: financial, which aims to evaluate the financial results, customer or consumer perspective, which evaluates the results of the organization from a consumer’s perception, innovation and learning, which values the capabilities of the organization, and internal business processes, which evaluates the internal operations of the organization. These four perspectives support various techniques that are used by top-level managers to manage their business more easily and effectively. The essence of this approach is creating an identifier that will enable the measurement or evaluation of all aspects of business, both non-financial (customers, innovations, and internal processes) and financial ones.
The goals of companies are to become as successful as possible, to be one step ahead of the competition, to protect themselves from imitation, but also to make their clients accept the innovations they bring to the market. Horvich and Prahalad [
83] state that the assumption of the existence of an independent and universally applicable model of the innovation process has led to considerable confusion in understanding the different ways in which innovations are developed and implemented. Since there is no unified understanding or unified definition of entrepreneurship, the empirical consideration of entrepreneurship requires researchers either to create their own measures of entrepreneurial activities or to accept the existing indicator [
84]. The business of a company is affected by the global market, new technologies that change and develop from day to day, the shortened period of use of products and services, and many other factors. On the other hand, the balanced scorecard (BSC) model, introduced in 1990, identifies strategic indicators that a company must achieve in order to reach a long-term vision, which means it is oriented towards the future, as well as to the improvement of the business itself (
Figure 1).
The BSC model combines all these four components. When there is an investment in the training of the employees (learning and development), the quality of business (internal processes) improves, and this positively influences customer satisfaction (customer), which contributes to better business operations (finances). Chan and Ho [
86] state in their work that the application of the BSC model allows for the identification of the main goals that can contribute to improving company performance, while various other authors [
87,
88] state that the application of the BSC model is key to improving the profitability of a company. Dumond and others [
89] have shown in their research that the application of the BSC model has resulted in other positive effects, such as employee satisfaction and understanding of the business.
This paper aimed to create a model for evaluating innovative activities in small- and medium-sized companies since the measurement of the non-financial performance of companies is very important in a new economy and has gained increasing attention of the scientific community.
The complexity of the research subject and the objectives set require the application of several research methods and techniques: the method of analysis and synthesis; the induction and deduction method; the statistical/mathematical method, i.e., qualitative/quantitative data processing; and questionnaire survey methods. Qualitative research is based on theoretical facts and hypotheses leading to data, while qualitative research starts from data and thus builds theory. Therefore, this research is of a mixed character.
The research was conducted through the following stages: the analysis of theoretical backgrounds in the field of innovation and application of the BSC model in the introductory research section; the creation of questionnaires for enterprises in order to obtain primary data for research; conducting research (distribution of questionnaires) on the territory of the Republic of Serbia and the Republic of Slovakia; the modification and creation of models for evaluating innovative activities; making conclusions; the discussion of the model as well as suggestions for future research.
3. Hypotheses and Objectives
The BSC model can be used regardless of the size of a company, for evaluation and assessment of the current state at any time. Moreover, the BSC model can be a tool that directs and helps to modify future planning but also encourages the development of a company in the future. The perspectives stimulate the balance between the short-term and long-term goals of a company, between planned and realized outcomes and between quantitatively objective measures and qualitatively subjective measures. The key concept of the BSC model is the distinction between input and output performance [
90]. The main goal of the BSC model is to improve the business performance of the company in the future, and, as more technology advances, the BSC model evolves and improves and becomes more qualitative, and the adaptation capabilities for the purpose and business of each business are greater. The BSC model is an adequate model for measuring enterprise performance because it contains all the necessary elements and displays all dimensions, quality, flexibility, time, finances, customer satisfaction, and human resources (evaluation of the typology of performance measurement appears in the work of Hudson [
91]). The implementation of the BSC model involves five steps: identifying a vision of activities that are needed for control or management, in accordance with the vision of developing a part of a company, identifying one or more strategic goals that are used for each perspective, choosing measures for achieving and controlling strategic goals, and tracking a strategy map that combines perspectives, strategic goals, and activities. Over the past twenty years, there has been an increase in demand for the assessment of indicators for the development of innovative activities. Research and development is now a key part of the innovative enterprise system and requires an integrated measurement mechanism that monitors both financial and non-financial criteria.
Therefore, there is a large number of indicators that can be measured across these four perspectives of the BSC model. However, keeping in mind the defined objectives of this study, only those indicators have been chosen by which the performance of a company is evaluated according to the BSC model.
Thus, based on theoretical data and numerous research papers published by various authors, such as Yang, Tung, Patel, Chausset, Millard, Wang, Lu, Chen, and others [
92,
93], a hypothetical model was created (shown in
Figure 2) for observing the relationship between the set hypotheses and the relationship between the four perspectives of the BSC model. So, this hypothetical model has four latent variables, and they are the Financial Perspective (F), Customer Perspective (K), Internal Business Perspective (UP), and Innovation, Learning, and Growth Perspective (UR). (Note: abbreviations F, K, UP, UR are used below in
Table 3).
The main objective of this study is to create and verify the validity of the modified BSC model and its applicability for evaluating and monitoring the innovative activities of small- and medium-sized enterprises. Thus, the starting hypothesis H0 is the applicability of the BSC model in small- and medium-sized enterprises in R. Serbia and R. Slovakia.
In order to demonstrate and achieve the main goal of the study, the conditions and dependency among the factors classified into four perspectives (buyers, internal processes, learning and development, finances) must be met, i.e., the hypotheses of the study must be confirmed (
Figure 2).
H1a: There is a positive dependence between the perspective of innovation and learning and perspective of internal processes of the BSC model.
H1b: There is a positive dependence between the perspective of innovation and learning and financial perspective of the BSC model.
H1c: There is a positive dependence between the perspective of innovation and learning and customer perspective of the BSC model.
H2a: There is a positive dependence between the perspective of internal processes and financial perspective of the BSC model.
H2b: There is a positive dependence between the perspective of internal processes and the customer perspective of the BSC model.
4. Research Methodology
The research conducted by the authors on the territory of the Republic of Serbia and the Republic of Slovakia was aimed at examining important internal and external factors that have a positive or negative impact on the innovative performance of a company and the applicability of the BSC model in small- and medium-sized enterprises. This research was preceded by similar research conducted only on the territory of the Republic of Serbia, which was part of the research project. Since 2006, research, rather descriptive than detail, has been conducted on the territory of the Republic of Serbia by the Republic Statistical Office.
Therefore, this research, which is the subject of this paper, covers companies from all parts of the Republic of Serbia and the Republic of Slovakia, and the sample of the surveyed companies is representative. The data for the research were collected for a period of one year by the author who is pursuing a Ph.D. at the Faculty of Technical Sciences in Novi Sad. The instrument used in the research is a multi-section questionnaire that was completed in direct contact with the company directors or sector development managers. A total of 400 companies participated in the survey, but only 225 companies filled out the questionnaires completely. These companies are both production and service providers, organized mostly as limited liability companies (76.1%). There were equal numbers of micro, small, medium-sized and large enterprises (the structure of the survey sample is shown in
Table 4).
According to the data of the statistical office [
96], the majority of the companies on the territory of the Republic of Serbia are SMEs, which was confirmed by the results of this survey, as 86.2% of the surveyed companies are SMEs. The average age of the surveyed companies is about 20 years. The capital of the companies is of domestic origin and their products and services are mostly marketed locally. The situation on the territory of the Republic of Slovakia is similar: most of the surveyed companies are from the SME sector. According to EC data, 99.9% of the enterprises operating in the territory of the Republic of Slovakia are SMEs, and they are of similar average age. A more detailed overview of the statistics is provided in the author’s doctorate thesis.
The questionnaire used in the research was created based on the theoretical findings of the key authors Kaplan, Norton [
97], Knoškova, and Kollar and the definition from the Oslo Manual (OECD, 2005). The questionnaire used in this study used scales of expressing the degree of agreement or disagreement, allowing the respondent to respond to a five-point Likert-type scale. The Likert interval scale is the psychometric scale most commonly used in surveys and surveys. The results of each statement, the attitude of this research, in which a total of 223 top-level executives or business owners participated, of which 112 were from the territory of the Republic of Serbia and 111 were from the territory of the Slovak Republic. Their answers should draw our attention to the importance of innovation, which is a key factor in the survival of a business in the market and gaining a competitive advantage in the market, in an era of expansion of information technology and strong competition. The research was followed by statistical data processing and the results were obtained in the form of descriptive statistics for describing the sample on the tested variables, such as arithmetical mean, median, mod, standard deviation, variance, minimum, maximum for numerical and ordinal variables, and percentage for categorical variables. Significant links between the observed and investigated elements from the questionnaire were examined. Based on this examination, the most statistically important links between the factors were shown.
After that, the validity of the data was checked and whether the appropriate sample size was taken. The confirmatory factor analysis (CFA) was conducted. The sample size is important for both confirmatory and exploratory factor analysis (EFA). The adequacy of the EFA depends on the relationship between the number of questions in the questionnaire and the sample size. Large and small enterprises are equally represented, which is also true for other parameters. When the reliability and validity of the sample were confirmed, the data processing began using the AMOS computer software package. The SEM structural model was created based on the hypotheses that were based on theory. The results of the research are presented in analytical tables and images in the dissertation thesis. The application of these methods, according to the results of various scientific research so far, enabled the valid realization of the scientific and social aims of the research in this paper.
5. Results and Discussion
The conducted factor analysis is used in research in order to reveal the link between the constituent parts of a questionnaire or to reduce the number of questions in a questionnaire, as it examines the correlation between the questions in a questionnaire. The CFA, on the other hand, examines if the results match the hypothetical model of the questionnaire. Principal components analysis (PCA) includes domain rotations to obtain dimensional reduction and the invention of the best model with a small number of factors. The PCA is based on the assumption that all the variance is common; before extraction, all utilities are 1. The data were analyzed by the maximal credibility factor method with the promax rotation. Four factors were retained, as indicated by the Kaiser criterion. Four factors explain a total of 66% variance in the tests. The obtained factors are 1. Finances—F, 2. Innovation, Learning and Growth—UR, 3. Internal Processes—UP, and 4. Customers—K.
In order to determine the theoretically set factor structure, confirmatory factor analysis (CFA) was applied. It is more complex than EFA and it presents one of the methods of SEM, which needs to confirm how many variables fit into the assumed structure, i.e., model hypothesis. Moreover, the manifest variables that, based on EFA, have a very strong loading factor with constructs they do not belong to, were excluded from further observation and were not part of the CFA model (those are the following variables: F2, UR1, UR2, UP2, UP3, K4, K5, K6). The CFA model is also known as the measurement model because it describes the validity of the instrument or the questionnaire used for measuring. It represents a hypothetical model that is evaluated by using the data from the sample. Composite reliability (CR) and average variance extracted (AVE) are used to check the validity and to arrive at a conclusion on constructive validity.
The validity of the constructs is examined by observing their relationship with other constructs. The validity can be related and therefore convergent or not related and therefore divergent. The CR values range from 0.801 to 0.909 and exceed the recommended value of 0.70. The AVE measures the amount of variance for the indicated indicators explained by the latent construct in relation to the variation of the random error of the measurement model. They range is from 0.504 to 0.668, which is above the recommended value. This implies that this factor solution explains a large part of the total variation among the variables in the factor structure. Hence, the value of these indicators is satisfactory and supports the assumption of the convergent validity of the scale. The results of the analysis also show an adequate discriminant value of the proposed model, while the table shows that the obtained AVE values are greater than the maximum MSV and the average ASV of the common square variance between each pair of latent constructs. The analyzed measurement model showed adequate reliability, convergent validity, and discriminant validity since the examination of the matrix of correlations showed that not a single pair of latent variables was overreached, meaning that all the correlation coefficients were in the range of values from 0.485 to 0.736 (
Table 5).
Another very useful index form is the root mean square error approximation (RMSEA), which takes into account the error of approximation in the sample. It is a measure of disagreement by degree and represents a good basis for the proposed model that is estimated in the sample. The obtained RMSEA values for this model are 0.070 and show that this model is adequate. The resulting conventional model has a low value compared to the independent model. The summarized results obtained for this model using CFA are shown in
Table 6.
After the identification of the final measuring model (CFA), where reliability and validity were verified, the structural model of the equation was prepared. Structural equation modeling (SEM) is a flexible, comprehensive model that specifies the pattern of the relationships between independent and dependent variables, either observed or latent. It combines all the data of multiple regression analysis, factor analysis, and ANOVA into a single model that can be statistically evaluated. The dependence between finances and internal processes is shown, as well as the relationship between learning and development and internal processes. As knowledge increases, so does the possibility of implementation of new processes in a company, and the improvement of the relationships with customers. The results show that the influence of finances on learning and development is not of great significance.
This study evaluated the strategic performance of the companies based on the principle of the BSC model and statistical SEM method and concluded that this way they can effectively solve the problem and reduce the influence of finances on the strategic decision-making process. They also state that the obtained results show that non-financial performance, such as customers, is gaining more on importance. Profitability is the most important aspect of finance, while to customers, market share is more important than customer satisfaction. Good managers and well-trained employees are important in learning and development performance.
Models of assessment of innovative activities of modern and prosperous countries are not fully applicable in developing countries. Advanced technology, modern research centers, and large financial resources that are available are just some of the advantages that developed countries have over developing countries. Therefore, it is extremely important to create a model for evaluating the innovative activities of a company, to assess the possibilities of its implementation, to modify it according to the specific requirements of the environment, and to compare it with the results of the model application in similar companies operating in a developed market. This would give a clear picture of the possibilities of applying the proposed model in various conditions, without limitations that can be imposed by the parameters of the external environment. It would also enable the assessment of the important factors in the process of innovation creation, in the process of implementing innovative activities of a company, as well as the analysis and assessment of the innovation capabilities of the Republic of Serbia, with an emphasis on respecting different time intervals and studying the current attitude regarding innovative strategies and innovative processes.
The results of the research should show what the shortcomings of innovation measuring are, as well as its positive aspects, application of innovations, information technologies, and human factors in the business of the companies in R. Serbia. The results should also show similarities and differences between the economies of R. Serbia and R. Slovakia, as well as between the economies of R. Serbia and the ones stated in the theory and in the reports of the European Commission. This structural model shows the dependence of the starting hypotheses, based on the theoretical background. These five hypotheses depict the dependence among the factors classified into four categories of customers, internal processes, learning and development, and finances.
H1a: There is a positive dependence between the perspective of innovation and learning and the perspective of internal processes of the BSC model—the hypothesis is confirmed (statistically significant).
H1b: There is a positive dependence between the perspective of innovation and learning and the financial perspective of the BSC model—(not statistically significant).
H1c: There is a positive dependence between the perspective of innovation and learning and the customer perspective of the BSC model—the hypothesis is confirmed (statistically significant).
H2a: There is a positive dependence between the perspective of internal processes and financial perspective of the BSC model—the hypothesis is confirmed (statistically significant).
H2b: There is a positive dependence between the perspective of internal processes and customer perspective of the BSC model—hypothesis is confirmed (statistically significant).
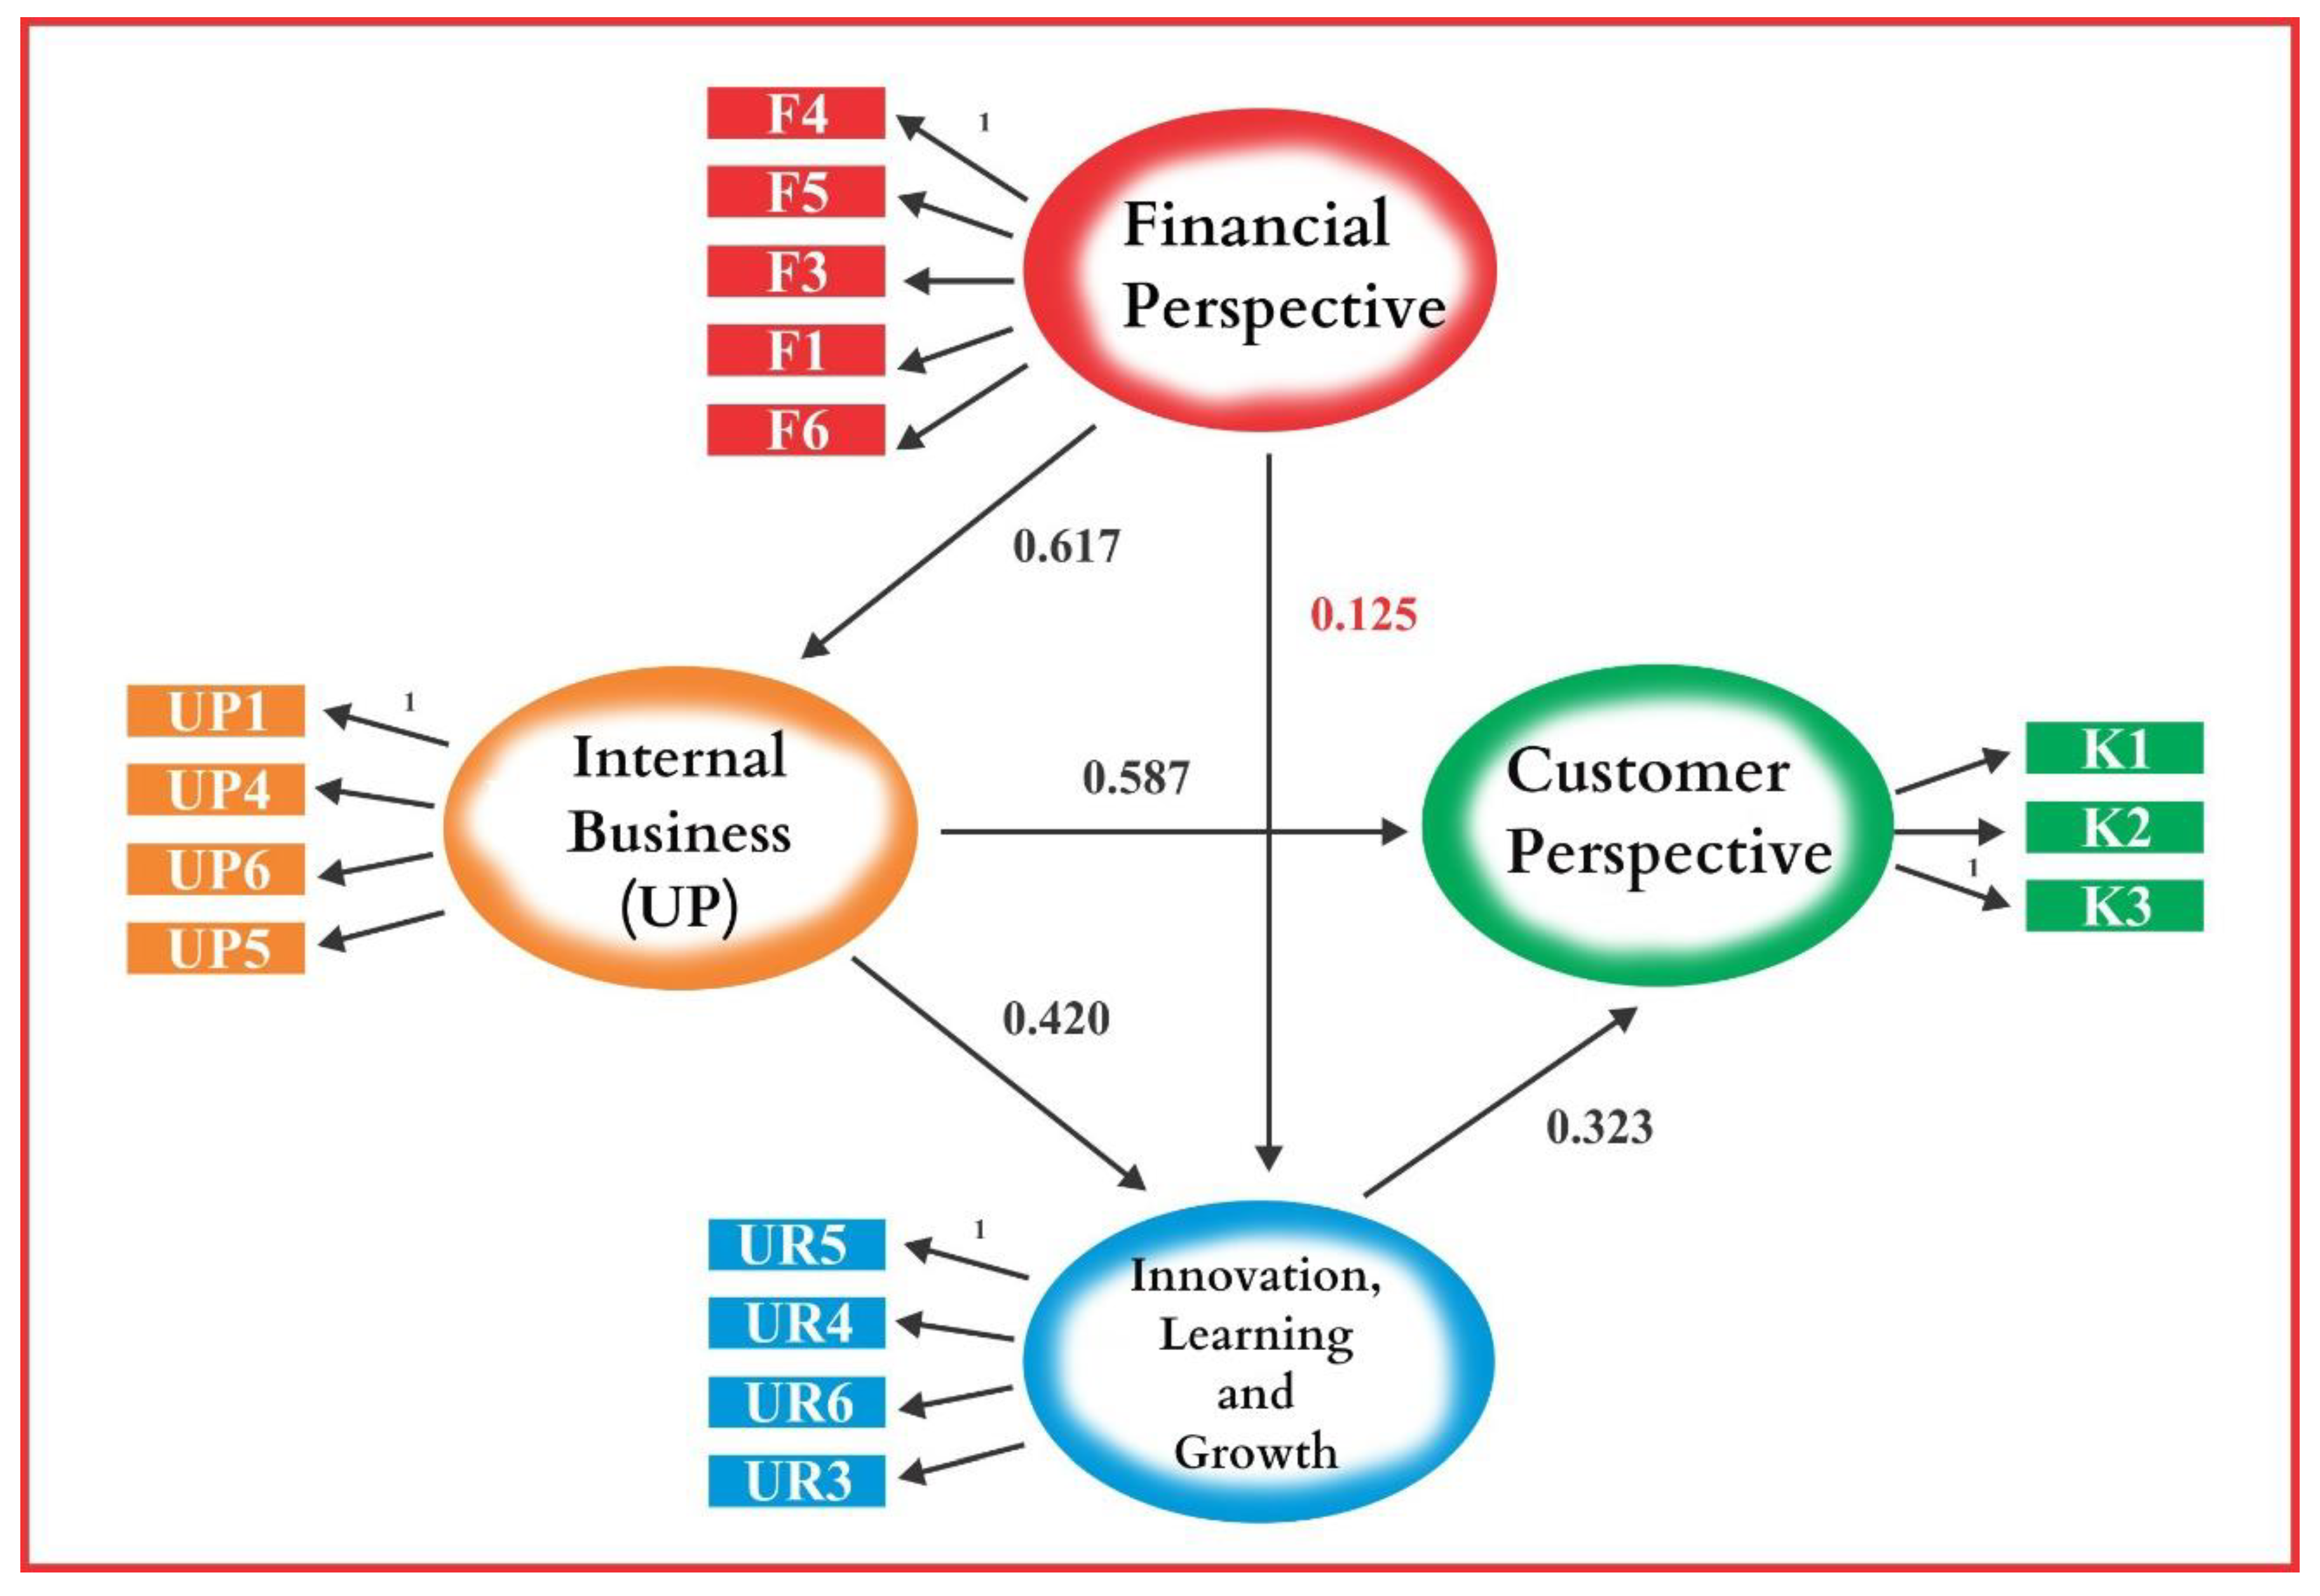
Considering these results, it is possible to conclude and confirm the basic hypothesis that the BSC model is applicable for the evaluation and monitoring of innovative activities in small- and medium-sized enterprises. The research has shown that there is no drastic difference between SMEs operating in the territory of the Republic of Serbia and those operating in the territory of the Republic of Slovakia, and therefore the BSC model can be applied. The SEM model is shown in
Figure 3.
Figure 3 shows that the hypothesis H2a—there is a positive dependence between the perspective of internal processes and financial perspective of BSC model—is confirmed (statistically significant), while H1b—there is a positive dependence between the perspective of innovation and learning and the financial perspective of the BSC model—is not statistically significant. Further results show that H2b—there is a positive dependence between the perspective of internal processes and customer perspective of the BSC model—is a confirmed hypothesis, as well as H1a—there is a positive dependence between the perspective of innovation and learning and the perspective of internal processes of the BSC model. H1c—there is a positive dependence between the perspective of innovation and learning and the customer perspective of the BSC model—is statistically significant too.
The resulting conventional model has a low value of 286.688 in relation to 2322.123 of the independent model. Summarized results are given in
Table 7.
Every study based on data processing and data analysis mostly reflects the subjective attitudes, opinions, and perceptions of the respondents. Given the nature of this research area, the subjective character of some of the data for analysis is an essential component of this type of research. The results of this study suggest that when internal processes are constantly improved, the number of customers is increased and consequently the profitability of a company. Interaction between customers and companies is very important because every satisfied customer contributes to the expansion of the customer base.
Nowadays a large number of companies fund their innovative activities from their own funds since it is relatively difficult for SMEs to obtain bank loans. Hence, the incentives in this field and government support are very important. Innovation and innovative activities have crucial importance for the survival and development of SMEs in the market. They allow them to adapt to the dynamic changes taking place on the market, thus achieving greater sophistication of existing demands and creating new ones by changing the way of doing business, production, organization, and advertising. SMEs are the main drivers for creating new jobs; they encourage economic development around the world. In particular, companies that stimulate productivity, innovation, and competitiveness contribute to the improvement of the global economy. According to the OECD report in the economies of seven pre-accession countries, R. Serbia included, SMEs represent the vast majority of companies and hence they employ the most workers.
The difference between the economy of R. Serbia and that of R. Slovakia is in the openness to investments and export orientation. Factories of large multinational companies started to operate in the Republic of Slovakia after the transition. Since then, the largest increase in revenues has been recorded by increased exports. In the Republic of Serbia, on the other hand, complicated administration and legal procedures drive foreign investors away. The inability to improve competitiveness makes exporting more difficult for SMEs. The availability of financial resources is one of the key determinants of entrepreneurial activity [
98]. This research is significant because so far, no similar research has been conducted, in which the BSC model has been applied in companies in the territory of R. Serbia and R. Slovakia. However, the nature of the problem of this research requires a multidisciplinary approach to suggest concrete solutions. The guidelines that can be given point to the raise in awareness of innovations, because they are vital for improving all the performances of a company and hence, the business.
Encouraging innovative activities and the application of the BSC model in the business of SMEs is very important as this would have a positive effect on the development of the economy. The application of information technology requires investment, but it leads to improvement and facilitates the operation of SMEs, which would positively affect all the performances of companies. The difference that exists between developed countries and countries in transition greatly contributes to the application of these models. However, the BSC model is applicable in all countries, as its implementation leads to improved business operations around the world. A more detailed analysis has shown that it is applicable in a country that is in the process of EU accession—R. Serbia—as well as in a member state—R. Slovakia. The question that then arises is whether this is the case because these countries are culturally similar and have a lot in common. Further research could include some other countries and a greater number of companies.


