1. Introduction
Food waste is a problem that has attracted increasing attention in recent years. There is a clear connection between the problematics of food waste and the three sustainability dimensions: Environmental, economic, and social [
1]. Food waste is associated with waste of both natural resources [
2,
3,
4,
5] and money [
6] and involves social issues, as wasting food has potential implications for food security [
7,
8]. However, this is a complex issue, and reducing food waste does not automatically result in a sustainable food system, as the waste-reducing measures applied must not be more resource-demanding than the savings they provide [
9]. The multiple sustainability challenges associated with food waste are particularly apparent within hospital food services. This sector must meet environmental goals, such as lower carbon footprint and decreased food waste, while operating on a constrained budget, satisfying nutritional needs, and attaining patient satisfaction with the meals served. As regards environmental sustainability, hospital food services are a major producer of food waste, with food contributing up to 50% of total waste in hospitals [
10]. If food waste were to be reduced, natural resources would be saved and the economic burden on the already cost-constrained healthcare sector would be lowered [
11]. If patient satisfaction and food intake could be improved, social sustainability would also be addressed in terms of reduced malnutrition [
11]. Malnutrition is a well-known issue in hospitals worldwide, and has been linked to increased morbidity and mortality, increased costs, and longer hospital stays [
11,
12]. Thus, there is much to gain from a sustainability perspective by reducing hospital food waste.
The public food service sector, in general, including hospitals, is a vast contributor to food waste. This sector alone produces and serves three million portions per day in Sweden, of which approximately 75000 meals are served in hospitals. Estimates suggest that, in total, 70000 tons per year of food are wasted in pre-schools, schools, prisons, hospitals, and elderly care homes [
13]. This wastage is equal to 7 kg per capita and year, but is low in comparison with the food wastage from Swedish households, 74 kg per capita and year, although the volume of food served is much larger for Swedish households. In studies in other countries, hospitals, in particular, are reported to be a segment of the public sector with very high food waste. For example, >40% of food waste was reported for hospitals by Barton et al. [
14], 19–66% by Sonnino and McWilliam [
15], 35% or 953 g guest
−1 day
−1 by Dias-Ferreira et al. [
16], and 113 g guest
−1 meal
−1 by Malefors et al. [
17]. Despite these high levels, only two published studies cover the topic of food waste in Swedish hospitals [
18,
19]. Moreover, the quantities of food actually wasted in Swedish hospitals are still unknown, since one of those studies [
18] only conducted interviews to assess causes of waste generation, and did not quantify food waste, while the other [
19] suggested measures to reduce food waste, but did not report how much was wasted before or after implementation.
Many Swedish hospitals are governed by a regional authority with the power to act on political will, rather than just market logic. This regional public body is responsible for funding hospitals through the Swedish taxation system, although outsourcing of some functions to private enterprises is common. Since one public body is in charge of handling hospital functions, such as staff, buildings, and purchasing food, decreasing food waste should be an associated positive effect. In recent years, several hospitals in Sweden have started to measure food waste, since without acknowledgment and documentation of the problem it is difficult to take action. However, it is problematic to establish a realistic picture of the sector’s progress because the quantification results are often reported via information channels, such as newspaper articles and/or internal or external websites. Reporting common waste quantification practices and waste quantities gives policymakers a benchmark against which to compare their own efforts, to assess whether these are best practices or need further improvements.
The overall aim of the present study was to contribute knowledge and guidance to reducing food waste within the public food sector, in order to help establish a sustainable food supply chain. Specific objectives were to investigate current practices for recording and monitoring hospital food waste in Swedish regions and to quantify the level of food waste generated in Swedish hospitals, thus providing a benchmark for the sector. An additional objective was to compare questionnaire results with waste records, in order to verify how well the questionnaire approach captures the reality (or at least the documented reality).
3. Results
The results are divided into three parts: Presentation of current quantification practice, verification of current practice, and food waste quantities in hospitals.
3.1. Food Waste Quantification Practices in Hospitals
Among all 21 Swedish regions, 17 reported central-level quantification of food waste (i.e., compilation of quantification data on a regional level). Of the four remaining regions, one replied that food waste quantification was established in some of their kitchens, an initiative decided by the individual kitchens. Two regions reported that no measurements of food waste took place, and one region did not respond at all. Of the 17 regions quantifying food waste at central level, 14 quantified waste from the lunch serving, 13 waste from the dinner serving, and two waste from breakfast. For the regions with central quantification, the food waste categories included were serving waste (94%), plate waste (76%), safety margin (59%), preparation waste (18%), storage (12%), and rejections at delivery (6%). Two regions (12%) only quantified the total amount of waste on the aggregated level. One of the regions included special diets in the waste records, but only performed visual evaluations to estimate the amounts.
At times, hospitals recorded the number of customers or guests served to supplement the reported data on food waste. This number was approximated based on ordered portions (59%), accounted for by the number of plates cleaned after the meal (6%) or the number of meals sold (6%). The key figure most used to communicate quantification of food waste was absolute mass (53%), followed by relating the mass of waste to the number of guests (35%), or relating it to the mass of food served (29%) or the mass of food prepared (29%). With regard to creating a figure that represented waste related to food prepared or food served, some hospitals also compiled data on the mass of food prepared (35%) or the mass of food served (12%). Some regions used several key figures, and recorded several reference bases, in addition to the key figures. Of the 21 regions investigated, 18% recorded the menu and 18% recorded comments on what caused food waste on a certain day.
It was more common for a region to quantify hospital food waste on a local initiative from staff or managers working in the kitchen (41%) than because of political goals (24%). The regions quantified food waste to identify causes (53%), to monitor progress by the whole organization (29%) and/or by individual kitchens (29%), or to inform the guests about waste reduction progress (12%). No region reported using its quantification procedure in communication with the media or in campaigns to reduce food waste. However, some respondents added free text comments, which stated that the motivation to quantify food waste was often based on sustainability concerns, especially economic and environmental. Most regions communicated results of food waste quantification to kitchen staff (53%), executive directors within the hospital/regional authority (47%), managers of care units (41%), politicians (29%), guests (29%), head chefs (24%), nursing staff (24%), and the media (0%), while 12% did not communicate any results at all. However, several regions appeared to conduct the quantification for a single purpose but still use the data in communication with more stakeholders than initially intended. For example, 29% of these regions replied that they communicate results to guests, but only 12% replied that they quantify food waste with the intention of communicating the information to guests.
Spreadsheet software (71%) was the most used tool to keep track of hospital food waste data, and/or handwritten lists (41%). There were indications that staff used handwritten lists first and then entered the data in spreadsheets, as 35% of the regions use both measures. An external tool designed especially for quantification of food waste was used by 24% of the regions. Only 12% of the regions stored the results from food waste quantifications in a central archive, and 24% stored the waste records in the individual kitchens. The extra work required to digitalize data might be the reason why 75% of the regions keeping food waste records in individual kitchens performed quantification with the help of handwritten lists.
The regions quantifying hospital food waste at the central level indicated that the practices described in questionnaire responses were well-established within the organization. One region started quantifying food waste in 2006, but this was exceptional, and the regions on average had quantified food waste for five years. They recorded waste on between 7 and 365 days per year, with an average of 62 days year−1. Most hospitals (72%, or 56/78) within the responding regions participated in quantification routines.
3.2. Verification of Questionnaire with Food Waste Records
Data from the three regions (A–C) in Sweden that shared their food waste quantification records were used to verify their respective responses to 12 questions in the questionnaire. Since the questionnaire only covered information about the quantification process, only the amount and quality of data collected were verified, not the amount of food waste stated in the records. Comparison of the data for all three regions showed that 64% of all questionnaire responses were coherent, 28% were underestimated, and 8% were overestimated. The results for each region were as follows: Region A had 84% coherent, 8% underestimated, and 8% overestimated responses, Region B had 42% coherent, 50% underestimated, and 8% overestimated responses, and Region C had 67% coherent, 25% underestimated, and 8% overestimated responses. This indicates that the questionnaire captured true information in most cases and, when there was a deviation from the true information, the respondents underestimated their own efforts in comparison with the true efforts in data collection more often than they overestimated their efforts.
All three regions gave accurate responses when asked if they quantify hospital food waste, and when they started quantifying this food waste. Regions A and C gave coherent responses when asked ‘How often do you quantify hospital food waste?” while Region B overestimated the frequency of quantifying food waste, stating that it quantifies food waste on 10 days per year, while its food waste records contained only three to five days per year of quantification data.
When asked about the type/s of kitchens within the region in which hospital food waste is quantified, Regions A and C gave coherent responses, but Region B underestimated its response, as more data were compiled in the record than stated in the questionnaire. Regions A and C also gave coherent responses as regards quantifying hospital food waste from lunch, dinner servings (region A), and “other meals” (region C). Region B reported that it only quantifies food waste from lunch servings, but the records showed that it also quantifies data from dinner servings, thus underestimating the response. When asked how many kitchens were included in the region, Region C gave a coherent response, whereas Regions A and B gave underestimated responses by stating that only 12 kitchens are included in Region A (recorded value 13) and one kitchen in region B (recorded value three). Regions A and B gave coherent responses when asked how many kitchens were included in their last quantification, while Region C underestimated its response by stating one kitchen, while the records showed that it included three kitchens.
Regions A and C overestimated, and region B underestimated, how many categories of hospital food waste they quantify. Region A stated that it quantifies plate waste, serving waste, safety margin waste, preparation waste, and waste rejected at delivery, but in the actual records, waste rejected at delivery and preparation waste were missing. Region C claimed that it quantifies serving waste, safety margin waste, waste rejected at delivery, and storage waste, although data on the two latter were lacking from the records. Region B stated that only serving waste was quantified, but the records showed that plate waste was also measured. All three regions gave coherent responses in reporting that they do not quantify any special diet food waste. Regions A and C gave coherent responses when stating what key figures were used to report the quantification results (g portion−1 for Region A and kg for Region C). Region B stated that it uses kg, but this response was underestimated as its quantification records also presented the results in g and g portion−1.
The tools used for quantification of food waste were reported to be spreadsheet software for Regions A and B and handwritten lists for Region C, although Region C quantification records were in the form of spreadsheets, so that response was underestimated. Region A stated that another measurement was made during quantification, ‘number of portions ordered’, which was verified by the records. Regions B and C claimed they did not make any other measurements, but their quantification records contained additional data, e.g., on ‘number of portions ordered’.
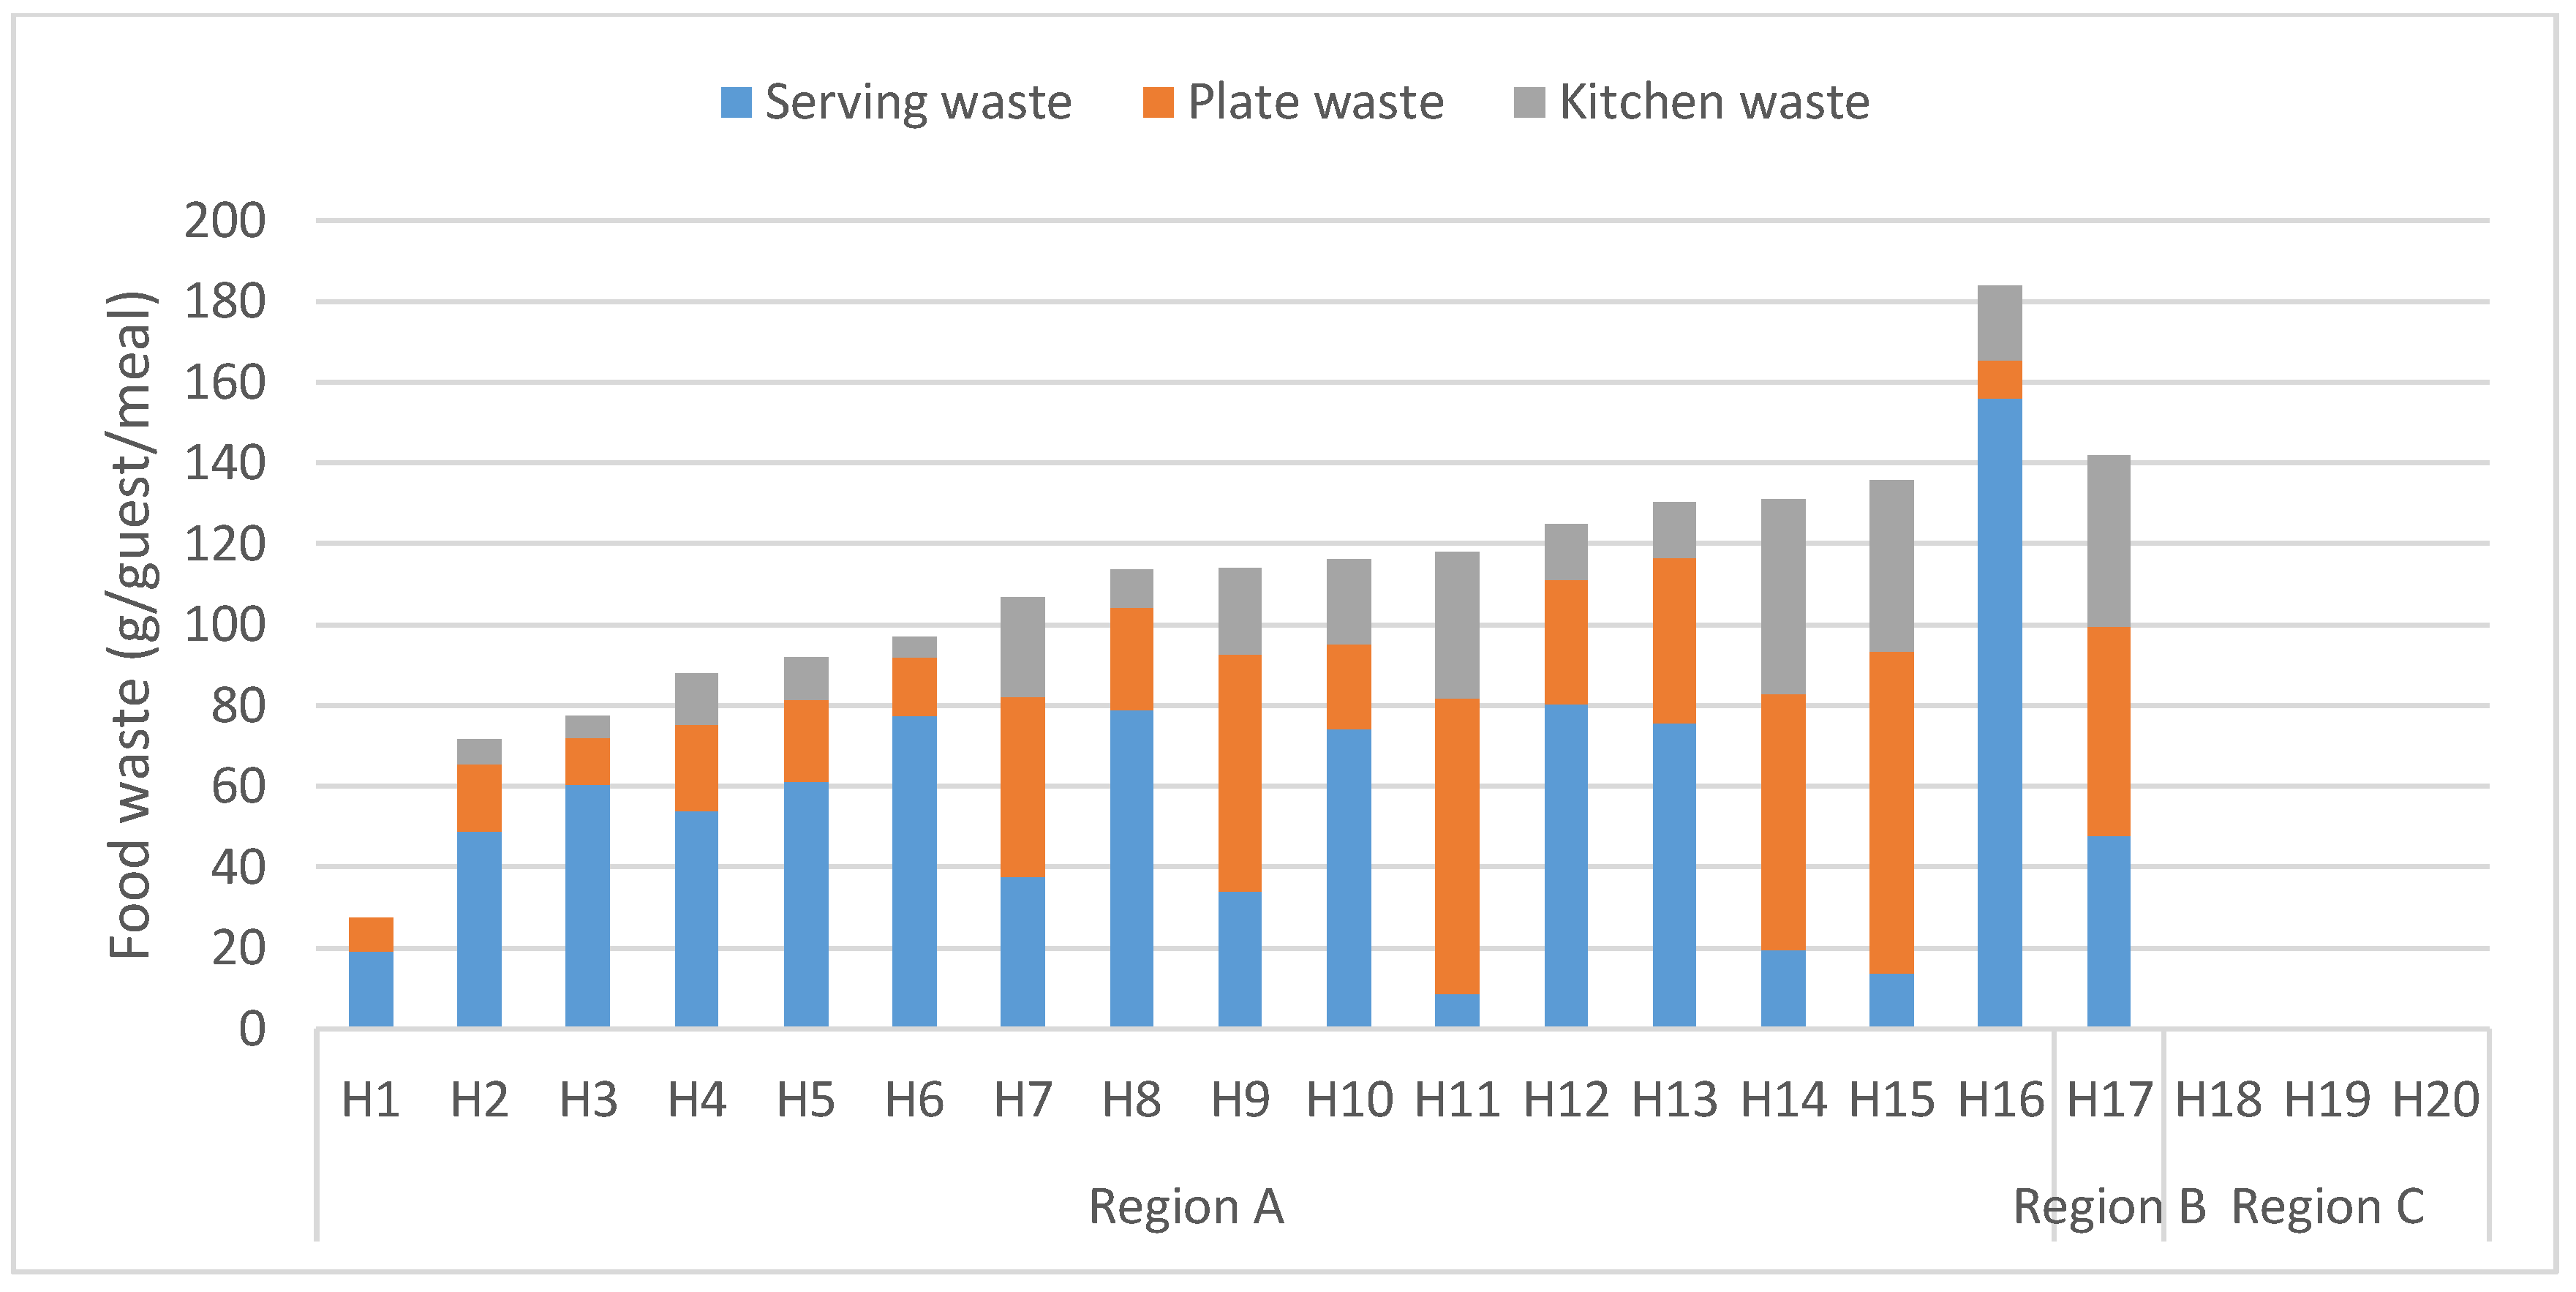
3.3. Food Waste Composition and Amount in Hospitals
The average level of food waste in the hospitals investigated was 111 g guest
−1 meal
−1, and this waste was composed of 42% plate waste, 36% serving waste, and 22% kitchen waste. In relative terms, there was great variation between the hospitals, with the lowest waste generation level being 27 g guest
−1 meal
−1 and the highest 184 g guest
−1 meal
−1 (
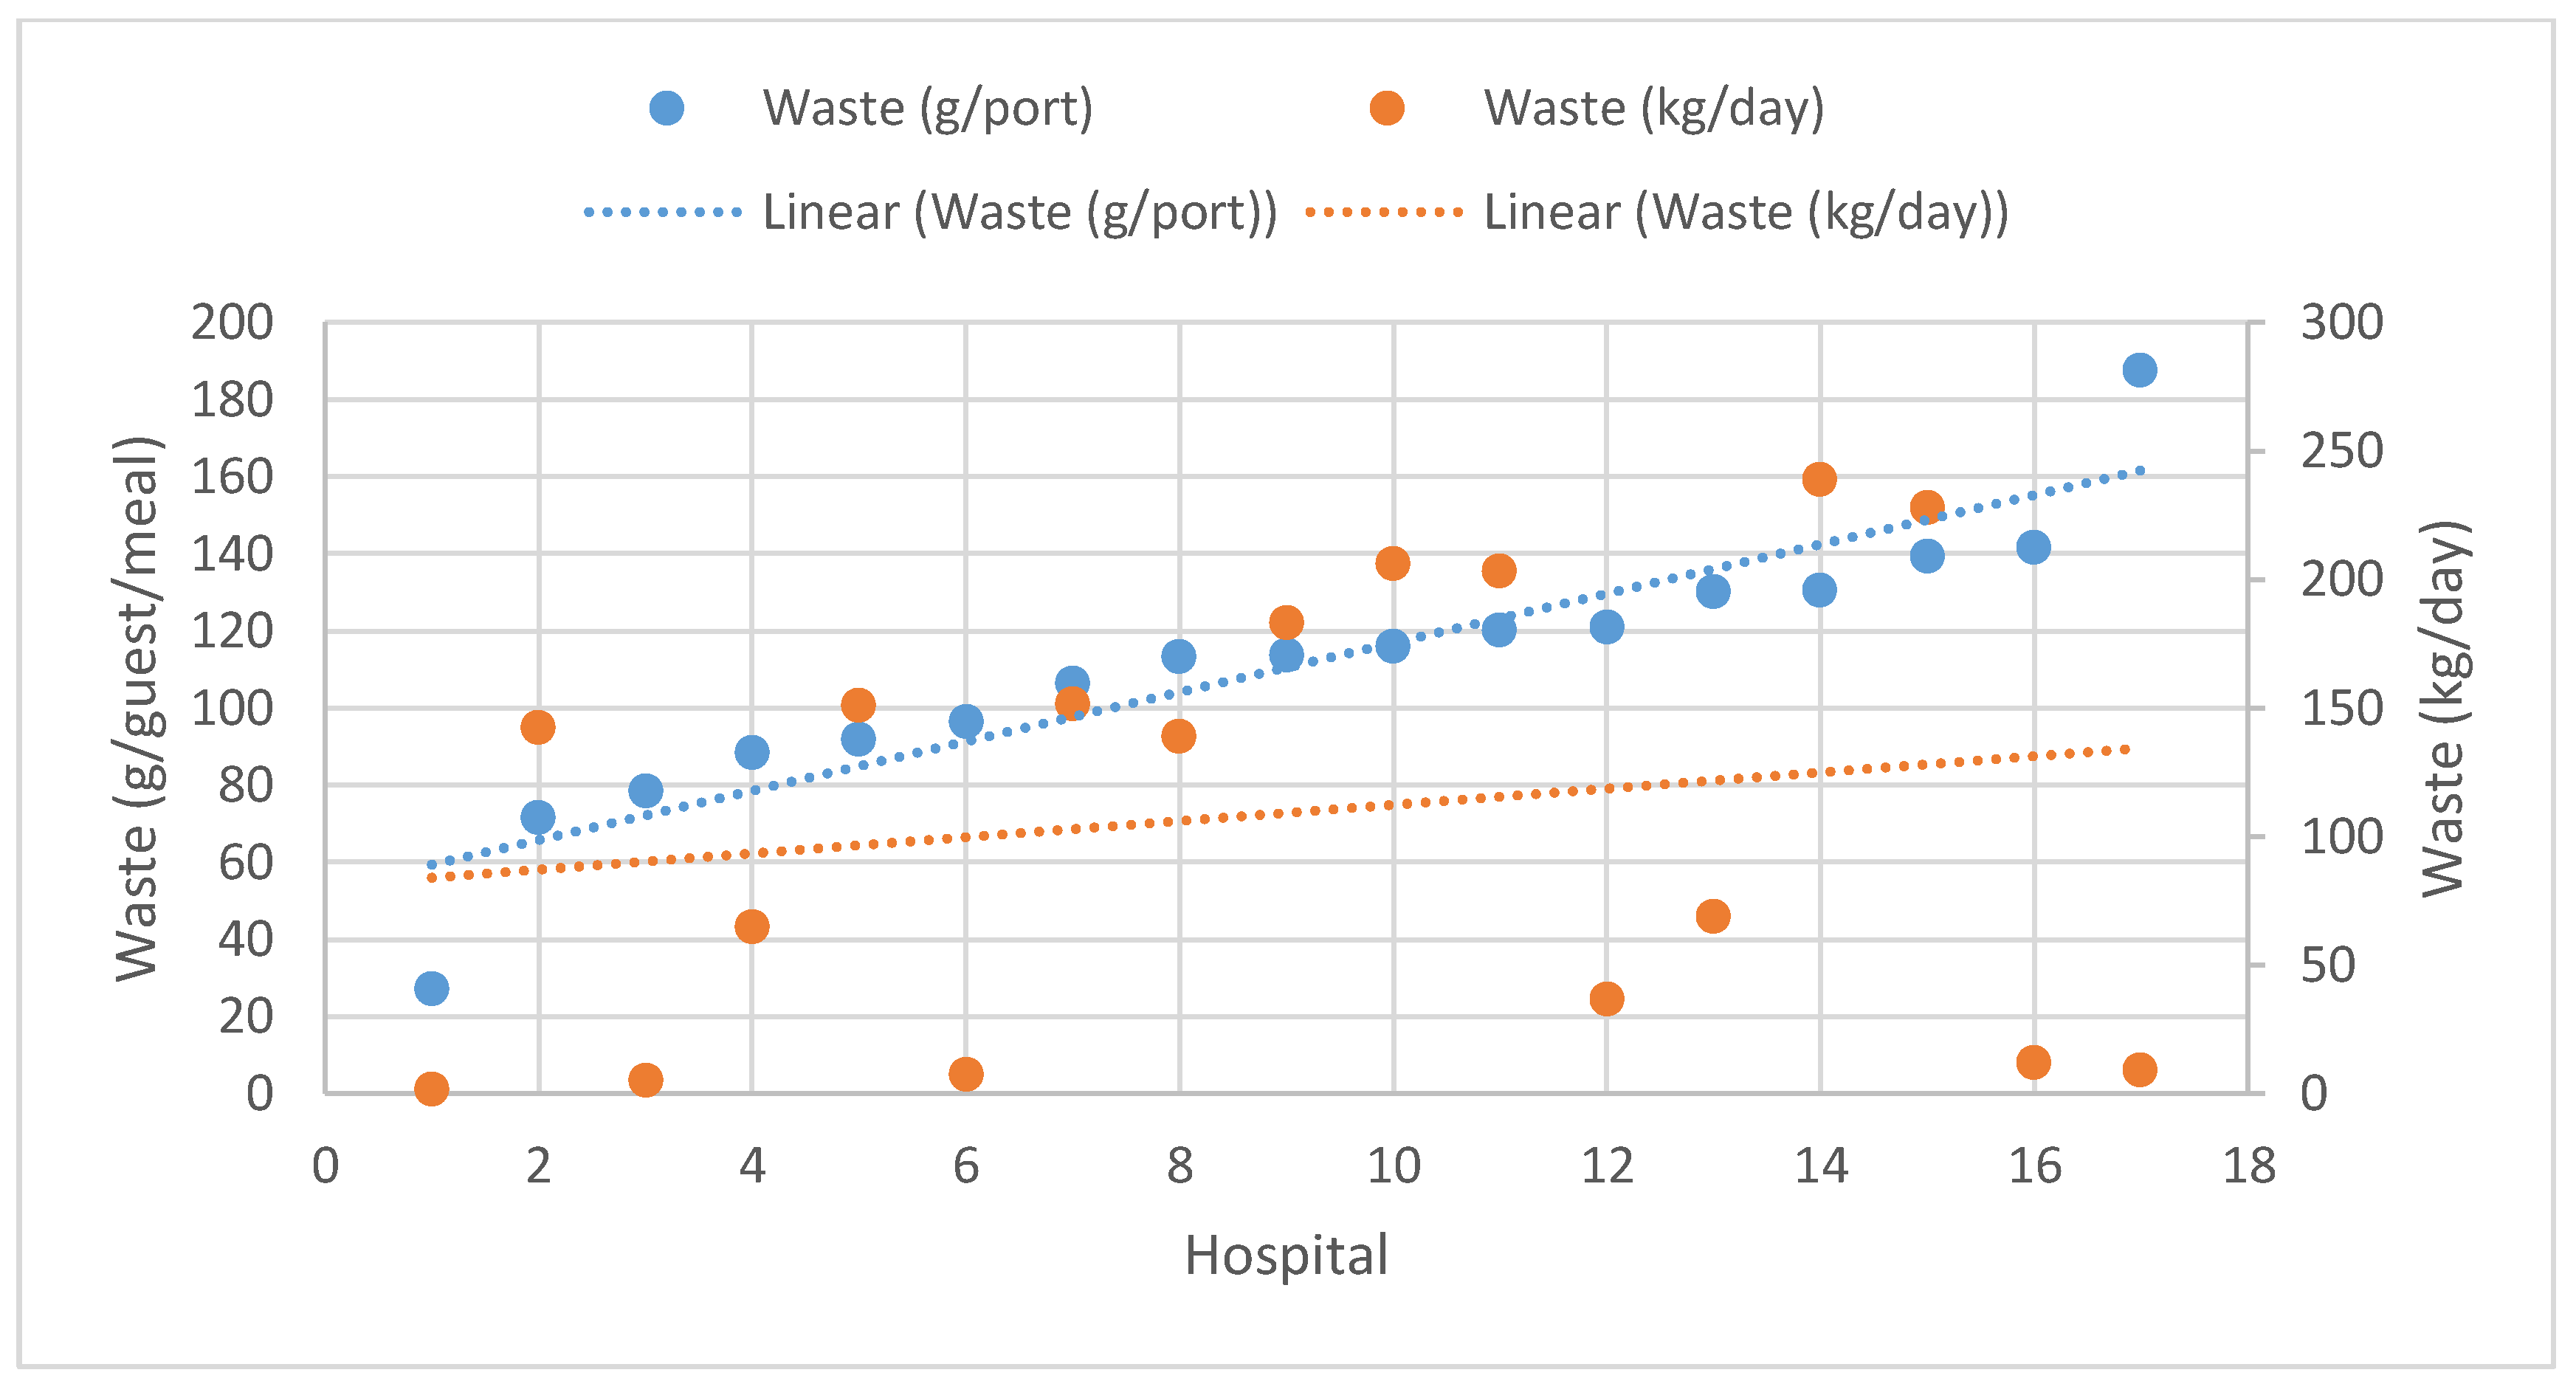
Figure 1). However, many of the hospitals had similar levels of recorded food waste and, with high day-to-day variation in average waste levels, most hospitals did not differ significantly from other hospitals. In absolute numbers, the waste level varied between 1.9 and 239 kg day
−1, with a mean value of 103 kg day
−1 (
Figure 2).
Figure 1 and
Figure 2 indicate a trend (with some exceptions) for increasing absolute waste with increasing relative waste. Relative waste could be expected to be lower for catering units producing a higher absolute mass of waste, since these are normally larger units serving more food, and therefore, larger overall volumes. However, as illustrated in
Figure 3, it appeared that hospitals with a higher absolute mass of waste (with some exceptions) also had a higher level of waste per guest served.
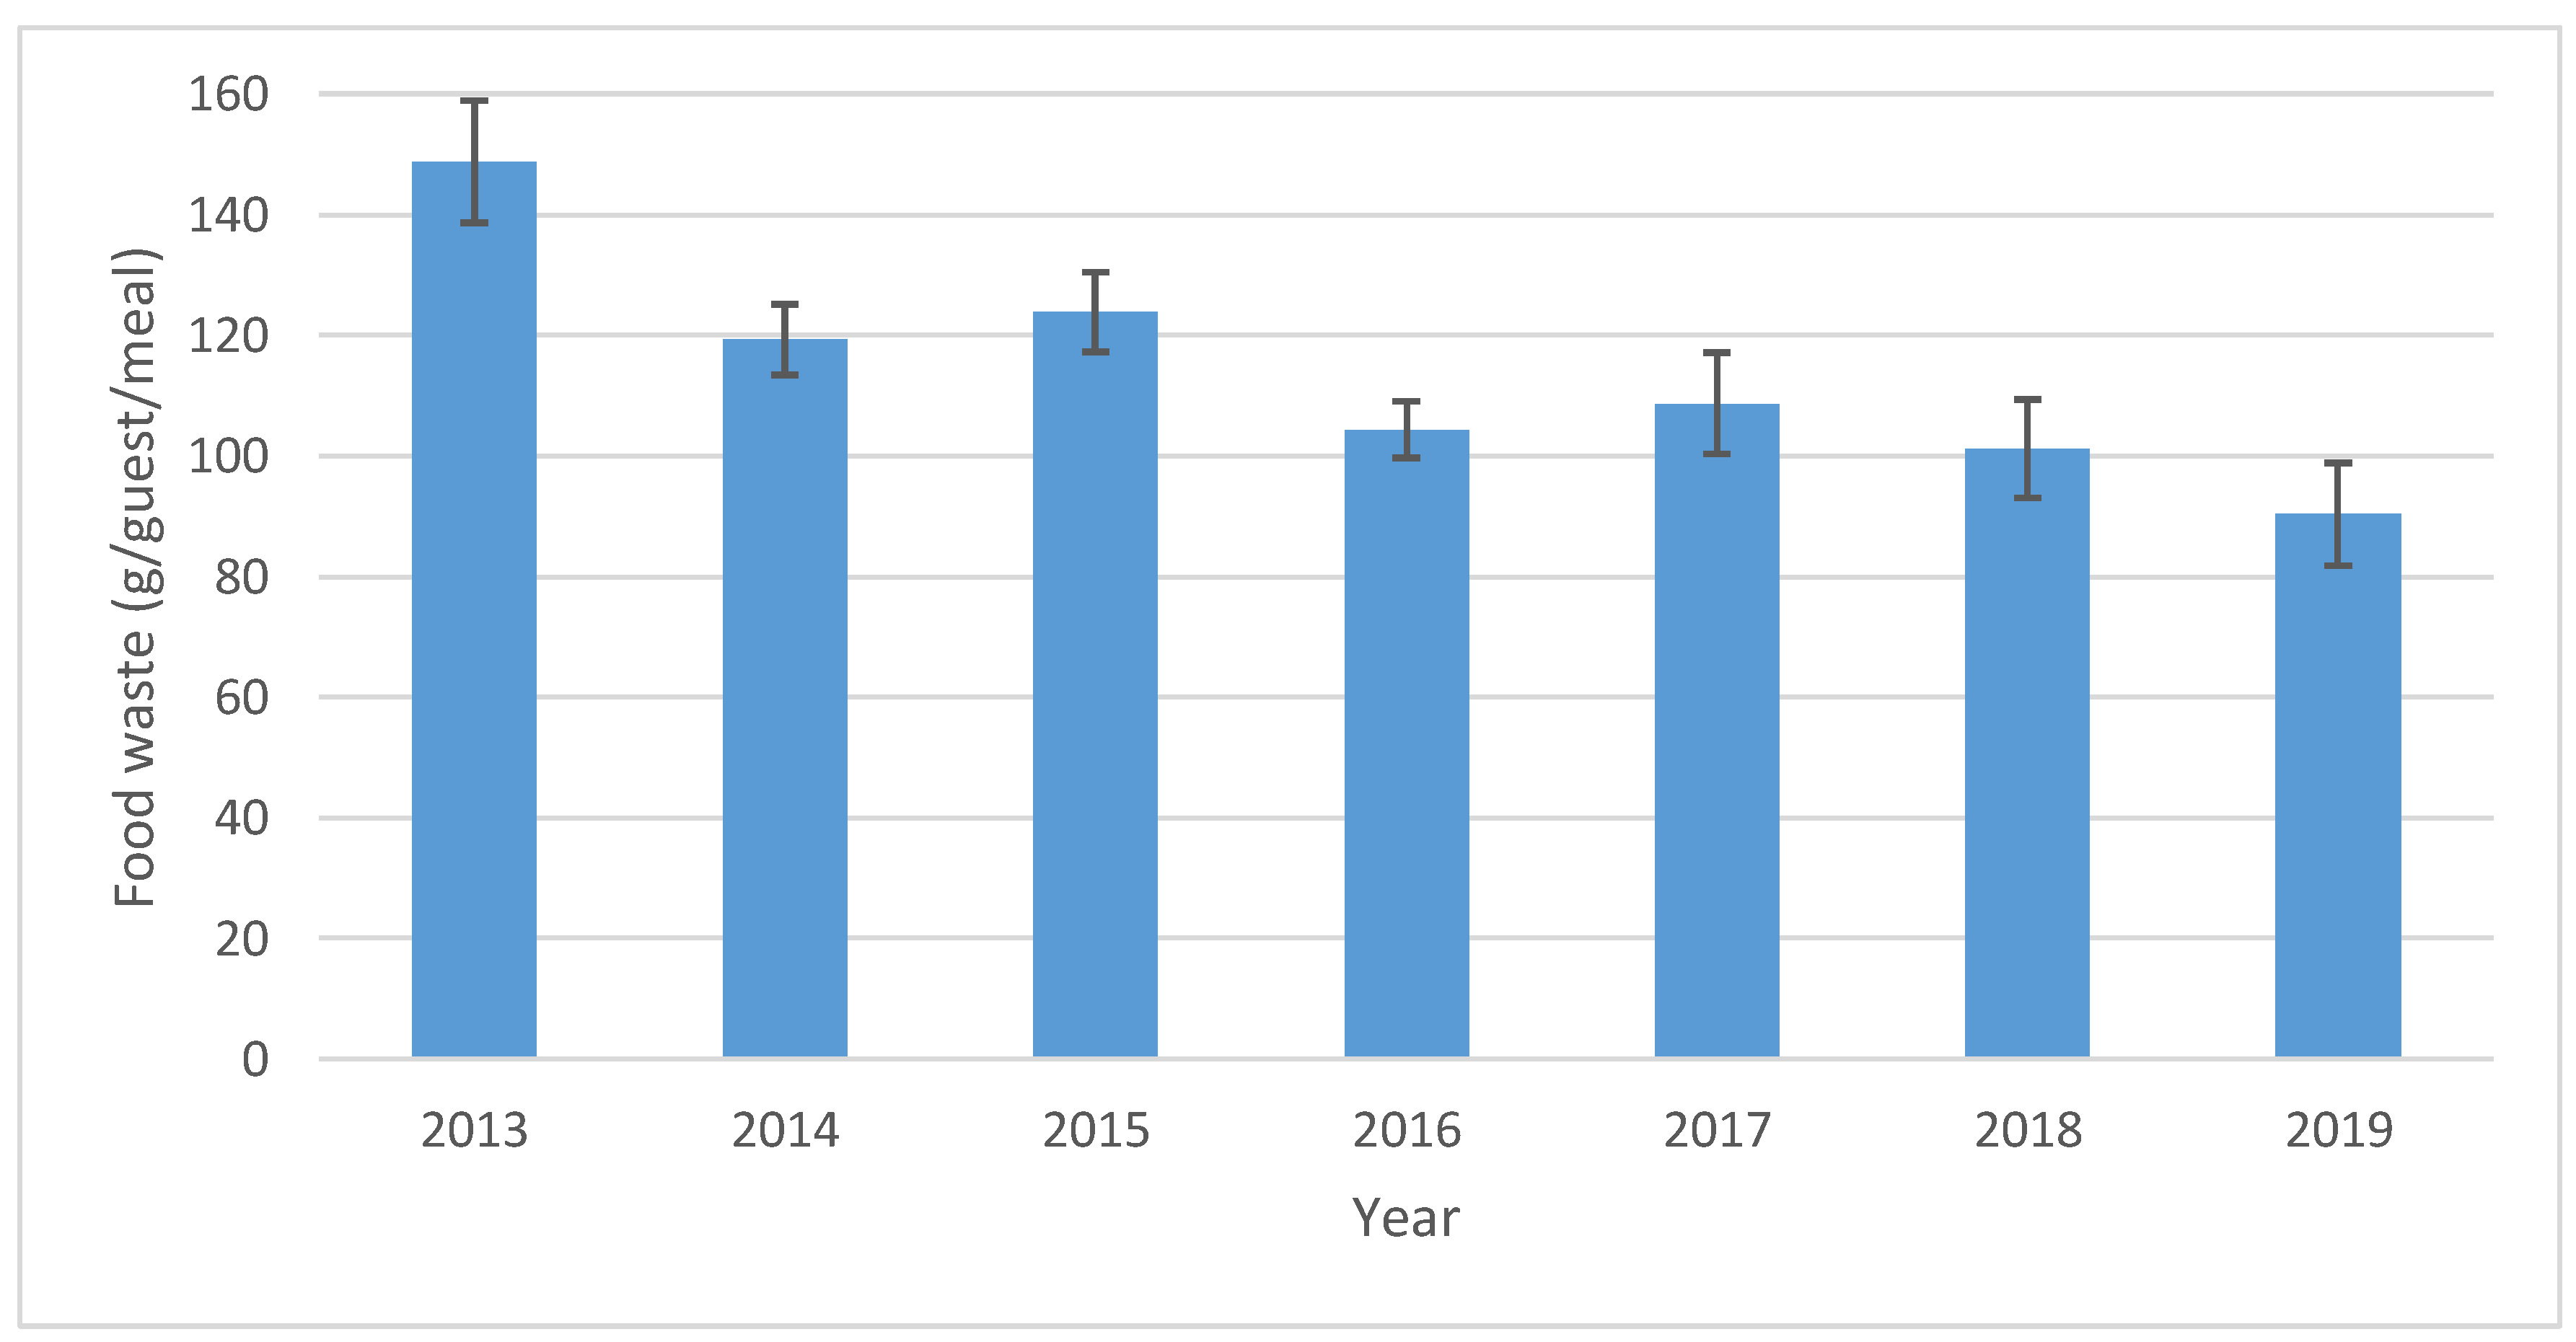
Since the regions studied had a long history of quantifying food waste, it was possible to assess changes over time for this sector.
Figure 4 shows the change in hospital waste generation from 2013 to 2019, which corresponded to a decrease of 39% (from 149 to 90 g guest
−1 meal
−1). There was thus a decreasing trend, although some years diverged from this trend.
4. Discussion
This survey of hospital food service organizations in Sweden confirmed that most have already taken the initiative to implement measures to quantify and reduce food waste. Although there were variations in quantification in relation to exact categories and recording period length, there were also obvious similarities between the regions that can act as a base for establishing a common protocol on how to record food waste that could be accepted by all regions in Sweden. Currently, serving waste and plate waste from hospital lunches and dinners are the most common elements quantified, and quantification takes place during one to three weeks per year. Spreadsheets are used for reporting waste data that are related to the number of plates cleaned after the meals, and the compiled results are expressed in mass of food waste per portion served. This quantification practice is rather basic, presumably because the regions were not acting on political targets but on their own initiative when initiating these measurements. The waste data compilation performed in hospitals in Sweden is incomplete and limited compared with that in other professional sectors, e.g., the Swedish retail and industrial sectors, where data have been collected daily for years [
23,
24,
25]. The retail sector has the advantage that its data collection is simplified through advanced support systems, and through analyzing data and information gathered during weekly meetings, facilitating food waste reduction. Based on the present survey, it appears that only a few Swedish hospitals can match the food waste quantification efforts in the retail sector. This can be one of the reasons for the reported differences in waste level between retailers, with waste levels of lower than 2% [
26], public catering, which often reports levels of food waste ranging from 10% to 30% [
27,
28,
29,
30].
The food waste quantification methodology used by Swedish hospitals in this survey is similar to that reported in other studies by Malefors et al. [
17] and Steen at al. [
31], where quantification focused on school canteen lunches and short waste quantification periods. Eriksson et al. [
29] reported that 87% of food waste in school canteens is either plate or serving waste, so the emphasis on these two categories in hospital waste quantification appears to be justified and it is reasonable to assume that most food waste is included in these two categories. This is also in line with the records from the 20 hospitals that provided their data in this study, where the waste consisted of 42% plate waste, 36% serving waste, and 22% kitchen waste. The high level of plate waste is consistent with findings in other studies on hospitals [
32].
Most hospitals in Sweden are organized and funded by regional authorities that are also responsible for the catering facilities at hospitals, but the actual work may be outsourced to one or several private contractors. The food waste generated in the hospital sector is commonly handled together with food waste from restaurants and households, in an organic waste stream exclusively managed by the municipal authorities in Sweden. The treatment methods available are thus limited, with the municipal authorities mainly using incineration, composting, or anaerobic digestion to treat and recover resources from the waste. Although these waste disposal options are not the highest priority in the waste hierarchy used in the European Union [
33], the management of food waste in the hospital sector in Sweden can still be seen as an efficient way of recovering nutrients and/or energy. In valorization and food waste management, reductions in greenhouse gas emissions can be generated by shifting from waste disposal and energy recovery to a system with donations and conversion, where surplus food serves its intended purpose, human consumption [
34]. Further, harmful pressure on the environment can be lowered by waste prevention through source reduction [
9,
35,
36].
The present study focused on public hospitals in Sweden, which typically serve breakfast, lunch, and dinner, at no cost to patients. Within the hospitals, especially larger hospitals, there are also often canteens, restaurants, cafes, and convenience stores that can be used by patients, staff, and visitors. The meals served to patients can vary depending on whether their illness requires a special diet. A typical Swedish hospital meal comprises a cooked dish based on poultry, fish, meat or a vegetarian alternative, often served together with rice, pasta, or potatoes. Meals may also include a salad buffet and/or cooked vegetables, water or other beverages, and bread. There are several ways in which the food is usually served, but the most common is a self-service buffet or on prepared trays in hospital wards. However, the systems used are often not customized to the needs and requests of individual patients, which results in limited choice, set meal-times, and a large proportion of plate waste. There are multiple reasons why plate waste is especially common in hospitals, including clinical issues, such as poor appetite and medication, food and menu issues, such as lack of choice, service issues, such as complex ordering systems, and eating environment issues, such as the meal being interrupted by ward rounds and tests, the ward environment, and inappropriate meal times [
32]. In order to address these issues, a room service model, where meals from an à la carte menu are served on demand to patients, is becoming more common in hospitals internationally. The room service system has been shown to result in less plate waste, increased patient intake, improved patient satisfaction, and decreased costs compared with the conventional food service model [
11], but few hospitals use this system.
Previous studies on food waste quantification in Swedish public catering have less coverage, with a response rate of, e.g., 54% [
37], 65% [
38], or 93% [
20]. The present study can be regarded as both robust and generalizable, as it covered 95% of the Swedish regions. However, some regions might have failed to distribute questionnaires to all food service organizations within the region, and thus the data might contain sources of bias. Another weakness of the study is that it is unclear whether the respondents who completed the questionnaires had the appropriate knowledge. However, since a number of the responses to the questionnaire were verified by food waste quantification records, use of a questionnaire can be considered an accurate method for mapping the practices of food waste quantification. The only weakness of the verification process is that the regions submitting food waste quantification records were not randomly selected and it is possible that only those with the highest awareness and competence felt willing to share their data. This possibility is supported by the fact that the average waste level for the hospitals investigated was 111 g guest
−1 meal
−1, which is lower than in other studies on hospital food waste [
16,
17]. Therefore, it is not surprising that the questionnaire responses from Regions A–C were largely coherent with the documented data for those regions. However, even if the hospitals studied represent best practice in the sector, many of the routines reported for Regions A–C were similar to those in other regions, indicating that steps have been taken in the process to reduce food waste. It is important to provide public access to any food waste records since such information is often lacking in the literature [
39,
40]. This could provide the sector with a baseline on ‘normal’ practices [
25].
The hospitals included in this study had a lower level of food waste than hospitals in previous studies, but the level was still high in comparison with values reported for other public sector food services, such as pre-schools, schools, and elderly care homes [
17]. This indicates that the sector has great potential for improvement. The trend detected here of increased relative waste with increased absolute waste also indicates potential for improvement. Previous studies by, e.g., Eriksson et al. [
34,
41,
42,
43] and Brancoli et al. [
44] have reported that larger volumes of food sold (and wasted) normally correlate to lower levels of waste in relation to volume sold, but the results of the present study indicate that this correlation does not apply to the hospital sector. This could be explained by increased complexity in large hospitals, which reduces the benefit of large volumes that can be exploited in supermarkets and schools. However, it could also be explained by larger units having the scope to allocate more resources to food waste quantification efforts, and thereby finding and recording more waste. One way to reduce food waste in hospitals could be to implement a room service system, where meals are served on demand, as it has been proven to result in less plate waste, increased patient intake, and improved patient satisfaction [
11].
The hospitals investigated here showed a trend for reduced levels of food waste, but there is a risk that they are not representative of all Swedish hospitals. However, since their food waste quantification practices were similar, there is great potential to implement best practice within the whole sector. In order to increase acceptance and facilitate implementation of a standard, the first step could be a common framework for waste quantification based on common practices by the majority. However, future policies with regard to waste quantification in the public food sector should set higher goals in terms of data collection efforts, as the present methodology might be inadequate in the future. There is also a need to act on recorded information, since quantification by itself is a weak measure to reduce waste [
43]. Therefore, creating incentives for quantifying food waste, such as control measures, is a key step in reducing food waste in hospitals and should accompany any quantification standard. Not wasting food for economic reasons might be enough motivation and incentive for owners and staff within the private sector. Such motivation is often lacking in the public sector, but that sector might be more prone to consider the environmental concerns associated with food waste. One way to strengthen food waste reduction efforts in the public sector could be to introduce compulsory quantification and reporting of food waste quantities, with a common protocol for follow-up [
17,
20]. Public catering organizations should also commit to meeting the target of halving per capita global food waste set in the Sustainable Development Goals of the United Nations [
45]. Standardized procedures for waste quantification and reporting could be a first step towards fulfilling this target and making the food system more sustainable.

 ,
, 


