Abstract
Fifty-four groundwater samples were collected from Hamra Alasad in Al-Madinah City. The chemical and microbial characteristics of the samples were analyzed and compared with their respective standards. The results revealed that 90.7% of the samples showed higher amounts of NO3. However, 59.3% of the samples were found unfit for irrigation purposes due to a high salinity hazard. Most of the groundwater samples were highly saline, yet no sodicity hazards were anticipated as predicted by sodium adsorption ratio (SAR). Generally, the soluble cations and anions, dissolved salts, boron, and NO3− exceeded the maximum permissible limits for drinking water in most of the samples; however, Pb, Cd, As, Zn, Cu, Ni, Co, Fe, Mn, and Cr were within the permissible limits. Furthermore, 42.6%, 24.1%, 18.5%, 14.8%, 1.9%, and 37.0% of the samples were infected by a total coliforms group, fecal coliform, Escherichia coli, Staphylococcus sp., Salmonella sp., and Shigilla sp., respectively. The water quality index revealed that 3.7% of the samples were good for drinking (class II), and 9.3% were very poor (class IV). The remaining samples were unfit for drinking (class V) due to high salinity and/or microbial contamination. Durov and Piper diagrams revealed that the majority of water samples were of the calcium sulfate–chloride type. Overall, 87% of water samples were inappropriate for drinking purposes, while 77.8% were unsuitable for irrigation.
1. Introduction
The Kingdom of Saudi Arabia (KSA), located in an arid environment, has limited renewable water resources [1]. There is a potential risk of water scarcity in the future due to a rapidly changing climate and anthropogenic activities [2]. The kingdom depends largely on the desalination of seawater and groundwater for different purposes such as drinking, irrigation, and industry [3]. Al-Madinah City is located in the western part of the KSA, and attracts a preponderance of religious tourists. It mainly depends on groundwater to meet its water requirements. Al-Madinah is one of the most significant cities in the KSA for historical and religion reasons. Various agricultural farms around Al-Madinah city conduct important agricultural activities including vegetables, dates, and alfalfa production. In Al-Madinah, there is a water stress due to the rapidly increasing population, extensive pumping out of groundwater resources, and prevalence of arid to semi-arid conditions [4]. This stress has undoubtedly led to the deterioration of the groundwater [1,5]. Hydrochemical characteristics including cations, anions, heavy metals, nitrates, chlorides, and organics of the groundwater to determine water quality indices should be used to help sustain the groundwater [6,7]. The chemical characteristics of groundwater, such as pH, dissolved salts and gases, metals, and organics, are controlled by the exchange of cations within the geological aquifer, dissolution of minerals, and evaporation and redox reactions [8,9]. Spatiotemporal assessment and monitoring of the groundwater are essential for sustainability [10].
The water quality index (WQI) is an effective method to evaluate water quality and help policymakers. WQI integrates water quality parameters into a single number, which represents the quality of water [11,12,13,14]. The WQI has been successfully computed and applied by several researchers to investigate the water quality of water resources worldwide [11,14,15,16,17,18,19]. All WQI calculations depend on the integration of physiochemical parameters [10,19,20,21]. Backman et al. [22] used the WQI for evaluating the groundwater quality in Finland. Ketata-Rokbani et al. [23] presented the WQI with a GIS to evaluate the quality of the groundwater in Tunisia. Furthermore, Aly et al. [10,19] used the WQI to assess the water quality in the towns of Hafer Abatein and al-Kharj in the KSA. The groundwater in the city of Al-Madinah is mainly utilized for agricultural purposes, with some being used for industries [3]. Two aquifers are located in Al-Madinah, i.e., a sedimentary aquifer and a volcanic aquifer. It has been reported that the alluvium aquifer occupied an ancient basin, which was then covered by volcanic lava [24]. The abundance of water in this holy city, which is mainly used for human consumption, is a serious impediment for sustainable agricultural development. As there is a lack of a proper drainage system, salt accumulates in the soil, causing the deterioration of the groundwater quality in both the sedimentary and volcanic aquifers. Previous reports have concluded that the water quality in both aquifers is deteriorating due to salinization [3].
The aims of this investigation are to 1) assess the water quality of the Al-Madinah City groundwater for irrigation and drinking purposes by using the WQI, and 2) investigate the hydrochemical classification of the groundwater in Al-Madinah City.
2. Materials and Methods
2.1. Study Area
Al-Madinah City is situated in the KSA in the western part of Arabian Peninsula, known as the Arabian Shield province, around 400 km from Mecca City [25]. The holy city is located at 24°28′ N and 39°36′ E. The city has a population of 995,619 inhabitants [26]; however, it exceeds 1.5 million in Hajj season. Its topography comprises of plains and hilly areas as well as valleys. Generally, the ground elevation in the plains ranges between 600 m and 620 m above mean sea level (AMSL). The mountainous areas are situated in the northern, southern, and western part of the city, with an elevation of 800 m to 1500 m AMSL. The slope of the area is from east to west until the slope reaches the Al-Aqiq valley. During last two decades, Al-Madinah has moved from being totally dependent on its groundwater to almost entirely dependent on desalinated water from the Yanbou Desalination Plant. The groundwater in the city is utilized in agriculture and some industries.
The climate of Al-Madinah City ranges from semi-arid to arid with a hot and dry environment. In the summer season, it is very hot and in the winter season it is moderately cold. The average temperature during summer ranges between 25–42 °C, whereas in winter it ranges between 10–24 °C [24]. The temperature reaches its highest level during August, while its lowest level is during January. Most of the rainfall happens during November, December, and January, with occasional rainstorms taking place in April.
2.2. Hydrology
Saud et al. [3], stated that the total discharge of groundwater in Al-Madinah during 1968 was 2 × 10⁵ m3, which exceeded the recharge value. This has resulted in a drawdown of 10 m over a period of 25 years. The total groundwater storage within the aquifer was estimated to be 5.7 × 10⁹ m3. Saud et al. [3] pointed out that the sub-basaltic alluvium was more important, despite it having a low permeability. Moreover, the maximum amount of the groundwater stored within it was 7.5 × 10⁸ m3. Al-Madinah’s groundwater depression has formed due to over-pumping. A decline in the groundwater levels up to 0.1 to 0.15 m/month has been noticed, suggesting that the average annual input and output is 2.95 × 10⁷ m3 and 4.05 × 10⁷ m3, respectively, from the sub-basaltic alluvium aquifers. The Al-Madinah area was evaluated at having a shortage of 1.1 × 10⁷ m3 [3]. The Water and Sewerage Directory of Al-Madinah reported the presence of two well fields in the southern parts of the city. Among them, the Quba well field comprises 31 wells, of which only two are currently functional with a production of 2000 m3/day. These wells are approximately 110 m deep. All other wells were left un-operational, owing to their low production and/or a higher salinity levels. Lately, the well field in Abyar Almashi has been developed. Overall, the groundwater in Al-Madinah is characterized by high salinity, contamination in some sites, and continuous fluctuation of the water table in the aquifer due to withdrawals and low recharge.
2.3. Chemical Analysis
Fifty-four groundwater samples were gathered from Hamra Al-Asad in the Al-Madinah region (Figure 1). The depth of the wells ranged between 10–110 m (personal communications). All of the samples were stored in an icebox and transported to laboratories at the King Saud University in Riyadh for analysis. After testing the taste, the water samples were subjected to the following analyses: electric conductivity (EC), water reaction (pH), soluble ions (calcium (Ca2+), magnesium (Mg2+), sodium (Na+), potassium (K+), carbonate (CO32−), bicarbonate (HCO3−), chloride (Cl−), and sulfate (SO42−)), nitrate (NO3−), boron (B), and heavy metals. The EC (dS·m−1) and pH were determined in the field using a portable EC/pH meter (Hanna, HI 9811-5). The ions Mg2+ and Ca2+ were determined using the titration method with ethylenediaminetetraacetic acid. In addition, K+ and Na+ were determined by a flame photometer (Corning 400) [27]. The ions CO3−2 and HCO3− were determined using acid titration; the Cl− ion was determined using silver nitrate titration [27]. Furthermore, SO42− was estimated using a turbidity procedure [28], while NO3− and B were established using methods utilizing phenoldisulfonic acid and azomethine-H, respectively [29,30].
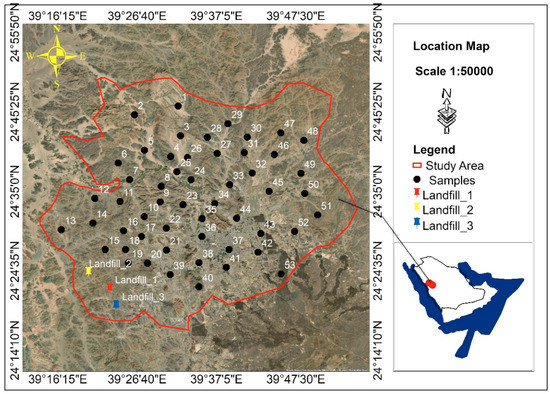
Figure 1.
Geological map of the study area and sampling points of Al-Madinah City, Western Saudi Arabia.
Water samples for heavy metal analyses were filtered and acidified using HNO3 to a pH < 2. Furthermore, the analyses of the heavy metals were carried out using an ICP PerkinElmer Model 4300DV [29,31].
2.4. Microbial Analysis
The total colony count was determined by nutrient agar methods; however, the coliforms (as one group) and E. coli were determined by the Colilert or defined substrate methods, as described by Edberg et al. [32], Fricker et al. [33], Eckner [34], and Maheux et al. [35].
2.5. WQI Computing
The chemistry of the groundwater was explored by computing the WQI. It has been established that the WQI is a vital parameter for measuring the groundwater quality. The WQI can be calculated by assigning a relative weight (wi) to each parameter based on their importance in the overall water quality. Briefly, the calculations of the WQI comprised three steps as follows [10,11,14,15,16,17,36].
2.5.1. Assigning Weight
The 13 parameters were given a weight (wi) according to their significance in determining drinking water quality (Table 1). The wi was calculated by using a weighted arithmetic index method as reported by Ramakrishnaiah et al. [37]. The weights ranged between 1 and 5, with 5 being the utmost important parameter and 1 being the least important parameter (Table 1) [37].

Table 1.
Relative weight for parameters for the groundwater collected from Al-Madinah City, Western Saudi Arabia.
2.5.2. Relative Weight (Wi)
Wi was calculated as follows:
where is the weight of the parameter and n is the total number of parameters (Table 1).
2.5.3. Quality Rating Scale (qi)
The qi was calculated by dividing the water sample concentration to a respective standard, as follows:
where Ci is the concentration (mg L−1) and Si is the permissible limit value as given by the WHO standard [38]. Lastly, the sub-index of ith parameter (SIi) of each chemical parameter was calculated as follows:
Then, the WQI was calculated by taking a sum of all calculated sub-indices as follows:
The values of the WQI were classified into five classes (Table 2).
Table 2.
Water quality classification ranges and types based on the calculated water quality indices (WQI) values.
2.6. Hydrochemical Characteristics
To investigate the hydrochemical characteristics of the collected water samples, the Piper, Schoeller, and Durov diagrams were constructed by using Geochemistry Software AquaChem 2014.2 to identify the water type [39,40]. In addition, hazards due to salinity, sodium adsorption ratio (SAR), total hardness (TH), and Kelly’s ratio (KR) were computed.
2.7. Geochemical Modeling: The Saturation Index (SI)
The SI of a mineral was calculated using the PHREEQC model [41] (Equation (5)):
where IAP is the Ion Activity Product of the mineral and kt is the solubility at chemical equilibrium [42].
SI = log IAP/kt
2.8. Statistical Analyses
The statistical analyses carried out included the determination of maximum, minimum, average, standard deviation, variance, standard error, median, and skewness. These analyses were conducted using Excel [10].
3. Results and Discussion
3.1. Groundwater Evaluation for Drinking
A total of 42.6%, 24.1%, 18.5%, 14.8%, 1.9%, and 37.0% of waters were infected by total coliforms, fecal coliforms, E. coli, Staphylococcus sp., Salmonella sp., and Shigilla sp., respectively (Table 3). This finding is in agreement with the finding of Al-Makishah [43].
Table 3.
Microbial analyses of the groundwater samples collected from Al-Madinah City, Western Saudi Arabia.
The results showed that some of the groundwater samples had a noticeably bitter taste due to the predominance of Ca2+. Nonetheless, according to the WHO, calcium from the calcium-rich water is well absorbed by the human body and retained, just as the calcium from milk is retained [44]. The results revealed that the pH values of the collected groundwater samples ranged from 6.5 to 8.4 with an average of 7.1, suggesting safe limits. However, based on EC values, 77.8% of the groundwater samples were categorized as having a high salinity hazard, mainly due to highly dissolved soluble ions (Table 4). Thus, most of the groundwater samples were not suitable for drinking purposes. The concentrations of NO3 in the collected groundwater samples ranged from 1.8 mg L−1 to 304.2 mg L−1 with an average of 117.9 mg L−1 (Table 5). The results showed that 50% of the water samples had NO3 concentrations more than 100 mg L−1, which were above the permissible limit (50 mg NO3 L−1) for public drinking water supplies [38].
Table 4.
Descriptive statistics of the studied groundwater chemical composition.
Table 5.
Descriptive statistics of the water quality indicators (WQI) of the studied groundwater samples collected from Al-Madinah, Western Saudi Arabia.
Based on the calculated values of the water quality index (WQI), about 3.7% of the water samples were suitable for drinking purpose (class II), and 9.3% were very poor water (class IV). The rest of the samples were found to be unfit for drinking purposes (class V) due to high salinity and/or microbial contamination (Figure 2). Most of the groundwater in Al-Madinah is used for agricultural purposes [45]. These results are in agreement with the study of Fallatah [2] and Sharaf [4].
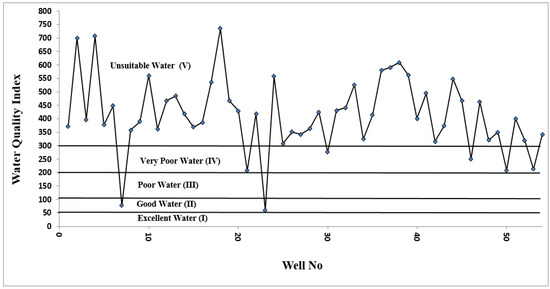
Figure 2.
The calculated values of the water quality index (WQI) of the groundwater samples collected from Al-Madinah City, Western Saudi Arabia.
3.2. Groundwater Evaluation for Irrigation
The chemical analyses of the Al-Madinah groundwater samples were analyzed statistically (Table 4 and Table 5).
Figure 3 shows that the order of cation concentrations is as: Ca2+ > Na++ K+ >Mg2+; whereas, the order of anions concentrations is as: Cl− > SO42− > HCO3−. The results revealed that the collected groundwater samples contained a pH of 6.5–8.4, with an average of 7.1 (Table 4). The acceptable limit of pH for irrigation water is between 6.5 and 8.4 [46]. Consequently, all water samples were within an acceptable limit due to pH values [45,47]. The EC ranged between 0.5 dS m−1 to 8.3 dS m−1, with an average value of 4.4 dS m−1 (Table 4). According to the classification by Ayers and Westcot [46], 3.7% of the water samples had no degree of restriction for use in irrigation. However, 18.5% of the water samples had slight to moderate salinity. Finally, 77.8% of the groundwater samples were categorized as having a high salinity hazard. One of the significant methods for defining the hazard of sodium is the sodium adsorption ratio (SAR) [48], which was calculated as follows:
where meq L−1 is the unit for expressing cations (Na, Ca, and Mg).
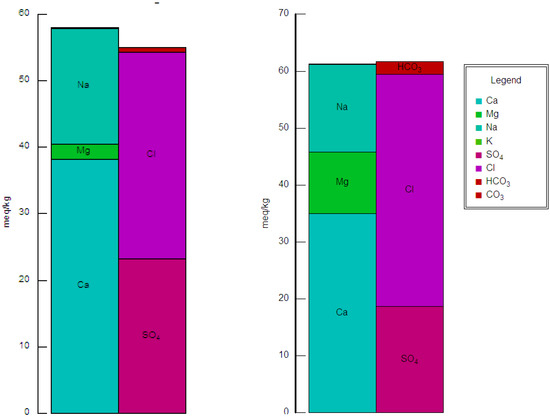
Figure 3.
Ion balance diagram of samples 1 and 24 depicting the dominance of calcium in some areas of Al-Madinah City, Western Saudi Arabia.
The values of the SAR ranged between 0.6 and 10.2, with a mean of 5.5 (Table 2). Moreover, 96.3% of the SAR values were < 10. Consequently, the water could be classified as excellent for irrigation with respect to the sodium hazard [49]. Kelly’s ratio (KR) [50] was calculated as:
where meq L−1 is the unit for expressing cations (Na, Ca, and Mg) and KR > 1 indicates a high hazard from sodium.
Thus, 61% of the water samples had a KR < 1, indicating that they did not have any sodium hazards; instead, 39% of the water samples had a KR > 1, which represented a high sodium hazard if the waters were used for irrigation (Table 2).
The residual sodium carbonate (RSC) was calculated from Equation (8) as follows:
where the cations and anions in Equation (8) are expressed in meq L−1.
RSC = (CO3− + HCO3−) − (Ca2+ + Mg2+)
A (-) value for the RSC showed that sodium was not likely to be a problem due to adequate amounts of magnesium and calcium, which were in surplus of magnesium and calcium precipitated in the form of carbonates. All samples had a negative RSC, indicating that there was no sodium hazard (Table 2) [51].
Magnesium hazard (MH) was calculated as follows [52]:
where the calcium and magnesium were in units of meq L−1.
If MH < 50, the water is safe for irrigation [52]. In this study, all of the samples had an MH < 50; consequently, they could be considered as suitable for irrigation with respect to MH (Table 2). The NO3− concentrations in the groundwater samples ranged between 1.8 and 304.2 mg L−1, with a mean of 117.9 mg L−1 (Table 2); 50% of the water samples had NO3− concentrations greater than 100 mg L−1, probably because of the usage of chemical fertilizers in agricultural production [53]. Of the samples, 18.5% had boron (B) concentration within the permissible limit. However, 75.9% of the samples had a slight to moderate degree of restriction for use in irrigation. The remaining samples had a severe B hazard because their B concentration was more than 3 mg/L (Table 2) [1,45].
3.3. Hydrochemical Aspects
The Piper and Schoeller [45] diagrams (Figure 4) revealed that the main water type identified in the Al-Madinah groundwater was calcium–magnesium/sulfate–chloride, and this represented 74% of collected samples. However, 26% of samples showed a water type of sodium–potassium/sulfate–chloride. These water types indicated that the geological composition in the area was mainly gypsum, anhydrite, and halite.
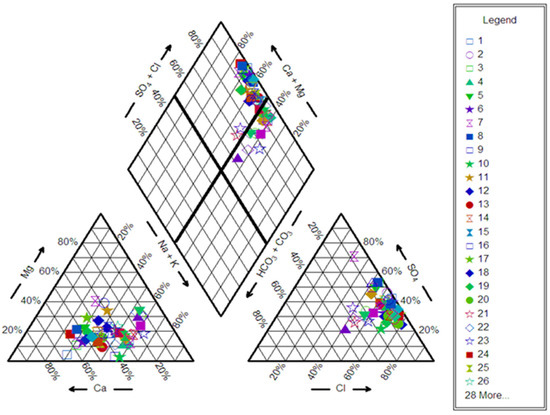
Figure 4.
Piper diagram for the groundwater samples collected from Al-Madinah City, Western Saudi Arabia.
Durov’s diagram (Figure 5) showed that the groundwater samples fell in fields 4 and 5. The fitting of samples in field 4 showed the occurrence of Ca2+ and SO42− as the dominant ions in the water and they reflected the gypsum-bearing sedimentary aquifer; the water was affected by oxidation of pyrite and sulfide minerals. Field 5 showed that mixing occurred between two or more different facies [9,36].
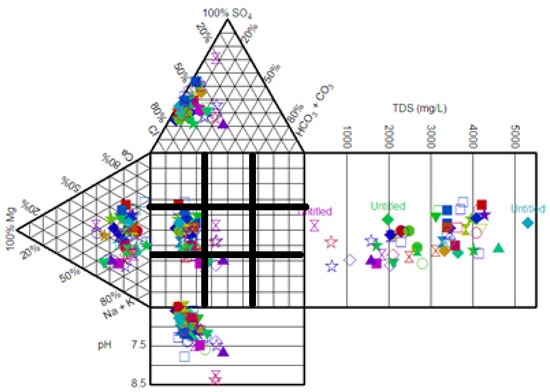
Figure 5.
Durov diagram for the groundwater samples collected from Al-Madinah City, Western Saudi Arabia.
3.4. Geochemical Modeling
Groundwater is considered to be saturated with minerals if −1 < SI < +1; moreover, if SI is less than −1, the groundwater is assumed to be undersaturated and if SI is above +1, it assumed to be oversaturated [54].
Mineral saturation indices (SI) of the groundwater samples were calculated using the model of PHREEQC [19,55] (Figure 6). The results showed that most sites contained the following minerals in their aquifers: anhydrite (CaSO4), goethite (FeOOH), gypsum (CaSO4:2H2O), halite (NaCl), hematite (Fe2O3), jarosite-K (KFe3(SO4)2(OH)6), and melanterite (FeSO4:7H2O). However, only samples 1, 2, 3, 7, 8, and 20 contained ausmannite (Mn3O4), manganite (MnOOH), pyrochroite (Mn(OH)2), and pyrolusite (MnO2). The water samples were found to be undersaturated with halite, hausmannite, jarosite-K, manganite, melanterite, pyrochroite, and pyrolusite. In addition, 22.2% and 27.8% of the water samples were undersaturated with sulfate minerals of gypsum and anhydrite, respectively; suggesting more soluble Ca2+ and SO42− dissolved in the groundwater samples. The higher contents of SO42− could be due to the oxidative dissolution of pyrite [56]. However, the remaining samples were saturated with both minerals. Furthermore, the water samples were found to be oversaturated with respect to goethite and hematite. Unsaturated minerals have a tendency to dissolve in water samples [19,57]. Thus, there is an option for an increase in the concentrations of soluble ions dissolved in the groundwater. This result is in agreement with the results of Al-Barakah et al [58] and Fallatah [2] on their study of Arabian Shield groundwater.
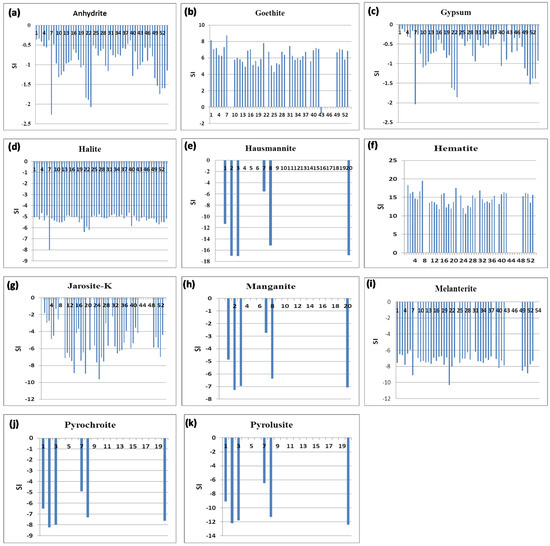
Figure 6.
Mineral saturation indices of the groundwater samples collected from Al-Madinah City, Western Saudi Arabia (a): anhydrite, (b): geothite, (c): gypsum, (d): halite, (e): hausmannite, (f): hematite, (g): jarosite-K, (h): manganite, (i): melanterite, (j): pyrochroite, and (k): pyrolusite.
4. Conclusions
A total of 54 groundwater samples were collected from Al-Madinah City, Western Saudi Arabia and their hydrochemical characteristics as well as quality were investigated. Various calculated water quality indices (WQI) showed that 87% of the samples were unsuitable for drinking purposes owing to their higher salinity levels and/or microbial contamination. Based on the obtained results of soluble salts, electrical conductivity (EC), and SAR, it was observed that only 3.7% of the water samples were fit for use in irrigation. Likewise, 18.5% of the water samples had slight to moderate salinity, while 77.8% of the water samples exhibited a higher salinity hazard. A total of 96.3% of the SAR values were < 10, indicating that the water was excellent for irrigation. On the other hand, 61% of the samples had a KR < 1, suggesting that the waters did not have any sodium hazard, whereas 39% of the samples had a KR > 1, indicating a higher sodium hazard. Contrarily, all of the samples exhibited a magnesium hazard value of more than 50, suggesting their suitability for irrigation. Based on NO3−, and boron (B) concentrations in the water samples, 75.9% of the samples had a slight to moderate degree of restriction for use in irrigation. The remaining samples were considered to be severely hazardous due to higher B contents. The Piper and Schoeller diagrams revealed that the main water types identified in the groundwater of Al-Madinah City were calcium–magnesium/sulfate–chloride and sodium–potassium/sulfate–chloride, whereas the Durov’s diagram showed that the groundwater samples fell in fields 4 and 5, suggesting the presence of Ca2+ and SO4−2 in the dominant water type. The results of the mineral saturation indices (SI) exhibited that most of the sampling sites were undersaturated with halite, hausmannite, jarosite-K, manganite, melanterite, pyrochroite, and pyrolusite. Therefore, it was concluded that 77.8% of water samples collected from Al-Madinah City were unsuitable for irrigation, whereas 87% were unsuitable for drinking purposes.
Author Contributions
Conceptualization, A.G.A. and F.N.A.-B.; methodology, A.A.A.; software, A.A.A.; validation, S.A.A. and A.G.A.; formal analysis, A.A.A.; investigation, A.A.A. and F.N.A.-B.; resources, A.G.A.; data curation, S.A.A.; writing and editing, A.G.A., A.A.A., S.A.A., and F.N.A.-B. All authors have read and agree to the published version of the manuscript.
Funding
This research was funded by [Deanship of Scientific Research at King Saud University] grant number [RG- 1440-089].
Acknowledgments
The authors extend their appreciation to the Deanship of Scientific Research at King Saud University for funding this work.
Conflicts of Interest
The authors declare no conflict of interest.
References
- Al-Omran, A.M.; Aly, A.A.; Al-Wabel, M.I.; Sallam, A.S.; Al-Shayaa, M.S. Hydrochemical Characterization of Groundwater under Agricultural Land in Arid Environment: A Case Study of Al-Kharj, Saudi Arabia. Arab. J. Geosci. 2016, 9, 68–85. [Google Scholar] [CrossRef]
- Fallatah, O.A. Groundwater Quality Patterns and Spatiotemporal Change in Depletion in the Regions of the Arabian Shield and Arabian Shelf. Arab. J. Sci. Eng. 2020, 45, 341–350. [Google Scholar] [CrossRef]
- Saud, A.G.; Abdullah, S.A. Water Resources and Reuse in Al-Madinah. In Proceedings of the International Conference on Water Conservation in Arid Regions (ICWCAR’09), Water Research Center-King Abdulaziz University, Jeddah, Saudi Arabia, 12–14 October 2009; pp. 12–14. [Google Scholar]
- Sharaf, M.A.M. Major elements hydrochemistry and groundwater quality of Wadi Fatimah, West Central Arabian Shield, Saudi Arabia. Arab. J. Geosci. 2013, 6, 2633–2653. [Google Scholar] [CrossRef]
- Al-Omran, A.M.; Aly, A.A.; Sallam, A.S. A Holistic Ecosystem Approach for the Sustainable Development of Fragile Agro-Ecosystems: A Case Study of the Al-Kharj Ecosystem, Saudi Arabia. National Science, Technology and Innovation Plan, Kingdom of Saudi Arabia. Available online: http://rp.ksu.edu.sa/sites/rp.ksu.edu.sa/files/res-files/Detailed%20Report%20(12%20month%20Kharj)5.pdf (accessed on 20 May 2019).
- Ledesma-Ruiz, R.; Pastén-Zapata, E.; Parra, R.; Harter, T.; Mahlknecht, J. Investigation of the geochemical evolution of groundwater under agricultural land: A case study in northeastern Mexico. J. Hydrol. 2015, 521, 410–423. [Google Scholar] [CrossRef]
- El-Sayed, M.H.; Abo El-Fadl, M.M.; Shawky, H.A. Impact of hydrochemical Processes on Groundwater Quality, Wadi Feiran, South Sinai, Egypt. Aust. J. Basic App. Sci. 2012, 6, 638–654. [Google Scholar]
- Matthess, G. The Properties of Groundwater; Wiley: New York, NY, USA, 1982; p. 498. [Google Scholar]
- Kumar, M.; Ramanathan, A.L.; Rao, M.S.; Kumar, B. Identification and evaluation of hydrogeochemical processes in the groundwater environment of Delhi, India. J. Environ. Geol. 2006, 50, 1025–1039. [Google Scholar] [CrossRef]
- Aly, A.A.; Gaber, H.M.; Kishk, F.M.; Al-Omran, A.M. Long-term detection and hydrochemistry of groundwater resources in Siwa Oasis, Egypt. J. Saudi Soc. Agric. Sci. 2016, 15, 67–74. [Google Scholar] [CrossRef]
- Lateef, K.H. Evaluation of Groundwater Quality for Drinking Purpose for Tikrit and Samarra Cities using Water Quality Index. Eur. J. Sci. Res. 2011, 58, 472–481. [Google Scholar]
- Stambuck-Giljanovic, N. Water quality evaluation by index in Dalmatia. Water Res. 1999, 33, 3426–3440. [Google Scholar] [CrossRef]
- Stigter, T.Y.; Ribeiro, L.; Carvalho Dill, A.M. Application of a groundwater quality index as an assessment and communication tool in agro-environmental policies–Two Portuguese case studies. J. Hydrol. 2006, 327, 578–591. [Google Scholar] [CrossRef]
- Saeedi, M.; Abessi, O.; Sharifi, F.; Meraji, H. Development of groundwater quality index. Environ. Monit. Assess. 2010, 163, 327–335. [Google Scholar] [CrossRef] [PubMed]
- Horton, R.K. An index number system for rating water quality. J. Water Poll. Cont. Fed. 1965, 37, 300–305. [Google Scholar]
- Miller, W.W.; Joung, H.M.; Mahannah, C.N.; Garrett, J.R. Identification of water quality differences in Nevada through index application. J. Environ. Qual. 1986, 15, 265–272. [Google Scholar] [CrossRef]
- Bordalo, A.A.; Nilsumranchit, W.; Chalermwat, K. Water quality and uses of the Bangpakonk River (Eastern Thailand). Water Res. 2001, 35, 3635–3642. [Google Scholar] [CrossRef]
- Yidana, S.M.; Yidana, A. Assessing water quality index and multivariate analysis. Environ. Earth Sci. 2010, 59, 1461–1473. [Google Scholar] [CrossRef]
- Aly, A. Hydrochemical characteristics of Egypt western desert oases groundwater. Arab. J. Geosci. 2015, 8, 51–7564. [Google Scholar] [CrossRef]
- Magesh, N.S.; Chandrasekar, N. Evaluation of spatial variations in groundwater quality by WQI and GIS technique: A case study of Virudunagar District, Tamil Nadu, India. Arab. J. Geosci. 2013, 6, 1883–1898. [Google Scholar] [CrossRef]
- Magesh, N.S.; Krishnakumar, S.; Chandrasekar, N.; John, P.S. Groundwater quality assessment using WQI and GIS techniques, Dindigul district, Tamil Nadu, India. Arab. J. Geosci. 2013, 6, 4179–4189. [Google Scholar] [CrossRef]
- Backman, B.; Bodis, D.; Lahermo, P.; Rapant, S.; Tarvainen, T. Application of a groundwater contamination index in Finland and Slovakia. Environ. Geol. 1998, 36, 55–64. [Google Scholar] [CrossRef]
- Ketata-Rokbani, M.; Gueddari, M.; Bouhlila, R. Use of Geographical Information System and Water Quality Index to Assess Groundwater Quality in El Khairat Deep aquifer (Enfidha, Tunisian Sahel). Iran. J. Energy Environ. 2011, 2, 133–144. [Google Scholar]
- Khashogji, M.S.; El Maghraby, M.M. Evaluation of groundwater resources for drinking and agricultural purposes, Abar Al Mashi area, south Al Madinah Al Munawarah City, Saudi Arabia. Arab. J. Geosci. 2013, 6, 3929–3942. [Google Scholar] [CrossRef]
- El Maghraby, M.M. Hydrogeochemical characterization of groundwater aquifer in Al-Madinah Al-Munawarah City, Saudi Arabia. Arab. J. Geosci. 2015, 8, 4191–4206. [Google Scholar] [CrossRef]
- Kingdom of Saudi Arabia. Population and Housing Census 1431 H (2010); Riyadh Ministry of Economics and Planning: Riyadh, Saudi Arabia, 2012.
- Matiti, S.K. Handbook of Methods in Environmental Studies: Water and Wastewater Analysis; ABD Publishers: Jaipur, India, 2004. [Google Scholar]
- Tabatabai, M.A. Methods of Soil Analysis. Part 3. Chemical Methods; Sparks, D.L., Page, A.L., Helmke, P.A., Loeppert, R.H., Eds.; SSSA Book Ser. 5; ASA/SSSA: Madison, WI, USA, 1996; pp. 921–960. [Google Scholar]
- APHA. Standard Methods for the Examination of Water and Wastewater, 20th ed.; American Public Health Association: Washington, DC, USA, 1998. [Google Scholar]
- Bingham, F.T. Boron, Methods of Soil Analysis. Part 2. Chemical and Microbiological Properties; Agronomy Monograph; SSSA: Madison, WI, USA, 1982; pp. 431–447. [Google Scholar]
- Critelli, T.; Vespasiano, G.; Apollaro, C.; Muto, F.; Marini, L.; De Rosa, R. Hydrogeochemical study of an ophiolitic aquifer: A case study of Lago (Southern Italy, Calabria). Environ. Earth Sci. 2015, 74, 533–543. [Google Scholar] [CrossRef]
- Edberg, S.C.; Allen, M.J.; Smith, D.B. Defined substrate technology method for rapid and specific simultaneous enumeration of total coliforms and Escherichia coli from water: Collaborative study. J. Assoc. Off. Anal. Chem. 1991, 74, 526–529. [Google Scholar]
- Fricker, E.J.; Illingworth, K.S.; Fricker, C.R. Use of two formulations of colilert and quantitray(™) for assessment of the bacteriological quality of water. Water Res. 1997, 31, 2495–2499. [Google Scholar] [CrossRef]
- Eckner, K.F. Comparison of membrane filtration and multiple-tube fermentation by the Colilert and Enterolert methods for detection of waterborne coliform bacteria, Escherchia coli, and enterococci used in drinking and bating water quality monitoring in Southern Sweden. Appl. Environ. Microbiol. 1998, 64, 3079–3083. [Google Scholar] [CrossRef]
- Maheux, A.F.; Huppé, V.; Boissinot, M.; Picard, F.J.; Bissonnette, L.; Bernier, J.L.; Bergeron, M.G. Analytical limits of four beta-glucuronidase and beta-galactosidase-based commercial culture methods used to detect Escherichia coli and total coliforms. J. Microbiol. Methods 2008, 75, 506–514. [Google Scholar] [CrossRef]
- Aly, A.A.; Al-Omran, A.M.; Alharby, M.M. The water quality index and hydrochemical characterization of groundwater resources in Hafar Albatin, Saudi Arabia. Arab. J. Geosci. 2015, 8, 4177–4190. [Google Scholar] [CrossRef]
- Ramakrishnalah, C.R.; Sadashivalah, C.; Ranganna, G. Assessment of water quality index for the groundwater in Tumkur Taluk, Karnataka state, India. E-J. Chemistry. 2009, 6, 523–530. [Google Scholar] [CrossRef]
- WHO. Guidelines for Drinking-Water Quality, 4th ed.; World Health Organization: Geneva, Switzerland, 2011. [Google Scholar]
- Piper, A.M. A graphic procedure in the geochemical interpretation of water analysis. Trans. Am. Geophys. Union 1944, 25, 914–928. [Google Scholar] [CrossRef]
- Schoeller, H. Géochimie des Eaux Souterraines. Aplication aux Eaux des Gisements de Pétrole; Inst. Français duPétrole: Paris, France, 1955. [Google Scholar]
- Parkhurst, D.L.; Appelo, C.A.J. User’s guide to PHREEQC (version 2)-A computer program for speciation, batch-reaction, one-dimensional transport, and inverse geochemical calculations. Geol. Surv. Water-Res. Investig. Rep. 1999, 99, 312. [Google Scholar]
- Alexakis, D. Assessment of water quality in the Messolonghi-Etoliko and Neochorio region (West Greece) using hydrochemical and statistical analysis methods. Environ. Monit. Assess. 2011, 182, 397–413. [Google Scholar] [CrossRef]
- Al-Makishah, N.H. Microbial Screening of Groundwater and Surface Water in Agricultural Region Surrounding Al-Madina Al-Monawara. J. King Abdulaziz Univ. Meteorol. Environ. Arid Land Agric. Sci. 2018, 27, 125–137. [Google Scholar] [CrossRef]
- WHO. Calcium and Magnesium in Drinking-Water Public Health Significance; World Health Organization: Geneva, Switzerland, 2009. [Google Scholar]
- Deshpande, S.M.; Aher, K.R. Evaluation of Groundwater Quality and its Suitability for Drinking and Agriculture use in Parts of Vaijapur, District Aurangabad, MS, India. Res. J. Chem. Sci. 2012, 2, 25–31. [Google Scholar]
- Ayers, R.S.; Westcot, D.W. Water Quality for Agriculture; Irrigation and Drainage Paper 29 (rev.1); FAO: Rome, Italy, 1985. [Google Scholar]
- Nagaraju, A.; Sunil Kumar, K.; Thejaswi, A. Assessment of groundwater quality for irrigation: A case study from Bandalamottu lead mining area, Guntur District, Andhra Pradesh, South India. Appl. Water Sci. 2014, 4, 385–396. [Google Scholar] [CrossRef]
- Todd, D.K.; Mays, L.W. Groundwater Hydrology, 3rd ed.; Wiley: Hoboken, NJ, USA, 2005; p. 656. [Google Scholar]
- Richards, L.A. (Ed.) Diagnosis and Improvement of Saline and Alkali Soils; USDA Hand Book. No. 60; US Govt. Press: Washington, DC, USA, 1954; p. 160.
- Kelly, W.P. In Proceedings of the A.S.C.F. 1940, p. 607. Available online: https://www.cabdirect.org/cabdirect/abstract/19411900188 (accessed on 15 June 2019).
- Eaton, F.M. Significance of carbonates in irrigation waters. Soil Sci. 1950, 69, 123–133. [Google Scholar] [CrossRef]
- Szabolcs, I.; Darab, C. The influence of irrigation water of high sodium carbonate content of soils. Proc. Int. Congr. Trans. 1964, 2, 803–812. [Google Scholar]
- Tiwari, A.K.; Singh, A.K. Hydrogeochemical investigation and groundwater quality assessment of Pratapgarh district, Uttar Pradesh. J. Geol. Soc. India 2014, 83, 329–343. [Google Scholar] [CrossRef]
- Nasher, G.; Al-Sayyaghi, A.; Al-Matary, A. Identification and evaluation of the hydrogeochemical processes of the lower part of Wadi Siham catchment area, Tihama plain, Yemen. Arab. J. Geosci. 2013, 6, 2131–2146. [Google Scholar] [CrossRef]
- Apollaro, C.; Fuoco, I.; Brozzo, G.; De Rosa, R. Release and fate of Cr (VI) in the ophiolitic aquifers of Italy: The role of Fe (III) as a potential oxidant of Cr (III) supported by reaction path modelling. Sci. Total Environ. 2019, 660, 1459–1471. [Google Scholar] [CrossRef]
- Vespasiano, G.; Apollaro, C.; De Rosa, R.; Muto, F.; Larosa, S.; Fiebig, J.; Mulch, A.; Marini, L. The Small Spring Method (SSM) for the definition of stable isotope-elevation relationships in Northern Calabria (Southern Italy). Appl. Geochem. 2015, 63, 333–346. [Google Scholar] [CrossRef]
- Aly, A.A.; Abbas, A.A.; Benaabidate, L. Hydrochemistry and Quality of Groundwater Resources in Egypt: Case Study of the Egyptian Southern Oases. In Water Security in the Mediterranean Region; Springer: Dordrecht, The Netherlands, 2011; pp. 239–254. [Google Scholar]
- Al-Barakah, F.N.; Gassas, A.M.; Aly, A.A. Water Quality Assessment and Hydrochemical Characterization of Zamzam Groundwater, Saudi Arabia. Appl. Water Sci. 2017, 7, 3985–3996. [Google Scholar] [CrossRef]
© 2020 by the authors. Licensee MDPI, Basel, Switzerland. This article is an open access article distributed under the terms and conditions of the Creative Commons Attribution (CC BY) license (http://creativecommons.org/licenses/by/4.0/).