You are currently viewing a new version of our website. To view the old version click .
Sustainability
  • Article
  • Open Access

10 April 2020

Detecting the Influencer on Social Networks Using Passion Point and Measures of Information Propagation  †

,
,
,
and
1
Faculty of Information Technology, Ton Duc Thang University, Ho Chi Minh City 700000, Vietnam
2
Kyanon Digital, Ho Chi Minh City 700000, Vietnam
3
Faculty of Computer Science, University of Information Technology, Ho Chi Minh City 700000, Vietnam
4
Vietnam National University, Ho Chi Minh City (VNU-HCM), Quarter 6, Thu Duc District, Ho Chi Minh City 700000, Vietnam
This article belongs to the Special Issue Problems of Selected Industries on the Way to Suitable Development

Abstract

Influencer marketing is a modern method that uses influential users to approach goal customers easily and quickly. An online social network is a useful platform to detect the most effective influencer for a brand. Thus, we have an issue: how can we extract user data to determine an influencer? In this paper, a model for representing a social network based on users, tags, and the relationships among them, called the SNet model, is presented. A graph-based approach for computing the impact of users and the speed of information propagation, and measuring the favorite brand of a user and sharing the similar brand characteristics, called a passion point, is proposed. Therefore, we consider two main influential measures, including the extent of the influence on other people by the relationships between users and the concern to user’s tags, and the tag propagation through social pulse on the social network. Based on these, the problem of determining the influencer of a specific brand on a social network is solved. The results of this method are used to run the influencer marketing strategy in practice and have obtained positive results.

1. Introduction

Online social networks are an efficient tool for spreading information. They have been proven to be very powerful in many situations—e.g., Facebook and Twitter during the 2008 U.S. presidential elections [1]—and in digital marketing. Researchers have recently focused on modeling, visualizing, tracking, and predicting information diffusion to better understand the dynamics of social networks [2,3,4]. Using this understanding, other issues—such as analyzing revolutionary waves, optimizing social marketing campaigns, and anticipating and handling the information diffusion in the future—can be resolved better.
Twitter is a social networking site where people communicate in short messages called tweets. Anyone who follows you on Twitter can see any short message posted by you [5]. The determining of influencers on Twitter has many applications; for example, it can be used for political sciences, human mobility, and transportation [6].
The identification of the influencer for a brand plays a vital role in influencer marketing. There are many understandings of what an influencer is. The definition of an influential user involves proposed criteria of influence. Influential users may be leaders [7], authoritative actors [8], or prestigious [9] or topical experts on specific domains [10]. All of these can affect other people. They can even create trends. On social networks, an influential user is similar, but it is in the virtual world, such as a leader of a country, CEO, singer, artist, actor, actress, director, journalist, and so on. They can attract other people and receive many interactions from users via several systems. Information from him/her obtains fast propagation on the social network. Hence, the influencer makes a brand, approaching goal customers easily and quickly.
Detecting the influencer on social networks benefits the brand. Some critical psychological factors affect attitudes towards purchasing online [11]. These factors are elements in overall studies of online behavior. The influencer is a factor that impacts the behavior of shopping online.
In this paper, a model for representing a social network is presented, called the SNet model. It includes two main objects: users and tags. This model can represent the relationship between these objects. The method for the computing of the passion point is proposed by combining the number of positive posts created about the specific brand, the average number of interactions per post, and the number of active days of the user. The passion point is used to determine the community that interests the brand/product/news.
Some measures of influence on the social network are proposed based on the structure of the SNet model. They represent the ability to impact other people by the relationships between users and the concern to the user’s tags. The measure of information propagation through social pulse has been studied. The problem of determining the influencer of a specific brand/product/news on an online social network is solved by using these measures. Firstly, from the global network to a brand, a product, or a piece of news, we create a sub-graph that presents the community that loves the brand and the information diffusion among users in that community. After that, based on the influence measures proposed, we determine the user, leading to an effect on people in the community structure.
The next section presents related works for detecting the influencer on the social network. Section 3 constructs a model for representing relations on a social network. Section 4 proposes some measures of influence for a user, based on information propagation. Section 5 presents a formula to evaluate the user’s passion point with a brand or product. The structure of a community loving a brand is established based on the passion point. The process and algorithms to determine the influencer on a social network are also presented in this section. Section 6 shows the experimental results in reality based on the proposed method. The last section concludes the paper and presents some future works.

3. Model for Representing Relations on Social Networks

There are two main kinds of objects on a social network: users and the tags posted by users. A tag may be a post, image, or clip. Some conditions of research relations on a social network are as follows:
  • Tags in this paper are text-based posts only.
  • All users on the social network understand the meaning of a tag.
In this paper, some symbols are used:
  • TIME is the data type as the timestamp.
  • #(A) is the number of elements in set A.
Definition 1.
The model for representing relations on a social network, called SNet, includes three components:
(U, T, R)
where U is a set of users on a social network and T is a set of tags on a social network. A user can have many tags, and a tag can be related to many users. R is a set of relations on a social network.

3.1. U–Set of Users on a Social Network

U is a set of users on a social network. Each user is a tube of five elements:
(Profile, ListTags, ListFriends, ListFollowers)
  • Profile: includes the personal information of a user, such as ID, name, DOB, and phone number.
  • ListTags = [t1,…,tn]: list of tags ti in T-set, which are related to the corresponding user (i = 1…n).
  • ListFriends = [f1,…,fm]: list of other users fj in U-set, which are friends with the corresponding user (j = 1…m).
  • ListFollowers = [l1,…,lp]: list of other users lk in U-set, which are followers of the corresponding user (k = 1…p).
(Relations friends and followers are defined in Section 3.3).

3.2. T–Set of Tags on a Social Network

T is a set of tags on a social network. Each tag is a tube of seven elements:
(Content, Owner, Mention, τ, Interaction, Sh, Com)
  • Content: describes the content of the tag.
  • OwnerU: this is the user as the seeder of the corresponding tag.
  • Mention: list of users mentioned in the tag.
  • τ ∈ Time: a timestamp of the corresponding tag.
  • Interaction: is a set of users who interacted with the corresponding tag.
    • Interaction: = {(u, πu) ∈ U × Time | interact(u, *this), *this is the corresponding tag,
    • πu ∈ Time is the timestamp of the interaction corresponding tag of user u}
  • Sh is a set of users who shared the corresponding tag.
    • Sh: = {(u, πu) ∈ U × Time | share(u, *this), *this is the corresponding tag,
    • πu ∈ Time is the timestamp of the corresponding sharing tag of user u}
  • Com is a set of users who have comments on the corresponding tag.
    • Com: = {(u, πu) ∈ U × Time | comment(u, *this), *this is the corresponding tag,
    •    πu ∈ Time is the timestamp of the comment of user u}
(Relations interact, share, and comment are defined in Section 3.3).

3.3. R–Set of Relations on a Social Network

R is a set of binary relations on a social network. There are two kinds of relations:
R = RURT
  • RU: a set of relations between two users.
  • RT: a set of relations between a user and a tag.
The detailed relations are shown in Table 1:
Table 1. Relations on a social network.

4. Measures of Influence for a User

In this section, the measures of influence for a user on a social network as the SNet model are proposed. They include the vector representing the ability of the influence on other people by the relationships between users and the concern to the user’s tags. Besides this, they also include the speed of the user’s tag propagation on the social network.

4.1. Influential Vector of a User

Given a user uU, there are some metrics on the user u:
• SI(u): sharing the impact of the user u. It measures the impact of the user’s post in terms of the shared tags.
S I ( u ) = α 1 . # ( S U 1 ( u ) ) + α 2 . # ( S U 2 ( u ) ) + α 3 . # ( S U 3 ( u ) ) # ( u . L i s t F r i e n d s ) + # ( u . L i s t F o l l o w e r s )  
where S U ( u ) : = t u . L i s t a g s t . S h : a set of users sharing u’s tags.
SU1(u):={v | vSU(u) and friend(u, v) }: set of users sharing u’s tags and those users are friends of user u.
SU2(u):={v | vSU(u) and follower(v, u) }: set of users sharing u’s tags and those users are followers of user u.
SU3(u):= SU(u) \ (SU1(u) ∪ SU2(u)): set of users sharing u’s tags, and those users are not related to user u.
α1, α2, α3: are weighted numbers, 0 < α1 ≤ α2 ≤ α3 < 1.
When a user shares a tag, it means he/she was interested in this tag. A friend is more interested in the post than a follower, and an unrelated user is only interested in the post if this post is very exciting [23]. Therefore, the weight for the sharing of followers is higher than the weight for the sharing of friends, and the weight for the sharing of unrelated users is higher than the weights for the sharing of friends and followers. Thus, we have α1 ≤ α2 ≤ α3. These weighted numbers can be determined based on the characteristic of a social network.
• CI(u): comment impact of the user u. It measures the impact of comments on u’s tags.
C I ( u ) = β 1 . # ( C U 1 ( u ) ) + β 2 . # ( C U 2 ( u ) ) + β 3 . # ( C U 3 ( u ) ) # ( u . L i s t F r i e n d s ) + # ( u . L i s t F o l l o w e r s )
where C U ( u ) : = t u . L i s t a g s t . C o m   : a set of users having comments on u’s tags.
CU1(u):={v | vSU(u) and friend(u, v) }: set of users having comments on u’s tags and those users are friends of user u.
CU2(u):={v | vSU(u) and follower(v, u) }: set of users having comments on u’s tags and those users are followers of user u.
CU3(u):= CU(u) \ (CU1(u) ∪ CU2(u)): set of users having comments on u’s tags and those users are not related to user u.
β1, β2, β3: are weighted numbers, 0 < β1β2β3 < 1. These weighted numbers can be determined based on the characteristic of a social network.
• Ir(u): interactor ratio for the tag of the user u.
I r ( u ) = γ 1 . # ( I 1 ( u ) ) + γ 2 . # ( I 2 ( u ) ) + γ 3 . # ( I 3 ( u ) ) # ( u . L i s t F r i e n d s ) + # ( u . L i s t F o l l o w e r s )
where I ( u ) : = t u . L i s t a g s t . I n t e r a c t i o n   : a set of users interacting on u’s tags.
I1(u):= {v | vI(u) and friend(u, v) }: a set of users interacting on u’s tags, and those users are friends of user u.
I2(u):= {v | vI(u) and follower(v, u) }: a set of users interacting on u’s tags, and those users are followers of user u.
I3(u):= I(u) \ (I1(u) ∪ I2(u)): a set of users interacting on u’s tags, and those users are not related to user u.
γ1, γ2, γ3: are weighted numbers, 0 < γ1γ2γ3 < 1. These weighted numbers can be determined based on the characteristic of a social network.
• Popularity (u):
Most social networks are scale-free networks [24]. A scale-free network is a network whose degree distribution follows a power law, so the number of nodes in the network that have k connections, denoted P(k), goes for large values of k as P(k) = k γ, where γ is a constant number (2 < γ < 3) [25]. Hence, in the social network, a popularity measure of a user can be calculated based on the number of in-links of the users as follows [25]:
P o p u l a r i t y ( u ) = 1 e λ . # ( F )
where F:= u.ListFriends,u.ListFollowers, and λ: is a constant.
Definition 2. (Influence of user).
Given a user uU, the measure of influence for the user u is represented by the vector:
IU(u) = (Impress(u), Popularity(u))
where impress
( u ) = α . S I ( u ) + β . C I ( u ) + γ I r ( u ) α + β + γ
SI(u), CI(u), Ir(u) are computed by Formulas (1), (2), and (3), respectively.
α,β, and γ: are weighted numbers.
Impress(u) is the average of the impact of sharing, commenting, and interacting of user u. In this paper, we assume that: when a user shares a post, he/she thought this post was useful to others; when a user comments on a post, he/she thought about it; when a user likes a post, it may be a habit of the user [23]. Thus, we have 0 <γβα < 1.

4.2. Information Propagation

Definition 3. 
(Social pulse [20]). Given a tag t ∈ T, the time window δ.
(a) A set of users who are engaging in the corresponding tag t of user u in the time window δ.
I t u ( δ ) = { v U | ( v , π v ) U × TIME , v ( t . I n t e r a c t i o n t . S h t . C o m ) , v u ,   π v [ t . τ , t . τ + δ ] }
where πv is the timestamp for the interacting, sharing, or commenting of user v to the corresponding tag t.
(b) The social pulse for the tag t in the time window δ is the value:
P t ( δ ) = v t . S h # ( I t v ( δ ) )
Definition 4. (Average of Interactions).
Let u ∈ U be a user; the average of interactions for each tag of user u in the time window δ is computed by:
A I u ( δ ) = t u . L i s t T a g s P t ( δ ) # ( u . L i s t T a g s )  
Each user has two main influent measures: IU(u) = (Impress(u), and Popularity(u)) (Definition 2). The value of Impress(u) represents the average of the impact of the interacting of the user u. This value shows the impact of the user u to other users. Thus, when making the comparison of the influence between two users, this value is the priority. For detecting an influencer in the time window δ, the average value of interactions needs to be used in the ordering. In Definition 5, we remind the lexical order between two 2D-vectors, and this order is used to compare the influence between two users in Definition 6.
Definition 5. (The lexical order between two 2D-vectors).
Let ∘ be a set of real value, and vectors a = (a1, a2) ∈ ∘2, and b = (b1, b2) ∈ ∘2. Define:
a b [ a 1 < b 1 a 1 = b 1   and   a 2 b 2
Definition 6. (influential user/influencer).
Given a social network F = (U, T, R) as SNet model, the time windowδ.
(a) 
Let u, vU be users on F. The user u is more influent than the user v in the time windowδ, denoted v << u, if:
ii 
IU(v) ≤ IU(u) and A I v ( δ ) A I u ( δ )
iii 
or ( P o p u l a r i t y ( v ) , A I v ( δ ) ) ( P o p u l a r i t y ( u ) , A I u ( δ ) )
(b) 
Let G ⊆ U, a user w ∈ G is an influencer on F in the time window δ if:
#({v ∈ G | v << w}) ≥μ × #(G)
where μ is a constant, 0 <μ < 1.

5. Determine the Influencer on a Social Network

Community structure has been shown to affect information diffusion [3]. There are two main phenomena of community structure, including homophily and social reinforcement. Homophily denotes a group of users that share similar characteristics. Social reinforcement means that the behavior of one person p can lead to effects on other people who have close relationships with p. In this section, based on a given brand, product, or news, we determine a user that can lead to effects on other people who have close relationships with the user.

5.1. The Graph for Connections between Users

Based on the SNet model, a graph representing the connections between users is a tube (V, E); in which, V is a set of vertexes, and E is a set of edges. A vertex viV in the graph denotes user i, and an edge eijE from node i to node j denotes that there is a relationship between users i and j. Each edge has a weight that is computed as the following definition:
Definition 7.
Given a social network F = (U, T, R) as the SNet model, and a graph (V, E) represents the connections between users on network F, the weight of each edge e ∈ E, denoted w(e), is computed as followed:
  • If follower (vi, vj), then w(eij) = 1.
  • If friends (vi, vj), then w(eij) = w(eij) = 2.
  • If interacted (vi, t), then w(eik) += 1 with vk = t.Owner
  • For each relation comment (vi, t), w(eik) += 2 with vk = t.Owner
  • If shared (vi, t), then w(eik) += 1 with vk = t.Owner.
Figure 1 shows an example of the graph representing the connections between users on the network F.
Figure 1. The graph for representation connections between users.

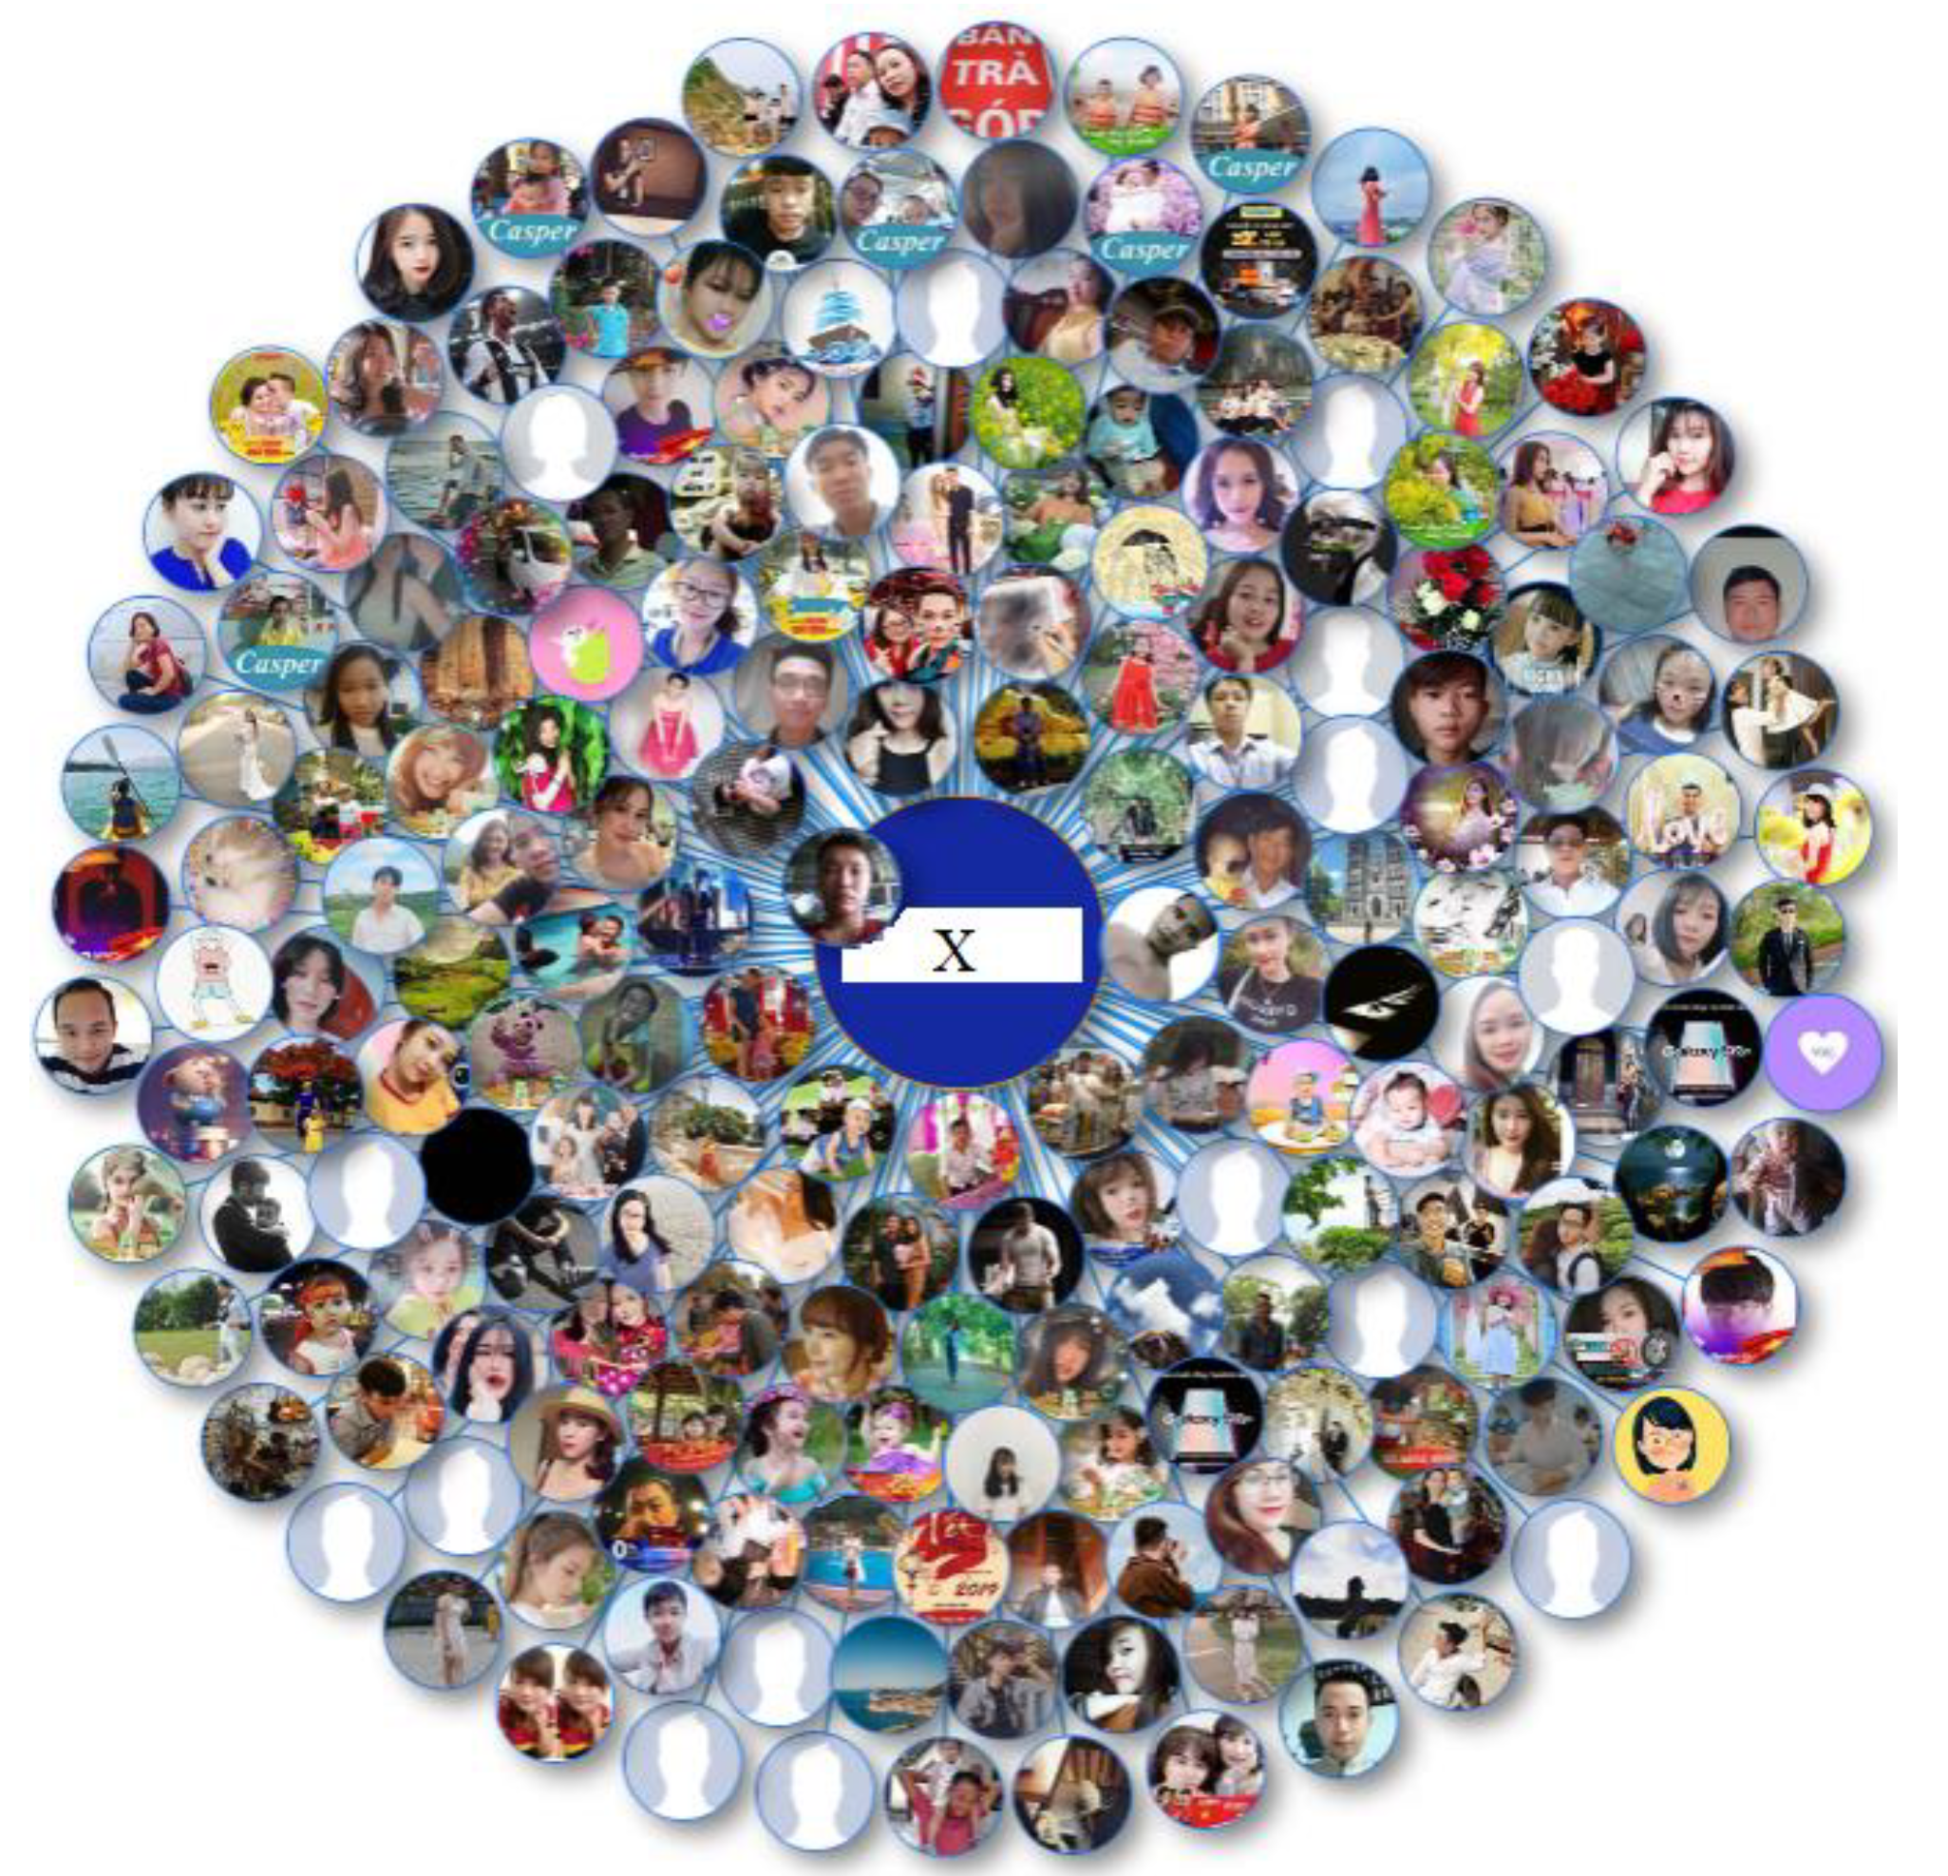
5.2. Creating Graphs for Specific Brands/Products/News

For a given brand, product, or news, we extracted a corresponding sub-graph based on the graph representing connections between users. This sub-graph helped us to detect homophily, which is a group of users loving the brand and sharing similar characteristics about brands/products/news.

5.2.1. Passion Point

The passion point measures the favorite of a user with a brand/product/news (called brand in short). It is computed based on the following inputs: total number of the user’s tags, the total number of positive tags about the specific brand that were created by the user, the number of the user’s active days, and the average of interactions with the users per post. The passion point is the foundation to build the homophily that loves the brand.
With given observation, the confidence interval for the actual probability of posting a positive post from an influencer is a range of possible proportions, which may or may not contain the exact proportion. There are many methods to analyze the sentiment of a tag, such as using an ensemble of classifiers. In [26], the ensemble schema is based on three classifiers: Naïve Bayes, Maximum Entropy learner, and a knowledge-based tool performing an in-depth analysis of the natural language sentences.
The model of a binomial distribution is B(n, p), where n is the number of successes, and p is the success probability for each trial. The value of p is unknown, but the range of p can be calculated, in which it is also called the binomial proportion confidence interval. There are several methods to calculate the confidence interval for binomial proportion; however, Wilson score interval methods are the most accurate and the most robust [27]. When the actual coverage probability is closer to the nominal value, the Wilson score interval improves the regular approximation interval.
Definition 8.
([28]). Formula of Wilson confidence interval:
ρ + z 2 2 n 1 + z 2 n ± z 1 + z 2 n ρ ( 1 ρ ) n + z 2 4 n 2
where n: the number of experiments,
nS: the number of successes,
ρ = n S n :   the   binomial   proportion
and z is the quantile of a standard normal distribution.
The confidence interval is a range of possible proportions (positive rate). The range is broad if the sample size is small, and vice versa. Besides ranking the score of a specific person based on the positive rate, the model helps to capture the effect of lacking evidence at the time of ranking; therefore, the lower bound of the confidence interval is chosen as a ranking score of the passion point.
When the number of tags increases, the positive rate also increases. This is a result of the choices of influencers by the brand. The influencer was paid more by trending brands to post more positive posts about them. The average number of likes per post is also an indicator of the latent variables that represent how well that person polishes his/her image in social media to attract their fan-based community. To take the effects of this phenomenon into account, we modeled the ranking score based on linear regression.
Definition 9. (Passion point).
Given a user uU, and the brand X.
(a) The ranking score for the user u with the brand X:
ranking _ score u ( X ) : = ρ + z 2 2 n u 1 + z 2 n u z 1 + z 2 n u ρ ( 1 ρ ) n u + z 2 4 n u 2
where nu = #(u.ListTags),
n X = # ( { t X u . L i s t T a g s | t X   is   a   positive   tag   with   the   brand   X } )
ρ = n X n u :   the   binomial   proportion
z: the quantile of a standard normal distribution.
(b) The passion point of user u with brand X is computed by:
PPu(X):= ranking_scoreu(X) + log(#(u.ListTags)) + log(Impress(u))
where Impress(u) is computed by Formula (6).

5.2.2. Graphs for Specific Brands/Products/News

In this section, the Algorithm 1 for creating a sub-graph representing the connection between brand-loving users is presented.
Algorithm 1: Creating a sub-graph representing the connection between brand-loving users.
   Input: A social network F = (U, T, R) as the SNet model.
      Graph G is represents the connections between users.
      A specific brand/product/news X.
   Output: Extract a sub-graph of users engaging with brand X.
The process of creating sub-graphs is as follows:
Step 1: Traverse each node v in Graph G.
  Let ω > 0 be a constant, showing the minimum passion point of a user with brand X.
  Check v.ListTags to see whether the corresponding user mentioned brand X in the tags.
   If PPv(X) ≥ ω, with PPv(X) is computed by Formula (13).
     Insert the node v into the sub-graph and go to Step 2;
   Otherwise, go to Step 3.
Step 2: Expand the search space to the node’s neighbors.
  Insert edges between the current node and its neighbors into the sub-graph if:
   (1) the neighbors also mentioned brand/product/news X, or
   (2) the neighbors interact or have comments on the tags of the current node related to X.
  In Case (1): if the current user posts the tag t related to the product/brand/news, which is shared from another user y = t.Owner, create an edge between the current user and the user y.
  Update the edge’s weight, as shown Definition 7.
Step 3: If there are untraversed nodes in the network, go back to Step 1.

5.3. Determine the Influencer on a Social Network

For a given brand, product, or news, we determined that the influencer on the social network can propagate this specific brand/product/news in the determined time to the most goal audiences as a seeder. The process for determining the influencer is as follows:
Given a social network F = (U, T, R) as SNet model, a specific brand/product/news is X. The Algorithm 2 determines the most influential user to other people on F with the brand X in the time window δ.
Algorithm 2: Determine the most influential user
Stage 1: Determine a group of users who are interested in brand X.
  Step 1: Create Graph G, as shown in Definition 7, representing connections between users on the social network.
  Step 2: Create a sub-graph of G by the algorithm in Section 5.3 to determine a group of users who are interested in brand X.
  This group is denoted GX.
Stage 2: Determine the most influential user to other people in the time window δ.
  Step 3: With each uGX, compute the influence measures of the user u.
   • Influence vector IU(u):= (Impress(u), Popularity(u)) as Formula (5) in Definition 2.
   • The average of the interaction of u’s tags AIu(δ) is computed by Formula (9).
  Step 4: Determine the set of influencers in GX as Definition 6.
   S:= { };
   for w in GX do
   {
   Sw(δ):= {vGX | v << u}, with the relation “<<” is defined in Definition 6.
   If #(Sw(δ)) ≥ μ × #(G) then
   S: = S ∪ {w};
   }
ReturnS is a set of influencers in GX.

6. Testing and Experimental Results

Our influence measures of a user were applied to detect an influencer for marketing a brand or product. Our method has been applied to 10 brands of three customers in practice. In this section, we present the application to determine influencers of one product. We also present the results about the voice of information related to that product on the social network when our customers ran the influencer marketing strategy based on our determined influential users.

6.1. Testing

In this section, because of the secret of the business, we call the brand X, and the time window δ is seven days. Our program is set up by JSON [29]. In this testing, we only mention Vietnamese users on Facebook. Determining the influencer of product X on Vietnamese users of Facebook is processed through two stages, as shown in Section 5.3.
Stage 1: Based on the information of X, a part of the sub-graph represents a group of users, called GX, who are interested in X, as shown in Figure 2:
Figure 2. Sub-graph presents a group of users who are interested in product X.
Stage 2: Through this group, we continued to determine whether the user could be the influencer for the brand X in the time window δ = 7 days, as shown in Table 2. In this stage, the values of coefficients in the formulas were chosen as follows:
Table 2. Comparing the number of interactions related to product X in October, 2018, September, 2018, and November, 2018.
  • The values of (α1, α2, α3) in Formula (1), (β1, β2, β3) in Formula (2), and (γ1, γ2, γ3) in Formula (3) were chosen by the assumption that: the weight of a follower’s interaction was higher than a friend’s, and the weight of an unrelated user’s interaction was higher than other users. Despite the opinions from the experts and managers in online marketing, the values of parameters in formulas were chosen as follows:
    α1 = 0.25  α2 = 0.5  α3 = 0.75
    β1 = 0.25  β2 = 0.5  β3 = 0.75
    γ1 = 0.25  γ2 = 0.5  γ3 = 0.75
  • The values of (α, β, γ) in Formula (6) are α = β = γ = 0.5.
  • The value of μ in Formula (12) is 0.8, which means a user is an emerging influencer if he/she is more influential than 80% of users in the group GX.
The list of emerging users for the influencer is shown in Figure 3. Our customers can select some influencers from this list to make their marketing plan for product X.
Figure 3. List of emerging users for the influencer.

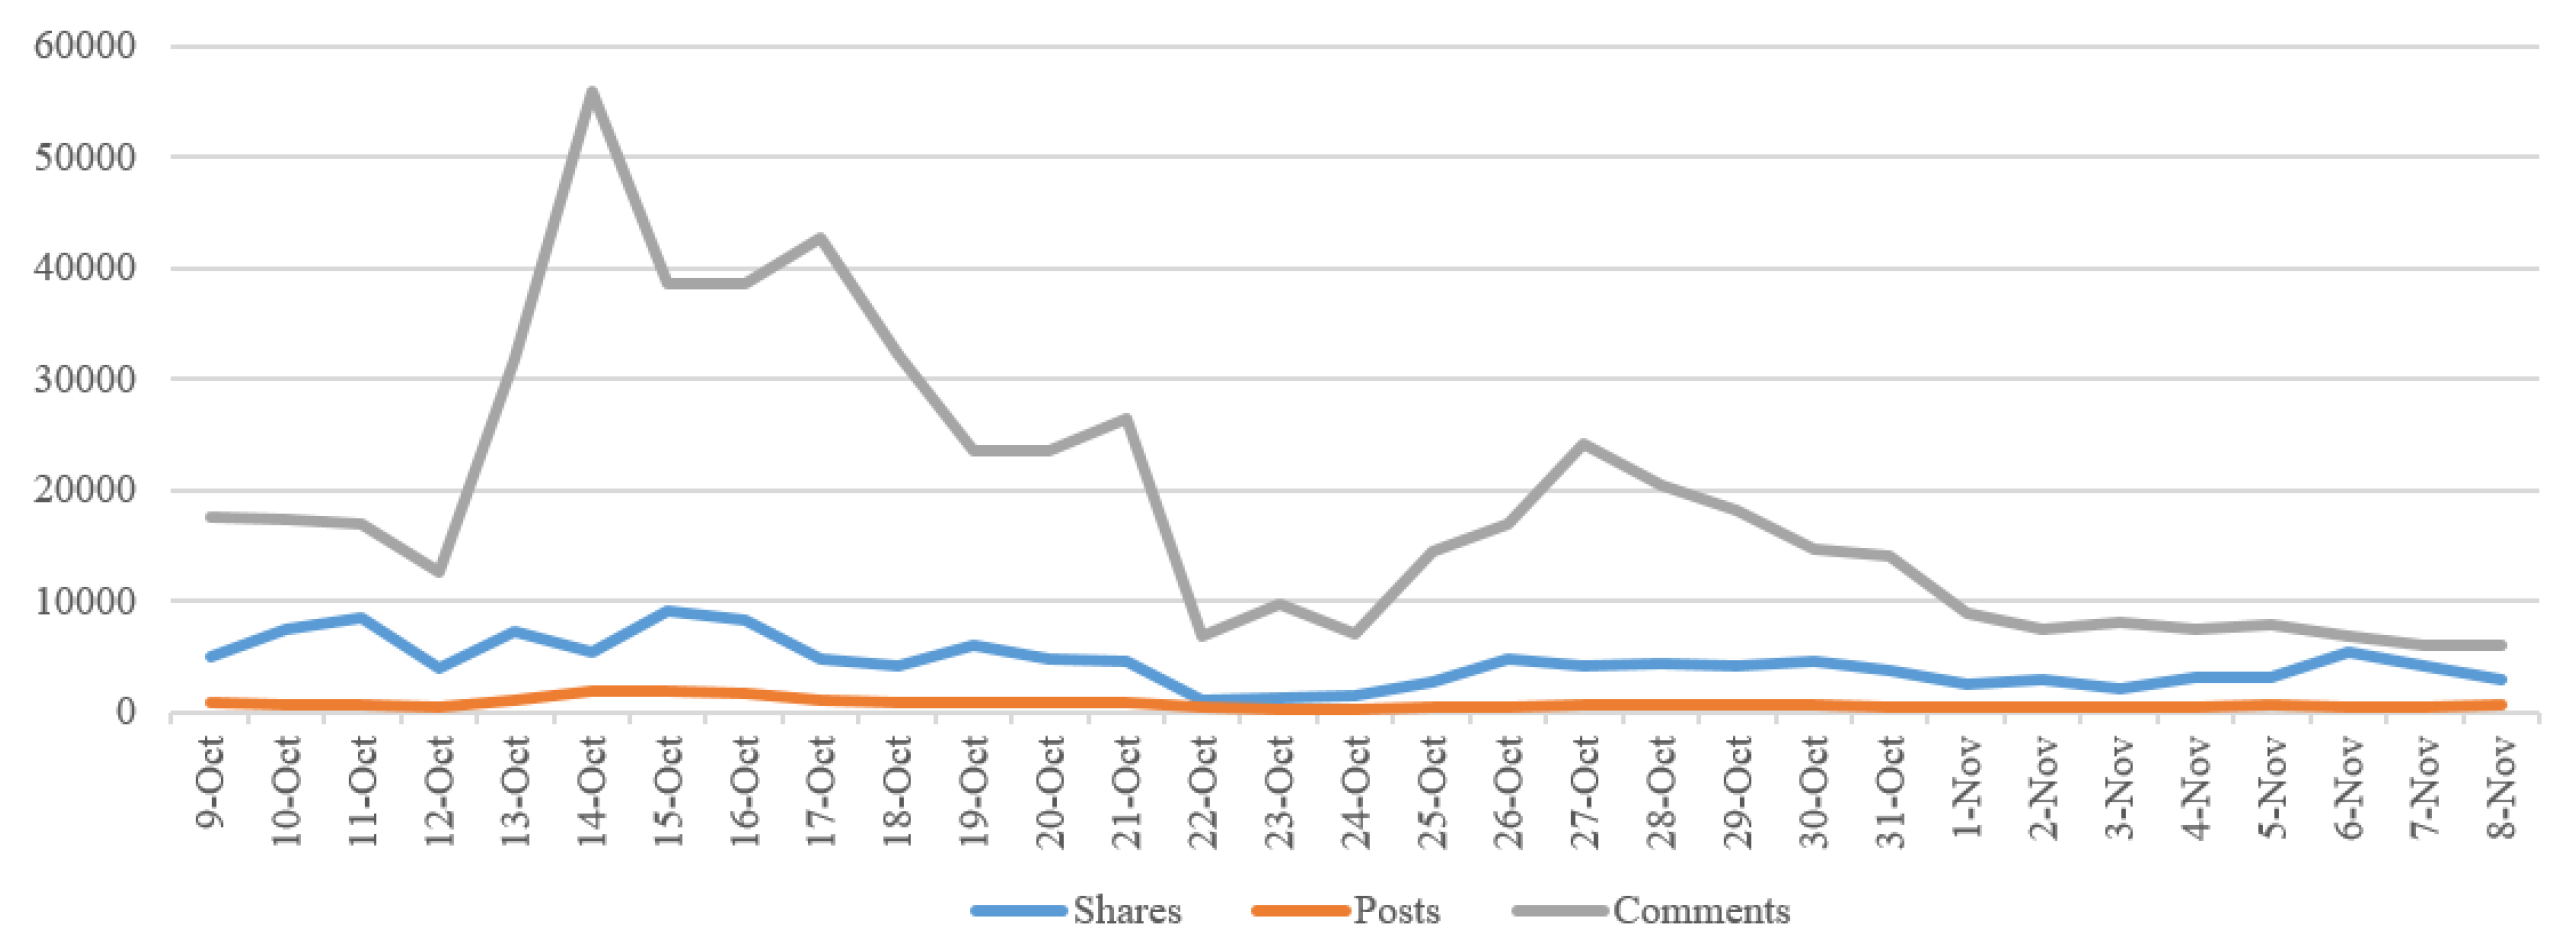
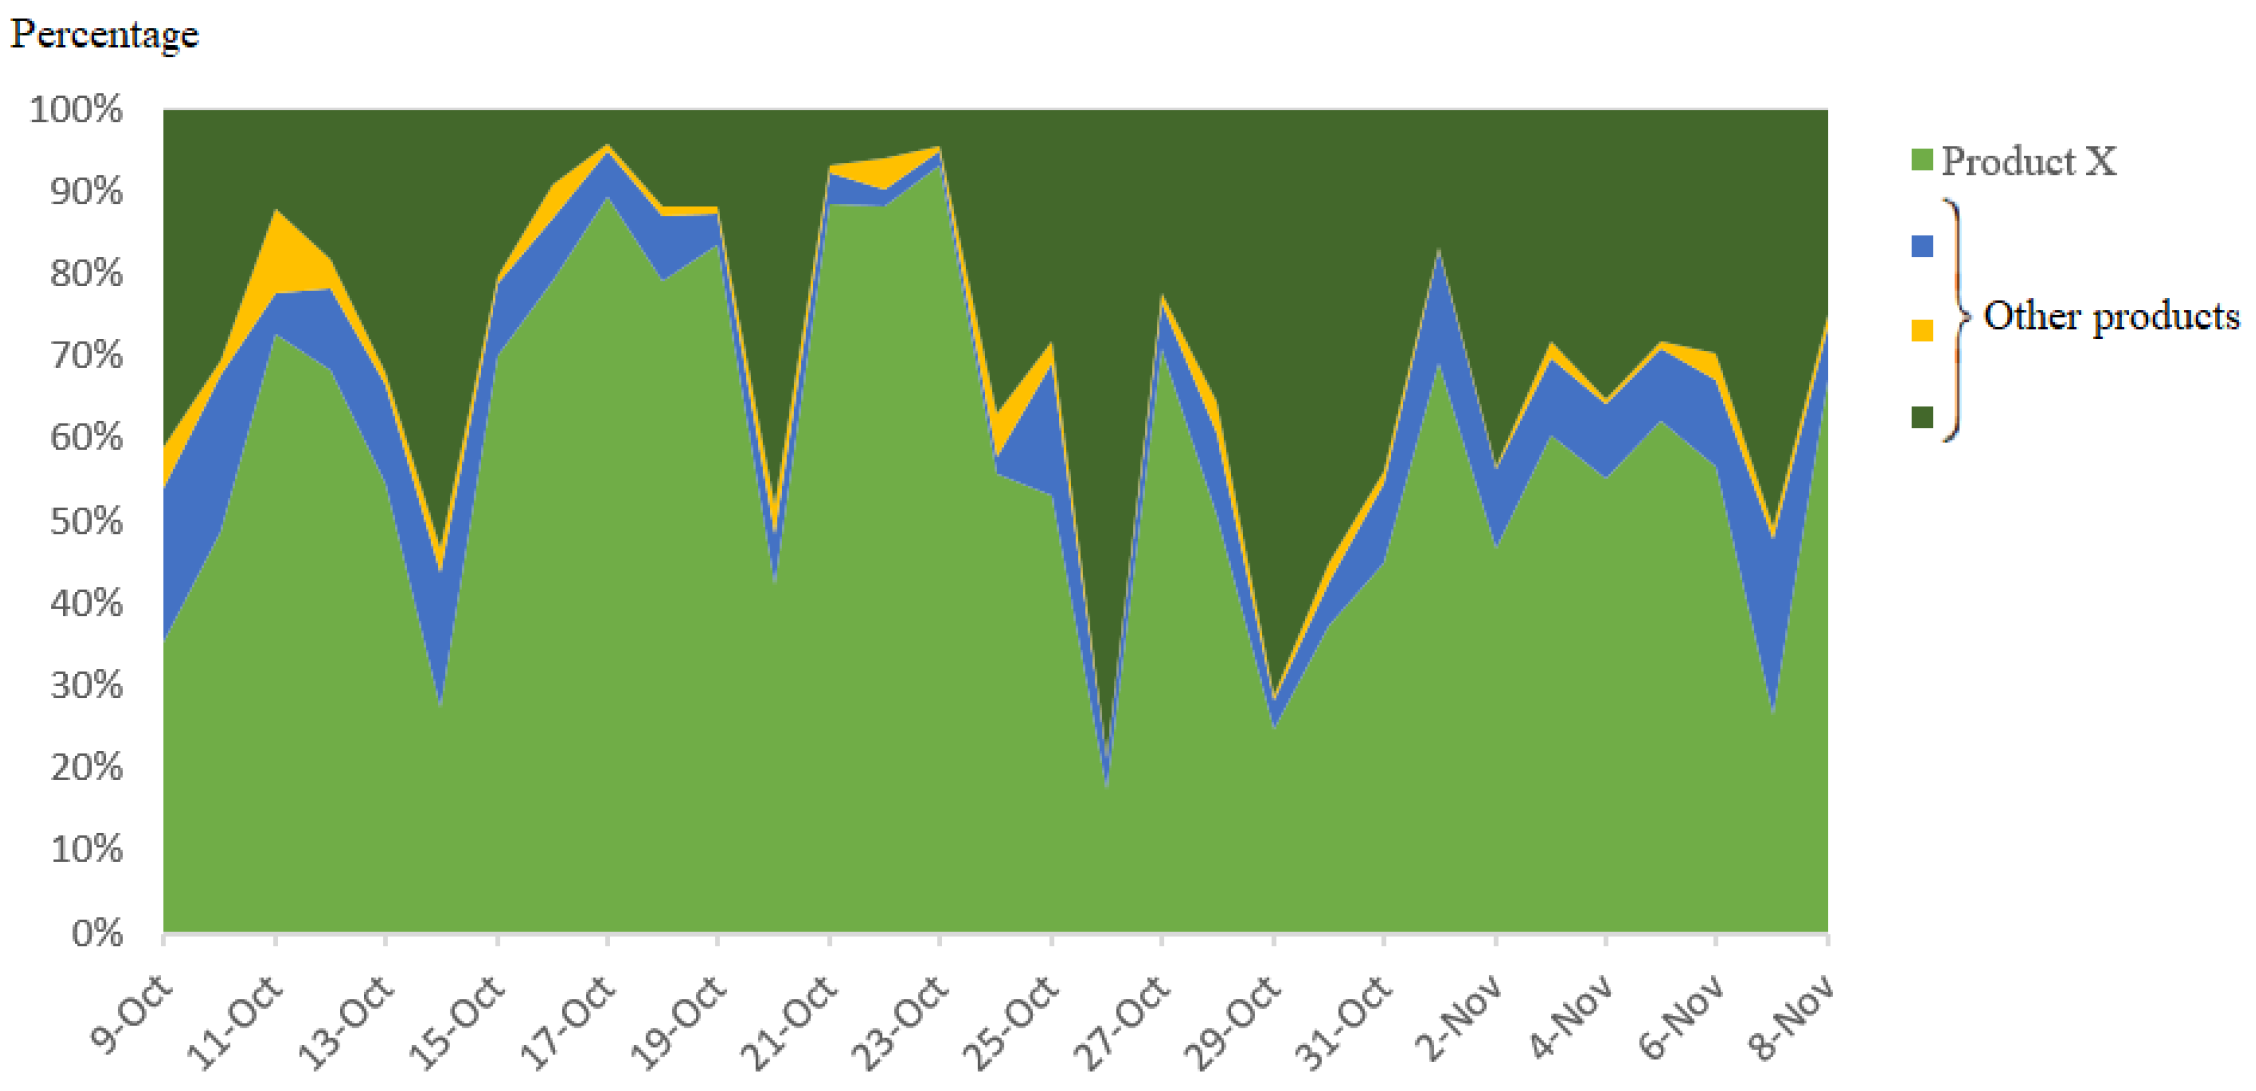
6.2. Experimental Results

Based on the list of emerging users for the influencer in Figure 3, our customer ran an influencer marketing strategy for product X on Facebook users in Vietnam in October, 2018 through two phases:
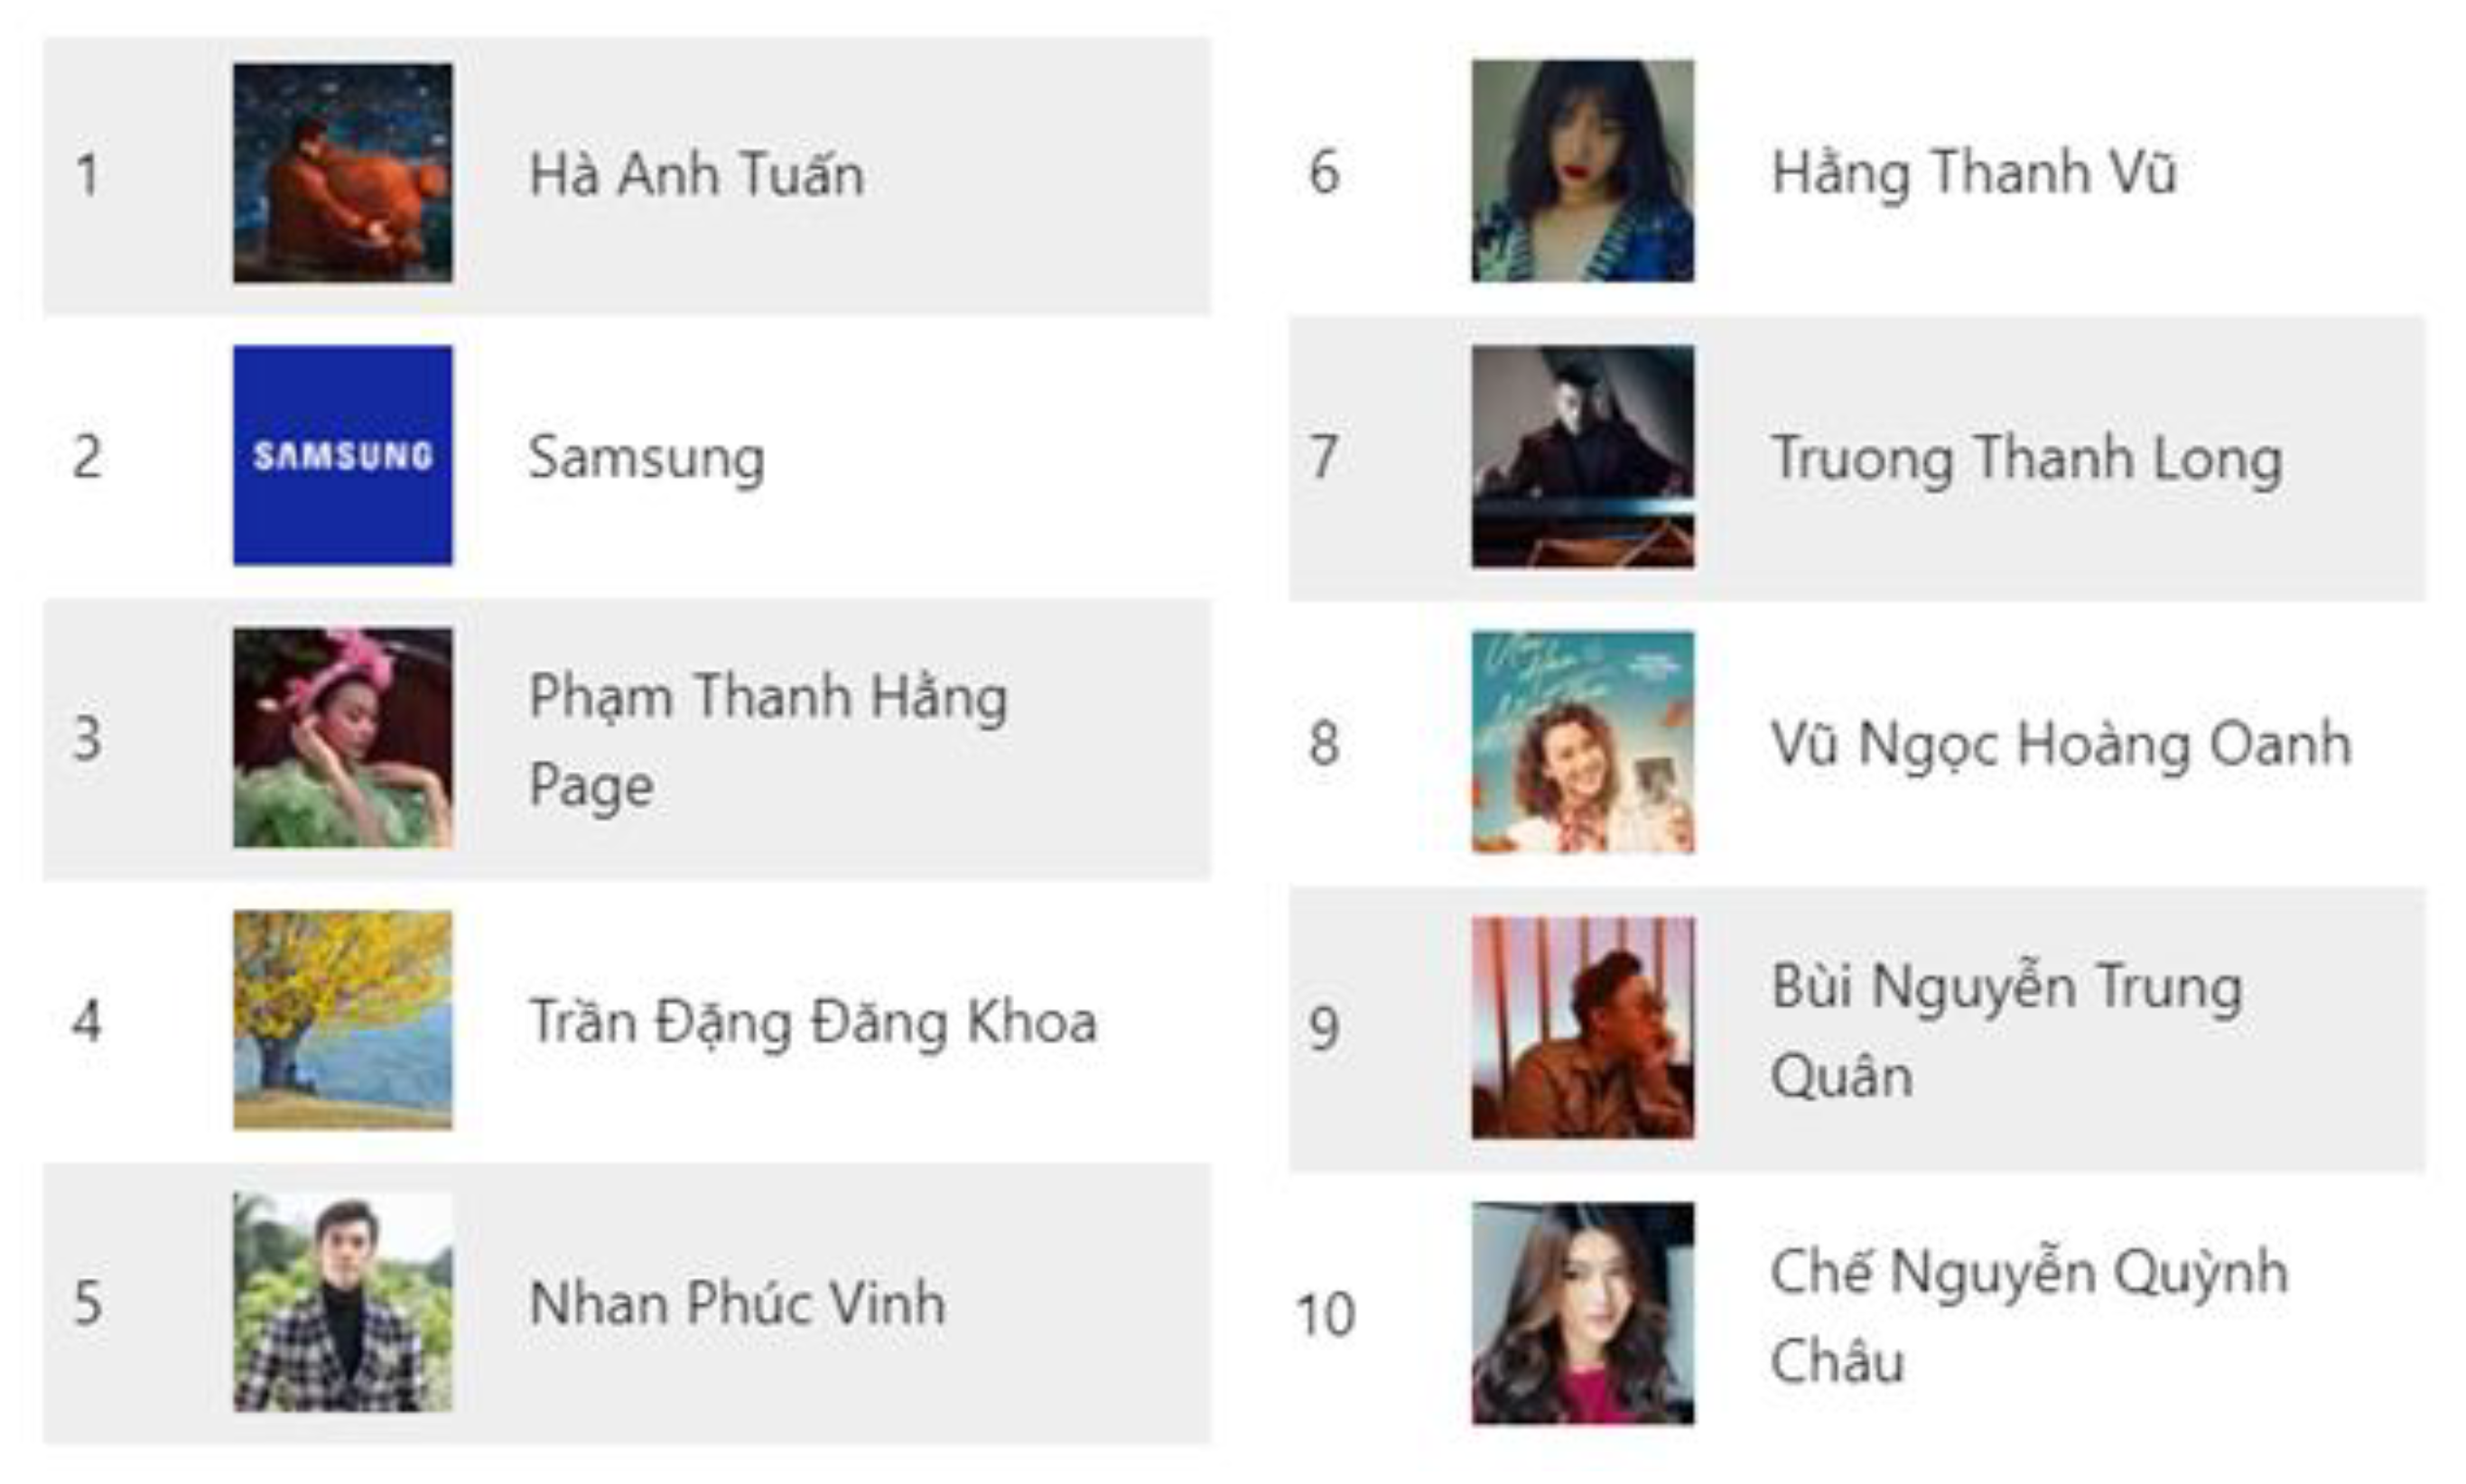
  • Phase 1: Our customer used four users in our list for their influencer marketing strategy from 9–16 October.
  • Phase 2: Our customer used other users—who were famous Key Opinion Leaders (KOLs) in Vietnam—for the marketing from 27–31 October 2018.
In the results that followed, the interactions were only counted when they were related to product X. The results of this influencer marketing strategy were as follows:
September and November, 2018 were the months that did not run the influencer marketing strategy. Table 2 shows the number of interactions in October, 2018 increasing compared with the previous month (September) and the following month (November) with the number of posts, comments, and shares. The number of interactions in October, 2018 increased by 133% compared with the previous month, and in the following month, it decreased by 61%.
After running the influencer marketing strategy for the duration time in Phase 1 (9–16 October) and Phase 2 (27–31 October), the number of interactions related to product X on the social network increased, as shown in Figure 4.
Figure 4. Total of interactions related to product X of Vietnamese users on Facebook in 30 days (9 October–8 November).
Table 3 shows the detailed results of the number of interactions related to product X in each phase and seven days after:
Table 3. Number of interactions related to product X in October, 2018.
Table 3 shows the effectiveness of the determined influencers by our proposed method. The rate of interactions in the duration time to run the influencer marketing in Phase 1 is more than double that of the duration time in Phase 2. After seven days from the time for running the influencer marketing, the number of interactions in Phase 1 is also higher than in Phase 2.
In the practice, the number of general interactions in Phase 2 was higher than in Phase 1; however, most of them mentioned KOLs and did not mention product X. Thus, with our customers, these interactions did not affect their sales revenue. Table 3 only counted the interactions that were related to product X. Moreover, although the run time in Phase 2 was shorter than the run time in Phase 1, the cost of the run time in Phase 2 was more expensive than the cost in Phase 1 because, in Phase 2, the customer used famous KOLs in Vietnam.
After running the influencer marketing strategy for the duration of one month (9 October–8 November), as shown in Figure 5, product X had a significant voice of information on Vietnamese Facebook users compared with competitor’s products.
Figure 5. Share of voices about the information on Vietnamese users of Facebook between product X and competitor products in 30 days from the time the influencer marketing strategy was run (9 October–8 November).
Based on the above results, our method was effective in determining the influencer for a brand/product/news. The influencer impacted the interactions of users on a social network. Our method also received positive feedback from our customers.

6.3. Discussions

The proposed method for detecting the influencer for marketing a brand or product can be applied in practice. Our measures have been tested on Vietnamese social network sites through the real influencer marketing strategy. The influencers detected by our method were useful in impacting the interactions of users on a social network in this strategy. The number of interactions of our determined influencers related to the brand was higher. They could impact the sales revenue of the brand in the online marketing strategy. In the real word, the proposed method received positive feedback from the customers when it was used to run influencer marketing strategies.
Nonetheless, our method only focused on tags on the social network as text. In the real world, many tags are images (or video clips). A user may write short posts, but he/she usually uses pictures to show their interest in a brand. Our method has not yet detected some cases. Furthermore, our method belongs to the field of the branch. When implementing this method, we must collect data in this field: the community of users in this field and their activities on the social network, corpus of the field.
The formula of passion is computed based on the following inputs: the total number of the user’s posts, the total number of positive posts about the specific brand that were created by the user, the number of the user’s active days, and the average of interactions with the users per post. Thus, these formulas for computing the passion point in our method can be used in other countries. However, the determining of positive posts belongs to the method to analyze the sentiment of the post, and the current methods for sentiment analysis usually use a corpus of a language. This corpus belongs to the language. For determining positive posts on a social network, we also developed a method for sentiment analysis based on the grammatical structure of Vietnamese users [30]. Thus, the method of determining positive posts cannot be used in other languages.

7. Conclusions and Future Works

In this paper, a model for representing a social network, called the SNet model, is proposed. This model represents the kinds of relationships between users and tags on the social network. A graph-based approach was proposed for computing the impact of the users and the speed of information propagation. There are two main influential measures, including the influence on other people by relationships between users and the concern to the user’s tags, and the tag propagation through social pulse on the social network. Based on the structure of the SNet model, the formula for the computing of passion points is also proposed. This point measures the love of users towards the brand. It is used to cluster the community that loves the brand. A method detecting the influencer in the brand-lover’s community is proposed. There are two main influential measures: the extent of the influence on other people by the relationships between users and the concern to user’s tags, and the tag propagation through social pulse on the social network.
The influencer of a specific brand or product on online social networks was determined through two stages: determining a group of users who love the brand, and determining the most influential users in the time window δ. Our method has been applied in the real world to detect the list of emerging influencers for specific brands. Its results received positive feedback from the customers when they used them to run their influencer marketing.
In the future, the content of a tag will be studied more clearly to evaluate the sentiment of the tag’s content. The sentiment analysis of tags is helping to cluster the community that love the brand based on the passion point more precisely [31]. The passion point is also affected by the diligence of the user’s posting. The formula of this point has to be added to the parameter about this diligence. In reality, some tags do not belong to the seeder; they still have a significant impact on the social network. Thus, analyzing the relationships between the tag propagation and the followers helps to measure the influence of a tag. The improved method will be made in comparison with other methods, such as using the opinion propagation-based scenarios [32] and using measures of network structure (outdegree centrality, betweenness centrality, and clustering coefficient) [33].
Moreover, online marketing strategies need to meet the requirements of the consumer behaviors. In further research, some methods used to determine the change in consumer behaviors have been studied. Based on this, we can recognize the changing of the user’s engagement with a commercial brand quickly. This can combine with detecting the influencer to establish an effective online marketing strategy. This strategy can approach the emerging costumers correctly.

Author Contributions

Conceptualization, T.H. and H.N.; methodology, T.H., H.N., I.Z., and H.P.; software, T.H. and D.D.; resources, T.H. and H.N.; writing—original draft preparation, T.H., H.N., and X.H.P.; review and editing, I.Z., and X.H.P.; visualization, T.H., H.N. and D.D. All authors have read and agreed to the published version of the manuscript.

Funding

This research is supported by VinTech Fund, a grant for applied research managed by VinTech City, under grant number DA132-15062019.

Conflicts of Interest

The authors declare no conflict of interest.

References

  1. Guille, A.; Hacid, H.; Favre, C.; Zighed, D.A. Information diffusion in online social networks: A survey. ACM SIGMOD Rec. Arch. 2013, 42, 17–28. [Google Scholar] [CrossRef]
  2. Gomez-Rodriguez, M.; Leskovec, J.; Schoelkopf, B. Modeling Information Propagation with Survival Theory. In Proceedings of the International Conference on Machine Learning (ICML 2013), Atlanta, GA, USA, 16–21 June 2013; pp. 666–674. [Google Scholar]
  3. Weng, L.; Menczer, F.; Ahn, Y. Virality Prediction and Community Structure in Social Networks. Nat. Sci. Rep. 2013, 3. [Google Scholar] [CrossRef]
  4. Kucher, K.; Paradis, C.; Kerren, A. The State of the Art in Sentiment Visualization. Comput. Graph. 2018, 37, 71–96. [Google Scholar] [CrossRef]
  5. Gil, P. What is Twitter & How does it Work? Available online: https://www.lifewire.com/what-exactly-is-twitter-2483331 (accessed on 4 February 2020).
  6. Riquelme, F.; Gonzalez-Cantergiani, P. Measuring user influence on Twitter: A survey. Int. J. Inf. Process. Manag. 2016, 52, 949–975. [Google Scholar] [CrossRef]
  7. Chai, W.; Xu, W.; Zuo, M.; Wen, X. ACQR: A novel framework to identify and predict influential users in micro-blogging. In Proceedings of the 17th Pacific Asia Conference on Information Systems (PACIS 2013), Jeju, Korea, 18–22 June 2013. [Google Scholar]
  8. Bouguessa, M.; Romdhane, L.B. Identifying authorities in online communities. ACM Trans. Intell. Syst. Technol. 2015, 6, 30. [Google Scholar] [CrossRef]
  9. Gayo-Avello, D. Nepotistic relationships in Twitter and their impact on rank prestige algorithms. Inf. Process. Manag. 2013, 49, 1250–1280. [Google Scholar] [CrossRef]
  10. Liu, N.; Li, L.; Xu, G.; Yang, Z. Identifying domain-dependent influential microblog users: A post-feature based approach. In Proceedings of the 28th AAAI Conference on Artificial Intelligence (AAAI 2014), Quebec, QC, Canada, 27–31 July 2014; pp. 3122–3123. [Google Scholar]
  11. Zimaitis, I.; Degutis, M.; Urbonavicious, S. Social Media Use and Paranoia: Factors That Matter in Online Shopping. Sustainability 2020, 12, 904. [Google Scholar] [CrossRef]
  12. Chen, W.; Lakshmanan, L.; Castillo, C. Information and Influence Propagation in Social Networks: Synthesis Lecturers on Data Management; Morgan & Claypool Publishers: San Rafael, CA, USA, 2013. [Google Scholar]
  13. Laroche, M.; Habibi, M.R.; Richard, M.O.; Sankaranarayanan, R. The effects of social media based brand communities on brand community markers, value creation practices, brand trust, and brand loyalty. Comput. Hum. Behav. 2012, 28, 1755–1767. [Google Scholar] [CrossRef]
  14. Do, N.; Nguyen, H. A reasoning method on Computational Network and Its applications. In Proceedings of the 2011 International Multi Conference of Engineers and Computer Scientists (IMECS 2011), Hongkong, 16–18 March 2011; pp. 137–141. [Google Scholar]
  15. Do, N.V.; Nguyen, H.D.; Selamat, A. Knowledge-Based model of Expert Systems using Rela-model. Int. J. Softw. Eng. Knowl. Eng. 2018, 28, 1047–1090. [Google Scholar] [CrossRef]
  16. Charalampakis, B.; Spathis, D.; Kouslis, E.; Kermanidis, K. A comparison between semi-supervised and supervised text mining techniques on detecting irony in greek political tweets. Eng. Appl. Artif. Intell. 2016, 51, 50–57. [Google Scholar] [CrossRef]
  17. Lawrence, B.; Cai, T.; Anirban, D. Interval Estimation for a Binomial Proportion. Stat. Sci. 2001, 16, 101–133. [Google Scholar]
  18. Valdiviezo, O.; Sánchez, J.A.; Cervantes, O. Visualizing sentiment change in social networks. In Proceedings of the 8th Latin American Conference on Human-Computer Interaction (CLIHC’17), New York, NY, USA, 8–10 November 2017. [Google Scholar] [CrossRef]
  19. Mañas-Viniegra, L.; Veloso, A.I.; Cuesta, U. Fashion Promotion on Instagram with Eye Tracking: Curvy Girl Influencers versus Fashion Brands in Spain and Portugal. Sustainability 2019, 11, 3977. [Google Scholar] [CrossRef]
  20. Pham, X.H.; Jung, J.; Hwang, D. Beating Social Pulse: Understanding Information Propagation via Online Social Tagging Systems. J. Univers. Comput. Sci. 2012, 18, 1022–1031. [Google Scholar]
  21. Huynh, T.; Zelinka, I.; Pham, X.H.; Nguyen, H.D. Some influence measures to detect the influencer on social network based on Information Propagation. In Proceedings of the 9th International Conference on Web Intelligence, Mining and Semantics (WIMS 2019), Seoul, Korea, 26–28 June 2019. [Google Scholar] [CrossRef]
  22. Morente-Molinera, J.A.; Kou, G.; Peng, Y.; Torres-Albero, C.; Herrera-Viedma, E. Analysing discussions in social networks using group decision-making methods and sentiment analysis. Inf. Sci. 2018, 447, 157–168. [Google Scholar] [CrossRef]
  23. Zimmerman, J.; Ng, D. Social Media Marketing All-in-One, 4th ed.; John Wiley & Sons, Inc.: Hoboken, NJ, USA, 2017. [Google Scholar]
  24. Zhou, T.; Medo, M.; Cimini, G.; Zhang, Z.K.; Zhang, Y.C. Emergence of Scale-Free Leadership Structure in Social Recommender Systems. PLoS ONE 2011, 6. [Google Scholar] [CrossRef]
  25. Aleahmad, A.; Karisani, P.; Rahgozar, M.; Oroumchian, F. OLFinder: Finding opinion leaders in online social networks. SAGE J. Inf. Sci. 2015. [Google Scholar] [CrossRef]
  26. Perikos, I.; Hatzilygeroudis, I. Recognizing emotions in text using ensemble of classifiers. Eng. Appl. Artif. Intell. 2016, 51, 191–201. [Google Scholar] [CrossRef]
  27. Wallis, S.A. Binomial confidence intervals and contingency tests: Mathematical fundamentals and the evaluation of alternative methods. J. Quant. Linguist. 2013, 20, 178–208. [Google Scholar] [CrossRef]
  28. Wilson, E.B. Probable inference, the law of succession, and statistical inference. J. Am. Stat. Assoc. 1927, 22, 209–212. [Google Scholar] [CrossRef]
  29. JSON. Available online: https://www.json.org/ (accessed on 4 February 2020).
  30. Nguyen, H.; Huynh, T.; Hoang, S.; Pham, V.; Zelinka, I. Language-oriented Sentiment Analysis based on the grammar structure and improved Self-attention network. In Proceedings of the 15th International Conference on Evaluation of Novel Approaches to Software Engineering (ENASE 2020), Prague, Czech Public, 5–6 May 2020. [Google Scholar]
  31. Gang, L.; Fei, L. Application of a clustering method on sentiment analysis. SAGE J. Inf. Sci. 2012, 38, 127–139. [Google Scholar]
  32. Urena, R.; Chiclana, F.; Herrera-Viedma, E. A new influence based network for opinion progpagation in social network based scenarios. Procedia Comput. Sci. 2018, 139, 329–337. [Google Scholar] [CrossRef]
  33. Song, J.; Jamous, N.; Turowski, K. Influence in Social Media Marketing: A Quantitative Evaluation Framework from a Large Scale of Empirical Evidence. In Proceedings of the International Conference on Enterprise Systems (ES), Melbourne, Australia, 2–3 November 2016; pp. 136–142. [Google Scholar]

Article Metrics

Citations

Article Access Statistics

Multiple requests from the same IP address are counted as one view.