Abstract
Buildings have become a key source of greenhouse gas (GHG) emissions due to the consumption of primary energy, especially when used to achieve thermal comfort conditions. In addition, buildings play a key role for adapting societies to climate change by achieving more energy efficiency. Therefore, buildings have become a key sector to tackle climate change at the local level. However, public decision-makers do not have tools with enough spatial resolution to prioritise and focus the available resources and efforts in an efficient manner. The objective of the research is to develop an innovative methodology based on a geographic information system (GIS) for mapping primary energy consumption and GHG emissions in buildings in cities according to energy efficiency certificates. The developed methodology has been tested in a representative medium-sized city in Spain, obtaining an accurate analysis that shows 32,000 t of CO2 emissions due to primary energy consumption of 140 GWh in residential buildings with high spatial resolution at single building level. The obtained results demonstrate that the majority of residential buildings have low levels of energy efficiency and emit an average of 45 kg CO2/m2. Compared to the national average in Spain, this obtained value is on the average, while it is slightly better at the regional level. Furthermore, the results obtained demonstrate that the developed methodology is able to directly identify city districts with highest potential for improving energy efficiency and reducing GHG emissions. Additionally, a data model adapted to the INSPIRE regulation has been developed in order to ensure interoperability and European-wide application. All these results have allowed the local authorities to better define local strategies towards a low-carbon economy and energy transition. In conclusion, public decision-makers will be supported with an innovative and user-friendly GIS-based methodology to better define local strategies towards a low-carbon economy and energy transition in a more efficient and transparent way based on metrics of high spatial resolution and accuracy.
1. Introduction
Climate change adaptation and mitigation have become a central concern of many cities in Europe. Following EU Commission [1], around 65% of European cities with more than 5000 inhabitants have a mitigation plan in place. There is, however, a wide variation among countries. The mayors of 300 EU cities signed the Covenant of Mayors for Climate and Energy [2], pledging to reduce their greenhouse gas (GHG) emissions by at least 40% by 2030 [3]. Many other cities have also signed the covenant, including some from outside the EU. European cities are seeking to reduce both energy consumption and GHG emissions by supporting better thermal insulation of buildings, using more efficient lighting technologies, and promoting new low-energy buildings. However, more will be needed to meet the ambitious EU goal of cutting GHG emissions by 80% by 2050 [4]. Many cities are testing new nature-based solutions to adapt to climate change. Such solutions often also support additional goals such as reducing GHG emissions, pollution, or flood risks [5]. For example, green roofs can help reduce the impact of heat waves and can catch run-off water and reduce the need for cooling [6]. Trees can reduce the heat island effect and reduce air pollution [7,8,9,10].
Buildings in urban areas are responsible for approximately 40% of energy consumption and 36% of CO2 emissions in the EU [11]. This is because 35% of the EU’s buildings are over 50-years-old, and 75% of the building stock is energy inefficient, while only 1% of the building stock is renovated each year [1]. Therefore, the building sector has high potential to implement measures to reduce energy consumption [12]. Accordingly, EU policies are oriented to improve energy efficiency in buildings, e.g., Energy Performance of Buildings Directive [13] and Energy Efficiency Directive [14].
Local governments have to act against climate change with energy transition measures and monitor their impacts. Therefore, local authorities have to define strategically planning in multi-level governance to mitigate and adapt to climate change, especially in their urban development and rehabilitation programmes of the housing stock [15,16]. So, we are facing a scenario in which policies and directives at supra-municipal level should be supported with the commitment of local councils to achieve the targets [17]. Therefore, local authorities must take on the challenge posed by the problem of climate change and turn it into an opportunity. As evidenced, the Covenant of Mayors for Climate and Energy has the purpose to support and foster the efforts of local authorities in the implementation of sustainable energy policies [1]. This agreement has become the main European movement in which local authorities participate, assuming a voluntary commitment to improve energy transition in their territories to significantly reduce CO2 emissions.
Public decision-makers have a lack of tools to support strategic planning in a quantitative, objective, and transparent manner. For this reason, public decisions and measures are normally taken based on a Base Emissions Inventory (BEI) or Monitoring Emissions Inventory (MEI) [2]. These inventories are carried out mostly with top-down methodologies using aggregated data (statistical ratios). They allow neither monitoring the impact of the measures taken nor identifying opportunities due to low spatial resolution. Thus, decision-making is currently carried out by mostly following public subsidies lines and not through rigorous and quantitative analysis. In addition, an accurate and monitored energy characterization as well as a quantification of GHG emissions of buildings are necessary:
- (a)
- To estimate the baseline energy consumption of the building sector, disaggregated by residential, tertiary, and public typologies [18].
- (b)
- To analyse geospatial distribution of the different levels of energy efficiency and related GHG emissions [19].
- (c)
- To combine urban energy geospatial characterization to simulate scenarios to determine integrated planning-energy strategies and to support, evaluate, and control sustainable transition measures in cities [20].
For this purpose, various modelling techniques based on top-down and bottom-up approaches allow energy consumptions calculation at city level [21]. Top-down approaches relate the energy consumption of buildings to macroeconomic variables such as population growth and tax revenues that treat the built environment as a black box, and rarely describe in detail the demand characteristics or the performance of building components [22]. On the other hand, bottom-up approaches base their estimations on single buildings analysis [18]. These approaches aim to take into account both the statistical data and building physics, which generally achieve a comprehensive characterization of energy services at any spatial or temporal scale [23].
Moreover, Geographical Information Systems (GIS) offer the opportunity to characterize geospatial energy consumption intensities using geo-referenced information [19]. So, several GIS-based models have been already developed at city scale [24,25,26,27]. Nevertheless, in order to ensure interoperability at EU level, it is necessary to develop the data model adapted to standard normative. For this purpose, the European INSPIRE Directive [28] defines specifications and metadata in buildings topic. Thus, data models adapted to the INSPIRE directive should be developed to achieve higher spatial resolution for public decision-making processes on sustainable urban planning towards energy transition and mitigation of climate change [21].
The general objective of this multidisciplinary research is to develop an innovative methodology based on GIS for mapping primary energy consumption and GHG emissions in buildings, according to energy efficiency certificates, in order to support public decision-making processes against climate change in cities. To achieve this overall objective, the following specific objectives have been defined:
- To calculate and characterize energy efficiency and GHG emissions from residential, public, and tertiary buildings typologies based on occupancy.
- To develop geospatial and alphanumerical data integration models based on the EU INSPIRE directive.
- To develop an innovative model to obtain spatial distribution of primary energy and GHG emissions of buildings at district and city levels by analysing and structuring geographic and alphanumeric data base and data loading.
- To test and validate the developed model in a pilot action in a representative medium-sized city to support decision-making about energy transition measures and mitigation of climate change.
To achieve these objectives, we begin describing the criteria followed for the selection of a representative pilot city to apply the developed model. Next describes the methodological processes for data collection, quantification, and characterization of the energy efficiency and GHG emissions of buildings. After that, the development of the data model adapted to INSPIRE directive is exposed together with the analysis and structuring of the georeferenced databases to achieve the spatial distribution of the results and their integration in the decision-making process at the local scale. Following the same structure, the results obtained from the described methodological application are shown graphically, and finally, it is applied to the selected pilot city to demonstrate its applicability and usefulness. The article ends with the conclusions obtained from the research.
2. Methodology
The research methodology is based on a bottom-up approach including the following: data gathering, calculation and characterization of energy efficiency and GHG emissions of buildings, data model development adapted to the EU INSPIRE Directive integrating alphanumeric and geographic data, analysis and structure of geographic and alphanumeric databases and data loading to obtain spatial distribution of primary energy and GHG emissions of buildings, and, finally, the testing and evaluating of the methodology in a representative medium-sized city (see Figure 1).
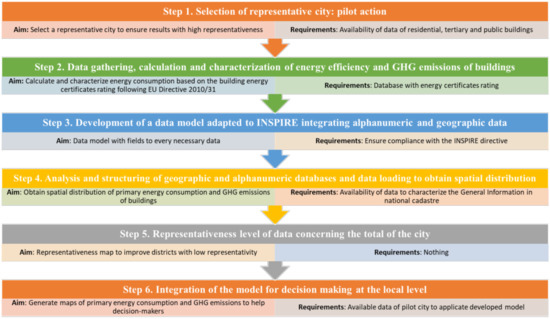
Figure 1.
Outline of steps, aim of each step, and requirements of each step of the methodology.
2.1. Selection of Representative City: Pilot Action
According to the United Nations [29], approximately two-thirds of the world’s population will be living in urban areas by 2050. This rapid change of pace is projected to be driven primarily by changes in Africa and Asia, as the focus of global urbanisation patterns continue to shift towards developing and emerging economies. In Europe, around 75% of the population is living in cities, towns, and suburbs [30]. The pace of urbanisation change in Europe is likely slower, with the share of the population living in urban areas projected to rise over 80% by 2050. In fact, Europeans tend to live in medium-sized cities. Following EU Commission [1], European cities are on average located closer to each other than cities in other parts of the world. This is the outcome of Europe’s dense network of medium-size cities, generally in a range between 25,000 and 100,000 inhabitants.
In this research, the selection of the pilot urban area is important to test the methodology developed and to ensure results with high representativeness. To achieve this, a representative medium-sized city is needed, with all activity sectors (several land uses, including agriculture, industry, and services as well as public administration facilities), but also with available data on residential, tertiary, and public buildings. For these reasons, Quart de Poblet was selected as the pilot city. It is located 6 km W of Valencia (Spain). Quart de Poblet has approximately 25,000 inhabitants and meets with all selection requirements.
City council of Quart de Poblet is very interested in reducing its GHG emissions. In 2016, the city council adopted the goals of the Covenant of Mayors for Climate and Energy initiative and has been proposed to exceed the EU goals of reducing CO2 emissions by 20% for 2020 and 40% for 2030, adopting a joint approach to tackling mitigation and adaptation to climate change [3]. In fact, energy consumption reduction in buildings tackle two objectives: mitigation due to reduction of fossil energy consumption and therefore GHG emissions, and adaptation due to improvement of energy efficiency.
2.2. Data Gathering, Calculation, and Characterization of Energy Efficiency and GHG Emissions of Buildings
The bottom-up methodology is based on building physics and a statistical hybrid approach, which calculates energy demand per living area (m2). For this purpose, three different types of buildings based on occupancy are differentiated: residential, tertiary (non-public), and public buildings.
Energy consumption has been calculated based on the building energy certificates rating following EU Directive 2010/31 [13]. The rating is the result of the energy consumption necessary to satisfy the building energy demand calculation under normal operating and occupancy conditions. Buildings are classified by letters from A to G, where G corresponds to the least efficient building and A to the most efficient, according to primary energy consumption and CO2 emissions compared to a base building with same geometry and location and following EU legislation [13].
The energy rating of each building is obtained by comparing the data entered by the certifying company with a database that collects a large number of tests. The database has been prepared for representative cities in different climatic areas, with the results obtained from carrying out a large number of simulations with the Calener VYP program [31]. This database covers all the constructive possibilities that can be found in Spain. The certifying company must enter following data: climatic area, type of building (residential or tertiary), orientation, compactness of the building, air renovation, thermal transmittance of opaque closings, mass of the closings, percentage of voids in the façade, thermal transmittance of the gaps, solar factors of the glass and shading elements, and thermal bridges. From the data entered by the certifying company, its dimensionless variables are obtained to compare them with those of the database. The energy certificate qualification is obtained by comparison. Each energy certificate rating has a value of energy consumed and associated emissions based on the variables mentioned.
Energy certificates of residential and non-public tertiary buildings are obtained from available databases of the regional Energy Agency (IVACE). This database includes 1,218 energy certificates done by certifying companies in the pilot city. These energy certificates were used to calculate the primary energy consumption and CO2 emissions of residential, commercial, and other tertiary buildings available in regional Energy Agency database.
Furthermore, 37 public buildings with several uses (administration buildings, schools, library, sports facilities, social centres, care centres for elderly people, etc.) were audited and certificated carrying out inventory visits to characterize the energy consumption equipment and to verify the state of the thermal insulation following EU Directive [13]. These input data are entered into the energy certification tools to obtain the expected energy consumption in each audited building according to their characteristics. Finally, the results were contrasted with the actual energy consumption of the building obtained from the energy bills from the last two years (2016 and 2017) provided by the local public administration.
2.3. Development of a Data Model Adapted to INSPIRE Integrating Alphanumeric and Geographic Data
The developed model contains every data needed to identify and locate the buildings and every data used to obtain the primary energy consumption and the GHG emissions. Thus, the fields shown in Table 1 compose the data model in order to comply with the EU INSPIRE Directive (2007/2/EC) [28].

Table 1.
Fields of data model developed to comply with EU INSPIRE Directive [28].
2.4. Analysis and Structuring of Geographic and Alphanumeric Databases and Data Loading to Obtain Spatial Distribution of Primary Energy and GHG Emissions of Buildings
Geographical layers and field data compose necessary data. Field data were obtained from the local administration, cadastre, databases of the Energy Agency, and additional energy audits carried out by the researchers.
Data to characterize the General Information (explained in Section 2.3) are available in national cadastre. Spain General Information is available in the catalogue file “46_104_U_2019-02-06” of Spanish Cadastre website [https://www.sedecatastro.gob.es]. From the cadastre information file, Land register is extracted for each cadastral parcel involved. The constructive unit register exists for each construction of each constructive unit in each cadastral parcel. Finally, there is one construction register for each constructive unit for each parcel involved. Geographical data of buildings, parcels, and streets are obtained from the Electronic Headquarters of the Cadastre (cadastre website) that also provides access to the INSPIRE services (the atom file of buildings).
Furthermore, data of energy certificates that are not available in the Energy Agency database are obtained through bottom-up methodology based on building physics and statistical hybrid approach estimated by energy audits in public buildings.
Once the available data has been collected and analysed, the following domains are defined (Table 2 and Table 3):

Table 2.
Buildings type domains definition of the data model.

Table 3.
Primary energy and GHG emissions certification levels.
Then, this information is loaded from the databases to the developed model for analysis. Information from the Energy Agency and own performed energy certification estimations is classified by building type categories, as shown in Table 4.

Table 4.
Energy certificates classification by building type.
The analysis of geographical data shows some cadastral reference with more than one energy efficiency certificate by parcel. This is because different dwellings with different energy supply or different energy efficiency levels could compose a building.
Thus, a methodology to calculate the level of energy certificates of a parcel with more than one certificate has been established, for the case that it has more than one dwelling with different certificate levels. For this purpose, a SQL query is developed and applied (see Figure 2) to calculate the quantity of dwellings per parcel with energy efficiency certificate available. Then, the total amount of building area (m2) of each efficiency energy level is summed up. Finally, the energy efficiency level calculated is assigned to the parcel.
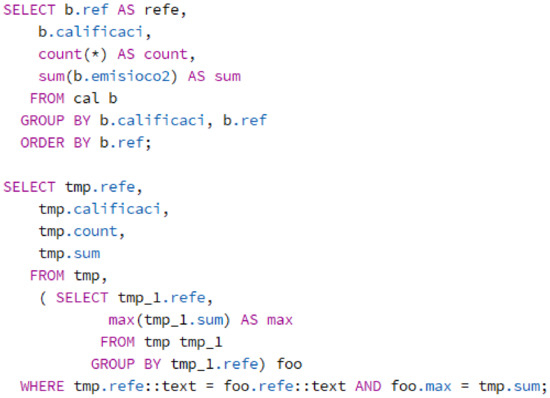
Figure 2.
SQL query to calculate the quantity of dwelling per parcel with available energy efficiency certificate.
2.5. Representativeness Level of Data Concerning the Total of the City
The representativeness level of city data is calculated as the amount of parcel calculated based on efficiency energy certificates concerning total parcels in the city. Then, a representativeness map is generated in order to improve data gathering of the districts with a low level of representativeness.
2.6. Integration of the Model for Decision Making at the Local Level
The integration of the model developed generates maps of primary energy consumption and GHG emissions to identify the potential districts for improving energy efficiency and reducing GHG emissions. This will help the public decision-maker to define local strategies towards a low-carbon economy and energy transition policies against climate change in a more efficient and transparent manner based on metrics of high spatial resolution. However, it must be taken into account that other methodologies for existing buildings used both for online (based on real-time operation of buildings) [32,33] and offline (based on strategic choice for structural changes) [34,35] are used to improve energy efficiency and sustainability of single buildings with high temporal resolution.
An example for the application of the developed model for decision-making at the local/district level has been carried out. For this purpose, primary energy consumption and GHG emissions of buildings without available data nowadays have been calculated based on statistical correlation with results of buildings, which have been determined following the described methodology. Thus, the energy efficiency level based on the construction year and building orientation has been calculated based on energy classification by national law [32].
Therefore, an intersection of the parcel layer with the buildings layer is done to obtain the year and the number of dwellings in each parcel. However, the CAT format with alphanumeric information is provided by the cadastre, obtaining the properties of each plot, with the m2 and construction or rehabilitation year. Then, energy efficiency classification average is obtained per year. Finally, an algorithm is developed and applied in order to calculate GHG emissions and primary energy consumption of buildings without available data.
3. Results and Discussion
3.1. Representativeness Level of Data Concerning the Total of the City
The representativeness level of available data concerning the total of the city is 17% (Table 5). Each parcel has calculated the representative level as the relation between dwellings with available energy efficiency certification and total dwellings of the parcel (Figure 3).

Table 5.
Representativeness level of the city data concerning the total of the city.
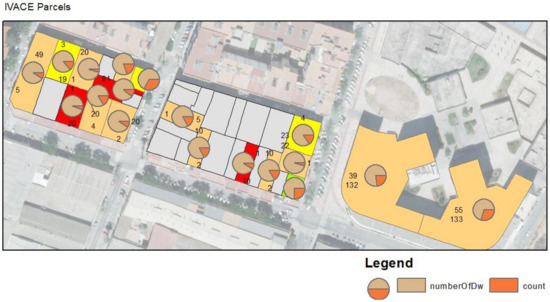
Figure 3.
Representativeness level of an example of parcels of a district of the pilot city Quart de Poblet. In brown: number of energy efficiency certification in parcel. In orange: number of total buildings/locals in the parcel.
3.2. Energy Efficiency and GHG Emissions Level of Buildings
- (a)
- Residential and tertiary (non-public) buildings
Most of the 1,218 available energy certificates of the municipality are individual dwellings located in housing blocks (77%) followed by commercial premises (7%) and complete housing blocks (5%). The classification of energy certificates by use type obtained from the Energy Agency database can be observed in Figure 4.
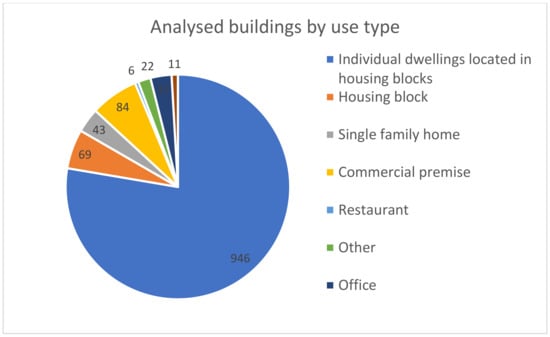
Figure 4.
Analysed buildings by use type.
The results of energy certificates obtained from these buildings are shown in Figure 5. Energy certification levels E, G, D, and F are the most common in the analysed buildings. This low rating is due to the age of the residential buildings in the city, most of them constructed in from 1960 to 1990 and many of them without an integral rehabilitation since construction. In terms of GHG emissions, this implies an annual average GHG emissions of 45 kg CO2/m2.
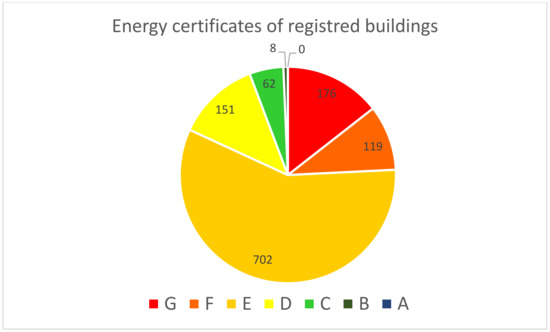
Figure 5.
Energy certificated of registered buildings.
Furthermore, the obtained results show that tertiary buildings have significant higher energy efficiency, obtaining approximately 30% of them a level of energy efficiency of C or more. On the other side, more than 90% of residential buildings have obtained a certification of D or less. It is also notable to remark that no one building has obtained level A.
These results were compared with the data from other experiences [33] that collects energy certificates of every building audited in Spain by regions. This comparative shows that the results obtained in Quart de Poblet are very similar to the region (Valencia) and to the country (Spain), as shown in Figure 6. In all local, regional, and national scales predominates E energy certification level with more than 50% of total amount of audited buildings followed by G level. Nevertheless, the results in Quart de Poblet are slightly better than the region of Valencia, which is 8% of the buildings have C or more energy efficiency level while in the region of Valencia only 4% have C or more.
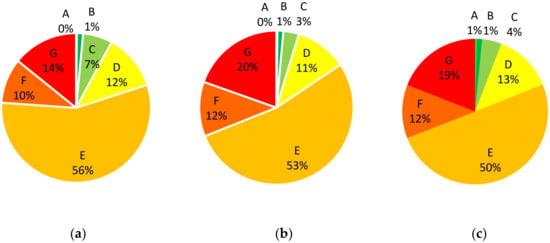
Figure 6.
Comparative results at local, regional and national level. (a) Local level (pilot city of Quart de Poblet), (b) Regional level (Community of Valencia), and (c) National level (Spain).
- (b)
- Public buildings
Energy certification results and its analysis in terms of GHG emissions and primary energy consumption are shown in Figure 7.
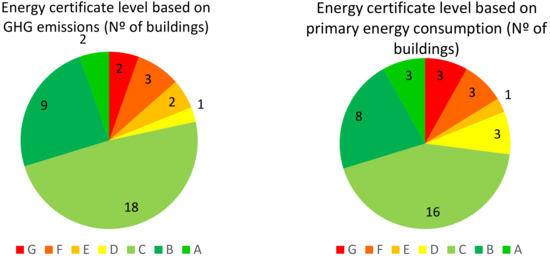
Figure 7.
Energy certificate level based on GHG emissions and primary energy consumption.
The obtained results show a good level of energy efficiency and GHG emissions when compared to the total sample. Concretely, 78% of buildings audited have C or even higher energy certificate level. This can be explained as follows:
- (a)
- Most of these buildings audited have non-intensive use of energy due to its main activity closing at night (schools, social centres, and office buildings).
- (b)
- Most of these buildings use heat pumps (with high coefficient of performance) and natural gas boilers (with moderate emission factor of CO2) as source energy for heating, which reduce the total emissions significantly in comparison with electricity.
3.3. Data Model Adapted to INSPIRE Directive Integrating Alphanumeric and Geographic Data
The data model developed consists in one data table (Table 6) and three geographical layers (Public, Tertiary, and Residential).

Table 6.
Data table of the developed model.
The geographic data table of the data model developed is shown in Table 7:

Table 7.
Geographical data table of the developed model.
The application of the developed model to the parcels with available energy certificates data shows the total emissions amount of 12,015 t CO2 due to the primary energy consumption of 144 GWh of tertiary, residential, and public buildings based on the developed model (Table 8).

Table 8.
GHG emissions and primary energy consumption of tertiary, residential, and public buildings.
The GIS tool developed and applied allows a geographical representation of a GHG emissions map, which enables a good diagnosis of the energy efficiency of the buildings in the city. Figure 8, Figure 9 and Figure 10 show the spatial distribution of GHG emissions in public, residential, and tertiary buildings.
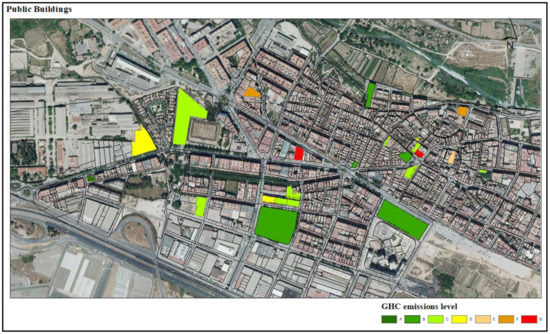
Figure 8.
Results of the GHG emissions of the 37 public buildings distributed in 27 parcels.
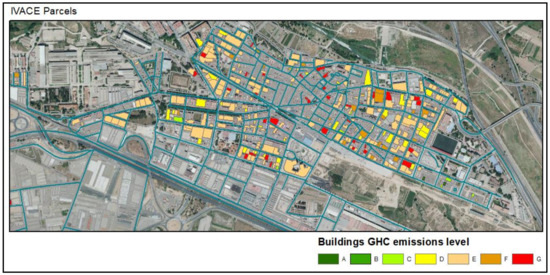
Figure 9.
Results of the GHG emissions of the 1,058 residential buildings distributed in 333 parcels.
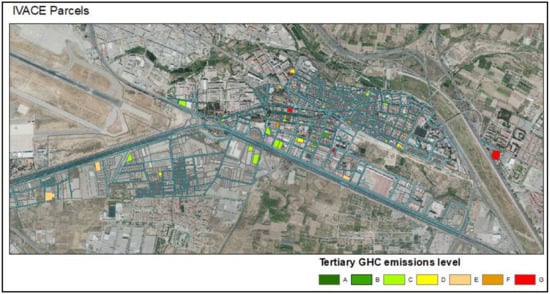
Figure 10.
Results of the GHG emissions of the 160 tertiary buildings distributed in 99 parcels.
3.4. Application of Results and Methodology for Local Decision-Making
Following the developed model, a total amount of 31,984 t CO2 of GHG emissions and a primary energy consumption of 140,750 MWh can be estimated for the entire city. The spatial distribution of the obtained results is shown in Figure 11 and Figure 12.
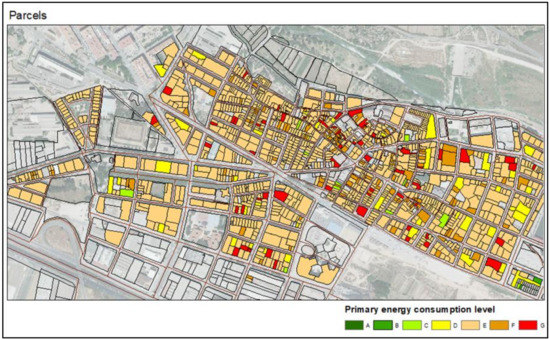
Figure 11.
Spatial distribution of primary energy consumption.
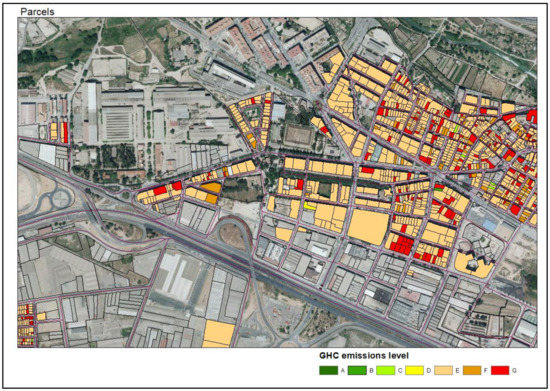
Figure 12.
Spatial distribution of GHG emissions.
The results obtained and its spatial representation allow the public authorities to prioritize the available resources on the priority measures on buildings or districts towards an efficient reduction of GHG emissions, following the required objectives determined at EU level.
4. Conclusions
An innovative methodology based on a geographic information system (GIS) for mapping primary energy consumption and GHG emissions in buildings has been developed. This tool aims to support decision-making processes against climate change at a local or district level. The developed methodology and its implementation with a simple tool allow knowing the diagnosis of buildings contribution to climate change in an accurate manner with high spatial resolution. Thus, local authorities as public decision-makers can identify the most relevant GHG emissions in buildings or districts, and consequently focus their efforts and resources to reduce it with high efficiency.
The developed model has been tested in a representative medium-sized pilot city obtaining a quantification of GHG emissions and primary energy consumption of its buildings. The developed model has allowed integrating heterogeneous available data (local databases, national cadastre, external databases and own performed energy audits) to achieve a good level of representativeness of the city. The result of its application to the pilot city shows an acceptable level of energy efficiency in public buildings and a lower level in tertiary and residential buildings. Furthermore, a methodology to extrapolate primary energy consumption and GHG emissions to buildings without previous energy certification has been developed and validated. In comparison with current techniques used to make decisions (Base Emissions Inventory and Monitor Emissions Inventory), the developed model offers a high spatial resolution results obtained with bottom-up approach that offers more accurate and useful results.
The energy efficiency results obtained have allowed the local authority to prove that the energy efficiency of their buildings is at the average at national level and slightly above at regional level. It has also allowed detecting opportunities and improved management of the energy consumption. As a result, the consumption of public buildings will be monitored to improve their energy efficiency. In future, these results will be studied to improve the developed model.
Finally, data model has been adapted to INSPIRE directive integrating alphanumerical and geographical data ensuring interoperability and therefore the possible application to other EU cities.
Author Contributions
E.L.-S. and J.-V.O.-V. conceived of the presented research idea. E.L.-S., J.-V.-O.-V., E.C.-A. and L.-G.L.-Z. developed the theory, the sampling and the methodology. E.L.-S. performed the data computations. V.L.-A. and A.R.-F. verified the analytical methods. J.-V.O.-V. and E.C.-A. encouraged E.L.-S. to develop the data model adapted to INSPIRE and supervised the findings of this work. All authors discussed the results and contributed to the final manuscript. All authors have read and agree to the published version of the manuscript.
Funding
This work was supported by the City Council of Quart de Poblet (Valencia, Spain).
Conflicts of Interest
The authors declare no conflict of interest.
References
- European Commission. The State of European Cities 2016 Cities leading the way to a better future. In Directorate General for Regional and Urban Policy; European Commission: Brussel, Belgium, 2016. [Google Scholar]
- European Commission. Covenant of Mayors: 2018 in review: Key facts and figures of the Covenant of Mayors in Europe. In Publications Office of the European Union; European Commission: Brussel, Belgium, 2019. [Google Scholar]
- European Commission. European Parliament and of the Council on the Promotion of the Use of Energy from Renewable Sources; European Commission: Brussel, Belgium, 2018. [Google Scholar]
- European Commission. 2050 Long-Term Strategy. Available online: https://ec.europa.eu/clima/policies/strategies/2050_en (accessed on 27 March 2020).
- Yang, J.; Joe, M.B.; Jinxing, Z.; Zhenyuan, S. The urban forest in Beijing and its role in air pollution reduction. Urban For. Urban Green. 2005, 3, 65–78. [Google Scholar] [CrossRef]
- Escobedo, F.J.; Kroeger, T.; Wagner, J.E. Urban forests and pollution mitigation: Analyzing ecosystem services and disservices. Environ. Pollut. 2011, 159, 2078–2087. [Google Scholar] [CrossRef] [PubMed]
- Zhao, M.; Kong, Z.H.; Escobedo, F.J.; Gao, J. Impacts of urban forests on offsetting carbon emissions from industrial energy use in Hangzhou, China. J. Environ. Manag. 2010, 91, 807–813. [Google Scholar] [CrossRef] [PubMed]
- McPherson, G.E.; Scott, K.I.; Simpson, J.R. Estimating cost effectiveness of residential yard trees for improving air quality in Sacramento, California, using existing models. Atmos. Environ. 1998, 32, 75–84. [Google Scholar] [CrossRef]
- Nowak, D.J.; Crane, D.E. Carbon storage and sequestration by urban trees in the United State American. Environ. Pollut. 2002, 116, 381–389. [Google Scholar] [CrossRef]
- Nowak, D.J.; Crane, D.E.; Stevens, J.C. Air pollution removal by urban trees and shrubs in the United States. Urban For. Urban Green. 2006, 4, 115–123. [Google Scholar] [CrossRef]
- European Commission. Energy. Available online: ec.europa.eu/energy/efficiency/buildings/buildings_en.htm (accessed on 27 March 2020).
- Gouldson, A.; Colenbrander, S.; Sudmant, A.; Papargyropoulou, E.; Kerr, N.; McAnulla, F.; Hall, S. Cities and climate change mitigation: Economic opportunities and governance challenges in Asia. Cities 2016, 54, 11–19. [Google Scholar] [CrossRef]
- European Commission. Directive 2010/31/EU of the European Parliament and of the Council of 19 May 2010 on the Energy Performance of Buildings; European Commission: Brussel, Belgium, 2010. [Google Scholar]
- European Commission. Directive 2012/27/EU of the European Parliament and of the Council of 25 October 2012 on Energy Efficiency; European Commission: Brussel, Belgium, 2012. [Google Scholar]
- Gouldson, A.; Colenbrander, S.; McAnulla, F.; Sudmant, A.; Kerr, N.; Sakai, P.; Hall, S.; Papargyropoulou, E.; Kuylenstierna, J. Exploring the economic case for climate action in cities. Glob. Environ. Change 2015, 35, 93–105. [Google Scholar] [CrossRef]
- Matsumoto, T.; Nutall, C.; Bathan, G.; Gouldson, A.; Laloe, F.; Pathak, M.; Robert, A.; Welch, D. National and sub-national integration. In Green Growth in Practice: Lessons from Country Experiences; Global Green Growth Institute; European Climate Foundation and Climate and Development Knowledge Network: Seoul, Korea, 2014. [Google Scholar]
- Wilson, E. Adapting to Climate Change at the Local Level: The Spatial Planning Response. Local Environ. 2006, 609–625. [Google Scholar] [CrossRef]
- Kavgic, M.; Mavrogianni, A.; Mumovic, D.; Summerfield, A.; Stevanovic, Z.; Djurovic-Petrovic, M. A review of bottom-up building stock models for energy consumption in the residential sector. Build. Environ. 2010, 45, 1683–1697. [Google Scholar] [CrossRef]
- Mastrucci, A.; Baume, O.; Stazi, F.; Leopold, U. Estimating energy savings for the residential building stock of an entire city: A GIS-based statistical down scaling approach applied to Rotterdam. Energy Build. 2014, 75, 358–367. [Google Scholar] [CrossRef]
- Evola, G.; Fichera, A.; Gagliano, A.; Marletta, L.; Nocera, F.; Pagano, A.; Palermo, V. Application of a mapping tool to plan energy saving at a neighborhood scale. Energy Procedia 2016, 101, 137–144. [Google Scholar] [CrossRef]
- Nouvel, R.; Mastrucci, A.; Leopold, U.; Baume, O.; Coors, V.; Eicker, U. Combining GIS-based statistical and engineering urban heat consumption models: Towards a new framework for multi-scale policy support. Energy Build. 2015, 107, 204–212. [Google Scholar] [CrossRef]
- Bentzen, J.; Engsted, T. A revival of the autoregressive distributed lag model inestimating energy demand relationships. Energy 2001, 26, 45–55. [Google Scholar] [CrossRef]
- Fonseca, J.A.; Schlueter, A. Integrated model for characterization of spatiotemporal building energy consumption patterns in neighborhoods and city districts. Appl. Energy 2015, 142, 247–265. [Google Scholar] [CrossRef]
- Caputo, P.; Costa, G.; Ferrari, S. A supporting method for defining energy strategies in the building sector at urban scale. Energy Policy 2013, 55, 261–270. [Google Scholar] [CrossRef]
- Theodoridou, I.; Karteris, M.; Mallinis, G.; Papadopoulos, A.M.; Hegger, M. Assessment of retrofitting measures and solar systems potential in urban areas using geographical information systems: Application to a Mediterranean city. Renew. Sustain. Energy Rev. 2012, 16, 6239–6261. [Google Scholar] [CrossRef]
- Howard, B.; Parshall, L.; Thompson, C.; Hammer, S.; Dickinson, J.; Modi, V. Spatial distribution of urban building energy consumption by end use. Energy Build. 2012, 45, 141–151. [Google Scholar] [CrossRef]
- Heiple, S.; Sailor, D.J. Using building energy simulation and geospatial modelling techniques to determine high resolution building sector energy consumption profiles. Energy Build. 2008, 40, 1426–1436. [Google Scholar] [CrossRef]
- European Commission. Directive 2007/2/EC, of 14 March 2007, establishing an Infrastructure for Spatial Information in the European Community (INSPIRE); European Commission: Brussel, Belgium, 2007. [Google Scholar]
- United Nations. World Urbanisation Prospects—Department of Economic and Social Affairs, Population Division; United Nations: New York, NY, USA, 2014. [Google Scholar]
- EUROSTAT. Urban Europe—Statistics on Cities, Towns and Suburbs; EUROSTAT: Brussel, Belgium, 2019. [Google Scholar]
- Instituto para la Diversificación y Ahorro de la Energía (IDEA). CALENER-VYP: Viviendas y Edificios Terciarios Pequeños y Medianos. Manual de Usuario. 2009. Available online: https://www.idae.es/uploads/documentos/documentos_CALENER_05_VYP_Manual_Usuario_A2009_A_4c6978f8.pdf (accessed on 28 March 2020).
- Hosseini, S.M.; Carli, R.; Dotoli, M. A Residential Demand-Side Management Strategy under Nonlinear Pricing Based on Robust Model Predictive Control. In Proceedings of the 2019 IEEE International Conference on Systems, Man and Cybernetics (SMC), Bari, Italy, 6–9 October 2019; pp. 3243–3248. [Google Scholar]
- Kampelis, N.; Ferrante, A.; Kolokotsa, D.; Gobakis, K.; Standardi, L.; Cristalli, C. Thermal comfort evaluation in HVAC Demand Response control. Energy Procedia 2017, 134, 675–682. [Google Scholar] [CrossRef]
- Carli, R.; Dotoli, M.; Pellegrino, R.; Ranieri, L. Using multi-objective optimization for the integrated energy efficiency improvement of a smart city public buildings’ portfolio. In Proceedings of the 2015 IEEE International Conference on Automation Science and Engineering (CASE), Gothenburg, Sweden, 24–28 August 2015; pp. 21–26. [Google Scholar]
- Diakaki, C.; Grigoroudis, E.; Kabelis, N.; Kolokotsa, D.; Kalaitzakis, K.; Stavrakakis, G. A multi-objective decision model for the improvement of energy efficiency in buildings. Energy 2010, 35, 5483–5496. [Google Scholar] [CrossRef]
© 2020 by the authors. Licensee MDPI, Basel, Switzerland. This article is an open access article distributed under the terms and conditions of the Creative Commons Attribution (CC BY) license (http://creativecommons.org/licenses/by/4.0/).


