Article

The Contribution of Sustainable Development Goals and Forest-Related Indicators to National Bioeconomy Progress Monitoring

1
Institute of Forest, Environmental and Natural Resource Policy, Department of Economics and Social Sciences, University of Natural Resources and Life Sciences, Vienna (BOKU), 1180 Vienna, Austria
2
European Forest Institute, Forest Policy Research Network, 1180 Vienna, Austria
3
Natural Resources Institute Finland (Luke), Yliopistokatu 6, 80100 Joensuu, Finland
*
Author to whom correspondence should be addressed.
Sustainability 2020, 12(7), 2898; https://doi.org/10.3390/su12072898
Submission received: 18 February 2020 / Revised: 27 March 2020 / Accepted: 3 April 2020 / Published: 5 April 2020

Abstract

:
A sustainable and circular bioeconomy is a pathway to the achievement of the United Nations Sustainable Development Goals (SDGs) by 2030 because the bioeconomy relates to a number of SDGs. We therefore focused on whether and how these SDGs are considered in national bioeconomy strategies, and on their indicator-based progress monitoring and assessment. This paper is based on eight countries that already have elaborated indicators in their national bioeconomy strategies. We analyzed the coverage of SDG issues in national bioeconomy strategies and the indicators used. We focused on how the different national indicators used to monitor the progress of the bioeconomy are related to the SDGs indicators and the already well established and widely applied intergovernmental regional or international forest-related indicators, as the forest sector is one of the key sectors for the development of a bioeconomy. Our material and methods are based on a document review and qualitative analysis of national bioeconomy strategies and their inherent indicator sets for progress monitoring. Based on our findings on the coverage of SDG-related issues of up to 14 out of the 17 SDGs in the bioeconomy strategies and of the high share of forest-related indicators within the bioeconomy indicators used, we derive recommendations for the further development of bioeconomy indicators. Our paper does not contribute to proposing the most suitable indicators, but it does encourage national and regional actors to carefully and holistically develop their bioeconomy monitoring systems using synergies from the already existing SDGs and forest monitoring processes.

1. Introduction

Since the United Nations Conference on Environment and Development, better known as the Earth Summit held in Rio de Janeiro, Brazil in 1992, sustainable development has been a very important, if not the most important, objective for the joint responsibility of meeting the needs of the present and to enable future generations to meet their own needs [1,2,3]. However, sustainable development was and is a vague term, with various approaches to definitions and methods to measure if development is actually sustainable [4,5,6]. The 17 UN Sustainable Development Goals (SDGs) with its 169 targets were announced in the 2030 Agenda for Sustainable Development “Transforming our World” [3], and adopted in September 2015 by 193 countries. They are seen as the holistic framework for addressing global socio-economic, ecological, and cultural challenges, which are especially related to poverty, inequality, climate change, environmental degradation, and peace and justice [7]. Thus, since 2015, the SDGs have been on both the global political agenda and at regional and national levels. The SDGs are not legally binding, but governments are expected to take ownership and develop national monitoring systems and frameworks for progress monitoring towards the achievement of the 17 Goals [8]. Although the SDGs have been formulated for universal application, their implementation and the SDGs’ indicator assessments reflect regional (e.g., European) and national-specific circumstances, implementation strategies, and policies [9]. The SDG indicators play a decisive role in promoting the SDGs to a wide range of stakeholders and decision makers, as well as in assessing and reporting on progress towards the goals and targets [8,10].
Alongside the SDGs’ endorsement, there has been a parallel development of regional, national, or sub-regional bioeconomy strategies, related policies, or initiatives [11,12,13,14]. Sustainable development is an integral part of the bioeconomy [15]. For example, the updated 2018 EU Bioeconomy Strategy seeks to accelerate the deployment of a sustainable European bioeconomy to maximize its contribution to the 2030 Agenda and its SDGs, as well as the Paris Agreement [16,17]. The recently initiated European Green Deal, the upcoming EU Common Agriculture Policy, and the upcoming EU Biodiversity Strategy will also be closely related to the 2030 Agenda, its SDGs, and bioeconomy-related strategies and policies [18,19,20]. The bioeconomy focus has shifted in the last decade from a relatively narrow economic concept that aims to replace fossil resources with renewable raw materials to a wider sustainable and circular bioeconomy concept. The aim of this wider concept is also to reduce and recycle renewable bio-based raw materials and to improve and innovate the way food, products, and materials are produced and consumed within healthy ecosystems [11,16,21,22,23]. The EU and its first regional bioeconomy strategy, which was already issued in 2012, has been a pioneer in paving the way for several European countries to follow with national strategies [24]. At the same time, the US also laid out strategic objectives in the US National Bioeconomy Blueprint to realize the entire potential of the US bioeconomy [25].
The EU Bioeconomy Strategy was thoroughly updated in 2018 [16]. It highlights the transformative potential of the bioeconomy to address numerous policy aims such as the decarbonization of energy markets, lower greenhouse gas emissions, sustainable management of natural resources, the reduction of social inequality, and meeting the food security demands of a growing global population. It also continues to highlight the delivery of long-established measures of economic growth and living standards [22]. The updated EU Bioeconomy Strategy also points out that sustainable bioeconomy activities are considered “key” to meeting the SDGs [16], p. 27. The updating of the EU Bioeconomy Strategy was a driver for many European countries to elaborate or express their intention of elaborating national bioeconomy strategies [11]. Many other countries and regions also orientate themselves towards EU bioeconomy-related activities—for example, presented to and discussed with government officials, industries, researchers, and other bioeconomy stakeholders from all over the world at the Global Bioeconomy Summits [26,27], the World Bioeconomy Forums [28], the International Bioeconomy Forum [29], or the European Bioeconomy Scene [30]. The discussion has often been led by EU countries that were particularly engaged in the bioeconomy at the time.
In this paper, we therefore rely on the explanation of the bioeconomy and the respective sectors it covers as provided in the updated EU Bioeconomy Strategy from 2018: “Sustainable and circular bioeconomy covers all sectors and systems that rely on biological resources (animals, plants, micro-organisms and derived biomass, including organic waste), their functions and principles. It includes and interlinks: land and marine ecosystems and the services they provide; all primary production sectors that use and produce biological resources (agriculture, forestry, fisheries and aquaculture); and all economic and industrial sectors that use biological resources and processes to produce food, feed, bio-based products, energy and services” [16], p. 4.
At global level, the UN has also emphasized that a sustainable and circular bioeconomy is seen as a pathway to achieve the SDGs on affordable and clean energy (7), decent work and economic growth (8), sustainable cities and communities (11), responsible consumption and production (12), climate action (13), life below water (14), and life on land (15) [31]. However, we assumed, and in the course of our research discovered, that some of the other SDGs are also closely related, and its achievement can be supported by a sustainable and circular bioeconomy (cf. Chapter 3 Results).
Since as early as 2002, but with a focus on the last 10 years, more than 40 countries have developed strategies to expand and promote their bioeconomies [13,14,32,33]. Although the national bioeconomy strategies issued before 2015 used diverse terms, such as bio-based economy, bioeconomy, or green economy, the term “sustainable and/or circular bioeconomy” has clearly prevailed in recent years [14,16,17]. For easier comprehension, we refer in the following only to the bioeconomy instead of the sustainable and circular bioeconomy or circular economy, which are used synonymously.
The monitoring and evaluation of the success of measures taken to achieve the strategy’s objectives [12,34,35,36] are decisive for the successful implementation of each strategy. Relevant and expressive indicators therefore provide evidence for interested citizens, researchers, bioeconomy stakeholders (e.g., the bioeconomy primary sectors or the bio-based industry), national and regional agencies (e.g., EU Agencies), and national and regional policy and decision makers to facilitate their decision making. The inherent complexity of the bioeconomy and the high ambition of national and regional bioeconomy strategies means progress towards the bioeconomy needs to be regularly monitored, based on indicators with easily available, reliable, and harmonized data and information. This provides a holistic view of all the dimensions of sustainability in every bioeconomy sector and highlights the eventual trade-offs between them [37]. However, there has been no commonly agreed set of national indicators to measure the bioeconomy at regional (e.g., EU) or global level until now [12,34,38]. Yet, there are some recent studies on bioeconomy indicator sets [12,34,39,40], and related work is ongoing at EU level [37]. Wolfslehner, et al. [36] stress that bioeconomy-related information needs are multisectoral, interconnected, and integrative across value chains. The European Commission review report of the EU Bioeconomy Strategy highlighted that “new actions are needed to develop relevant indicators and scientific evidence for policy making, and to implement a more holistic monitoring and assessment framework” [38], p. 42. Based on rich experience of indicators for sustainable forest management (SFM) [35,41,42,43], which cover all aspects of the forest-based value chain [40], and the recently developed SDG indicators [44], this paper supports the development of such a holistic monitoring and assessment framework. The focus of our respective research interest is especially on forest-related bioeconomy indicators and their link to the already well-elaborated indicators for SFM.

Objectives

As the introduction describes, sustainable development is an integral part of the bioeconomy. With the adoption of the global SDGs in 2015 and the SDG indicator framework in 2017, 193 countries are demanded to implement the SDG indicators at national level [45]. Based on the following three research questions, we analyze, in this paper, whether SDG issues are considered in national bioeconomy strategies, and whether national bioeconomy indicators relate to Sustainable Development Goals, targets, and indicators, as well as to the already well developed indicators for SFM.
1: Is progress towards bioeconomy strategy objectives measured by using indicators?
2: Contain the studied national bioeconomy strategies, developed and adopted after 2015, references to the SDGs, their targets and indicators?
3: As the forest sector is one of the key sectors for the development of a bioeconomy, do the national bioeconomy indicators resemble the respective intergovernmental regional or international indicators for SFM?
Based on the results, we derive recommendations for the further development of national bioeconomy indicators either to be used in the review process of a national bioeconomy strategy, or for the development process of new bioeconomy strategies.

2. Materials and Methods

2.1. Review of National Bioeconomy Strategies and Related Indicators

The materials systematically analyzed in this paper are found in Scopus databases which we screened for scientific publications about bioeconomy strategies as well as web-based desk research into every website related to national bioeconomy strategies or programs. Our key selection principle was to search for all publicly available, officially adopted national bioeconomy strategies or programs (in the following, referred to as national bioeconomy strategies) in line with the explanation of the bioeconomy which we presented in the Introduction. The search strings used for the document search comprised:
Title: bioeconomy strategy OR bio-economy strategy OR bioeconomy program OR bioeconomy programme OR bio-economy program OR bio-economy programme OR circular economy strategy OR circular economy program OR circular economy programme. We also searched for the respective terms in French, Spanish, and Portuguese to cover African and South American countries. Timespan: 2002 until August 2019.
Our first intention was to focus only on European countries, but it emerged that only some European countries had developed national bioeconomy strategies thus far and only five of these official strategies (in Denmark, Finland, Italy, Spain, and the United Kingdom) also contained bioeconomy indicators. We therefore expanded our scope to all national bioeconomy strategies from all over the world from 2002, when the first national bioeconomy strategy was adopted, until August 2019.
We also requested respective information from bioeconomy experts of the countries not already recorded in the above-mentioned overviews [13,14,32,33], for example, in some Scandinavian countries and the Baltic States and in the Caucasus and Central Asia. Most of the resulting strategies of 46 countries (cf. Figure 1) focused on related sub-aspects, such as strategies for biotechnology, bioenergy, or bioeconomy research and innovation strategies, which we do not address in this paper. We also considered available national bioeconomy strategies in national languages other than English. Finally, we also included the bioeconomy strategies of Malaysia, South Africa and the United States, because they also contain respective bioeconomy indicators for progress monitoring (cf. Figure 1, Table 1, Appendix A Table A1).
Alongside the focus on national bioeconomy strategies, the second selection criterion for our underlying materials was the existence of a related indicator set or system for appropriate progress monitoring and assessment of actions. The screening of the national bioeconomy strategies revealed that only some also contained indicators for monitoring the progress of the bioeconomy. Our focus is only on the national bioeconomy strategies with related indicators for progress monitoring and assessment. Thus, in total, we could identify eight national bioeconomy strategies which also contained related indicators to monitor progress towards the bioeconomy (see Figure 1, Table 1 and Appendix A Table A1 for list of indicators). Of these eight national bioeconomy strategies, the United Kingdom’s bioeconomy strategy [46] uses measures as a synonym for indicators, but we only used the term indicator in what follows.

2.2. Review of Bioeconomy Indicator Projects

The eight national bioeconomy strategies selected comprise a total of 99 bioeconomy indicators. To obtain a more comprehensive picture of the national bioeconomy indicators developed so far, we expanded our analysis and included project studies on bioeconomy indicators as a reference. Again, our focus was exclusively on indicator studies of the bioeconomy and not on related sub-aspects like biomass [53] or green growth [54]. We identified and included the following three bioeconomy indicator studies, which were published before August 2019:
Key indicators for forest bioeconomy [40]. This EFI From Science to Policy publication was the first study of bioeconomy indicators relevant to a dedicated sector.
Synthesis on bioeconomy monitoring systems in the EU Member States [12]. The MontBioeco project focused on some of the existing indicator sets in the EU and on suitable bioeconomy indicators based on country inputs.
Framework for measuring size and development of bioeconomy with a list and detailed description of bioeconomy indicators [39]. The indicator list of the Biomonitor project refers to bioeconomy-related sectors and the most suitable indicators for progress measurement.
All three bioeconomy indicator projects were conducted, and the related indicator sets were elaborated, after the issuing of the SDGs in 2015. The indicators from these projects served to cross-check whether the SDGs and bioeconomy issues covered by these indicator sets deviated significantly from those covered by national bioeconomy indicator sets.

2.3. Assignment of Bioeconomy Indicators to the Related SDGs, their Targets, and Indicators and Screening of the National Bioeconomy Strategies for SDG-related Wording

We assigned a total of 99 national bioeconomy indicators from the eight national bioeconomy strategies, and 67 indicators from the three bioeconomy indicator projects (cf. Appendix A Table A1 and Table A2) for the respective SDGs’ indicators. This was done based on the experience of the authors and according to thematic congruence and comprises the assignment of bioeconomy indicators to the thematically similar SDGs’ indicators by one author and the review by the other author. National bioeconomy indicators were often similar or congruent in terms of content to the SDGs’ indicators (cf. Figure 2). Sometimes, the national bioeconomy indicators cover only partial aspects of the SDGs’ indicators, for example, “Agriculture value added” versus “GDP”. Because of this partial congruence, we also undertook a positive assignment. National bioeconomy indicators were sometimes available (on health products, innovation or greenhouse gas emissions), but there were no respective SDGs’ indicators. However, the issues were addressed by SDG targets (3.3, 9.5, and 13.2). In this regard, the bioeconomy indicators were assigned to the thematically related SDG targets. We have cross-checked this selection a second time. Only five national bioeconomy indicators could not have been assigned to any SDG issue (cf. Chapter 3.1). An assignment of one or more bioeconomy indicators to an SDG indicator or SDG target is an indication of the bioeconomy relevance of the respective SDG.
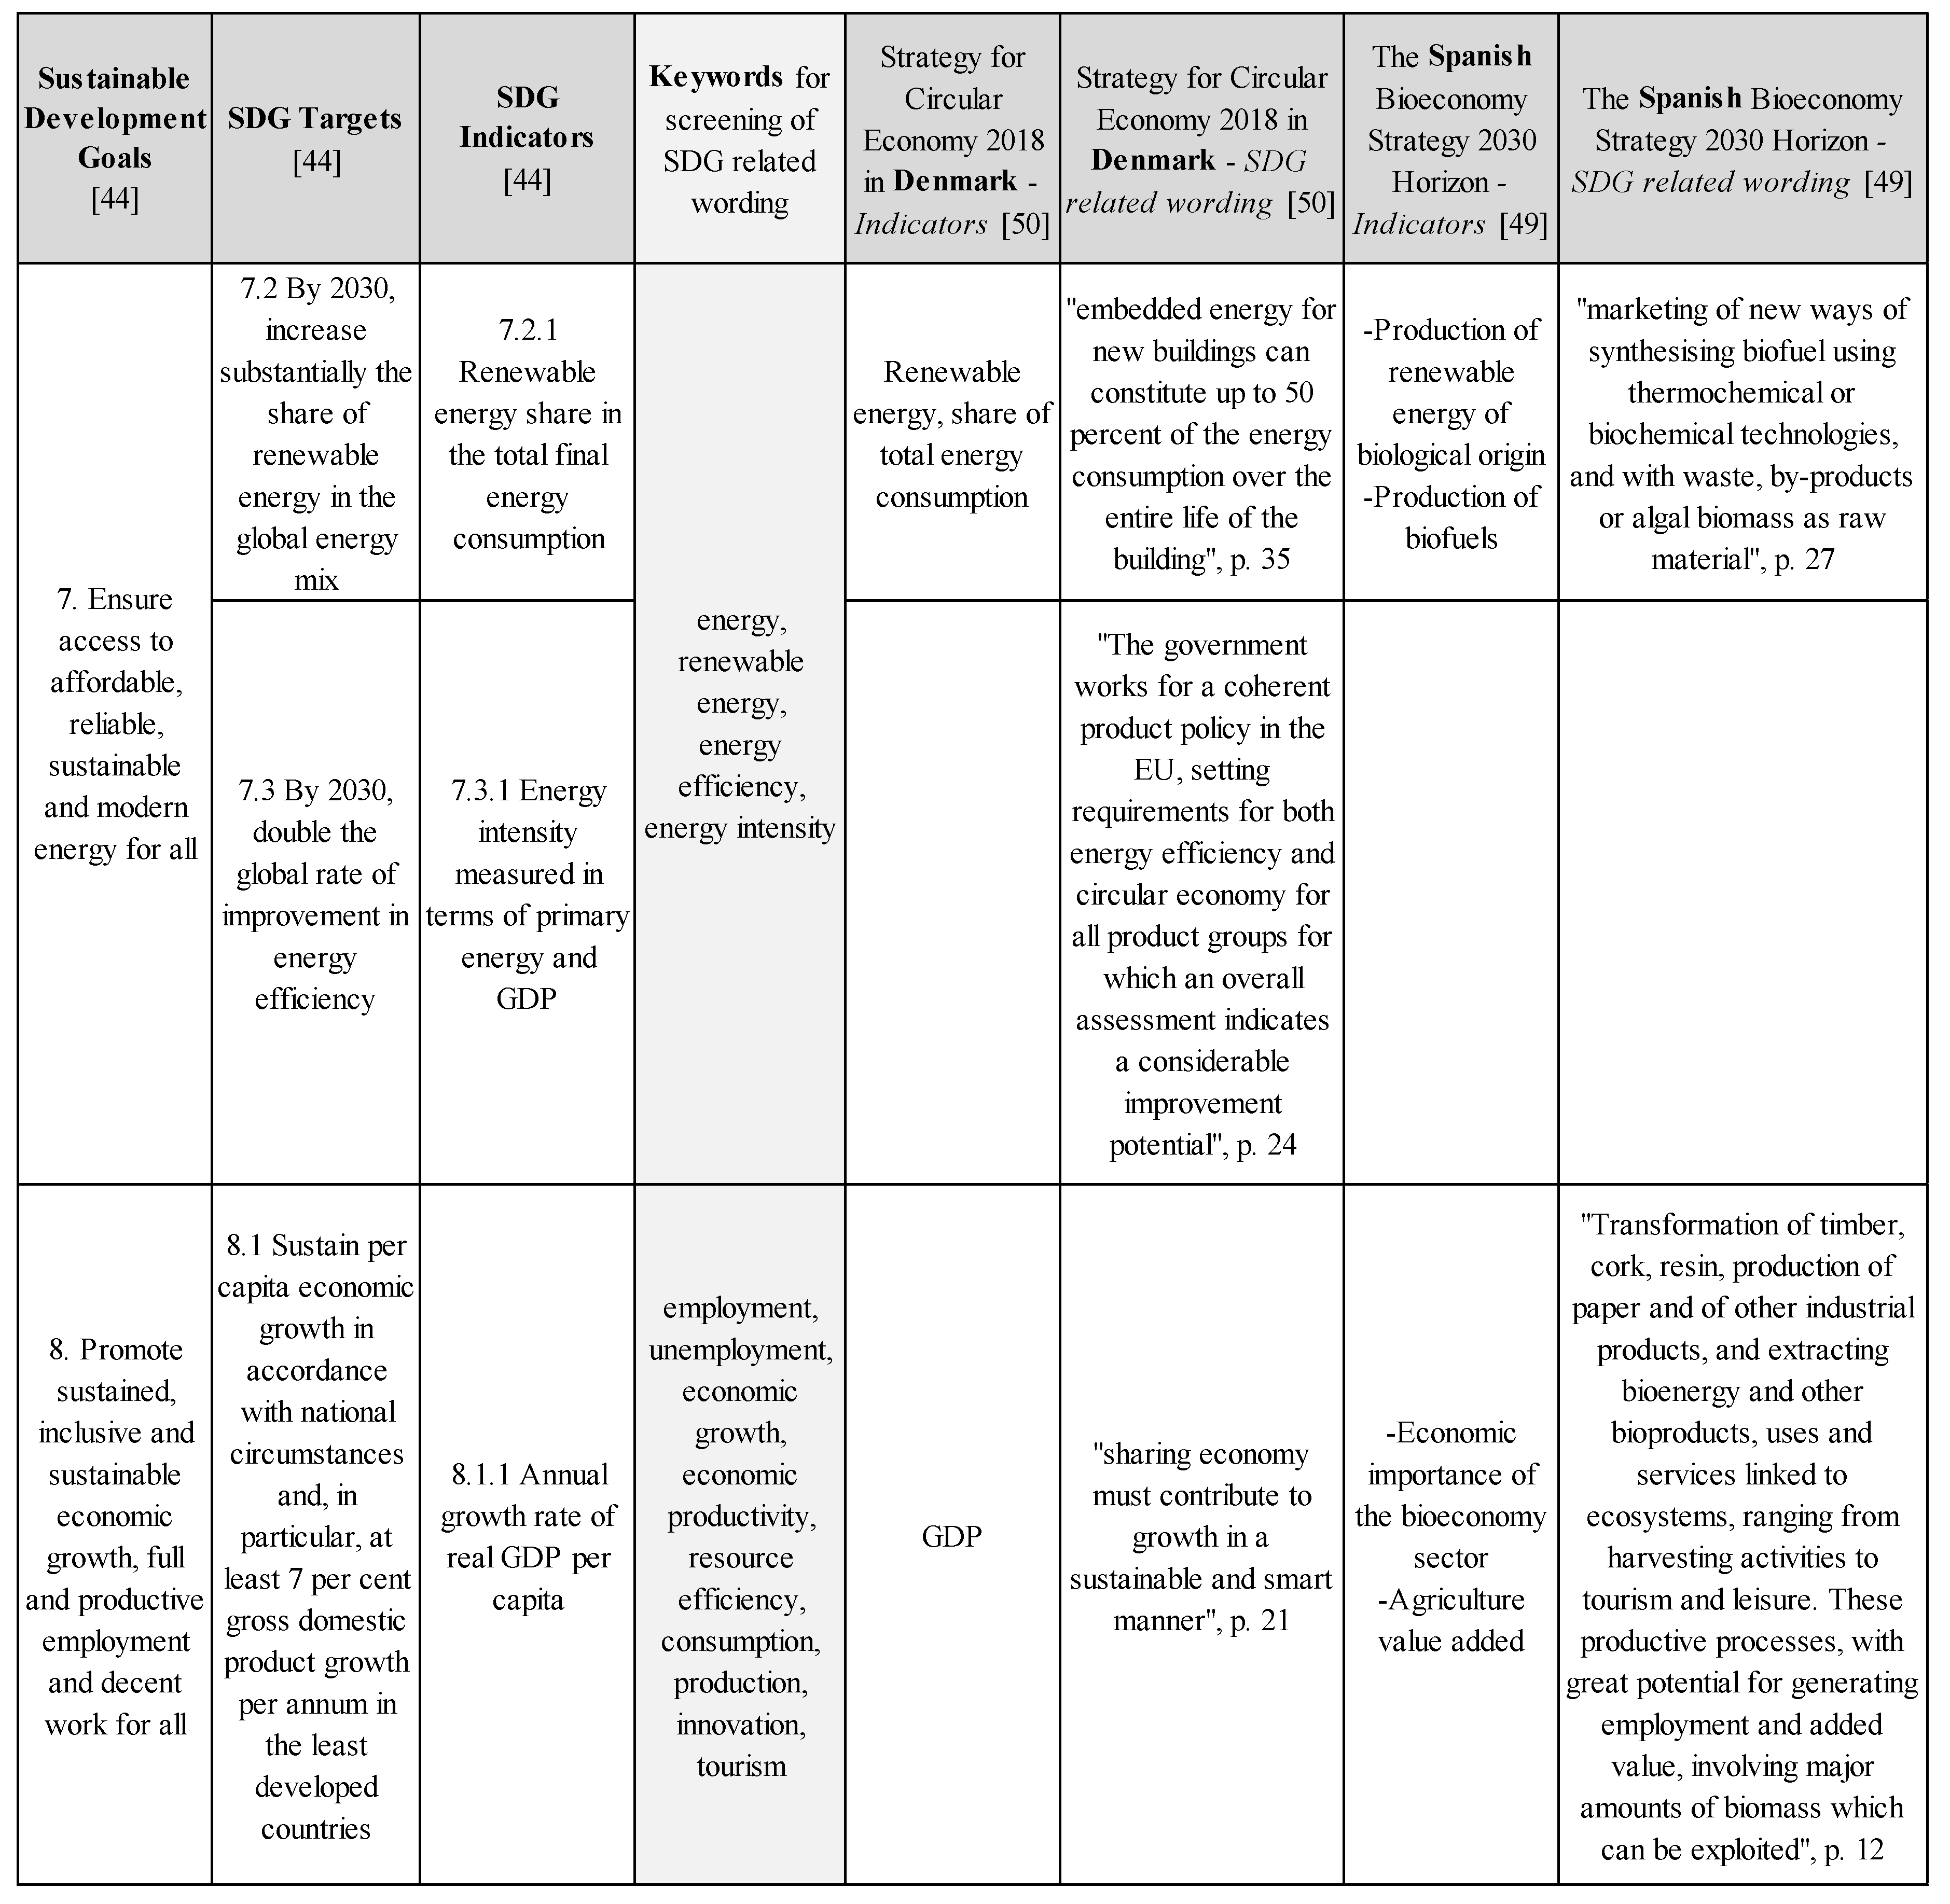
In parallel, we also conducted a qualitative, systematic text analysis, screening the eight national bioeconomy strategies if they covered the various aspects of the 17 SDGs. This was conducted using a detailed, intersubjective, reproducible, and computer-assisted qualitative keyword search for SDG-related wording (cf. Table 2). The keywords were extracted from the SDGs, their targets, and indicators. The qualitative text analysis was done according to Bauer [55], and in line with Flick’s reliability and validity criteria for qualitative research [56] (pp. 489–499). Figure 2 displays an excerpt of our conducted approach. The purpose of the keyword search was not to gain an overview of how often the keywords were addressed, but whether the key word issues were addressed at all and if there were respective indicators for progress monitoring. A systematic qualitative rather than a quantitative approach was therefore chosen for our analysis. The analysis resulted in an overview of SDG issues mentioned in the national bioeconomy strategies in relation to the actual use of respective indicators (cf. chapter 3.1).

2.4. Comparison with Indicators for Sustainable Forest Management (SFM)

Indicators for SFM had already been developed in the 1990s; there is a wealth of experience with these indicators and their underlying data [35,42]. They cover many aspects of the bioeconomy [36]. However, in the first decade the elaboration of indicators for SFM took place only within the forest sector and mainly based on data available through national forest inventories. In the 2000s, several national and intergovernmental indicator sets for SFM were revised with the broad participation of related sectors such as environment, energy, water management, and others covering more bioeconomy-related aspects. The respective data availability was secured by active regional and international organizations and processes such as UNECE/FAO, ITTO, FOREST EUROPE, and the Montréal Process [41].
In this respect, we also focused on the question of whether the identified bioeconomy indicators corresponded to indicators of the most common international and regional indicator sets for SFM. Our basis was the synopsis of indicators for SFM presented in Linser and O’Hara [43]. We distinguished between forest-related indicators, in which data from the forest sector can contribute to progress monitoring, and other bioeconomy indicators, which lack a forest-related component. The approach was the same as described in Chapter 2.3. Figure A1 of Appendix A displays an excerpt from our analysis.

3. Results

3.1. The Bioeconomy and its Derived Relationship with the SDGs

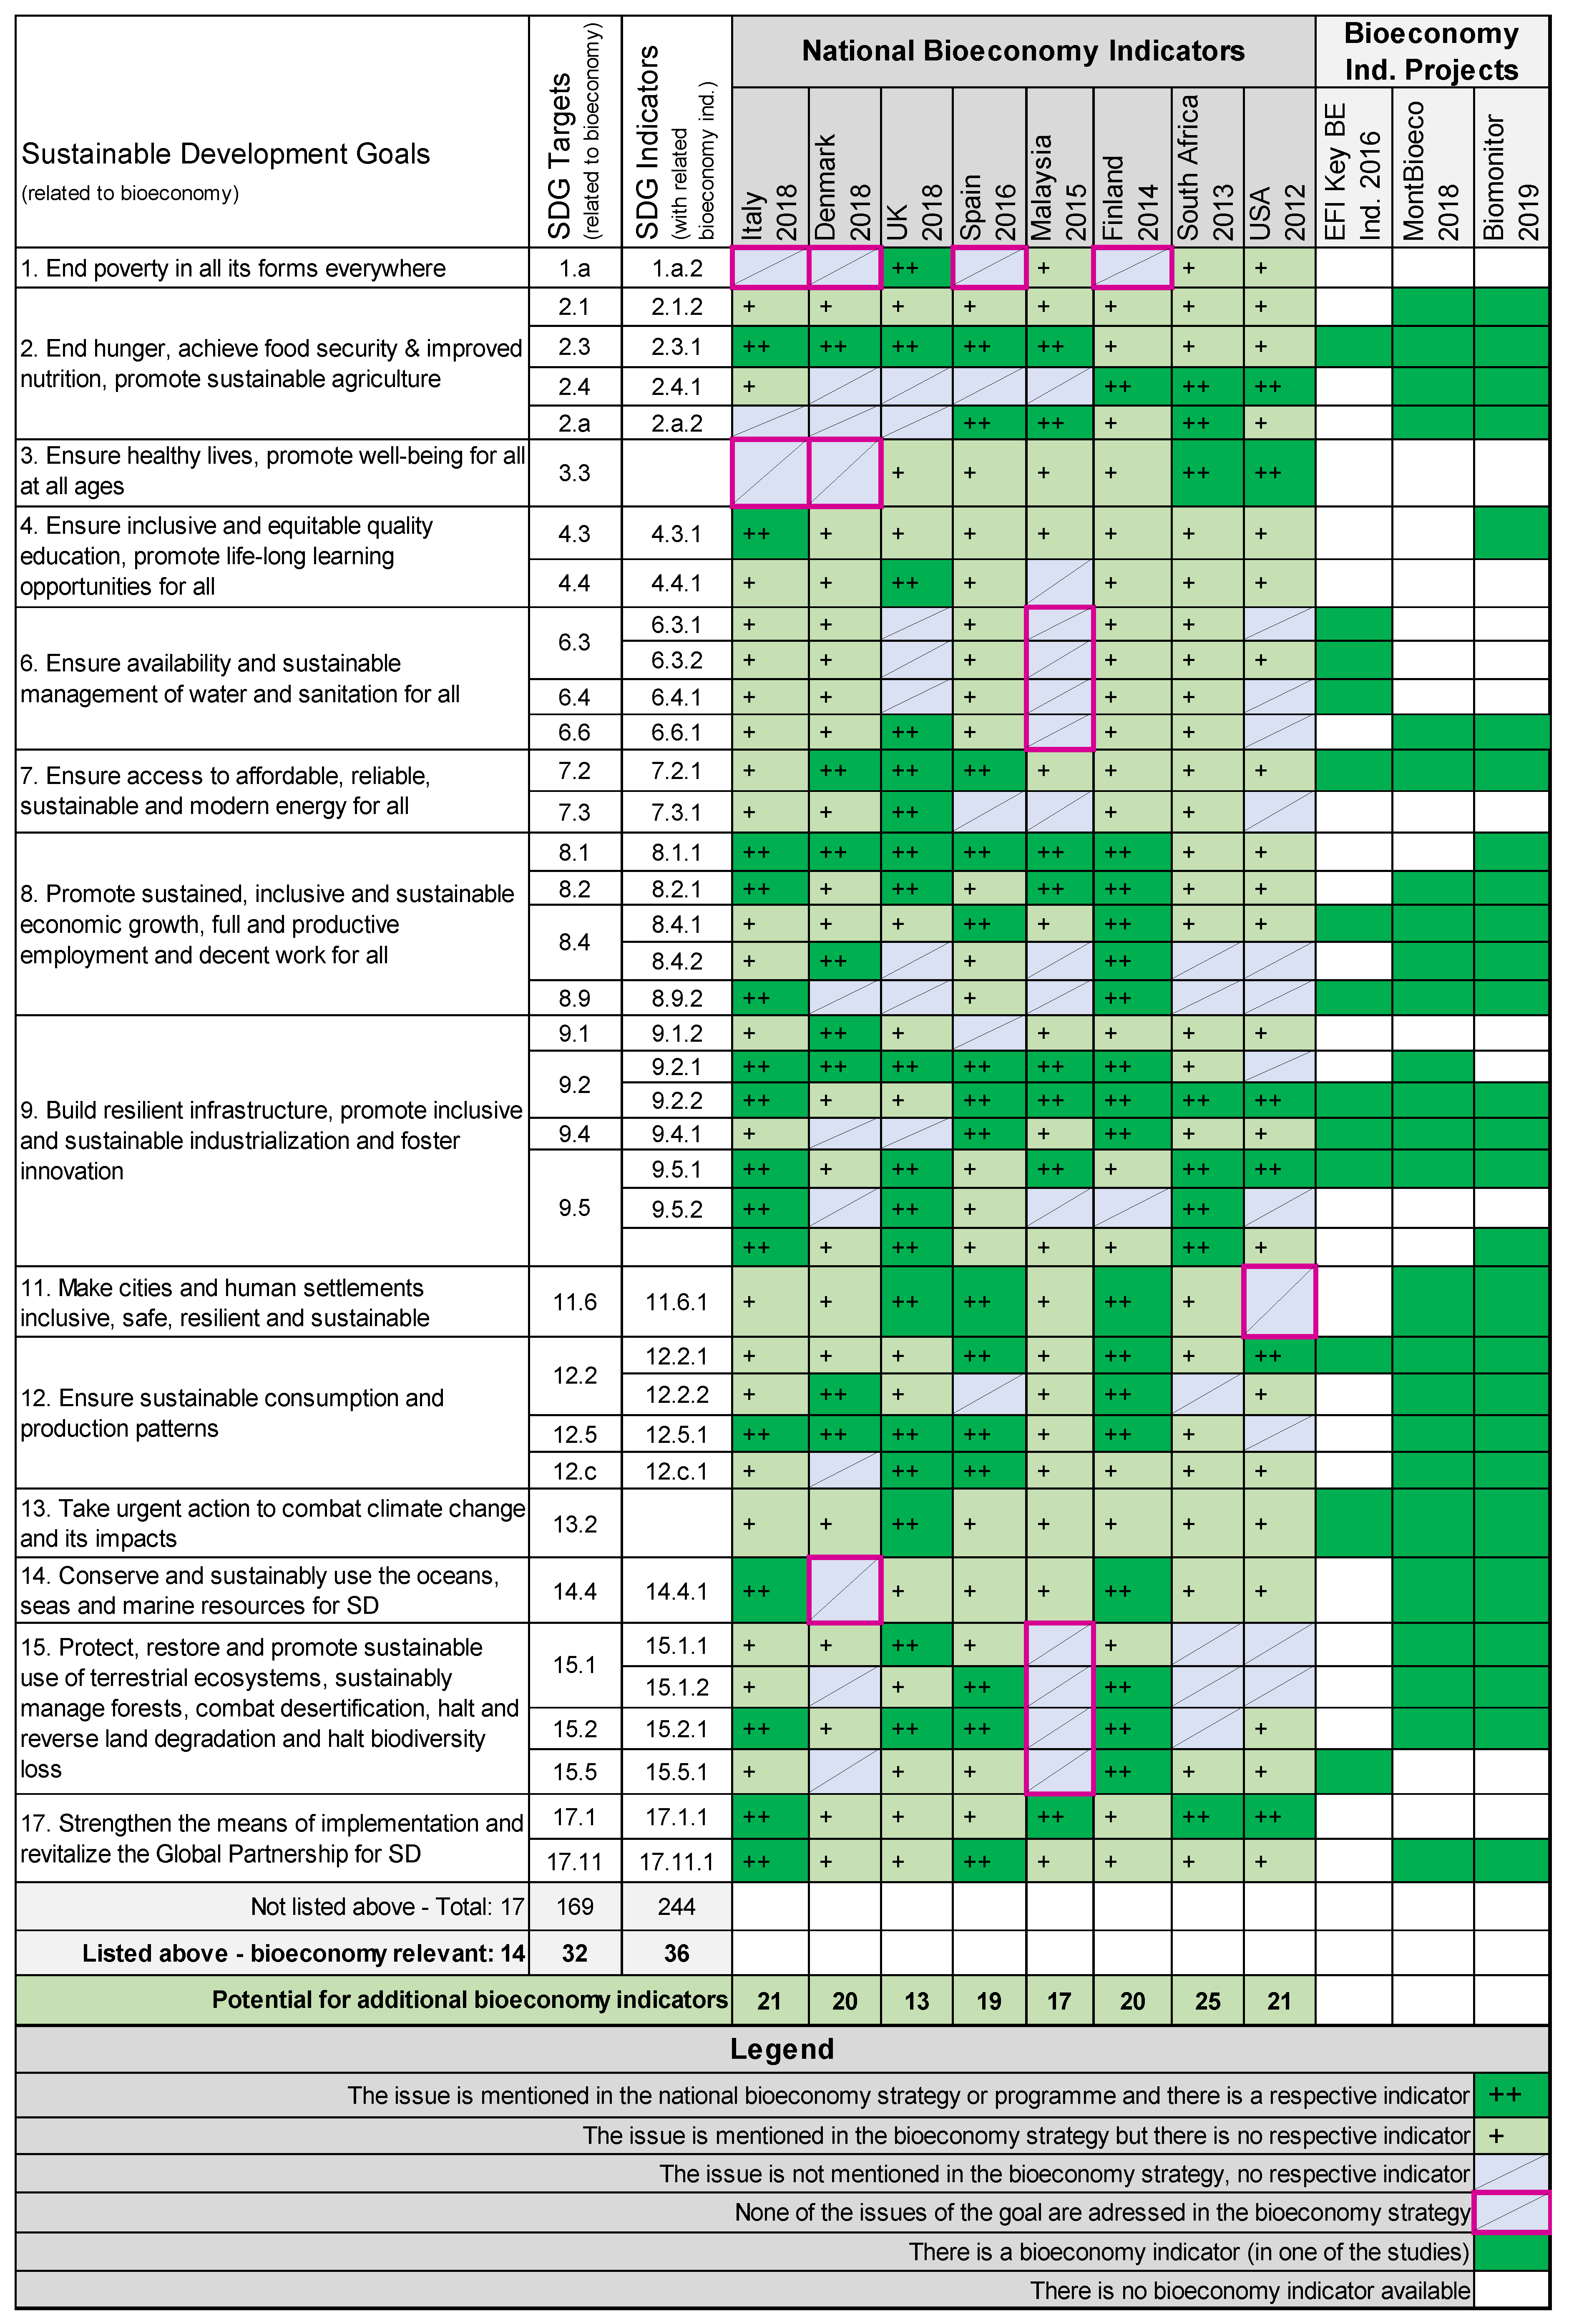
Using the SDG-related keyword search approach in eight selected national bioeconomy strategies and the assignment of bioeconomy indicators to SDG indicators or targets, we identified 14 out of 17 SDGs which were relevant to the bioeconomy (cf. Figure 3). However, only some of the respective SDG targets and a range of their SDG indicators were classified as relevant to the bioeconomy by the approach applied. Therefore, Figure 3 presents only those SDGs, their targets, and indicators which were identified as relevant to the bioeconomy.
According to our analysis, 36 out of 244 SDG indicators, 32 out of 169 SDG targets, and 14 out of 17 SDGs were relevant to the bioeconomy, because either the national bioeconomy indicators or the indicators from the bioeconomy projects corresponded to the SDG indicators or targets.
Figure 3 also shows that according to our text analysis, SDG issues are often mentioned in the national bioeconomy strategies, but there are no respective indicators for progress monitoring and assessment. The overview of SDG coverage and gaps in Figure 3 reveals that potential indicators exist either in one of the other countries’ bioeconomy strategies or in one of the three indicator projects. Overall, there is potential for between a further 13 and 25 additional indicators to be included in the various indicator sets of the eight national bioeconomy strategies (cf. Figure 3). The pool of indicators from the eight national bioeconomy indicator sets and the three bioeconomy projects (cf. Appendix A Table A1 and Table A2) may act as an orientation to serve both the potential indicator needs of the surveyed strategies and the new strategies to be developed.

3.1.1. Assignment Peculiarities

There is a total of 166 indicators from the eight national bioeconomy strategies and three bioeconomy projects. As several indicators are quite similar—for example, most countries have socio-economic indicators on employment, resource productivity, investments, and GDP/GVA—the majority of the 166 bioeconomy indicators could have been assigned to 36 SDG indicators. Only five out of 166 national bioeconomy indicators could not have been assigned to any SDGs, targets, or indicators, namely:
-
Population growth (indicator for Italy)
-
Population 15–65 years (indicator for Italy)
-
Types of biotechnology used by firms (indicator for South Africa)
-
Number of technology-transfer transactions (indicator for South Africa)
-
Sustainability threshold levels for Bioeconomy Technologies (indicator for the Biomonitor Project)
On three occasions, there were no corresponding SDG indicators to assign the national bioeconomy indicators, so we assigned them to the related SDG target. This concerns the following national bioeconomy indicators:
-
“Pharmaceutical industry productivity and number of regulatory approvals for health products”, assigned to SDG target 3.3;
-
Various innovation indicators, assigned to SDG target 9.5;
-
Indicators on climate change mitigation and adaptation such as carbon emissions, carbon sequestration, climate footprint, etc., assigned to SDG target 13.2.

3.1.2. Frequency of Assignment

The six SDG indicators with frequent assignments to related national bioeconomy indicators (2.3.1 Volume of production, 8.1.1 Annual growth rate of real GDP, 9.2.1 Manufacturing value added, 9.2.2 Manufacturing employment, 9.5.1 Research and development expenditure, 12.5.1 National recycling rate) are all related to socio-economic aspects or the circularity of the bioeconomy. The related data is broadly available and has often been monitored for decades. This underpins the findings of Puelzl, et al. [57] that bioeconomy strategies primarily focus on economic objectives.
The 19 SDG indicators with only occasional assignments to related national bioeconomy indicators comprise many relatively new indicators, such as those related to climate change or disease incidences, where data collection mechanisms are often yet to be established, and indicators are therefore not chosen as frequently for reporting. This also applies to aggregated indicators like the material footprint, which is only expressive and reliable if all the underlying data is monitored [58].
Ecological indicators are generally rare, either within the SDGs or within the bioeconomy indicator sets, and are only found under SDGs 6, 13, 14, and 15 respectively in bioeconomy indicators related to the forest, agriculture, aquaculture, and fisheries sectors. Data for many of these indicators are often not collected regularly, and data quality is also lacking (e.g., for the Red List Index) [59].

3.1.3. Different Relevance of the SDGs for National Bioeconomies

Goal 1, “End poverty”, is not addressed in the screened national bioeconomy strategies of the European countries, except for the United Kingdom [51]. Goal 3, “Good health and well-being”, is also of minor importance in the European national bioeconomy strategies which we scrutinized. In its national bioeconomy strategy, Malaysia [48] does not refer to Goal 6, “Clean water and sanitation”. The US National Bioeconomy Blueprint [25] does not address Goal 11, “Sustainable cities and communities”. Denmark, a country with 7314 km of coastline [60], does not refer to Goal 14, “Life below water”, in its Strategy for Circular Economy [50]. It is also striking that Malaysia, a country with a forest area share of 63% [61], makes no reference in its Bioeconomy Transformation Programme [48] to the issues of Goal 15, “Life on land”, with several targets focusing on sustainable forest management and biodiversity [62].
Most of the 26 SDG indicators for SDG 3, “Health and well-being”, are not obviously related to the bioeconomy (like various mortality ratios). This is reflected by the correspondence of only two bioeconomy indicators to one SDG 3 target. However, the issue of health and well-being is reflected in six of the eight national bioeconomy strategies.
SDG 6 “Clean Water and Sanitation” is the only SDG to which only one respective national bioeconomy indicator was assigned. However, the corresponding text analysis of the national bioeconomy strategies has proven the issue’s importance for seven countries. The gap identification (cf. Figure 3) shows that possible corresponding indicators are available from the three indicator projects (cf. also Appendix A Table A2).
Issues related to SDG 13, “Climate action”, are addressed in all eight national bioeconomy strategies, but are only reflected in a respective indicator of the United Kingdom [51].
Five of the eight underlying national bioeconomy strategies were published after the adoption of the SDGs in 2015. However, only the Italian bioeconomy strategy [52] refers in particular to seven of the 17 SDGs. The UN has also highlighted that the bioeconomy has particular potential to achieve seven SDGs [31]. However, these deviate from Italy’s choice of seven bioeconomy-relevant SDGs. The Global Bioeconomy Summit emphasized that a sustainable bioeconomy would make essential contributions to achieving the SDGs, because its potential was particularly geared to eight SDGs [27]. Table 3 presents the different bioeconomy and SDG relationships, including our own findings, which show more relations between the bioeconomy and the SDGs than previously published.
Our analysis confirms the selection of bioeconomy-relevant SDGs by Italy, the UN, and the Global Bioeconomy Summit (cf. Table 3). Nevertheless, we found references in the various national bioeconomy strategies and related indicators to several more SDGs. This results in a total of 14 out of 17 SDGs with some relevance for the bioeconomy (cf. Figure 3 and Table 3). Only the South African bioeconomy strategy [46] addresses issues of all 14 SDGs, without, however, mentioning the SDG context. The other seven national bioeconomy strategies address between 11 and 13 SDGs (cf. Table 3).
Figure 3 also allows a comparison of the deviating SDG coverage of bioeconomy indicators of the three indicator projects and eight national bioeconomy strategies. The three bioeconomy indicator projects provide no indicators concerning the related issues of SDG 1, “End poverty”, and SDG 3, “Good health and well-being”. Furthermore, they provide a range of indicators for SDG 6, “Clean water and sanitation”, whereas only one respective national indicator was assigned (see above). For SDG 13, “Climate action”, the indicator projects also offer several indicators in contrast to the bioeconomy strategies, which all raised the SDG 13 issues but with only one respective indicator for progress monitoring.
Neither the eight national bioeconomy strategies and related indicator sets nor the indicator projects contained any reference (indicator or keyword matches) to the following three SDGs: 5, “Achieve gender equality and empower all women and girls”; 10, “Reduce inequality within and among countries”; 16, “Promote peaceful and inclusive societies for sustainable development, provide access to justice for all and build effective, accountable and inclusive institutions at all levels”.
The results presented above can be seen as an indication of a considerable interrelation between SDG indicators and bioeconomy indicators. In general, the indicators of the eight national bioeconomy indicator sets, and the three bioeconomy indicator projects represent a well-filled pool of possible indicators to amend the regional, national, and sub-regional bioeconomy indicator sets or to elaborate new bioeconomy indicator sets.

3.2. Distribution of Forest-related and other Bioeconomy Indicators

Forests provide multiple ecosystem services that are decisive for human health and well-being, and provide a principal renewable resource. They are, therefore, of major importance for reaching the SDGs [65,66,67]. However, forests are only explicitly mentioned in two SDGs: 15, “Life on land”, which targets sustainable forest management; and 6, “Clean water and sanitation”, which requests protection and restoration of forests in one of its targets.
The forest sector was a pioneer in the development and application of progress monitoring and sustainability assessments by indicators. The first indicator sets were already developed in the 1990s for every world region and are often also applied at national level in many countries [35,41,42]. Concerning bioeconomy indicators, the forest sector was also the first to propose sector-specific bioeconomy indicators [36,40]. We were, therefore, also interested in the bioeconomy indicators’ relationship with the forest-related indicators.
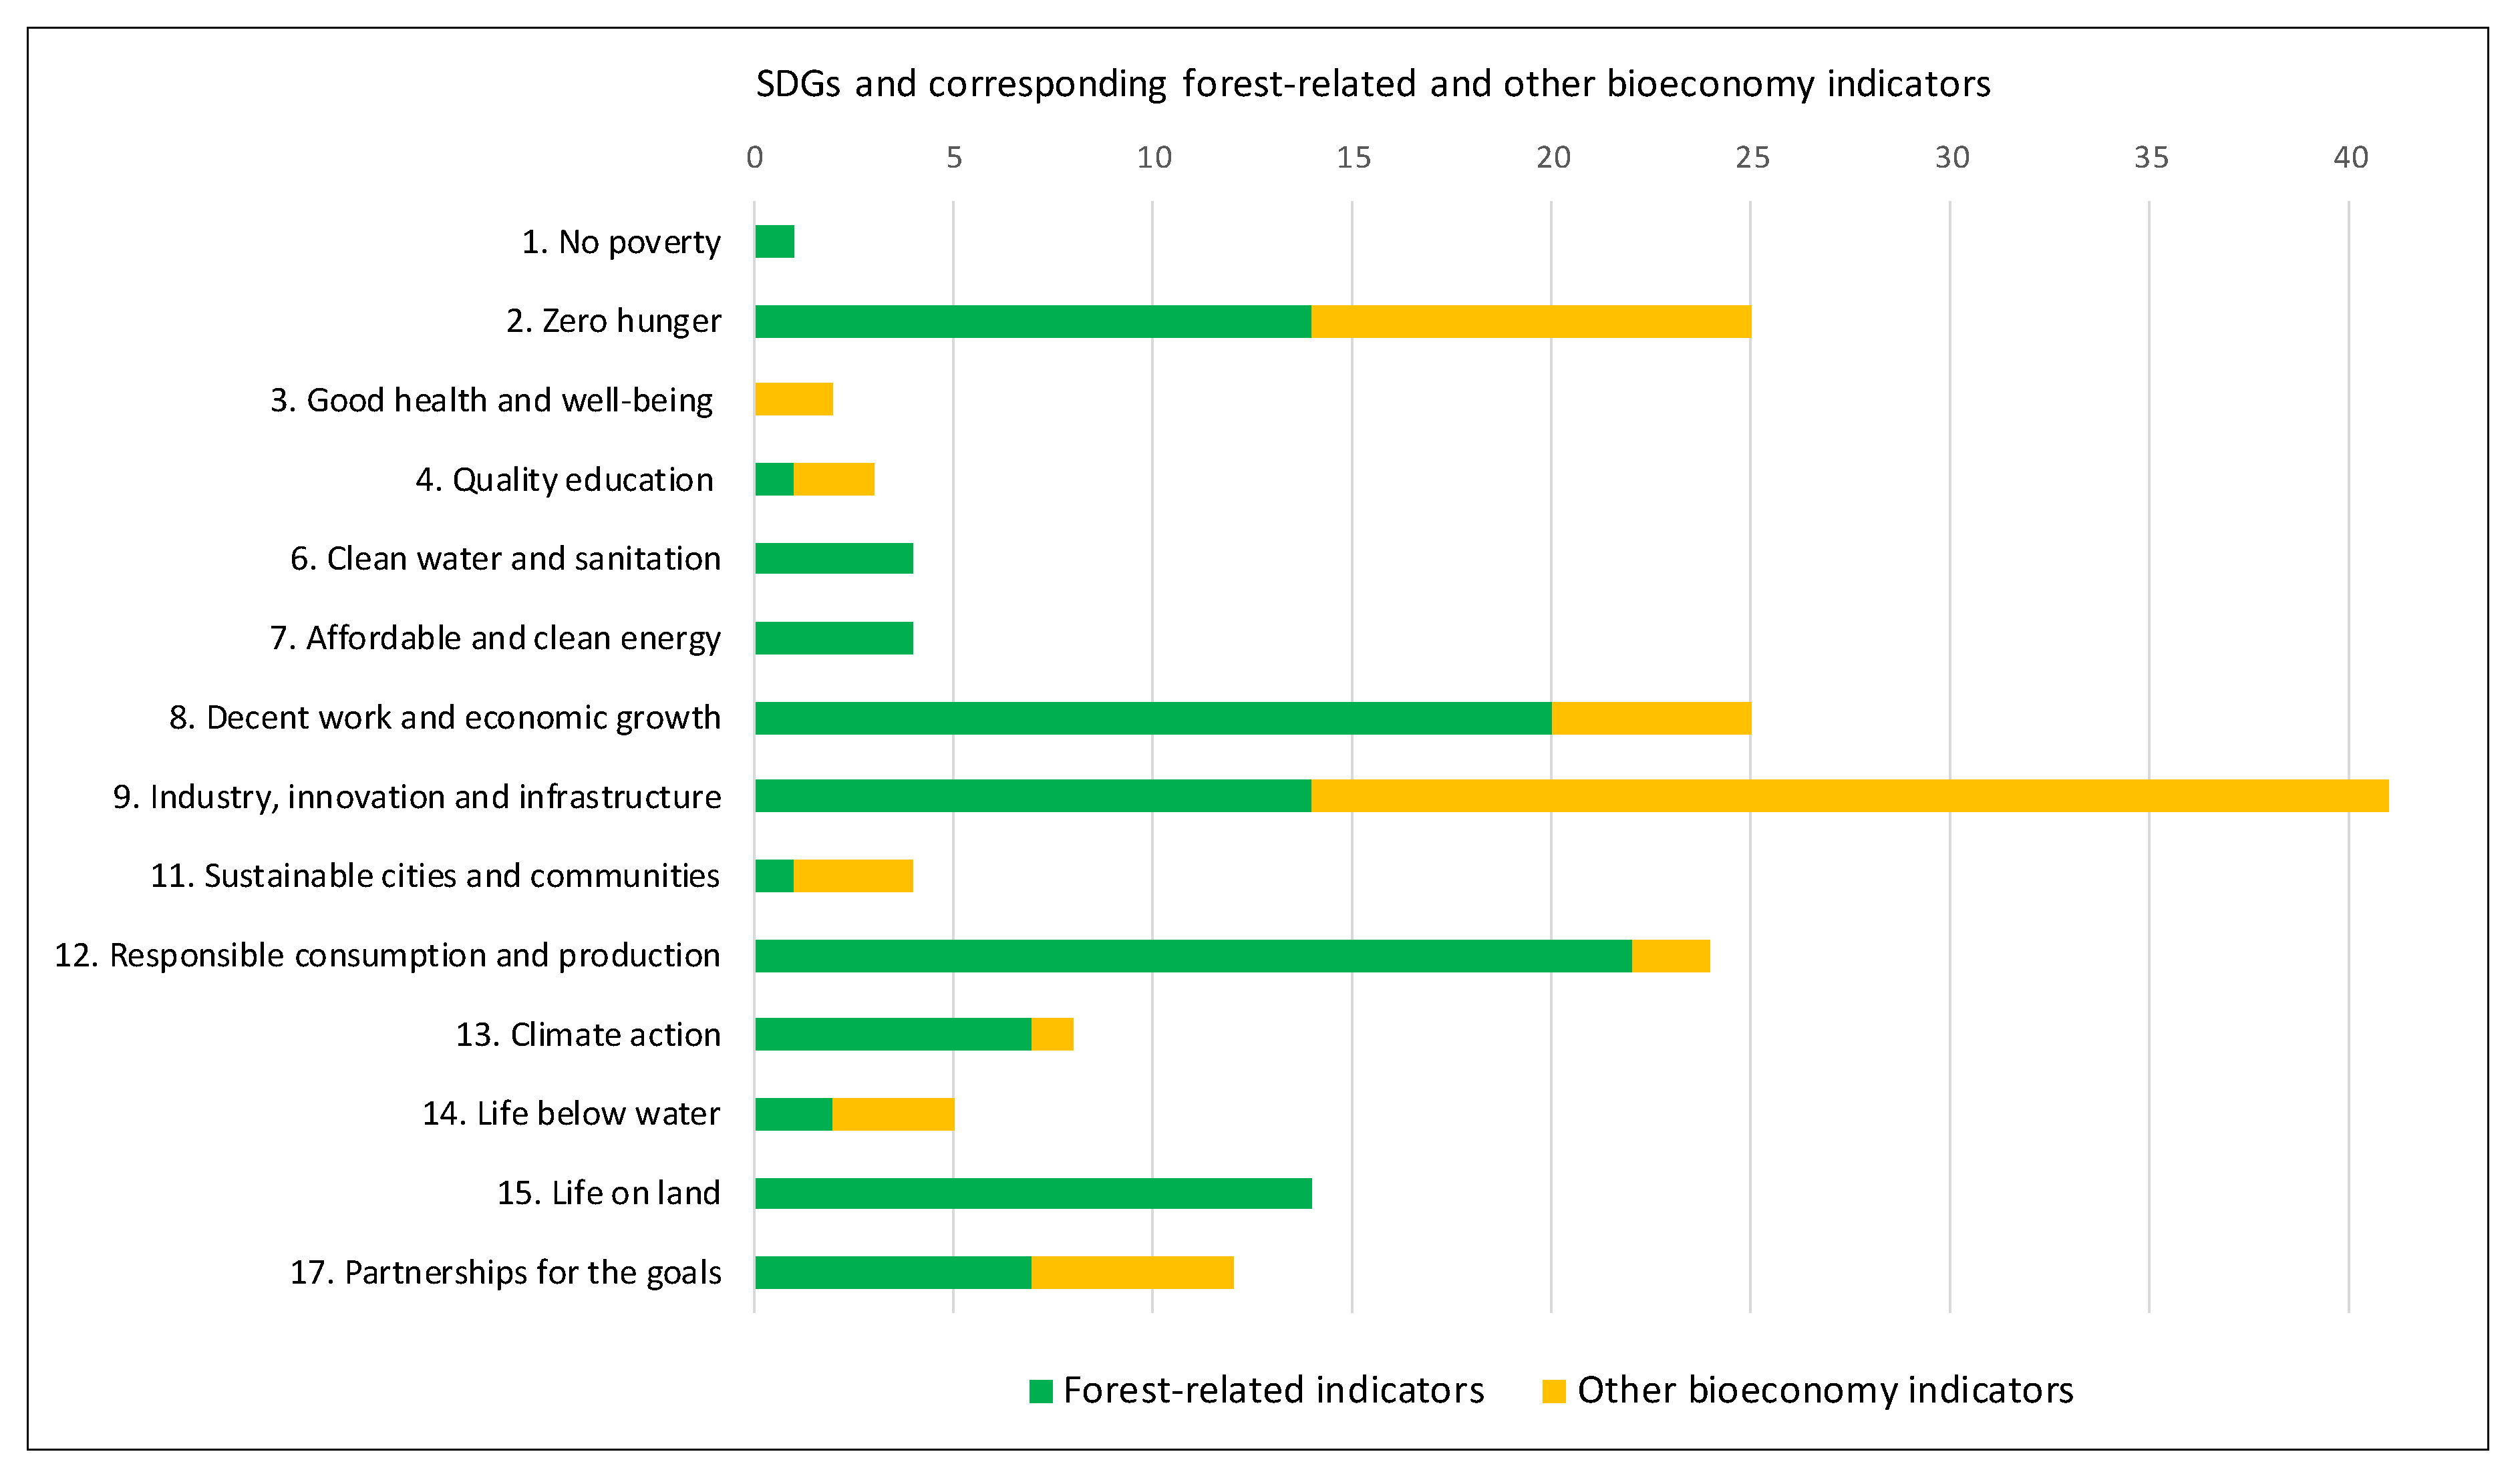
Figure 4 shows that two-thirds of the bioeconomy indicators used in the eight national bioeconomy strategies and three bioeconomy indicator projects are forest-related. This means that the underlying data and information of the whole indicator or parts of the indicator are based on the forest sector.
Next to the strongly forest-related SDG 15 “Life on land”, some exclusively forest-related bioeconomy indicators could have been assigned to the SDGs 1 “No poverty”, 6 “Clean water and sanitation”, and 7 “Affordable and clean energy”. For SDG 12, “Responsible consumption and production”, and SDG 13, “Climate action”, the majority of assigned bioeconomy indicators had a forest component. This underlines the cross-cutting nature of many forest-related indicators that are not univocal for the forest-sector, such as wood for energy or carbon indicators [68]. We could also assign forest-related indicators to nine further bioeconomy-related SDGs (2, 4, 8, 9, 11, 12, 13, 14, 17). We could not assign forest-related bioeconomy indicators to the bioeconomy-relevant SDG 3 “Good health and well-being”. One-third of the bioeconomy indicators from our studied pool focus exclusively on sectors other than the forest (presented in yellow in Figure 4). The high proportion of forest-related indicators within the bioeconomy illustrates the significance of the forest sector to the bioeconomy.

4. Discussion

The importance of a sustainable and circular bioeconomy in achieving the SDGs has been recognized at various political levels [16,27,31,69]. To further investigate this, our study explored whether and how the SDGs are considered in national bioeconomy strategies, and in their indicator-based progress monitoring and assessment. This study focused on how the different national indicators used to monitor the progress of the bioeconomy were related to the SDG indicators and to the already well-established and widely applied intergovernmental regional or international forest-related indicators, as the forest sector is a major actor within a bioeconomy. The study does not contribute to proposing the most suitable indicators, but it does encourage national and regional actors to carefully and holistically develop their bioeconomy monitoring systems, using synergies from the already existing SDGs and forest monitoring processes. The discussion follows our research questions.

4.1. Is Progress towards Bioeconomy Strategy Objectives Measured by Using Indicators?

Although 46 countries have so far established bioeconomy-related strategies, our analysis showed that only a few had also established a monitoring system based on indicators to measure progress towards national bioeconomy strategy goals and targets. The studied national bioeconomy indicators varied not only in numbers but also within their focus, ranging from technological to socio-economic and ecological indicators, and level of detail (covering sub-indicators or detailed data by subsectors). This is not only a result of different country characteristics in line with different national bioeconomy focuses, but is also related to “bioeconomy readiness”, including the technological readiness of national bioeconomy sectors and activities, political preconditions, circumstances, priorities, settings, and public demands. At the EU political level, the aim is to provide a set of indicators that monitors the development of the bioeconomy not only at regional EU but at member state levels [16,24,37,69]. It can be assumed that at least some EU countries which currently lack bioeconomy indicators are relying on using the EU set of bioeconomy indicators which is still under development [37] as the basis for their national reporting. If a country decides to elaborate a bioeconomy strategy including the development of respective indicators for progress monitoring or to start a revision process, our results, including the gaps which we depicted, may serve as a starting point for discussions between the inter-ministerial and the inter-sectoral participants.

4.2. Contain the Studied National Bioeconomy Strategies Developed and Adopted after 2015 References to the SDGs, their Targets and Indicators?

Our analysis allowed us to identify 14 SDGs which are relevant to the bioeconomy as related issues are mentioned in the surveyed national bioeconomy strategies. Only the most recently developed Italian bioeconomy strategy mentioned some SDGs explicitly. All other seven national bioeconomy strategies address issues of 11 up to 14 SDGs implicitly, in varying degrees of interest, depending on their national circumstances and priorities. There is no difference between those national bioeconomy strategies developed a few years before or after the SDGs’ adoption in 2015. Only some of the SDG targets (32 out of 169) and a range of SDG indicators (36 out of 244) were classified as relevant to the bioeconomy through the approach we applied. Our overview of indicator coverage and gaps (cf. Figure 3) reveals that potential indicators existed either in one of the other countries’ bioeconomy strategies or in one of the three indicator projects. Overall, we identified potential for further additional bioeconomy indicators to be included in the indicator sets of the eight national bioeconomy strategies for progress monitoring of explicit or implicitly mentioned SDGs.

4.3. As the Forest Sector is One of the Key Sectors for the Development of a Bioeconomy, do the National Bioeconomy Indicators Resemble the Respective Intergovernmental Regional or International Indicators for SFM?

Our analysis showed that large interrelationships exist between SDG indicators, bioeconomy indicators, and indicators for sustainable forest management, the latter are often of cross-cutting nature and not univocal for the forest sector. Two-thirds of the bioeconomy indicators used in the eight national bioeconomy strategies and three bioeconomy indicator projects are forest-related or have a forest component in their underlying information. One-third of the bioeconomy indicators focus exclusively on other bioeconomy sectors. The high share of forest-related indicators reveals on the one hand that forests as a primary source for the bio-based manufacturing sector play a major role in the bioeconomy in the studied countries and projects. But it seems also obvious that forest-related indicators are chosen and applied as tools with a comparable long development-history and a fairly good data availability and validity [35,43].

5. Conclusions

The development of national bioeconomies represents an important contribution to achieve numerous SDGs at national level. However, our paper shows that there are currently no holistic, indicator-based, and intersectoral national monitoring systems that will allow an assessment of progress in the contribution bioeconomy development makes towards the SDGs. However, for national and regional policymakers, indicator-based information can serve a range of purposes within the various stages of the policymaking process, such as objective setting, planning, design, implementation, and progress monitoring and assessment. Among many intergovernmental- and organization-specific forest-related indicator frameworks (like FOREST EUROPE, Montréal Process, FAO, etc.), many useful indicators exist that could be applied to SDGs and bioeconomy monitoring and assessment.

5.1. Which SDGs Might Be Included in the Future Bioeconomy Discussion?

Even if SDGs are not explicitly mentioned in current national bioeconomy strategies, we confirmed in our analysis that SDG-related issues belonged indirectly to the objectives, planned actions, and measurements for bioeconomy strategies.
We identified 14 bioeconomy-relevant SDGs that could be considered in the revision of the studied national bioeconomy strategies and in the elaboration of new regional, national, or sub-national bioeconomy strategies.
Our analysis showed that the eight studied national bioeconomy strategies prioritized different SDG-related issues. A country’s bioeconomy-specific socio-economic, ecological, geographical, and cultural-historical setting influences the importance of country-specific SDGs in a national bioeconomy strategy. Our survey revealed no bioeconomy relevance for SDGs 5 “Gender equality”, 10 “Reduced inequalities”, and 16 “Peace, justice and strong partnerships”. However, some recent references suggest they are also of a certain relevance. SDG 5 “Gender equality,” has attracted attention in the EU, because the EC’s research program “9. Food security, sustainable agriculture and forestry, marine, maritime and inland water research and the bioeconomy” focuses in a number of calls on bioeconomy and gender-related issues [70]. The respective research outcomes may contribute to the general discussions on how the bioeconomy can reduce the current gender inequality in bioeconomy-related sectors. It may also contribute to the reduction of inequality within and among countries, which is the focus of SDG 10, which also concerns gender inequality, alongside other aspects of possible inequalities like regional differences between urban and rural areas regarding, for example, education, employment, income, and value adding, which are also aspects relevant to the bioeconomy. National processes on the development of bioeconomy strategies should also consider whether their bioeconomy can contribute to the parts of SDG 16 regarding the promotion of peaceful and inclusive societies for sustainable development. An example can be found in Finland, where a government-funded project (2017–2020) is currently investigating who, in a society, as a result of systemic change in the bioeconomy, can win and who will lose, and how it can influence the acceptability of the bioeconomy [71].

5.2. What might be Improved in Sets of National Bioeconomy Indicators to Fit them Better with Bioeconomy-related SDGs, Targets, and Indicators?

Based on our findings, we recommend the following steps in the elaboration or review of bioeconomy progress monitoring and assessment systems:
  • Each objective in the bioeconomy strategy should have at least one indicator for quantification, progress monitoring, and assessment;
  • Comprehensive approaches for progress reporting on the bioeconomy should consider all relevant SDG issues;
  • If an SDG-related goal is addressed in the bioeconomy strategy, the pool of corresponding SDG indicators should be considered;
  • Already existing indicators from SDGs or from indicator sets for sustainable forest management should be integrated to reduce monitoring and reporting burdens;
  • National monitoring systems and datasets should be harmonized and streamlined with global initiatives and international data requirements for SDGs and forest monitoring (e.g., UNECE, FAO, EUROSTAT, EC JRC, FOREST EUROPE) to allow comparability. Measure once, store in intersectoral databases and use manifold;
An indicator-based assessment of progress of a national bioeconomy may highlight issues where a country is currently off-track in achieving its objectives, supporting target prioritization and resource allocation, and enabling adaptive management. It is unlikely a standardized “one-size-fits-all” approach can be found for national bioeconomy monitoring. Countries may therefore choose different indicators, depending on their bioeconomy strategies’ priorities and their monitoring capacities, and may regularly revise or adapt in line with new insights, emerging issues, or improved data availability, validity, and reliability.
Although SDG indicators, bioeconomy indicators, indicators for sustainable forest management, and indicators for other sectors have been developed in various processes and projects in the last two decades, there is thus far little system-thinking or integrative monitoring, reporting, and assessment that considers synergies and trade-offs. However, the intergovernmental regional or international processes for sustainable forest management have decisively developed and continuously improved the indicators as the most appropriate tool to face the challenges of intersectoral all-inclusive reporting [41]. They may, therefore, serve as a role model for other sectors and the whole bioeconomy for establishing and maintaining participatory bottom-up indicator processes, based not only on the lobbying of interests but on underlying definitions, principles, or criteria, and a balanced consideration of all relevant issues.
Our results provide better information for revisions and new elaborations of regional (e.g., EU), national, or sub-national (e.g., Laender) bioeconomy indicator sets in a balanced coverage of all bioeconomy sectors to raise interest and awareness among all bioeconomy stakeholders, and the decision makers concerned.
It is expected that neither the bioeconomy objectives nor the bioeconomy indicator systems will ever reach a final status, since new insights, future challenges, new priorities, and changing perspectives will necessitate revision or amendment. The bioeconomy indicator systems should therefore be flexible tools that undergo regular revision and adaptation.

Author Contributions

Conceptualization: S.L. and M.L.; Methodology: S.L.; Analysis Bioeconomy Strategies: M.L.; Analysis Indicator sets: S.L. Writing-Original Draft: S.L. and M.L.; Writing-Review & Editing: S.L. and M.L.; Visualization: S.L. and M.L. All authors have read and agreed to the published version of the manuscript.

Funding

This research received no external funding.

Acknowledgments

We kindly thank Alice Ludvig and Ivana Živojinovic from BOKU Vienna, Annemarie Bastrup-Birk from EEA and Jo Van Brusselen from EFI for their constructive comments and input. This paper is a cooperation of two authors from the IUFRO WP 9.01.05 Research and Development of Indicators for Sustainable Forest Management. First results were presented at the IUFRO World Congress in Curitiba, Brazil in October 2019, we kindly thank IUFRO for this opportunity. The open access publication was supported by BOKU Vienna Open Access Publishing Fund. The English language check was kindly supported by the Natural Resources Institute Finland (Luke). We also kindly thank the anonymous reviewers for their constructive comments and suggestions to improve the quality of the paper.

Conflicts of Interest

The authors declare no conflict of interest.

Abbreviations

ASEANAssociation of South-East Asian Nations
BEBioeconomy
BESBioeconomy Strategy
BOKUUniversity of Natural Resources and Life Sciences, Vienna
EC JRCJoint Research Centre of the European Commission
EEAEuropean Environment Agency
EFIEuropean Forest Institute
EUEuropean Union
EUROSTATStatistical Office of the European Commission
FAOFood and Agriculture Organization of the United Nations
FEFOREST EUROPE
FOREST EUROPEThe brand name of the Ministerial Conference on the Protection of Forests in Europe
FRAFAO Global Forest Resources Assessment
GDPGross Domestic Product
GERDGross Expenditure on Research and Development
GMOGenetically Modified Organism
GVAGross Value Added
Ind.Indicator
IPRIntellectual Property Rights
ITTOThe International Tropical Timber Organization
IUFROInternational Union of Forest Research Organizations
LFCCLow Forest Cover Countries
LukeNatural Resources Institute Finland
MPMontréal Process
R&DResearch and Development
SDGSustainable Development Goal of the United Nations
SFMSustainable Forest Management
UNUnited Nations
UNECEUnited Nation Economic Commission for Europe
USAUnited States of America

Appendix A

Table A1. Bioeconomy indicators of the analyzed bioeconomy strategies. For measurement units, please see the referenced documents.
Country and ReferenceYearNo. of Ind.List of Indicators—As Listed in the National Bioeconomy Strategies
USA [25]20124Revenues from genetically modified plants and microbes; Pharmaceutical industry productivity; Employment and putput by industry; R&D costs
South Africa [46]201318Number of publications and citations in high impact journals per capita; Size of bio-innovation workforce as percentage of science and technology workforce; Number of research chairs, centres of excellence, technology platforms and multi-disciplinary research and development programmmes supported; Bio-economy research and development as a percentage of GERD; Number of patents granted; Number of collaborative product development partnerships; Availability of technology development and assimilation infrastructure; Number of technology-transfer transactions; Availability of incubation facilities of bioinnovation firms; Number of regulatory approvals for health products; Revenues/sales of life science products, processes and services; Number of field trials with GMO crops; Number of bio-innovation firms, including dedicated bio-innovation firms by sector; Venture capital invested in bio-innovation firms; Technology balance of payment of bioinnovation outputs; Number of joint ventures and strategic alliances between local bio-innovation firms and international partners; Multinational corporations in bio-economy sectors locating research and development facilities locally; Types of biotechnology used by firms
Finland [47]201416Bioeconomy output; Bioeconomy value added; The number employed; The share of BE employed in the national economy; Raw material inputs; value added to raw material streams; Raw material inputs used; Greenhouse gas emissions avoided; Total use of natural resources; Growth and harvested volumes of standing timber; Growth and harvested volumes of cereal crops; Growth and harvested volumes of fish bag; Endangered species; Urban waste; Ecosystem services; Environmental and resource efficiency
Malaysia [48]20155Bioeconomy investments; Employment in bioeconomy sectors and estimated yearly income; Revenues of BioNexus Status Companies; R&D spending in bioeconomy; Patent applications
Spain [49]20166
main Ind.
Public investment and number of activities; private investment and number of activities; Final Production; Added Value; Employee numbers; Exports. The last four are measured for the sectors and areas of: Agriculture; Food industry; Forestry Products; Industrial chemicals; Pharmaceutical and nutritional by-products; Biofuels; Renewable energy of biological origin; Other rural area services; Processed waste; Sustainability indicators
Denmark [50]20189Resource productivity; Renewable energy, share of total energy consumption; Production costs (shares of different costs); Experienced quality in transport infrastructure; Production costs (shares of different costs); Proportion of recycling of total waste; Waste treatment; GDP; Domestic material consumption
United Kingdom [51]201815Annual turnover of the UK industrial biotechnology and bioenergy sectors; Forest cover; Industrial biotechnology funding; Investment in education and skills; Investment in low carbon industrial innovation; Jobs, employment; Number of members of the Industrial Biotechnology Innovation Centre; Number of members of the Networks in Industrial Biotechnology and Bioenergy; Renewable transport fuel; Production of sustainable aviation fuels; Resource productivity; Waste processing and materials recovery market; Waste; Converted household waste (into biofuel)
Italy [52]201826Agricultural biomass production—import of agricultural biomass; Blue biomass production—import of blue biomass; Forestry biomass production—import of forestry biomass; Waste biomass production—import of waste biomass; Firms in total bioeconomy sectors; Firms in bioeconomy subsectors; Innovative start up in total bioeconomy sectors; Innovative start up in bioeconomy subsectors; Employment in total bioeconomy sectors; Employment in bioeconomy subsectors; Tertiary education; R&D employment in total bioeconomy sectors; R&D employment in bioeconomy subsectors; University courses in bioeconomy sectors; Research Institute in bioeconomy sectors; IPRs (patent, trademark, design) applications in total bioeconomy sectors; IPRs (patent, trademark, design) applications in bioeconomy subsectors; Private R&D expenditure; Public R&D expenditure; Population growth; Population 15–65 years; GDP; Exports of total bioeconomy sectors related goods; Exports of bioeconomy subsectors related goods; Imports of total bioeconomy sectors related goods; Imports of bioeconomy subsectors related goods
Table A2. Bioeconomy indicators of the analyzed indicator projects. For measurement units, please see the referenced documents.
Country and ReferenceYearNo. of Ind.List of Indicators—As Listed in the Indicator Projects
EFI [40]201612Resource use; Resource productivity; Resource and materials efficiency; Water footprint; natural resources index; Share of renewable energy in gross final energy consumption; Indirect land use/embodied land for agriculture and forestry products; Red List Index of threatened species; Carbon footprint of the forest and harvested wood chain (carbon stock changes); Greenhouse gas balance (emissions and sequestration), Employment in forest-based bioeconomy sectors, and contribution to regional employment; Eco-innovation index
MontBioeco [12]201830Number of employed persons in rural and urban areas; Value added; Contribution to the GDP; Investment in research and innovation for creating jobs and maintaining competitiveness; Export; Import; Production of renewable energy incl. production of biofuels and biogas; Material and waste recycling and recovery rates; Material replacing non-renewable resources (bio-materials); Public financial support and private investments for reducing dependence on non-renewable resources; Investment in research and innovation for reducing dependence on non-renewable resources; Carbon sequestration; Forest carbon emissions/sinks; Greenhouse gas emissions from agriculture; Water area carbon emissions/sinks; Public financial support and private investments for mitigating and adaptation; Investment in research and innovation for mitigating and adapting climate change; Domestic food supply of the food commodities in terms of production, import and stock change; Agricultural products; Fish products; Non-wood forest products; New food products; Public financial support and private investments for reducing dependence on non-renewable resources; Investment in research and innovation for ensuring food security; Land cover; Resource availability; Sustainable resource use; Environmental protection; Public financial support and private investments for ecosystem services; Investment in research and innovation for managing natural resources sustainably.
Biomonitor [39]201925Availability of food; Access to food; Utilization; Stability; Sustainability threshold levels for bioeconomy technologies; Biodiversity; Land cover; Primary Biomass production; Sustainable resource use; Bio-energy replacing non-renewable energy; Bio-material replacing non-renewable resources; Biomass self-sufficiency rate; Material use efficiency; Certified bio-based products, Greenhouse gas emissions
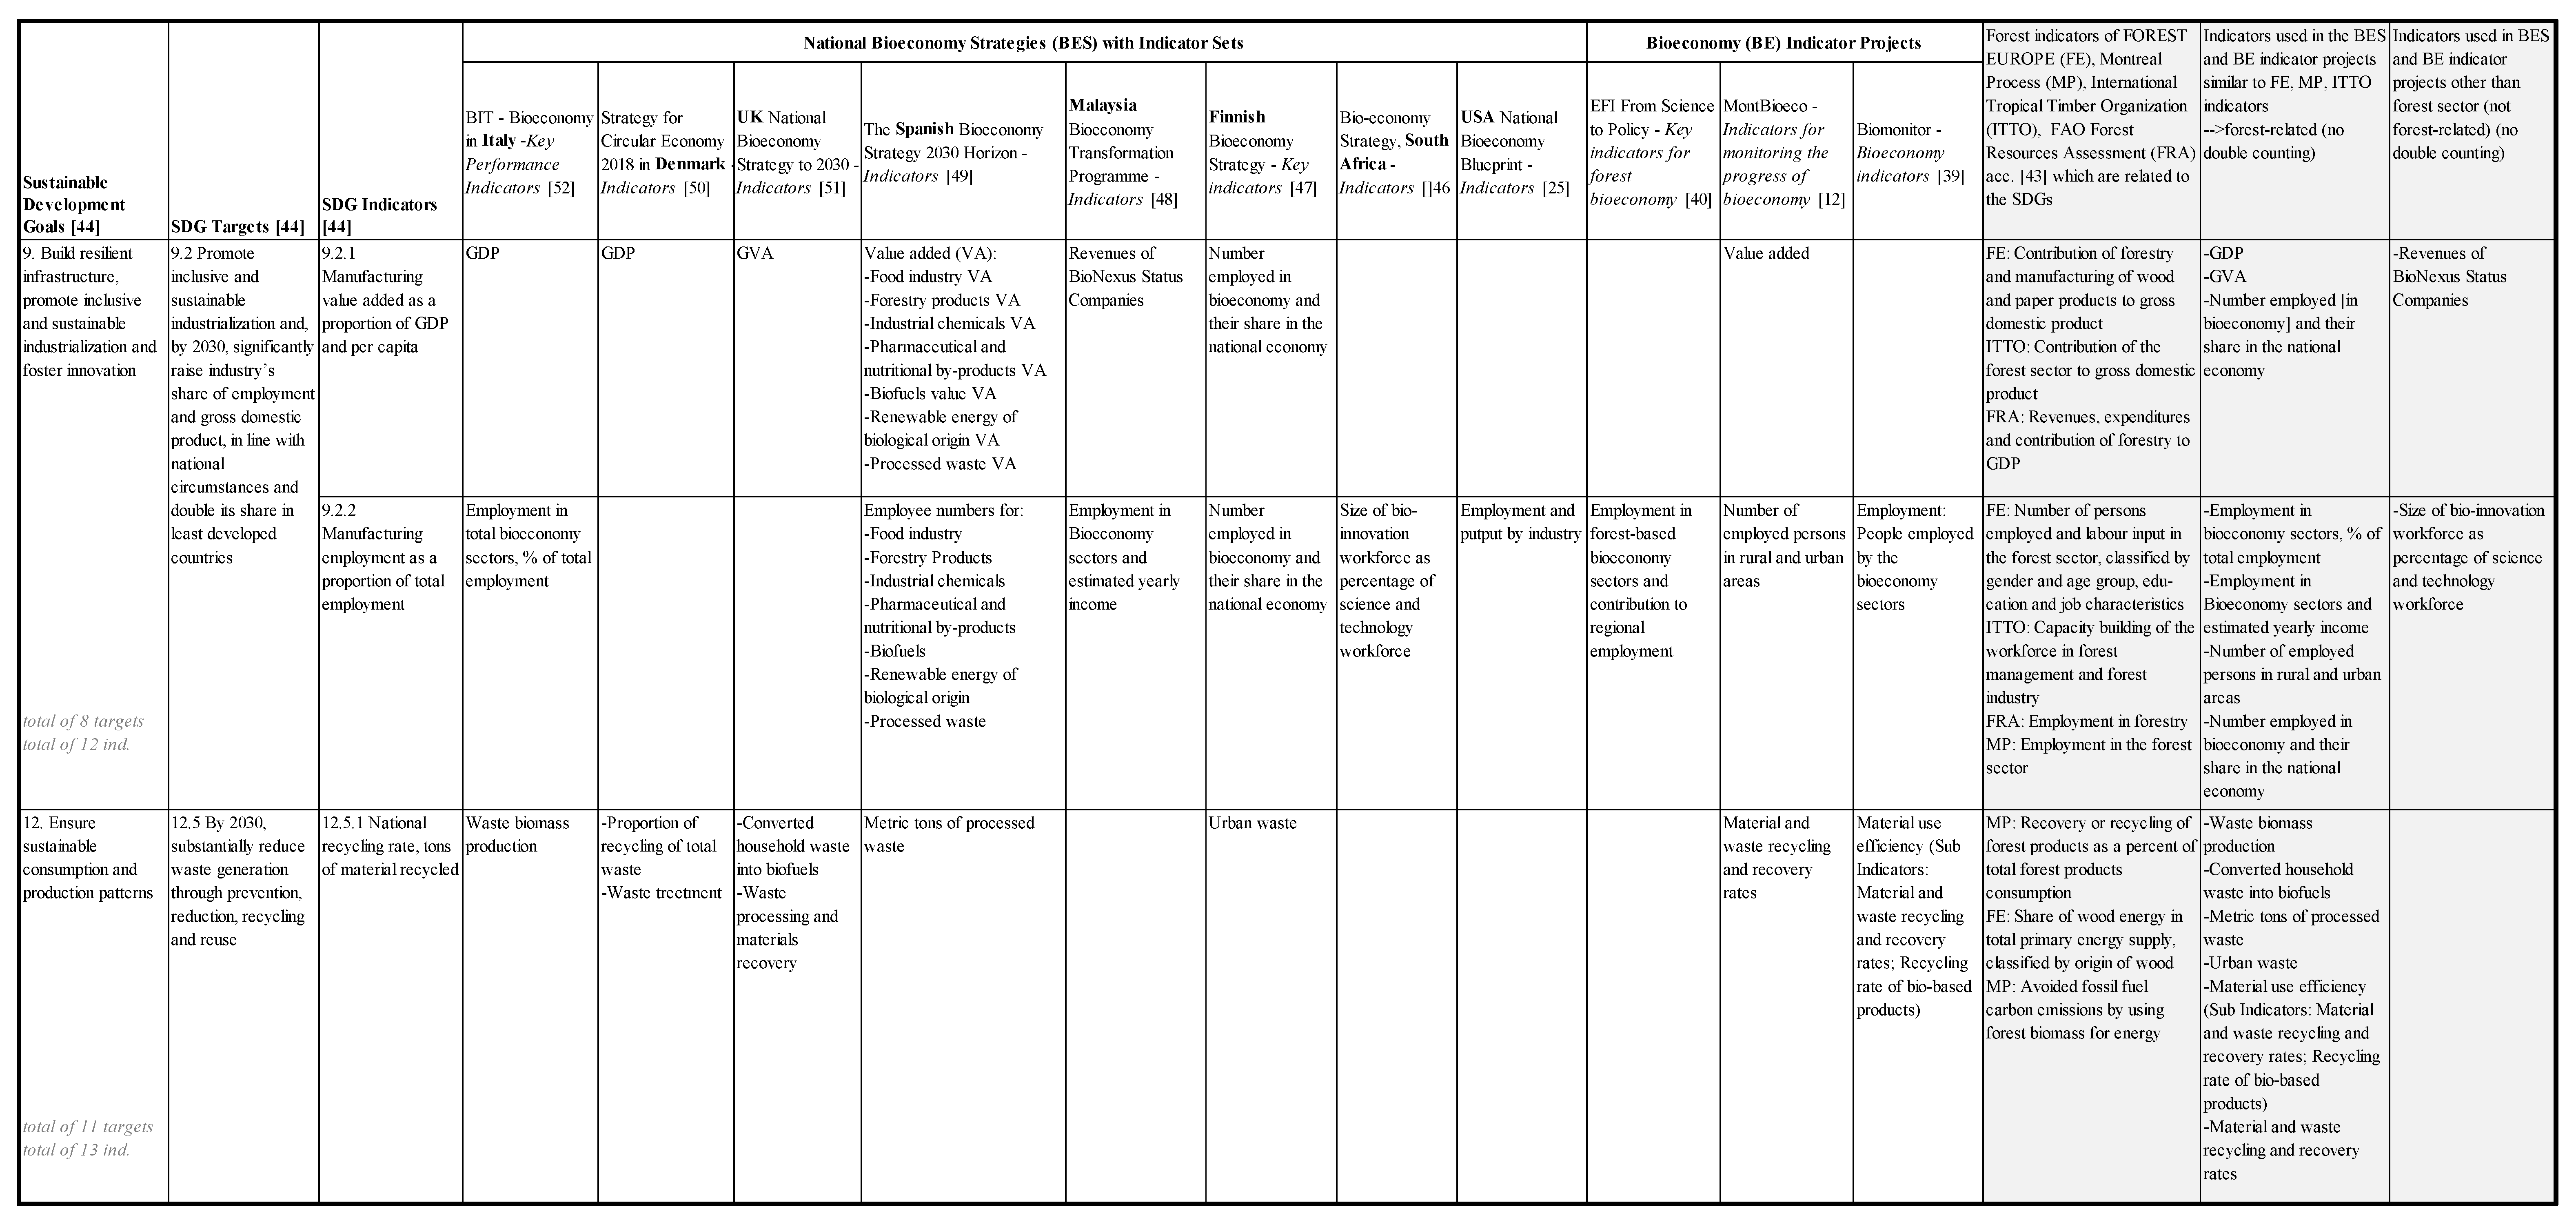
Figure A1. Excerpt of our analysis: Bioeconomy indicators and related indicators for sustainable forest management presented for SDG 12.
Sustainability 12 02898 g0a1

References

  1. World Commission on Environment and Development (WCED). Our Common Future; Oxford University Press: Oxford, UK, 1987. [Google Scholar]
  2. United Nations. Report of the World Summit on Sustainable Development. Johannesburg, South Africa, 26 August-4 September 2002. A/CONF.199/20; United Nations: New York, NY, USA, 2002; Available online: https://digitallibrary.un.org/record/478154 (accessed on 16 November 2019).
  3. United Nations. Transforming our world: The 2030 Agenda for Sustainable Development. Resolution Adopted by the General Assembly on 25 September 2015. In A/RES/70/1; United Nations: New York, NY, USA, 2015; Available online: https://www.un.org/ga/search/view_doc.asp?symbol=A/RES/70/1&Lang=E (accessed on 16 November 2019).
  4. Caradonna, J.L. Sustainability: A History; Oxford University Press: New York, NY, USA, 2014. [Google Scholar]
  5. Linser, S. Critical Analysis of the Basics for the Assessment of Sustainable Development by Indicators; Freiburger Forstliche Forschung, Band 17; Forstl. Versuchs- und Forschungsanst: Freiburg, Germany, 2002; ISBN 3-933548-17-9. [Google Scholar]
  6. Williams, C.C.; Millington, A.C. The diverse and contested meanings of sustainable development. Geogr. J. 2004, 170, 99–104. [Google Scholar] [CrossRef]
  7. United Nations. About the Sustainable Development Goals. 2019. Available online: https://www.un.org/sustainabledevelopment/sustainable-development-goals/ (accessed on 11 November 2019).
  8. Janousková, S.; Hák, T.; Moldan, B. Global SDGs Assessments: Helping or Confusing Indicators? Sustainability 2018, 10, 1540. [Google Scholar] [CrossRef] [Green Version]
  9. Geoghegan, T. Post-2015: Framing a New Approach to Sustainable Development; IRF2015 Policy Paper; Independent Research Forum on a Post-2015 Sustainable Development Agenda: London, UK, 2013. [Google Scholar]
  10. Hák, T.; Janousková, S.; Moldan, B. Closing the sustainability gap: 30 years after “our Common Future”, society lacks meaningful stories and relevant indicators to make the right decisions and build public support. Ecol. Indic. 2018, 87, 193–195. [Google Scholar] [CrossRef]
  11. Lier, M.; Kärkkäinen, L.; Korhonen, K.T.; Packalen, T. Understanding the Regional Bioeconomy Settings and Competencies in 29 EU Regions in 11 EU Countries; Natural Resources and Bioeconomy Studies 88/2019; Natural Resources Institute: Helsinki, Finland, 2019; ISBN 978-952-326-608-7. [Google Scholar]
  12. Lier, M.; Aarne, M.; Kärkkäinen, L.; Korhonen, K.T.; Yli-Viikari, A.; Packalen, T. Synthesis on Bioeconomy Monitoring Systems in the EU Member States—Indicators for Monitoring the Progress of Bioeconomy (MontBioeco); Natural Resources and Bioeconomy Studies 38/2018; Natural Resources Institute: Helsinki, Finland, 2018; ISBN 978-952-326-608-7. [Google Scholar]
  13. Dietz, T.; Börner, J.; Förster, J.J.; von Braun, J. Governance of the Bioeconomy: A Global Comparative Study of National Bioeconomy Strategies. Sustainability 2018, 10, 3190. [Google Scholar] [CrossRef] [Green Version]
  14. German Bioeconomy Council. Bioeconomy Policy (Part III) Update Report of National Strategies Around the World; Office of the Bioeconomy Council: Bonn, Germany, 2018; p. 124. Available online: https://biooekonomierat.de/fileadmin/Publikationen/berichte/GBS_2018_Bioeconomy-Strategies-around-the_World_Part-III.pdf (accessed on 19 November 2019).
  15. Gawel, E.; Pannicke, N.; Hagemann, N. A Path Transition towards a Bioeconomy—The Crucial Role of Sustainability. Sustainability 2019, 11, 3005. [Google Scholar] [CrossRef] [Green Version]
  16. European Commission. A sustainable bioeconomy for Europe: Strengthening the connection between economy, society and the environment. In Updated Bioeconomy Strategy. European Commission Directorate-General for Research and Innovation Unit F—Bioeconomy; Publications Office of the European Union: Luxembourg, 2018; p. 105. ISBN 978-92-79-94145-0. [Google Scholar] [CrossRef]
  17. European Commission. A sustainable bioeconomy for Europe: Strengthening the connection between economy, society and the environment. In COM (2018) 673 Final; European Commission: Brussels, Belgium, 2018. [Google Scholar]
  18. European Commission. The European Green Deal. Communication from the Commission to the European Parliament, the European Council, the Council, The European Economic and Social Committee and the Committee of the Regions. In COM (2019) 640 Final; European Commission: Brussels, Belgium, 2019; Available online: https://eur-lex.europa.eu/legal-content/EN/TXT/?qid=1576150542719&uri=COM%3A2019%3A640%3AFIN (accessed on 10 February 2020).
  19. European Commission. Future of the Common Agricultural Policy. Available online: https://ec.europa.eu/info/food-farming-fisheries/key-policies/common-agricultural-policy/future-cap_en (accessed on 19 January 2020).
  20. European Commission. Safeguarding Nature—EU 2030 Biodiversity Strategy. Available online: https://ec.europa.eu/info/law/better-regulation/initiatives/ares-2019-7908307_en (accessed on 19 January 2020).
  21. Hetemäki, L.; Hanewinkel, M.; Muys, B.; Ollikainen, M.; Palahi, M.; Trasobares, A. Leading the Way to a European Circular Bioeconomy Strategy; From Science to Policy 5; European Forest Institute: Joensuu, Finland, 2017; ISBN 978-952-5980-39-4. [Google Scholar]
  22. M’barek, R.; Philippidis, G.; Ronzon, T. Alternative Global Transition Pathways to 2050: Prospects for the Bioeconomy—An application of the MAGNET model with SDG insights. JRC Technical Report EUR 29862; Publications Office of the European Union: Luxembourg, 2019; ISBN 978-92-76-11335-5. [Google Scholar] [CrossRef]
  23. Puelzl, H.; Ramcilovic-Suominen, S. Sustainable development—A ‘selling point’ of the emerging EU bioeconomy policy framework? J. Clean. Prod. 2018, 172, 4170–4180. [Google Scholar]
  24. European Commission. Innovating for Sustainable Growth: A Bioeconomy for Europe. In COM (2012) 60 Final; European Commission: Brussels, Belgium, 2012. [Google Scholar]
  25. The White House. National Bioeconomy Blueprint; The White House: Washington, WA, USA, 2012.
  26. Global Bioeconomy Summit. Making Bioeconomy Work for Sustainable Development; Communique: Berlin, Germany, 2015; Available online: https://gbs2015.com/fileadmin/gbs2015/Downloads/Communique_final.pdf (accessed on 2 January 2020).
  27. Global Bioeconomy Summit. Conference Report; Global Bioeconomy Summit: Berlin, Germany, 2018; Available online: https://gbs2018.com/fileadmin/gbs2018/GBS_2018_Report_web.pdf (accessed on 2 January 2020).
  28. World Bioeconomy Forum. Available online: http://www.wcbef.com/ (accessed on 12 January 2020).
  29. International Bioeconomy Forum 2019. Available online: https://www5.agr.gc.ca/eng/science-and-innovation/international-engagement/international-bioeconomy-forum/?id=1552307410662 (accessed on 10 January 2020).
  30. European Bioeconomy Scene. Conference Outcome Report; European Bioeconomy Scene: Helsinki, Finland, 2019; Available online: https://www.bioeconomy.fi/wp-content/uploads//2019/09/Conference-Outcome-Report-EUBioScene19.pdf (accessed on 2 January 2020).
  31. United Nations. Circular Economy for the SDGs: From Concept to Practice. General Assembly and ECOSOC Joint Meeting Draft Concept. 2019. Available online: https://www.un.org/en/ga/second/73/jm_conceptnote.pdf (accessed on 11 November 2019).
  32. OECD. Meeting Policy Challenges for a Sustainable Bioeconomy; OECD: Paris, France, 2018. [Google Scholar] [CrossRef]
  33. Zeug, W.; Bezama, A.; Moesenfechtel, U.; Jähkel, A.; Thrän, D. Stakeholders’ Interests and Perceptions of Bioeconomy Monitoring Using a Sustainable Development Goal Framework. Sustainability 2019, 11, 1511. [Google Scholar] [CrossRef] [Green Version]
  34. Bracco, S.; Tani, A.; Çalıcıoğlu, Ö.; Gomez San Juan, M.; Bogdanski, A. Indicators to Monitor and Evaluate the Sustainability of Bioeconomy. Overview and a Proposed Way Forward; FAO Working Paper 77; FAO: Rome, Italy, 2019; ISBN 978-92-5-131796-9. [Google Scholar]
  35. Linser, S.; Wolfslehner, B.; Gritten, D.; Rasi, R.; Johnson, S.; Bridge, S.; Payn, T.; Prins, K.; Robertson, G. 25 Years of Criteria and Indicators for Sustainable Forest Management—Have they made a difference? Forests 2018, 9, 578. [Google Scholar] [CrossRef] [Green Version]
  36. Wolfslehner, B.; Linser, S.; Pülzl, H.; Bastrup-Birk, A.; Camia, A.; Marchetti, M. Monitoring and assessing the sustainable forest based-bioeconomy. In Towards a Sustainable European Forest-Based Bioeconomy—Assessment and the Way Forward; What Science Can Tell Us. 8; Winkel, G., Ed.; European Forest Institute: Joensuu, Finland, 2017; pp. 122–132. ISBN 978-952-5980-37-0. [Google Scholar]
  37. Giuntoli, J.; Robert, N.; Ronzon, T.; Sanchez Lopez, J.; Follador, M.; Girardi, I.; Barredo Cano, J.; Borzacchiello, M.; Sala, S.; M’Barek, R.; et al. Building a Monitoring System for the EU Bioeconomy. EUR 30064 EN; Publications Office of the European Union: Luxembourg, 2020; ISBN 978-92-76-15385-6. [Google Scholar] [CrossRef]
  38. European Commission. Review of the 2012 European Bioeconomy Strategy; Publications Office of the European Union: Luxembourg, 2017; ISBN 978-92-79-77541-3. [Google Scholar] [CrossRef]
  39. Kardung, M.; Costenoble, O.; Dammer, L.; Delahaye, R.; Lovric, M.; van Leeuwen, M.; M’Barek, R.; van Meijl, H.; Piotrowski, S.; Ronzon, T.; et al. Biomonitor Project D1.1: Framework for Measuring Size and Development of Bioeconomy with a List and Detailed Description of Bioeconomy Indicators, Measures, and Data Requirements. Issued 05/2019. Available online: http://biomonitor.eu/wp-content/uploads/2019/10/BioMonitor_Deliverable_1.1_Update_1.pdf (accessed on 13 June 2019).
  40. Wolfslehner, B.; Linser, S.; Pülzl, H.; Bastrup-Birk, A.; Camia, A.; Marchetti, M. Forest Bioeconomy—A New Scope for Sustainability Indicators; From Science to Policy 4; European Forest Institute: Joensuu, Finland, 2016; ISBN 978-952-5980-29-5. [Google Scholar] [CrossRef]
  41. Linser, S.; Wolfslehner, B.; Asmar, F.; Bridge, S.R.J.; Gritten, D.; Guadalupe, V.; Jafari, M.; Johnson, S.; Laclau, P.; Robertson, G. 25 Years of Criteria and Indicators for Sustainable Forest Management: Why Some Intergovernmental C & I Processes Flourished While Others Faded. Forests 2018, 9, 515. [Google Scholar] [CrossRef] [Green Version]
  42. Baycheva, T.; Inhaizer, H.; Lier, M.; Prins, K.; Wolfslehner, B. Implementing Criteria and Indicators for Sustainable Forest Management in Europe; European Forest Institute: Joensuu, Finland, 2013; ISBN 978-952-5980-04-2. [Google Scholar]
  43. Linser, S.; O’Hara, P. Guidelines for the Development of a Criteria and Indicator Set for Sustainable Forest Management. ECE/TIM/DP/73; United Nations: Geneva, Switzerland, 2019; ISBN 978-92-1-117190-7. [Google Scholar] [CrossRef]
  44. United Nations. Global Indicator Framework for the Sustainable Development Goals and targets of the 2030 Agenda for Sustainable Development. In A/RES/71/313 E/CN.3/2018/2; United Nations: New York, NY, USA, 2018. [Google Scholar]
  45. United Nations Economic and Social Council. Report of the Inter-Agency and Expert Group on Sustainable Development Goal Indicators. In E/CN.3/2019/2; United Nations: New York, NY, USA, 2018. [Google Scholar]
  46. Republic of South Africa. The Bioeconomy Strategy; Department of Science and Technology of the Republic of South Africa: Pretoria, South Africa, 2013; ISBN 978-1-919966-06-9.
  47. TYÖ (Ministry of Employment and the Economy). Sustainable Growth from Bioeconomy—The Finnish Bioeconomy Strategy; Edita Prima Ltd.: Helsinki, Finland, 2014.
  48. MOSTI (Ministry of Science, Technology and Innovation). Bioeconomy Transformation Programme. Enriching the Nation, Securing the Future; MOSTI: Putrajaya, Malaysia, 2015.
  49. de Espana, G. The Spanish Bioeconomy Strategy. 2030 Horizon; Ministerio de Economia y Competitividad and Secretaria de Estado de Investigacion, Desarrollo e Innovacion: Madrid, Spain, 2016.
  50. The Danish Government. Strategy for Circular Economy; Danish Ministry of Environment and Food: Copenhagen, Denmark, 2018; ISBN 978-87-93635-82-1.
  51. HM Government. Growing the Bioeconomy. In Improving Lives and Strengthening Our Economy: A National Bioeconomy Strategy to 2030; Crown OGL: London, UK, 2018. [Google Scholar]
  52. Government of Italy. BIT—The Bioeconomy Strategy of ITALY. A Unique Opportunity to Reconnect the Economy, Society and the Environment. 2018. Available online: https://gbs20.org/fileadmin/gbs2020/documents/BE_in_Italy_update.pdf (accessed on 8 July 2019).
  53. Iriarte, L.; Fritsche, U. S2BIOM Deliverable 5.4—Consistent Cross-Sectoral Sustainability Criteria & Indicators. S2BIOM Project. Delivery of Sustainable Supply of Non-Food Biomass to Support a “Resource-Efficient” Bioeconomy in Europe. 2015. Available online: https://www.s2biom.eu/images/Publications/D5.4_S2Biom_CrossSectoral_Sustainability_Indicators_Final.pdf (accessed on 19 July 2019).
  54. OECD. Green Growth Indicators 2017. In OECD Green Growth Studies; OECD: Paris, France, 2017. [Google Scholar] [CrossRef]
  55. Bauer, M.W. Classical Content Analysis: A Review. In Qualitative Researching with Text, Image and Sound—A Practical Handbook for Social Research, 1st ed.; Bauer, M.W., Gaskell, G., Eds.; SAGE Publishing: London, UK, 2000; pp. 131–151. ISBN 9780761964803. [Google Scholar]
  56. Flick, U. Qualitative Sozialforschung, 3rd ed.; Rowohlt Taschenbuch Verlag: Reinbek, Germany, 2010; ISBN 978-3-499-55694-4. [Google Scholar]
  57. Puelzl, H.; Giurca, A.; Kleinschmit, D.; Arts, B.; Mustalahti, I.; Sergent, A.; Secco, L.; Pettenella, D.; Brukas, V. The role of forests in bioeconomy strategies at the domestic and EU level. In What Scienec Can Tell Us 8; European Forest Institute: Joensuu, Finland, 2017; ISBN 978-952-5980-41-7. [Google Scholar]
  58. Wood, R.; Stadler, K.; Bulavskaya, T.; Lutter, S.; Giljum, S.; De Koning, A.; Kuenen, J.; Schütz, H.; Acosta-Fernández, J.; Usubiaga, A.; et al. Global Sustainability Accounting—Developing EXIOBASE for Multi-Regional Footprint Analysis. Sustainability 2015, 7, 138–163. [Google Scholar] [CrossRef] [Green Version]
  59. Forest Europe. State of Europe’s Forests Report 2015; Forest Europe Liaison Unit: Madrid, Spain, 2015. [Google Scholar]
  60. Lexas: Küstenlänge Aller Länder. Available online: https://www.laenderdaten.de/geographie/kuestenlaenge.aspx (accessed on 15 January 2020).
  61. FAO. Global Forest Resources Assessment 2015. In Country Report Malaysia; FAO: Rome, Italy, 2015. [Google Scholar]
  62. FAO. Keeping an Eye on SDG 15—Working with Countries to Measure Indicators for Forests and Mountains; FAO: Rome, Italy, 2013; Available online: http://www.fao.org/3/a-i7334e.pdf (accessed on 1 June 2019).
  63. Heimann, T. Bioeconomy and Sustainable Development Goals (SDGs): Does the bioeconomy support the achievement of the SDGs? Earth’s Future 2018, 7, 43–57. [Google Scholar] [CrossRef] [Green Version]
  64. Hansen, E.N. Responding to the Bioeconomy: Business Model Innovation in the Forest Sector. In Environmental Impacts of Traditional and Innovative Forest-based Bioproducts. Environmental Footprints and Eco-design of Products and Processes; Kutnar, A., Muthu, S., Eds.; Springer: Singapore, 2016; ISBN 978-981-10-0653-1. [Google Scholar]
  65. Hazarika, R.; Jandl, R. The Nexus between the Austrian Forestry Sector and the Sustainable Development Goals: A Review of the Interlinkages. Forests 2019, 10, 205. [Google Scholar] [CrossRef] [Green Version]
  66. Katila, P.; Pierce Colfer, C.; De Jong, W.; Galloway, G.; Pacheco, P.; Winkel, G. Introduction. In Sustainable Development Goals: Their Impacts on Forests and People; Katila, P., Pierce Colfer, C., De Jong, W., Galloway, G., Pacheco, P., Winkel, G., Eds.; Cambridge University Press: Cambridge, UK, 2019; ISBN 9781108765015. [Google Scholar] [CrossRef] [Green Version]
  67. Tegegne, Y.T.; Cramm, M.; Van Brusselen, J.; Linhares-Juvenal, T. Forest Concessions and the United Nations Sustainable Development Goals: Potentials, Challenges and Ways Forward. Forests 2019, 10, 45. [Google Scholar] [CrossRef] [Green Version]
  68. Köhl, M.; Ehrhart, H.-P.; Knauff, M.; Neupane, P.R. A viable indicator approach for assessing sustainable forest management in terms of carbon emissions and removals. Ecol. Ind. 2020, 111, 106057. [Google Scholar] [CrossRef]
  69. European Commission. Sustainable Development in the European Union—Overview of Progress Towards the SDGs in an EU Context—2018 Edition; Publications Office of the European Union: Luxembourg, 2018; ISBN 978-92-79-88745-1. [Google Scholar] [CrossRef]
  70. EC Horizon 2020—Work Programme 2018-2020 Food Security, Sustainable Agriculture and Forestry, Marine, Maritime and Inland Water Research and the Bioeconomy. Available online: https://ec.europa.eu/programmes/horizon2020/sites/horizon2020/files/food_h2020_wp_2018-2020_draft.pdf (accessed on 6 March 2020).
  71. Ministry of Agriculture and Forestry of Finland. Oikeudenmukaisuuden Rooli Biotaloutta Koskevissa Ratkaisuissa (The role of SDG16 in Bioeconomy Solutions). Available online: https://mmm.fi/biotaloushankeartikkeli/-/asset_publisher/oikeudenmukaisuuden-rooli-biotaloutta-koskevissa-ratkaisuissa (accessed on 6 March 2020).
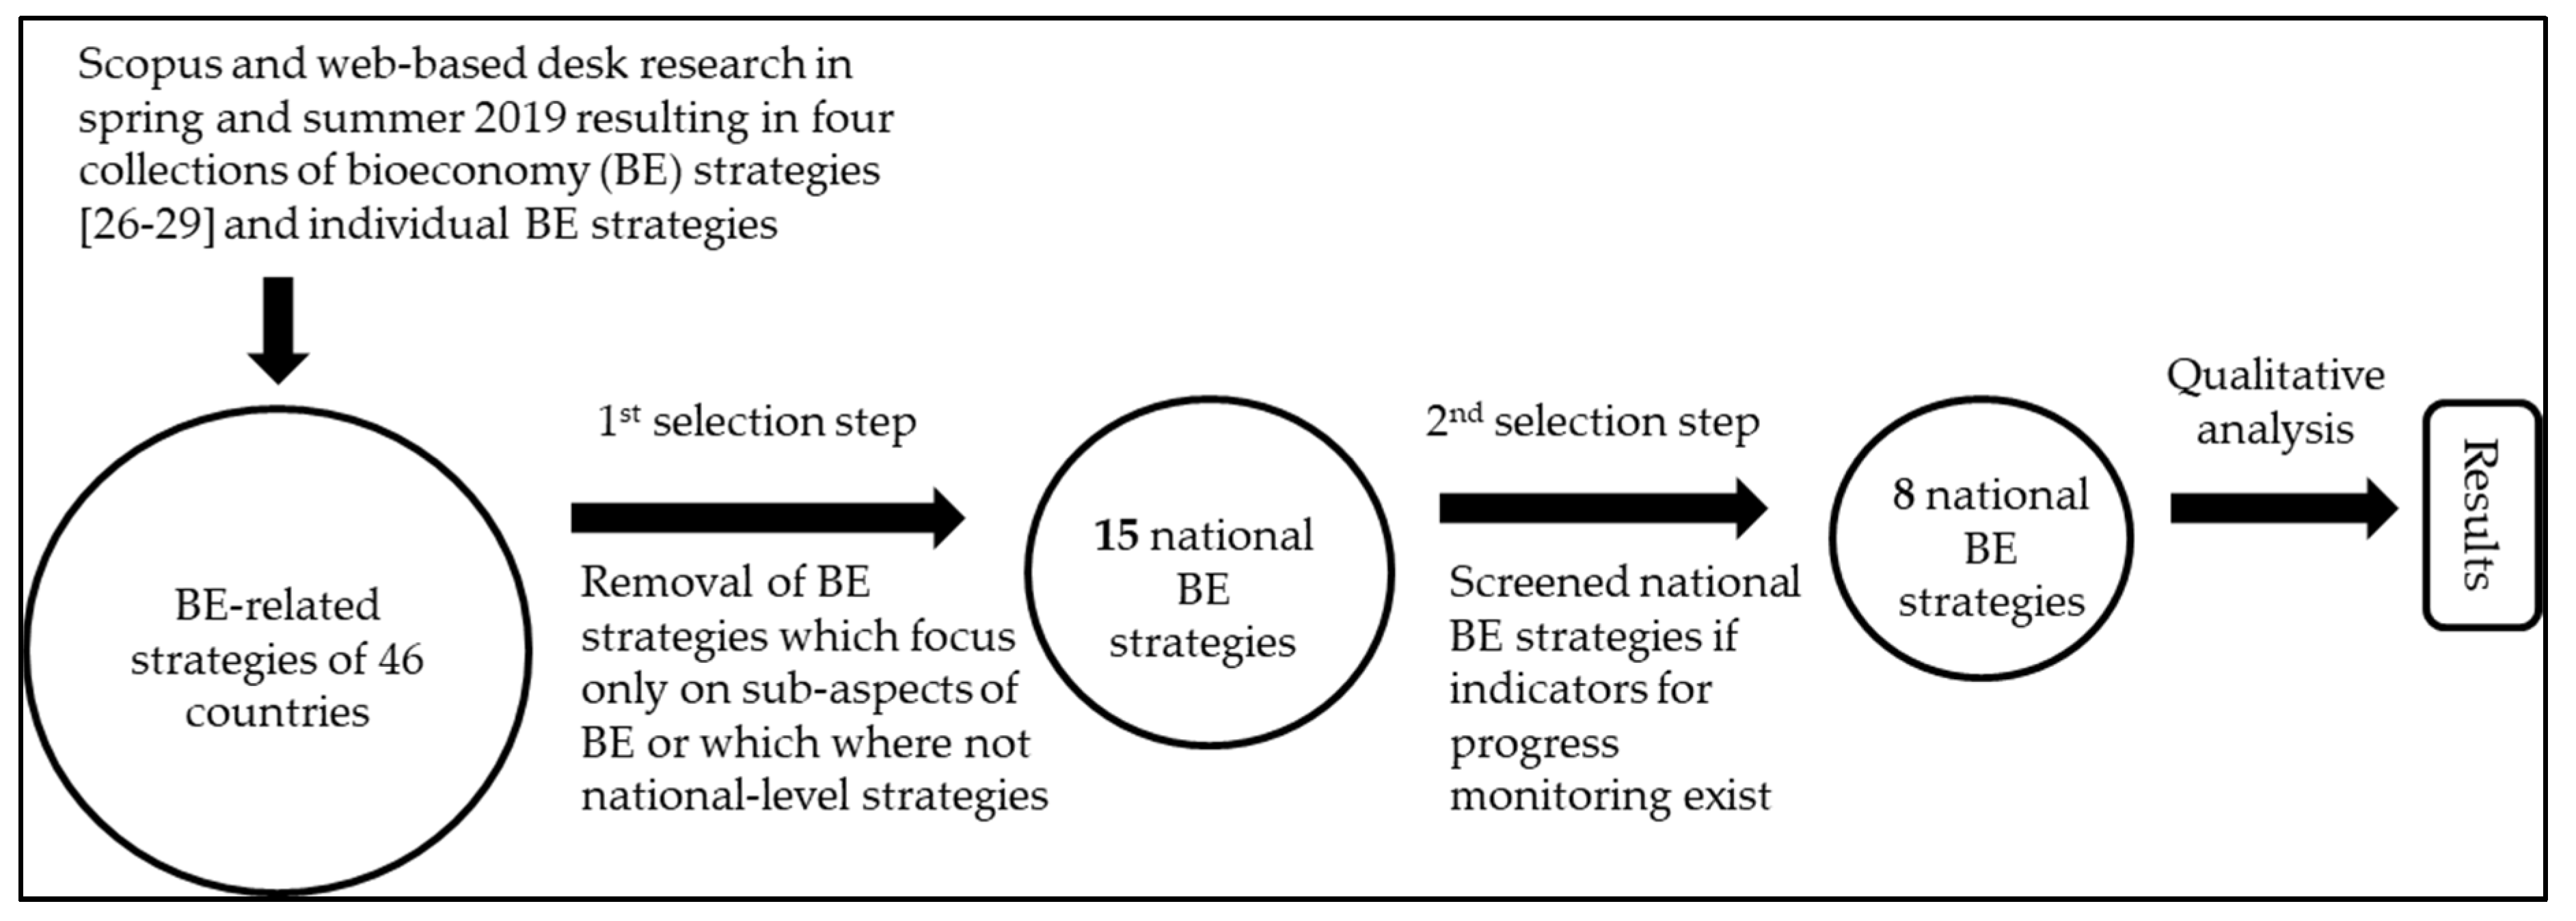
Figure 1. The process of information collection: From bioeconomy (BE)-related strategies of 46 countries to eight national bioeconomy strategies which include indicators.
Sustainability 12 02898 g001
Figure 2. Example of our analysis: National bioeconomy strategy texts and indicators related to SDGs 7 and 8, and its targets and indicators (due to space limits, only a selection of countries and SDGs are presented).
Sustainability 12 02898 g002
Figure 3. Bioeconomy Indicators—Overview of SDG coverage and gaps.
Sustainability 12 02898 g003
Figure 4. Share of forest-related and other bioeconomy indicators assigned to the 14 bioeconomy relevant SDGs (short text versions of the SDGs).
Sustainability 12 02898 g004
Table 1. Overview of systematically analyzed national bioeconomy strategies [25,46,47,48,49,50,51,52] containing indicators for progress monitoring and assessment, listed according year of publication.
Year of PublicationCountryNational Bioeconomy Strategy
2012USANational Bioeconomy Blueprint—Indicators [25]
2013South AfricaBio-economy Strategy, South Africa—Indicators of critical factors [46]
2014FinlandFinnish Bioeconomy Strategy—Key indicators [47]
2015MalaysiaBioeconomy Transformation Programme—
Bioeconomy Contribution Index [48]
2016SpainSpanish Bioeconomy Strategy 2030 Horizon—Evaluation Index [49]
2018DenmarkStrategy for Circular Economy—Indicators [50]
2018United KingdomA national bioeconomy strategy to 2030—Indicators [51]
2018ItalyA new bioeconomy strategy for a sustainable Italy—
Key Performance Indicators [52]
Table 2. SDG-related keywords for screening the national bioeconomy strategies.
Sustainable Development Goals (Short Text Versions)Keywords Used for Screening of
SDG-Related Wording and Indicators
1. No povertyPoverty, poverty reduction, tenure, access, investment
2. Zero hungerHunger, food insecurity, food security, nutrition, agriculture, productivity, production, farmers, technology
3. Good health and well-beingWell-being, human, health, nutrition, diseases
4. Quality educationEducation, training, learning, research, technology, inclusivity, skills
5. Gender equalityGender equality, equal rights, empowerment of women
6. Clean water and sanitationWater, water resource, pollution, reduced water consumption, water efficiency, wastewater
7. Affordable and clean energyEnergy, renewable energy, energy efficiency, energy intensity
8. Decent work and economic growthEmployment, unemployment, economic growth, economic productivity, resource efficiency, consumption, production, innovation, tourism
9. Industry, innovation and infrastructureInfrastructure, industrialization, innovation, transport, GDP, value added, employment, resource efficiency, CO2 emission, research and development expenditures, researcher
10. Reduced inequalitiesEqual opportunity
11. Sustainable cities and communitiesCommunities, cities, waste, waste processing
12. Responsible consumption and productionProduction, consumption, sustainable management, natural resources, efficiency, value added, GDP, waste, recycling, reuse, fuel, fossil-fuel subsidies
13. Climate actionClimate change, climate impacts, carbon
14. Life below waterOceans, seas, marine resources, inland water, fish stocks, fishing, overfishing
15. Life on landTerrestrial ecosystems, forest, afforestation, reforestation, desertification, degradation, restoration, sustainable use, sustainable forest management, biomass, biodiversity, conservation, protected areas, certification
16. Peace, justice, and strong institutionsPeace, justice, institutions, rule of law, public access to information
17. Partnership for the goalsInternational cooperation, revenue, exports
Table 3. Bioeconomy-related references to the SDGs referred to in the Italian Bioeconomy Strategy [52], UN concept on circular economy for the SDGs [31], the Global Bioeconomy (BE) Summit [27], and our own findings, as well as key information concerning how the bioeconomy can help to achieve the SDGs.
Sustainable Development Goals (Short text versions)Italy [52]UN [31]Global BE Summit [27]Authors’ FindingsWhy Can the Bioeconomy Help to Achieve SDGs?
1. No poverty xThe increasing demand for bioeconomy products may lead to increased employment and thus higher household income, therefore reducing poverty [63].
2. Zero hungerx xxIn applying innovative production and processing technologies, sustainable agriculture may lead to improved food security and therefore to improved nutrition [17,27,37].
3. Good health and well-being xxThe bioeconomy may improve living standards and human well-being through e.g., bio-based pharmaceuticals [27].
4. Quality education xAccess to equal education, training and skills may benefit growing bioeconomy labor markets [17,37].
6. Clean water and sanitation xxIn the bioeconomy, wastewater treatment is a renewable source of energy, fertilizers, and chemicals [16].
7. Affordable and clean energyxxxxSustainable energy reduces dependence on non-renewable and unsustainable resources; it may help to boost the development of society [17].
8. Decent work and economic growthxx xA sustainable and circular bioeconomy may result in economic growth and therefore benefit society as a whole [63].
9. Industry, innovation and infrastructurex xInfrastructure investment, sustainable industrialization and the application of innovation is key to bioeconomy development [27].
11. Sustainable cities and communities x xCities may become major circular bioeconomy hubs with optimized waste processing and materials recovery [16].
12. Responsible consumption and productionxxxxAll bioeconomy sectors depend on sustainable production and may pave the way for a changing consumption behavior [27,37].
13. Climate action xxxThe bioeconomy as a whole may contribute to the mitigation of climate change through “negative emissions” and carbon sinks [27,37].
14. Life below waterxxxxThe sustainable use, protection and restoration of marine and inland water ecosystems is a precondition of a bioeconomy [17,27].
15. Life on landxxxxThe sustainable use, protection and restoration of terrestrical ecosystems is a precondition of a bioeconomy [17,37].
17. Partnership for the goals xA bioeoconomy may provide opportunities for new business models and expanding global markets [64].