1. Introduction
Over the past decades, research on climate change has become of primary concern for different disciplines at a global level. However, the understanding of the climate at a local level is key to interpreting undergoing changes. Although there is an abundance of data in the Global North, the countries of the Global South are struggling to fill the gap. More specifically, land-based meteorological stations in African countries are still around half the optimal number required, unevenly distributed and poorly equipped [
1,
2,
3].
In Kenya, there are thirty-two land-based meteorological stations, distributed mainly in the south and on the coast, which are the most developed and geared towards tourism [
4]. To improve the livelihoods of communities, enhance and protect property [
5], the Kenyan government is promoting the country’s research and development in climate information.
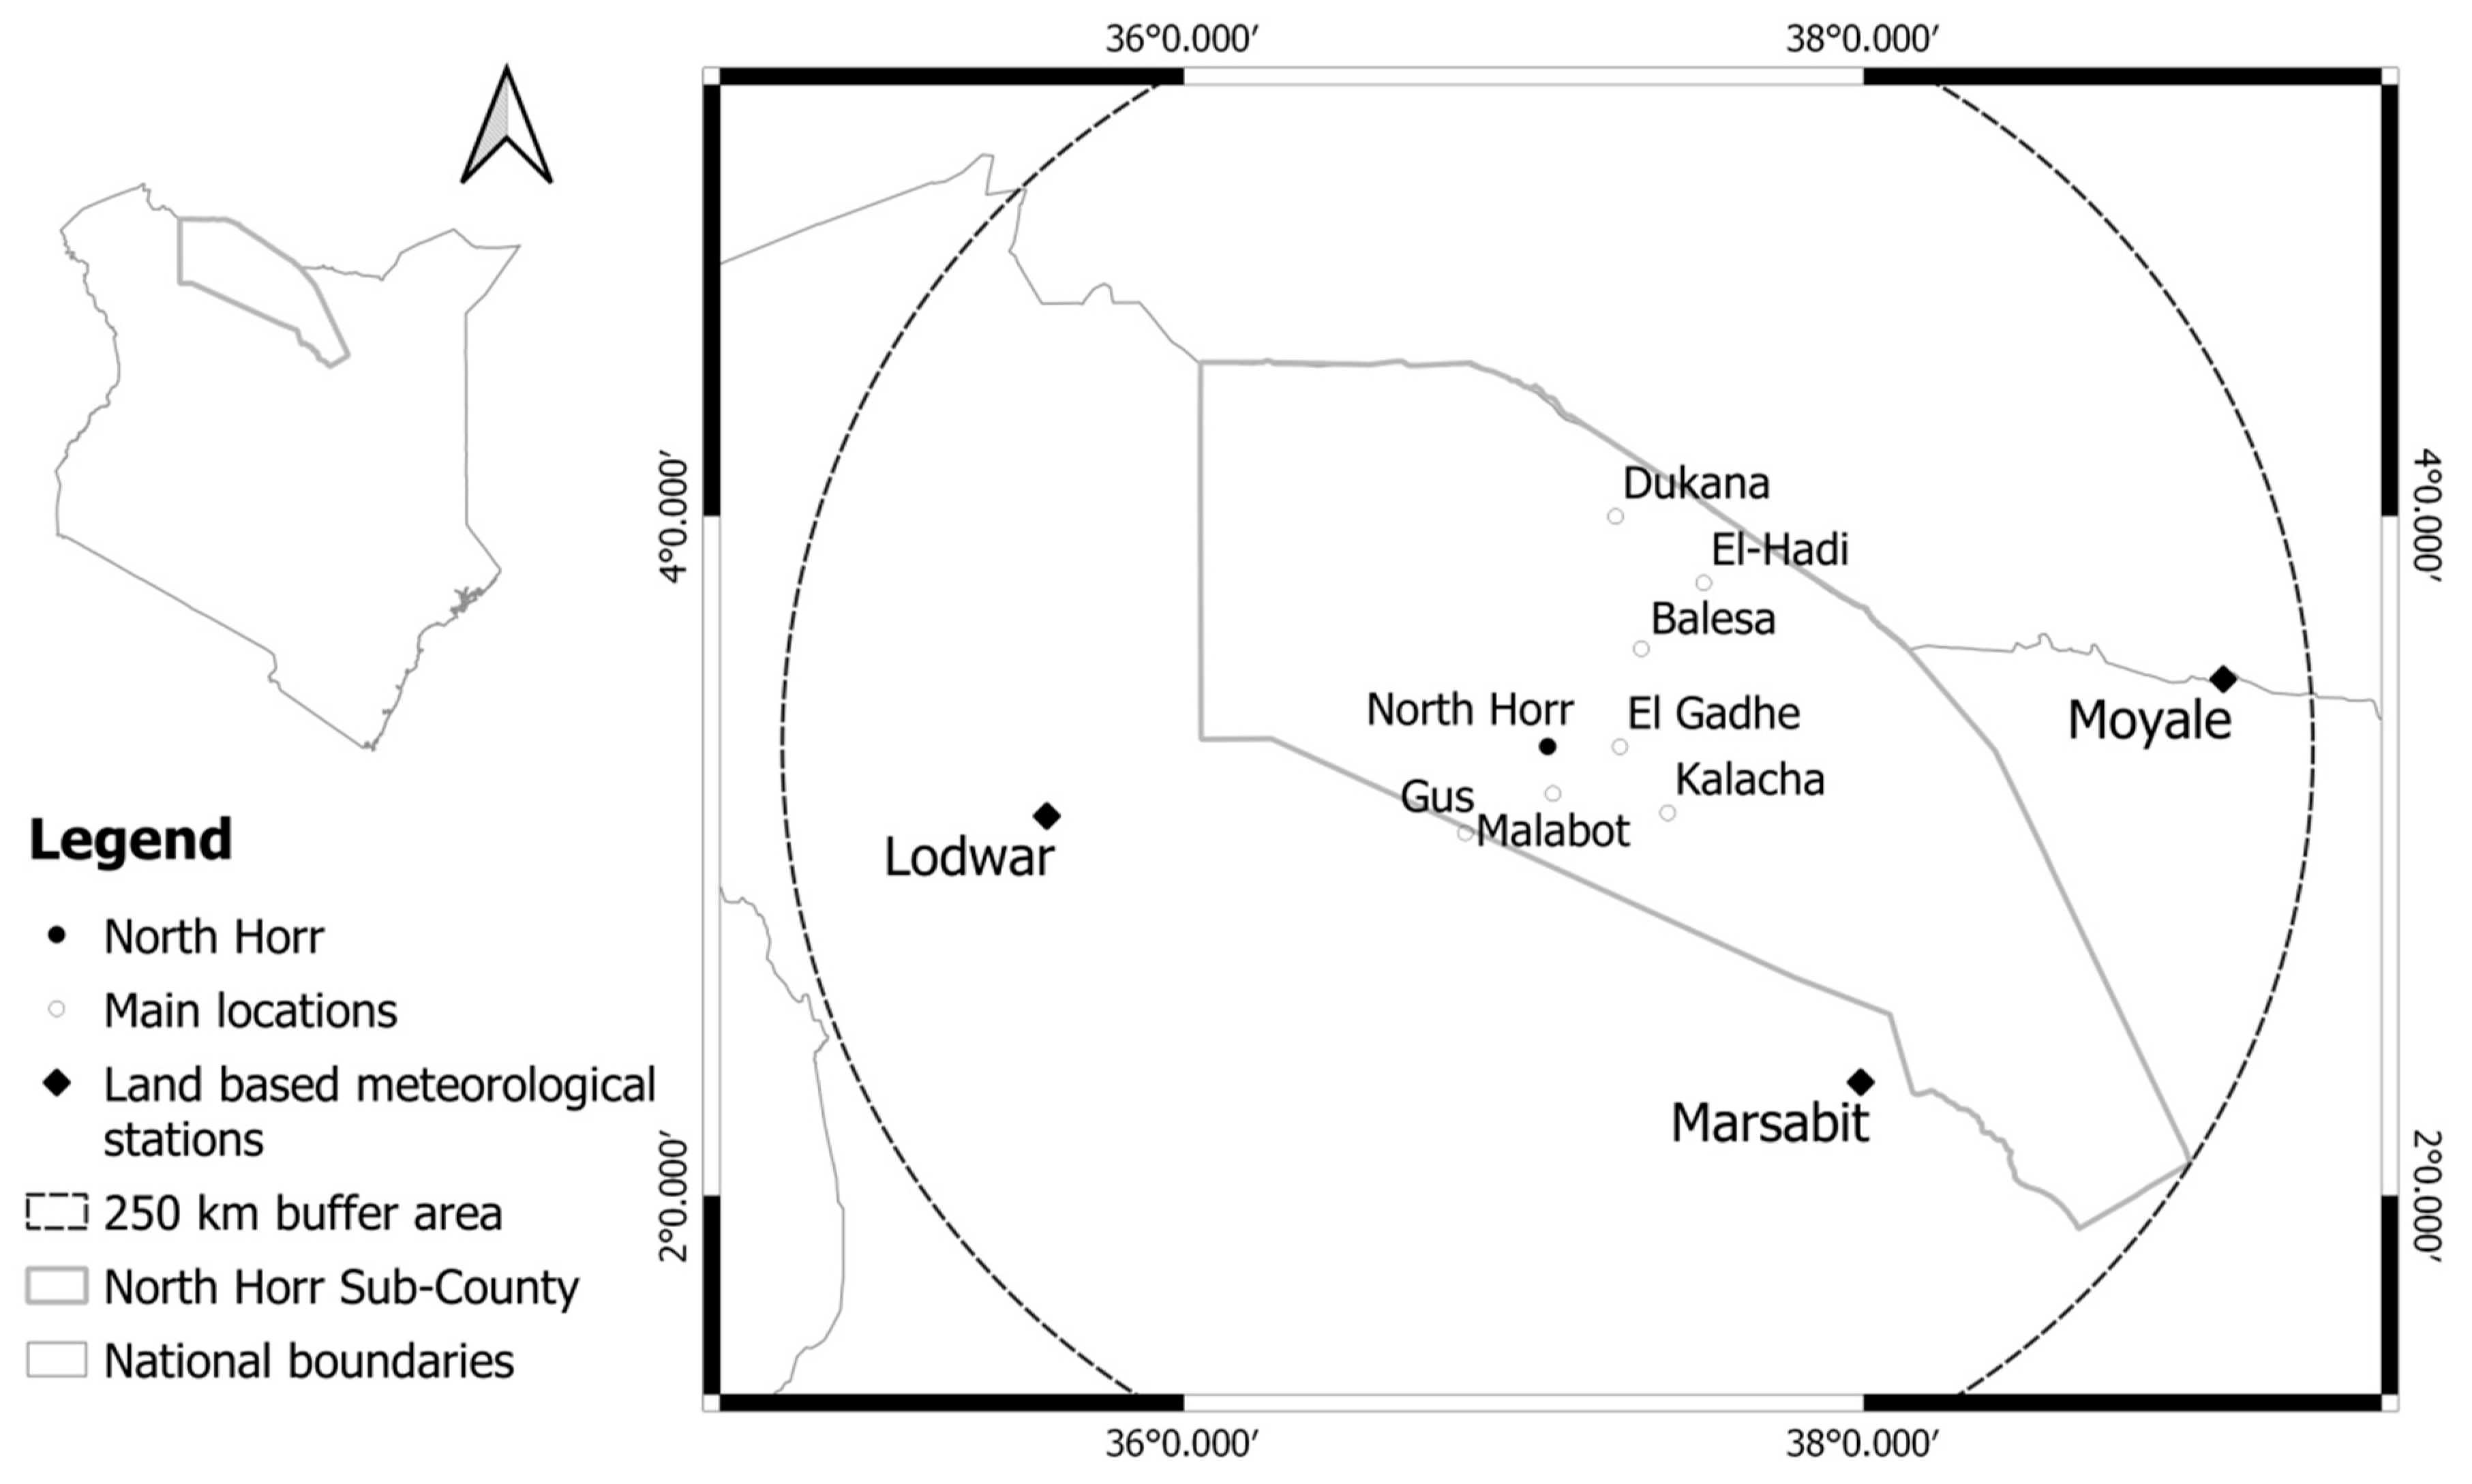
In North Horr Sub-County, situated in Marsabit County in northern Kenya, there are no land-based meteorological stations to provide past climate observations. At a distance of 250 km, there are three weather stations, two located in the highlands and one near lake Turkana. However, they are not close enough to describe the peculiarities of the local climate of North Horr.
The area investigated is mainly inhabited by semi-nomadic pastoral communities which rely on livestock production. They move around the area during the year looking for pasture and water according to the changing season [
6]. Climate, therefore, plays an important role in their life, particularly with regard to precipitation, and extreme events such as floods, flash floods and droughts can have a catastrophic impact.
Three complex phenomena and their interaction mainly influence the climate of the Country: the Intertropical Convergence Zone (ITCZ), El Niño Southern Oscillation (ENSO) and the Indian Ocean Dipole (IOD).
Depending on the season, the periodic shift of the ITCZ north and south is mainly responsible for the bimodal rainfall pattern in Kenya. The first rainy season, known as the “long rains season”, lasts approximately from March to May (MAM), and the second, the “short rains season”, from October to December (OND), with some variation across the country. The ENSO and IOD can affect and alter the onset and duration of the rainy and dry seasons triggering events such as droughts and flooding [
7,
8,
9]. In previous decades, changes in the amount of rainfall have been recorded. The northern Arid and Semi-Arid Lands (ASALs) region of Kenya, including Marsabit County, showed a decreasing trend. In particular, the period of 1991–2013 was generally drier than the period 1961–1990 with the MAM season having the highest, yet statistically insignificant, decline in seasonal rainfall amounts [
10].
Until recently, climate reference literature for the area consisted of outdated studies [
6,
11,
12]. However, climate change effects on climate at a local scale have increased interest in research studies of the area [
13,
14,
15,
16]. This research shows that agro-pastoralists have an awareness of climate change and that the increasing rainfall variability combined with other environmental, social and political pressures negatively affects their resilience [
17,
18,
19,
20]. However, although local knowledge is important, if it is not confirmed by official climate information, it could be unusable and ultimately useless [
21,
22].
The lack of land-based meteorological stations in the area requires the use of satellite-derived data and climatic models for further analysis. The relationship between large-scale weather systems and local climate varies from region to region, making necessary to evaluate and correct them at local scale [
23,
24], but the scarcity of land surface observation is one of the greatest difficulties in assessing dataset performances [
25]. Previous studies have tried to assess the performance of satellite-derived and model-derived datasets in East Africa [
26,
27,
28,
29,
30,
31,
32], in particular in Kenya [
33,
34,
35], in order to address the lack of data from land-based meteorological stations. However, these studies have a more regional perspective rather than a local focus, and further investigation on their use at local scale is needed.
This study aims to contribute to precipitation data gap filling in northern Kenya through the design of an innovative methodology for the identification of the normal monthly precipitation values for the main inhabited areas of North Horr Sub-County.
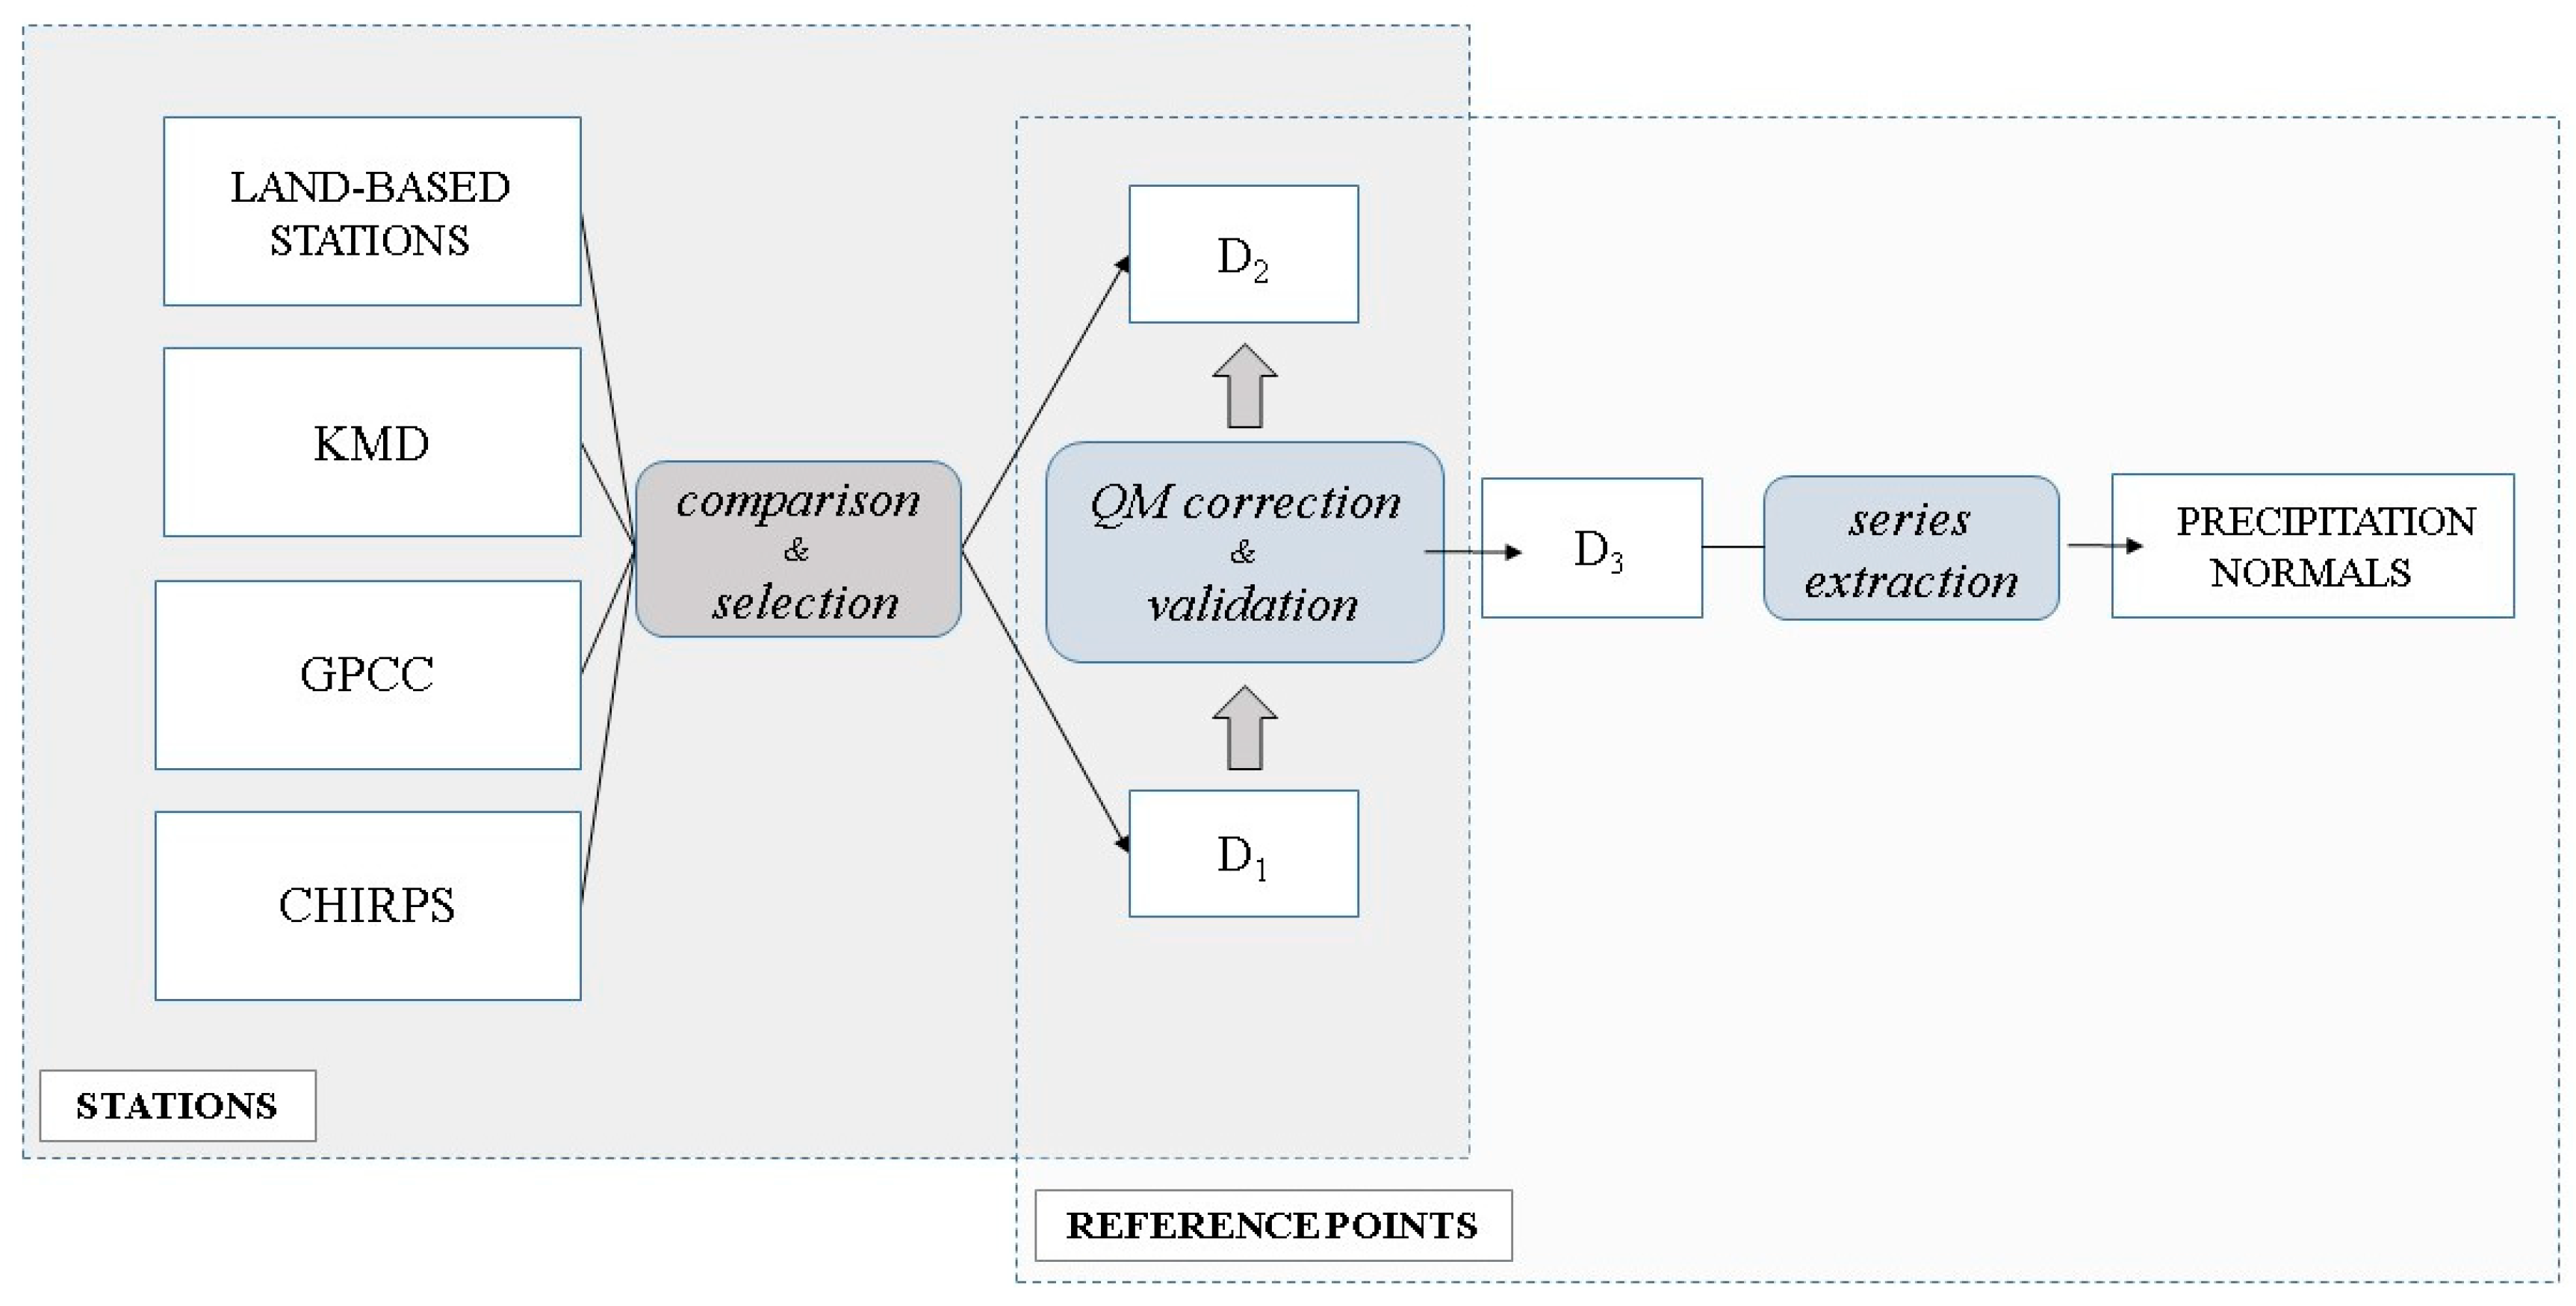
Therefore, it has been necessary to assess and compare the performance of different precipitation datasets with a local scale perspective and to apply a bias correction method, leading to the creation of a new best-fit dataset for the area. Using a direct, point-to-pixel and validation through statistical indices [
26,
27] approach, this research compares data from models with historical data obtained from land-based meteorological stations in order to assess how well their properties fit the study area characterized by a relatively simple topography. This method was preferred to others due to its adaptability to the available data and to the study area. The no hierarchical k-means clustering method [
28] was discarded because of its subjectivity. While it reduces the shortcomings caused by the differences in spatial coverage of the datasets, it requires a subjective choice on the number of clusters of pixels based on the similarity of the annual rainfall cycle. Even an analysis based on the ability of the datasets to detect rainfall events [
29] was not suitable because it would have required daily precipitation data instead of monthly data.
Therefore, three model-derived precipitation datasets were selected and compared with the historical series of the nearby land-based meteorological stations of Lodwar, Marsabit and Moyale.
The precipitation datasets used were:
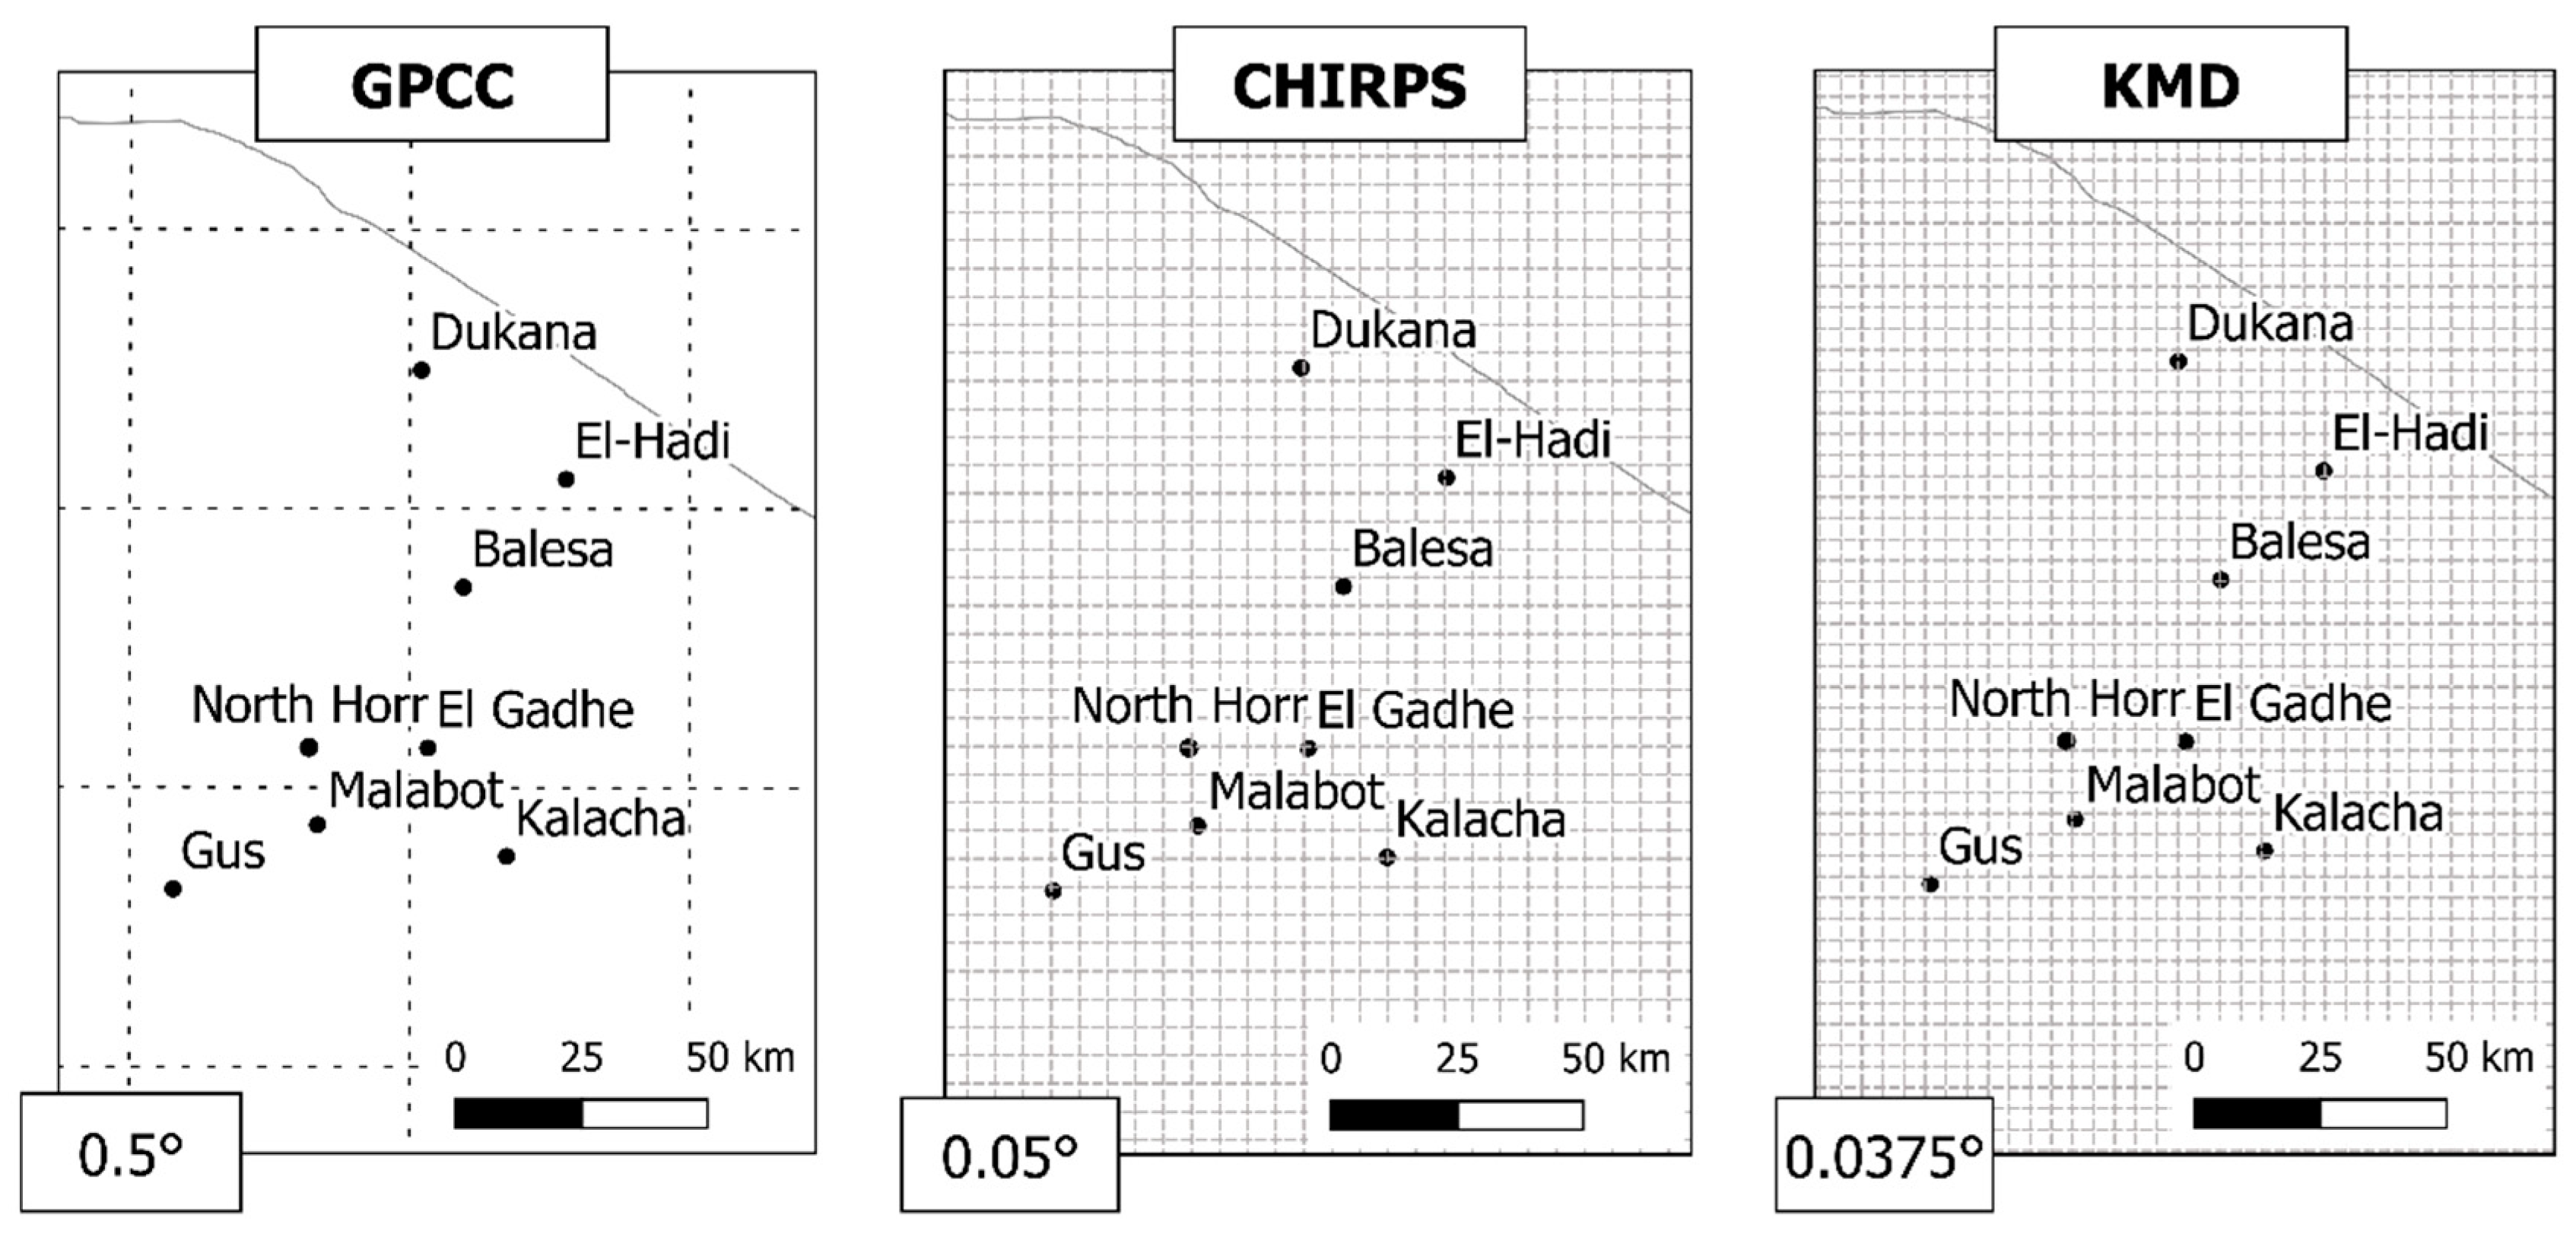
The Global Precipitation Climatology Centre (GPCC) monthly precipitation dataset, with a 0.5° resolution, hereinafter referred to as the GPCC dataset [
37] available at
https://www.esrl.noaa.gov/psd/;
The most commonly used statistical indices were calculated: Bias, Mean Absolute Error, Mean Squared Deviation, Root Mean Squared Deviation, Correlation Coefficient and standard deviation [
26,
27,
28,
39,
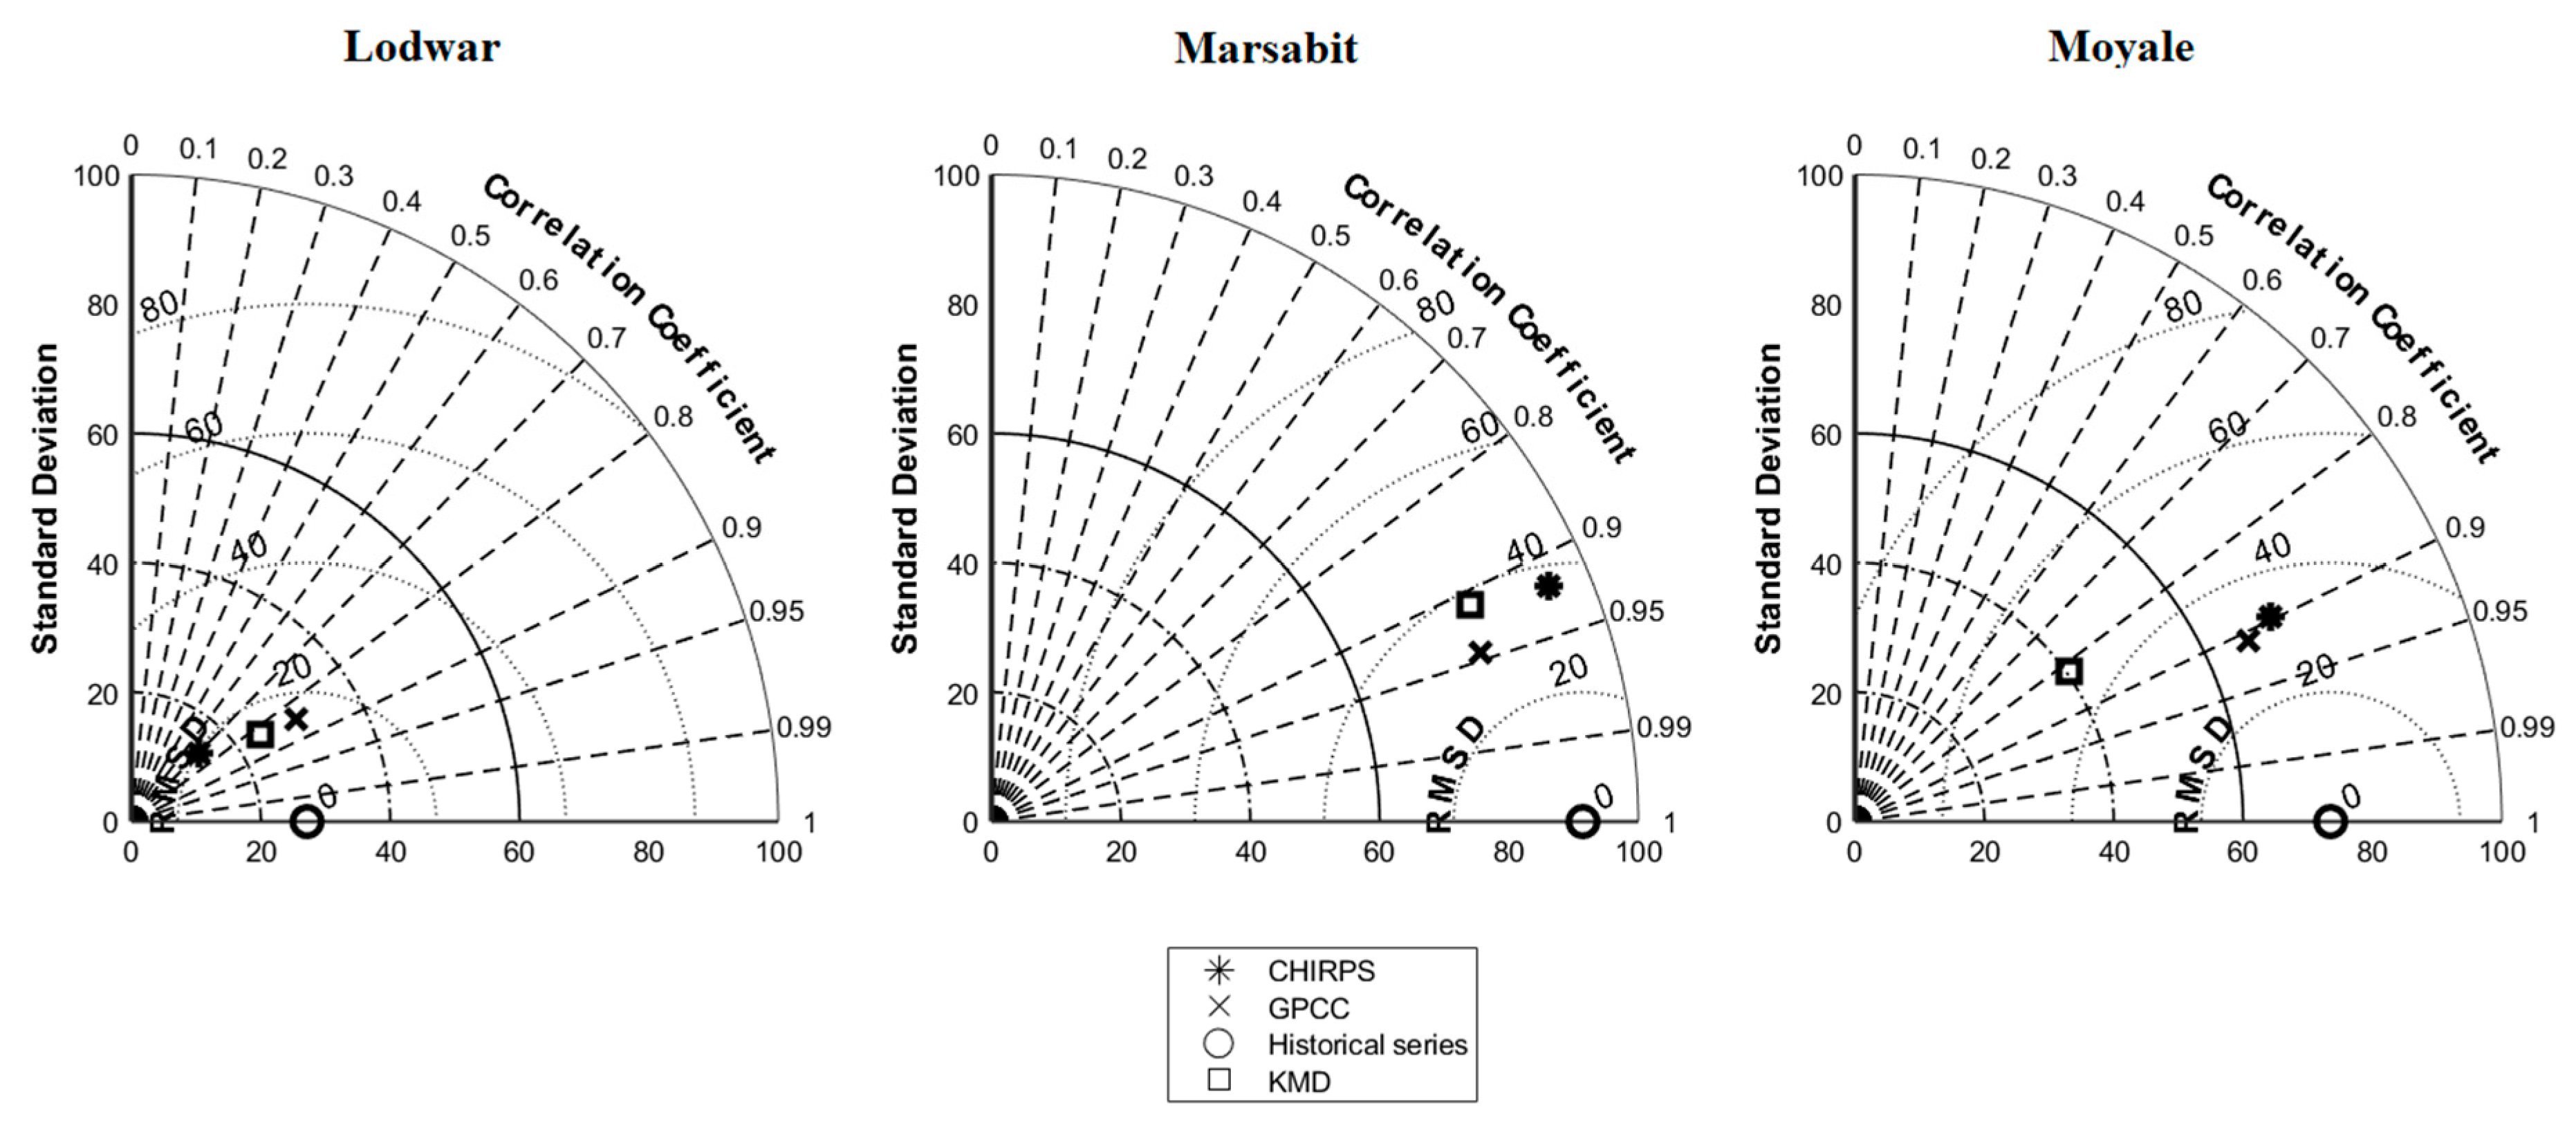
40]. The Taylor diagram was used as a graphical evaluation instrument [
41].
The comparative analysis highlighted the relatively high performance of the GPCC dataset and the low performance of the KMD dataset. The GPCC gauge-based dataset selected was used to rectify the KMD dataset at local level on sampled reference points—the main inhabited areas, usually cited in policy planning [
42,
43]—using the Quantile Mapping [
44] bias correction algorithm. Specific normal monthly precipitation values were identified for the reference points.
The new normal monthly precipitation values can be used in future studies for local purposes while the experimented methodology can be applied in other scant data contexts.
In
Section 2, the study area is described along with the precipitation datasets that were analyzed. The steps of the methodology adopted are also detailed. In
Section 3, the main results are presented. Finally, in
Section 4 the conclusions are discussed with particular attention to the limits and to the possible future perspectives of the research.
3. Results and Discussion
3.1. Comparison of Dataset Performance at Meteorological Station Level
The comparison of the precipitation datasets with the observed series led to an important first conclusion. The KMD dataset does not feature the best indices values for all the stations. Results from the first step of the analysis conducted indicated that the GPCC dataset was a better choice as the reference series.
According to the statistical indices (
Table 2 and
Table 3) and to the Taylor diagrams (
Figure 4), the GPCC dataset fits better for the stations of Marsabit and Moyale, while the KMD dataset fits better for Lodwar. However, for reasons of homogeneity and consistency, the GPCC dataset was also chosen as the reference dataset for Lodwar station since its statistical values are close to the values obtained for the KMD dataset.
3.2. Correction through the Quantile Mapping Method
As showed in the previous section, the GPCC dataset fits better than the other two datasets compared with the historical series. However, the GPCC dataset has a lower resolution (0.5°) compared to the KMD dataset and CHIRPS dataset (0.0375° and 0.05°, respectively), and the differences in local topography may be biased. Therefore, it was necessary to apply a bias correction method to overcome these two problems. The strategy adopted was to correct the KMD dataset (D2), which is issued by the official National Meteorological Service and has the highest resolution, with the GPCC dataset (D1) which performs better on ASALs.
The bias correction method is performed using the Quantile Mapping method from the ‘qmap’ R package. Five different bias-corrected series are obtained based on the five different transformations applied: Parametric Transformations (PTF), Distribution Derived Transformations (DIST), Robust Empirical Quantiles (RQUANT), Empirical Quantiles (QUANT), Smoothing Spline (SSPLIN).
From comparison analysis, the Parametric Transformations method, which fits a parametric transformation to the quantile-quantile relation of observed and modelled values, provided the best results (see
Appendix A and
Appendix B). Hereinafter, the Bias-Corrected KMD dataset will be referred to as the BCKMD dataset (D
3).
3.2.1. Quantile Mapping Validation at Station Level
The performance of the new BCKMD dataset is assessed by means of the statistical indices mentioned previously (see
Section 3.1). The indices have been calculated in relation to the historical series of the land-based meteorological stations, then compared with the same indices calculated for the KMD dataset.
As shown in
Table 4, the BCKMD dataset fits the observed historical series better than the KMD dataset, apart from Lodwar station. This may be due to a higher performance of the KMD dataset—before correction—at Lodwar station compared to the GPCC concerning BIAS, MAE, MSD and RMSD. However, the errors obtained are still acceptably low. In fact, the standard deviation values and the relatively low values of the error’s indices, even for Lodwar, justify the selection of the BCKMD dataset for the study area.
3.2.2. Quantile Mapping at Reference Point Level
The Quantile Mapping correction on the base of the GPCC dataset was also applied to the KMD dataset at the reference points. The Parametric Transformations method has been used in accordance with the validation carried out at the stations level. The result was a best-fit precipitation dataset for the eight locations.
3.3. Calculating Normal Values of Precipitation at Station Level
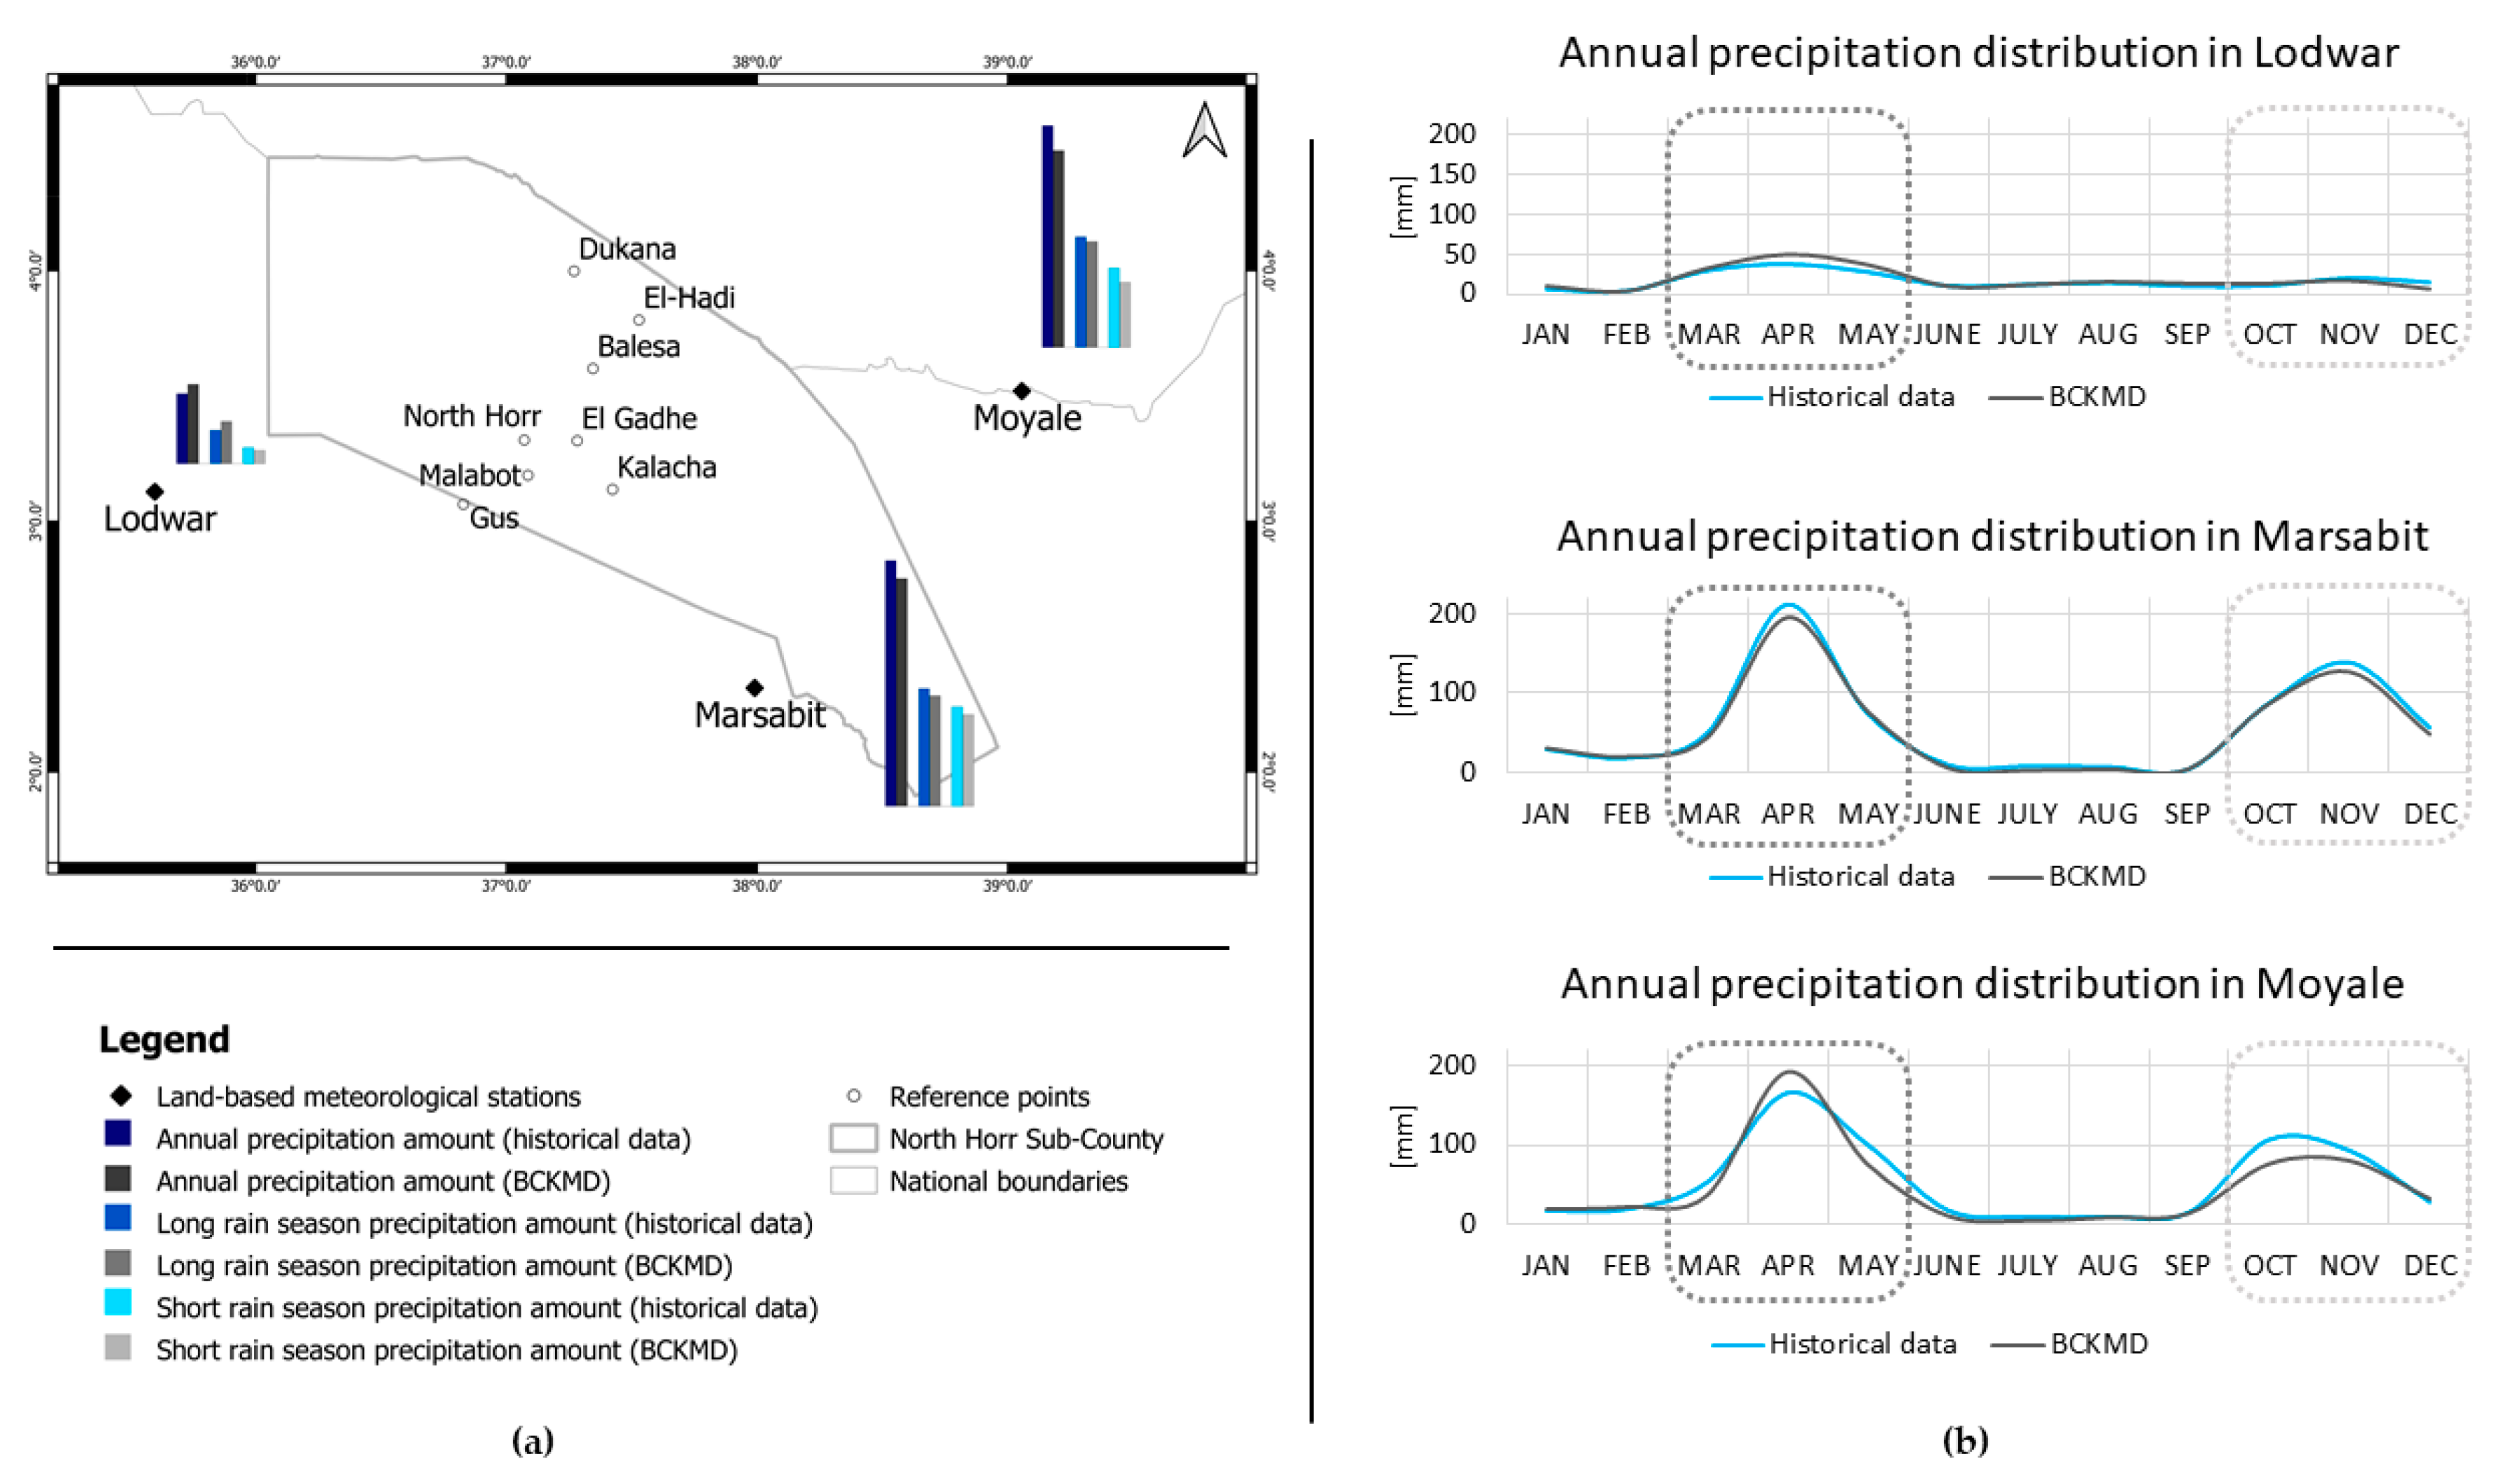
The normal values were calculated on the precipitation series obtained for the three stations, by averaging the monthly precipitation amount for the entire period (1983–2013) (reported in
Table 5). Long rains amount, short rains amount and total annual amount were also calculated.
Figure 5 compares the distribution of the precipitation through the year according to the observed series and to the new BCKMD dataset.
3.4. Calculating Normal Values of Precipitation at Reference Point Level
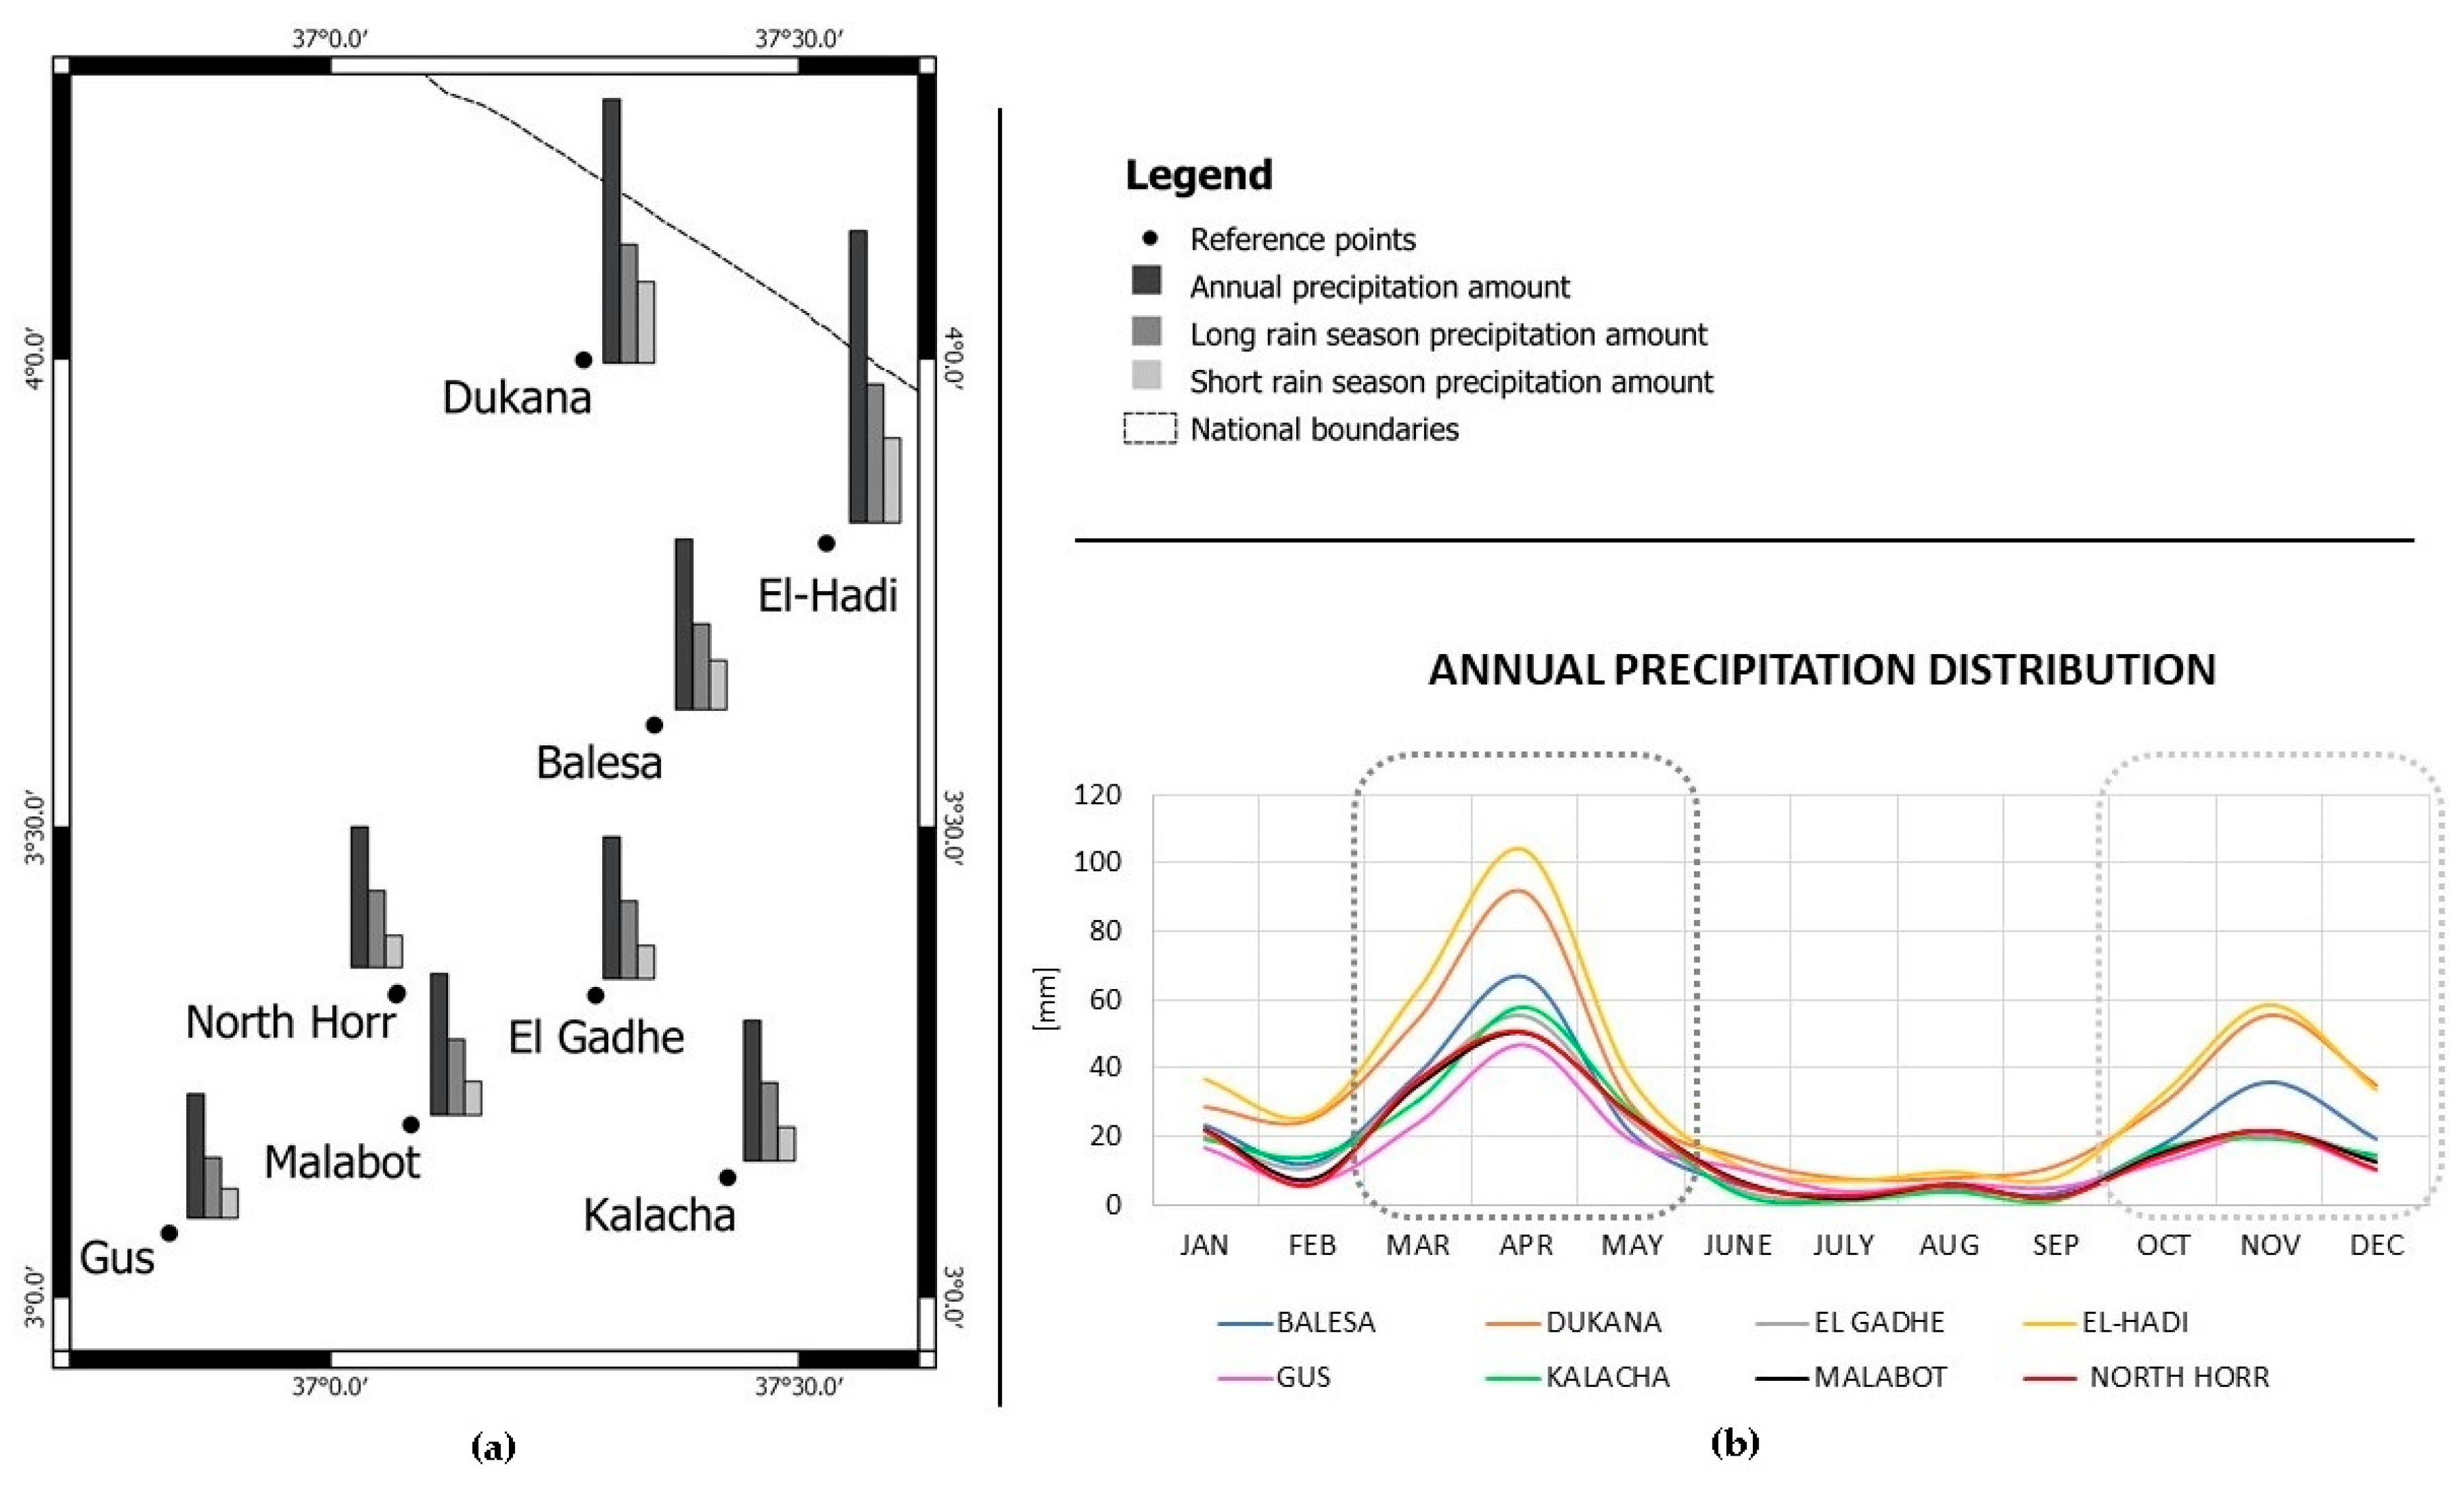
The normal values were calculated on the precipitation series obtained for each reference point, by averaging the monthly precipitation amount for the entire period (1983–2013). Moreover, long rains amount, short rains amount and total amount were calculated.
The normal values for the eight reference points are shown in
Table 6. A visual representation of the precipitation distribution at local scale is pictured in
Figure 6.
The understanding of climate differences at local scale is crucial for an effective territorial planning against negative impact of climate change. This study succeeded in obtaining normal values of precipitation for each reference point despite the lack of land-based meteorological stations in the area and high-resolution and fitting satellite-derived precipitation time series. Differences in rainfall regime are evident in
Figure 6, which shows higher precipitation amounts in the northern part of the Sub-County then in the southern reference points.
The new precipitation time series can be used for the evaluation of drought indices as well as for water security assessment. More specifically, the monthly normal values can be used as reference values for comparing measured or forecasted data in order to evaluate drought or wet periods.
Moreover, it has been possible to calculate the normal values for the entire long rain season and short rain season, by cumulating monthly values for March, April and May and for October, November and December, respectively. Knowing the distribution of the precipitation throughout the year and the possible deviation from normal values is fundamental. This is at the base of the community organization for the local semi-nomadic pastoral population.


