Article

Agrometeorological Forecast for Smallholder Farmers: A Powerful Tool for Weather-Informed Crops Management in the Sahel

by
Maurizio Bacci
1,2,*,
Youchaou Ousman Baoua
3 and
Vieri Tarchiani
1
1
Institute of Bio Economy, National Research Council, 50145 Florence, Italy
2
Interuniversity Department of Regional and Urban Studies and Planning (DIST)-Politecnico and University of Turin, 10125 Turin, Italy
3
Direction de la Météorologie Nationale du Niger, Niamey BP 218, Niger
*
Author to whom correspondence should be addressed.
Sustainability 2020, 12(8), 3246; https://doi.org/10.3390/su12083246
Submission received: 26 February 2020 / Revised: 1 April 2020 / Accepted: 12 April 2020 / Published: 16 April 2020
(This article belongs to the Special Issue Risk-Informed Sustainable Development in the Rural Tropics)

Abstract

:
Agriculture production in Nigerien rural areas mainly depends on weather variability. Weather forecasts produced by national or international bodies have very limited dissemination in rural areas and even if broadcast by local radio, they remain generic and limited to short-term information. According to several experiences in West Africa, weather and climate services (WCSs) have great potential to support farmers’ decision making. The challenge is to reach local communities with tailored information about the future weather to support strategic and tactical crop management decisions. WCSs, in West Africa, are mainly based on short-range weather forecasts and seasonal climate forecasts, while medium-range weather forecasts, even if potentially very useful for crop management, are rarely produced. This paper presents the results of a pilot initiative in Niger to reach farming communities with 10-day forecasts from the National Oceanic and Atmospheric Administration—Global Forecast System (NOAA-GFS) produced by the National Centers for Environmental Prediction (NCEP). After the implementation of the download and treatment chain, the Niger National Meteorological Directorate can provide 10-day agrometeorological forecasts to the agricultural extension services in eight rural municipalities. Exploiting the users’ evaluation of the forecasts, an analysis of usability and overall performance of the service is described. The results demonstrate that, even in rural and remote areas, agrometeorological forecasts are valued as powerful and useful information for decision-making processes. The service can be implemented at low cost with effective technologies making it affordable and sustainable even in developing countries. Nonetheless, the service’s effectiveness depends on several aspects mainly related to the way information is communicated to the public.

1. Introduction

In West Africa, climate change and variability are a major concern for sustainable development affecting agriculture and other key sectors with direct implications on the health and food security of rural populations. In the Sahel, major drought events caused famine in 1973–1974 and 1984 [1] and, since then, rainfall variability has been a key stressor in agricultural activities and is projected to intensify with future climate change [2,3,4]. Sahelian countries, such as Niger, where most of the population lives in rural areas and their main livelihood is rainfed agriculture, are particularly vulnerable to climate risks. In Niger, 84% of the population live in rural areas [5], and 89% of them are considered multidimensionally poor [6], experiencing “multiple deprivations at the household and individual level in health, education and standard of living” following the definition adopted by the UNDP for the multidimensional index of poverty [7]. In Niger, the combination of rainfall variability and poverty dooms rural communities to a chronic vulnerability to food insecurity [8,9].
For two decades, climate-smart agriculture (CSA) has been included in the development agenda with the aim of sustainably increasing agricultural productivity and building resilience of agricultural systems to climate change [10,11]. Among CSA best practices, weather and climate services (WCSs) have been acknowledged as a key opportunity to reduce farmers’ vulnerability in Africa [10]. Many authors [12,13,14,15,16,17] provide evidence that agrometeorological information tailored to farmers can improve agricultural productivity and increase their income thereby reducing the impacts of climate change and minimizing the risk of food insecurity. However, at the farm level, agrometeorological services are often not really relevant, adapted, and usable for decision making in crop management. Indeed, national institutions are not well-equipped to respond to users’ needs in terms of both forecasting expertise and dissemination channels.
National meteorological services in West Africa usually concentrate their forecasting efforts on short term and seasonal lead times. Short-term weather forecasts, one up to three days, as usually provided by met services, are not sufficient to take some strategic decisions on crop management planning and risk reduction strategies, which require 10 days to seasonal lead times [10]. Ten-day forecasts are not usually produced, even if they are particularly relevant for farmers and the benefit of their application in crop management, in terms of impact, is demonstrated to be even greater than seasonal forecasts [18]. Moreover, 10-day forecasts can be used for integrating the information from seasonal forecasts with a major increase in their effective application for WCSs [19].
Ten-day forecasts are generally considered a difficult time range, since the lead time is long enough for uncertainty from the initial conditions to arise and bias the numerical simulations [20]. Meanwhile, the models do not have enough time to “warm up” and correctly reproduce the global atmospheric dynamics [21]. The skill of such forecasts is often considered too low by met services and they do not often produce them. The main concern is to deal with the intrinsic uncertainty of medium-range weather forecasts. To properly communicate uncertainty, it is recommended that quantitative information be encoded in a way that fosters accurate decoding and prevents deterministic misinterpretations of uncertainty and the level of detail is chosen according to the forecast’s skill [22]. Therefore, recognized good practices recommend translating quantitative values into categories through a participatory approach after an initial stage of testing and performance evaluation in the specific context.
A review on perceptions and use of WCSs in agricultural decision making [23] highlights that farmers seek contextual and location-specific forecasts to aid decision making and “would like access to forecasts at the correct time to facilitate decisions (such as predicted harvest conditions) and predict impacts, so they can be mitigated before they become severe”.
The time-gap between issuing of the forecast and its reception by farmers has long been a critical challenge for agrometeorological warning systems, particularly in the least-developed countries, such as Niger, where information dissemination networks are weak, distances are large, and the extension service has suffered a chronic lack of financial resources for many years. The wide diffusion of mobile phone technology throughout sub-Saharan Africa offers the potential to reduce the time-gap and costs associated with the dissemination of forecasts to farmers [24,25], changing the extension service paradigm. Indeed, the agriculture extension service has for a long time been characterized by, and often criticized because of, its linear knowledge transfer approach and its incapacity to use systematic approaches for service delivery [26]. According to this approach, the proximity of agriculture extension officers to farmers was considered the main factor influencing the adoption of climate-informed cropping practices [18]. Currently, the concept of proximity is changing from a geographical perception to a social one, mediated by social networks and the media. New Information and Communication Technologies (ICTs) are enhancing the interaction and information exchange within the agriculture innovation system and changing the relations between information providers, extension officers, and farmers [27]. Moreover, digital technology could allow communities to provide timely feedback on information received and its performance, thereby improving their engagement in the whole agrometeorological monitoring system.
During the last decade, several pilot initiatives, by national and international bodies, have been set up to provide WCSs to farmers in West Africa, mainly based on short-term weather forecasts or climate seasonal forecasts addressing the main hazards that affect agricultural activities such as a delay in the onset of the rainy season, dry spells, and an early end of the rainy season. Nevertheless, none of these initiatives addresses the issue of producing and disseminating medium-range weather forecasts and related agrometeorological information for smallholder farmers.
Given the hypothesis that 10-day agrometeorological forecasts can effectively enhance a WCS’s capability to improve agricultural productivity and increase farmers’ incomes, this study aimed to answer the following research questions:
  • How can a national met service produce and disseminate 10-day agrometeorological forecasts in remote rural areas in a timely and sustainable way?
  • Do 10-day agrometeorological forecasts meet the needs of farmers in supporting their decision-making process?
  • How can the encoding of agrometeorological information disseminated to farmers be improved?
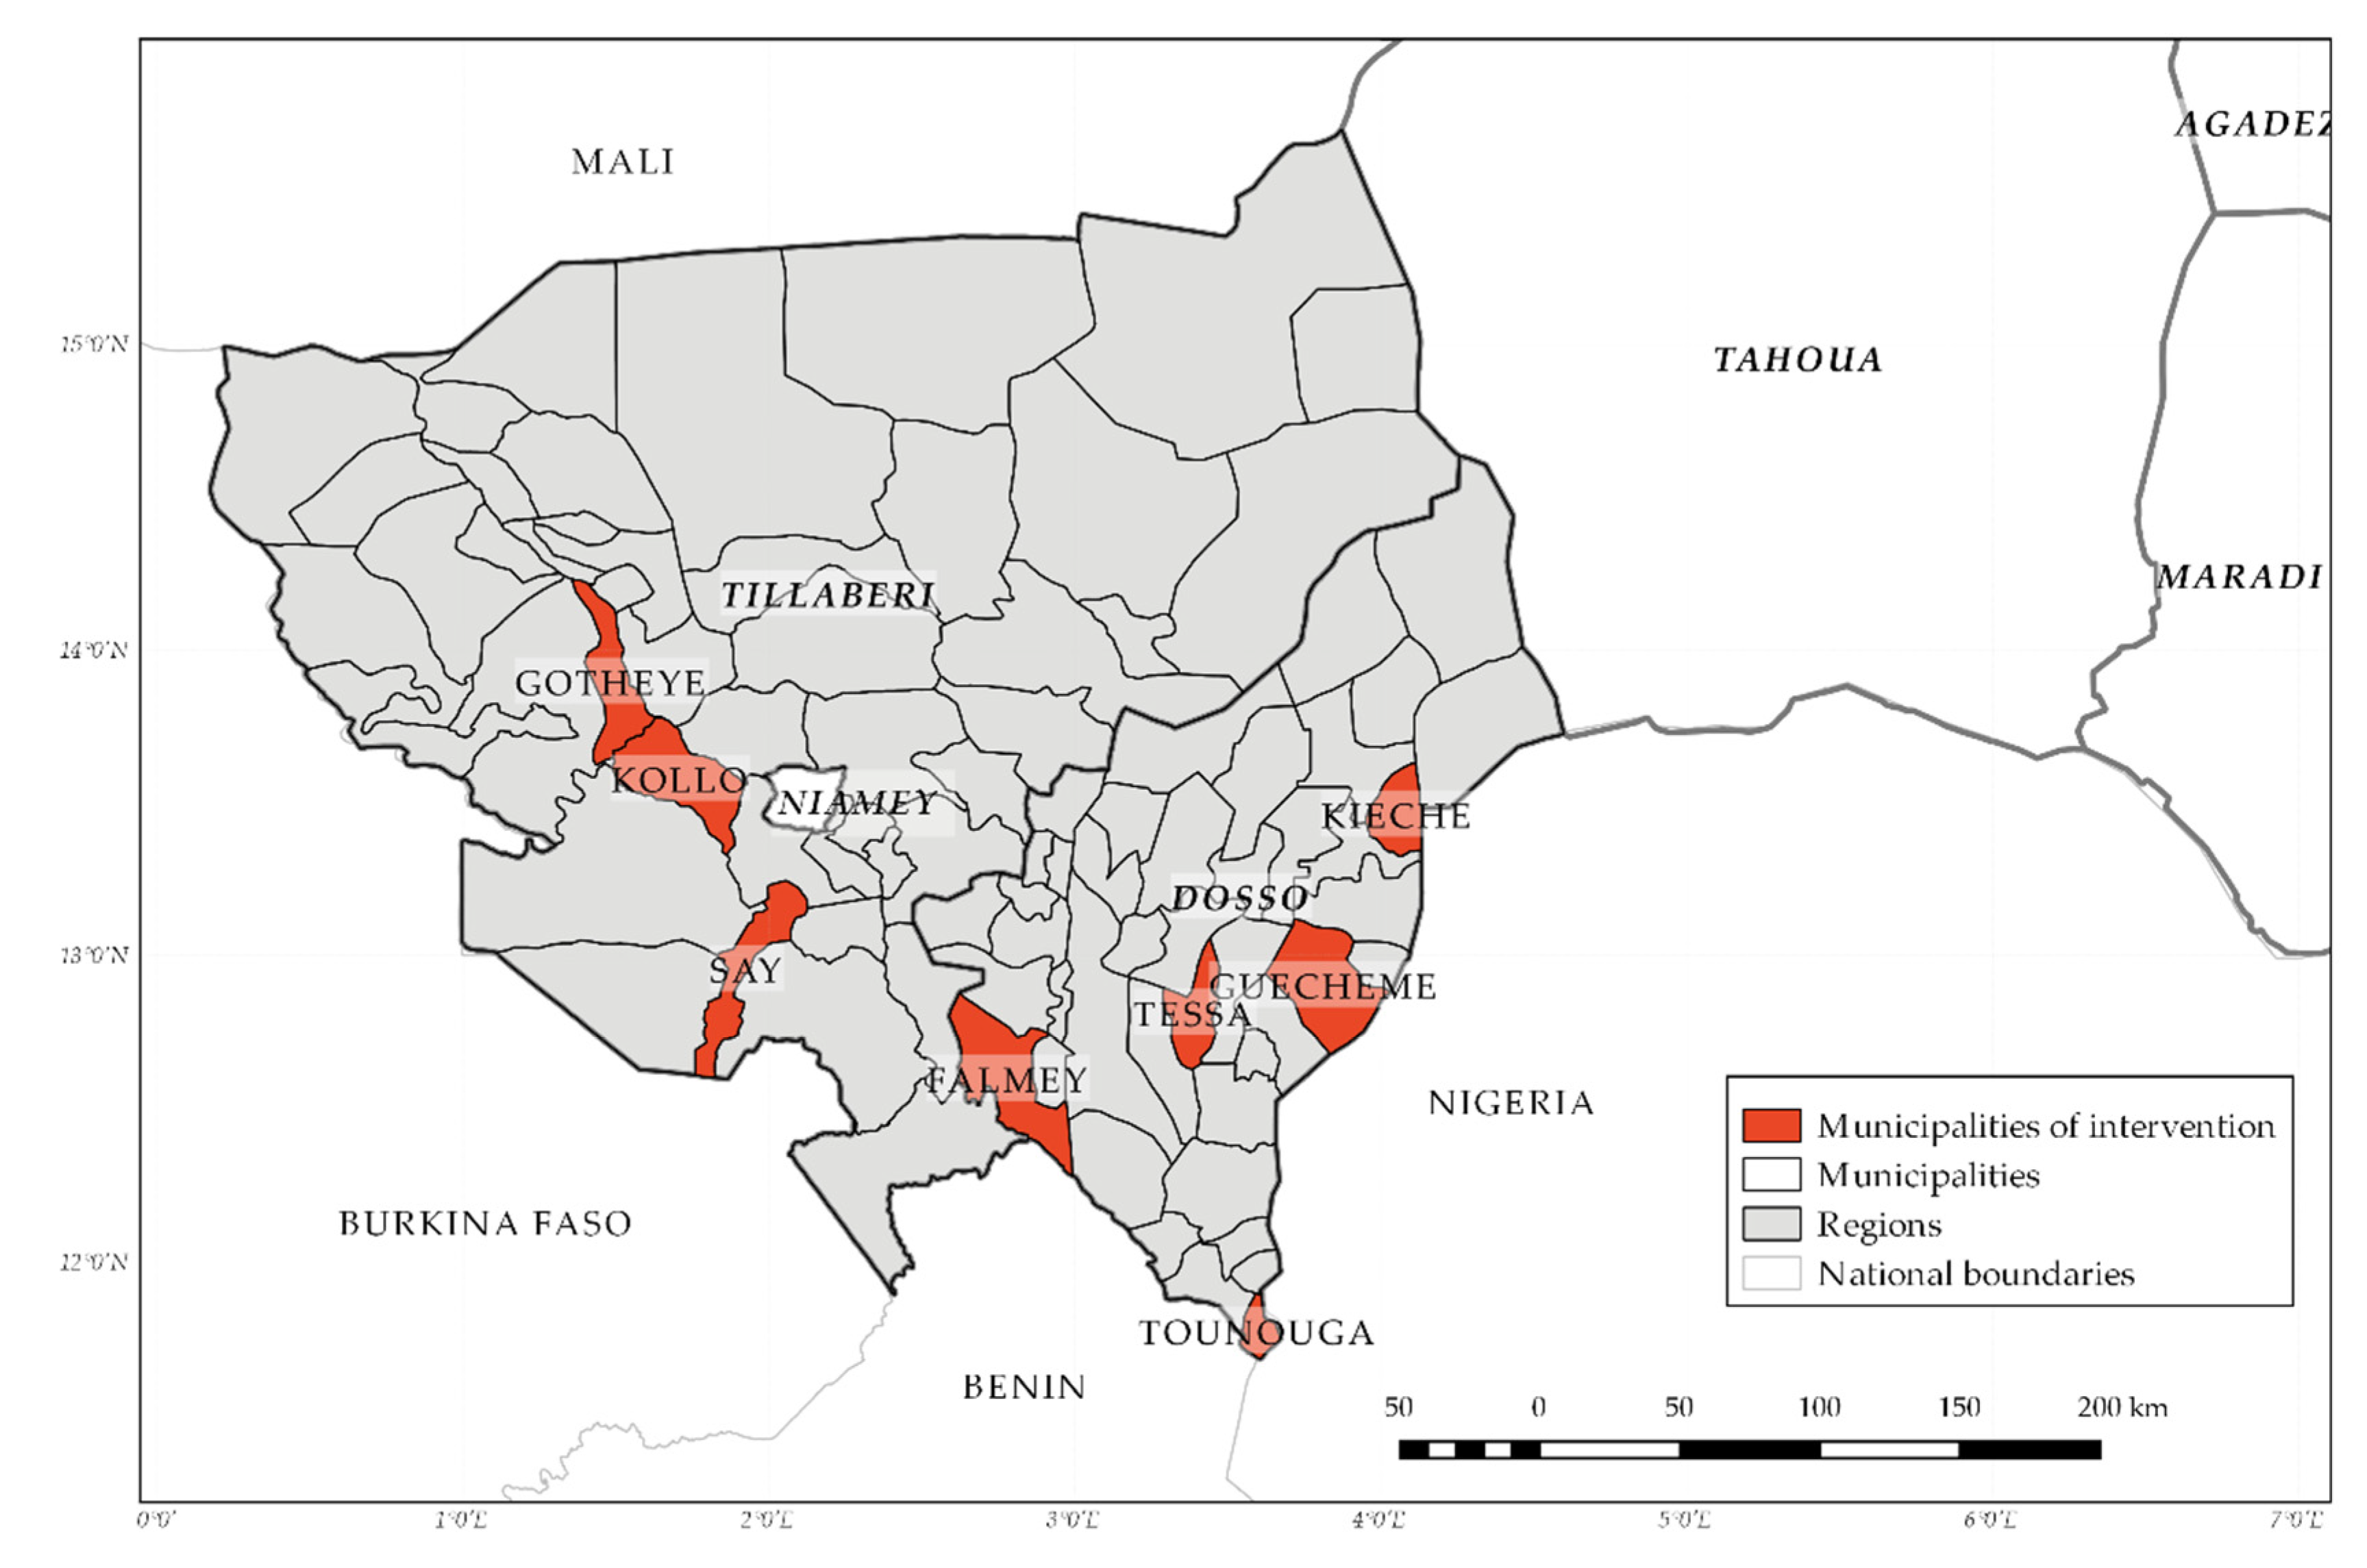
In order to answer these questions, this paper describes the service developed within the ANADIA (adaptation to climate change and disaster risk reduction in agriculture for food security) project in Niger. The project, funded by the Italian Agency for Development Cooperation, provided technical support to the Niger National Meteorological Directorate (DMN) to improve its capacity to reduce climate risk at the local level. The project included eight municipalities in Tillaberi and Dosso regions. Within this initiative, a case study was set up aiming to (i) fill the gap in agrometeorological medium-range forecasting at DMN, (ii) improve the usability of such information by the local communities and (iii) tailor information dissemination at the municipality level. The results coming from this experience demonstrated that, even if some improvements are needed to make this process fully operational, the forecasts issued are globally appreciated by the local communities, who judged them useful for their decision-making processes.
The paper is organized in five sections. After this introduction, Section 2 describes the materials and methods and Section 3 presents the main results. In Section 4, we discuss the findings according to the three research questions and, lastly, in Section 5, some conclusions and indications on the way forward are provided.

2. Materials and Methods

2.1. The Approach

According to Vaughan and Dessai [28], WCSs are more effective if co-produced through a collaboration between forecasters and users. The approach we used was inspired by the theory of co-production described by Vincent et al. [29], which implies an adaptation of the workflow “moving from supply-driven to demand-driven models” and also adopting adaptive programming “to incorporate learning into activities in real time”.
The aim was to produce a few comprehensible agrometeorological indexes useful for farmers’ decision-making processes. The set of indexes was defined through participatory meetings with local extension services covering crop farming, livestock rearing, and the environment. The indexes identified through the participatory process are described in Table 1.
Identified indexes were implemented and tested during a first cropping season and then discussed again with users adopting a design-based research method, iteratively improving the design through trials [30], repeated in the second year. The users selected for the test were the municipal extension officers, who can identify the advantages and gaps of the service.
The dissemination mechanism was jointly defined with users: every 10 days during the cropping season (from 1 May to 21 October), the information was sent by DMN as a plain text message by mobile phone (SMS or instant messaging application, i.e., WhatsApp, according to users’ preferences). Dissemination at local level was then performed by local media and social networks.
In order to ensure the sustainability of the service, the entire process of issuing forecasts was transferred to the DMN. The procedure was conceived as simple as possible in order to be run with low computing power and also open and flexible to be customized and extended to other municipalities in Niger. The operating system, programming environments, and data used for implementing the procedure were all open and free of charge. Particular attention was given to building the capacities of local technicians in programming and meteorological data processing. Experts from DMN were trained in Bash programming language (syntax and semantic); machine, operating system, and software configuration; and gridded data processing. After the training, a manual describing all the steps was written as course material. In a second phase of the training in Niger, some days were devoted to assisting the DMN in the configuration of the machines in their labs and testing the procedure with the local internet connection. This training represents a cornerstone for the sustainability of the service.

2.2. Methods

Ten-day forecasts are available from different models and institutions worldwide, but, in this initiative, we chose to test the Global Forecast System (GFS) by the National Centers for Environmental Prediction (NCEP) of the National Oceanic and Atmospheric Administration (NOAA) forecasts because they are provided free of charge and in real time. The GFS is a weather forecast model made available at three resolutions—0.25, 0.5 and 1 degree—with 4 runs per day, at 00, 06, 12, and 18 (GMT), by internet and it is possible to configure a machine to automatically download just the parameters of interest, in this case, the accumulated precipitation (APCP) output. The GFS forecasts contain 325 fields per forecast time and each time step is about 350 MB, so the complete 10-day forecast bundle reaches several gigabytes of data to download. Given the limitation of the internet band in Niger, it is impossible to complete the download in a useful timeframe. We optimized the download to about 30 MB of data by adapting the script “get_gfs.pl” produced by Wesley Ebisuzaki and available on the Climate Prediction Center (CPC) web page [31].
The download system worked on Linux operating system with Perl programming language [32]; CURL [33], a command line tool and library for transferring data with URLs; and Wgrib [34], which is a program to process, inventory, and decode GRIB files. The machine configuration did not require high performance so it is also possible to use obsolete configurations to launch the procedure (we successfully tested the procedure with a Pentium machine). Once the rainfall forecast images at 0.25′ resolution from 0 to 240 h were downloaded, we used a script, developed in Climate Data Operator (CDO) [35] language, to process and calculate the different indexes required and, finally, to produce a text message for each pilot municipality. As the script was executed, it automatically extracted the 10-day forecast of the grid that contains the centroid of the municipality. The forecast products elaborated for each municipality were:
  • Cumulative 10 days rainfall (mm);
  • Number of rainy days;
  • Number of rainy days above 20 mm;
  • Maximum number of consecutive dry days;
  • Number of dry periods of at least 5 consecutive dry days.
As pilot initiative, there was no available information about the performance of the GFS 10-day forecasts in Niger. In the first stage, it was not possible to apply any bias correction to the forecast because the debiasing process demands an initial training period. For the same reason, we decided to disseminate the forecasts in uncategorized numeric values (numbers) because no historical series of forecasts was available for statistical categorization and also to reduce misleading communication. Indeed, users did not have any experience in the interpretation of categorized forecast.
Nevertheless, the perspective was to debias and categorize the forecasts and this research contributes with an ex-post analysis, using the comparison between predicted and observed values for each dekad and municipality. Two different approaches were used. The first was based on the definition of 5 classes, valid both for forecast and observation time series, then we assigned the class for each record in the time series. The values were defined based on the quantiles of the historical observations time series only, because historical forecasts time series were not available. The classes could be eventually defined with different values following the farmers’ needs, however, the limit is that this approach did not ensure any bias correction. The classes are presented in Table 2.
The second classification used the values of observation and forecast for the 2019 campaign categorized in 5 classes (using the 20th, 40th, 60th, and 80th quantiles) each (using forecast quantiles for forecasts and observations quantiles for the observed values). This approach also allowed a very simple quantile—quantile bias correction of the forecast. The classes for 2019 are reported in Table 3.
Short text messages were chosen as output of the script because they can easily be spread via SMS or instant messaging applications (e.g., WhatsApp) according to user preference. The whole procedure lasted around 30 min with the available internet band in Niger. It was run by the DMN at the beginning of each 10 days (1st, 11th, and 21st days of the month) and, at the same time, users gave their feedback on the previous 10-day forecast by filling in a form. The form provided qualitative and quantitative evaluation of the previous 10-day forecast. Quantitative feedback consisted of a comparison of forecasted and observed rainfall (collected with a rain gauge of the national observation network that they manage) filling the form in Appendix A (Figure A1), qualitative feedback consisted of users’ appreciation of each product, rating the performance from 1 (lowest) to 5 (highest), and other comments and suggestions, filling the form in Appendix B (Figure A2).
The test of the 10-day forecast started in May 2018 with an initial 5 municipalities in the Dosso region. During the first year, DMN regularly sent the forecast to local focal points, receiving their feedback during the whole cropping season. Then, in November 2018 during a participatory meeting with all local stakeholders, the result of the first test season was discussed. The participants greatly appreciated the service and based on the feedback and requests from other municipalities, the service was extended to another 3 in the Tillaberi region (Figure 1).

3. Results

3.1. Skill of Forecasted Indexes

During the two years, 210 10-day agrometeorological forecasts were issued, distributed as follows: 90 for the first year in five municipalities of the Dosso Region (18 dekads from 1 May to 21 October 2018) and 120 in the second year in eight municipalities of the Dosso and Tillaberi regions from 1 May to 21 October 2019. At the beginning of 2019, we had some technical problems in accessing input forecasts due to changes in the GFS data format and also some communication difficulties in the municipalities of Ouro Guéladio, Gotheye, Namaro, and Tounouga.
Analyzing the forecasts distributed during the 2019 rainy season in comparison with the observed data, an overall underestimation of precipitation was observed in almost all municipalities except for Ouro Guéladio (Table 4).
Even if in some municipalities (Ouro Guéladio, Gotheye) the difference in the total amount of precipitation is not significant, different skills of the forecasts were observed during the rainy season with an irregular distribution among municipalities (Figure 2).
Despite this irregularity in the error distribution of rainfall amount, the forecasts were satisfactory on the most important aspect having a direct impact on farmer’s choices, such as the indication if the next dekad will be wet (>1 mm) or dry (≤1 mm) (Table 5).
In general, forecasts were able to correctly predict the weather for the next dekad with a percentage of 87.5. This information is crucial for farmers because they can plan their agricultural activities or take measures against dry spells in the coming dekad (delay of sowing, use of fertilizers, etc.). In general, GFS forecasting skills were irregular among municipalities during the rainy season. The skill of other indexes is reported in Table 6.
Concerning dry days, there was a systematic underestimation of less than 2 dry days per dekad, which was probably due to an overestimation of the number of drizzly days. In fact, the forecast models in West Africa seemed to overestimate the number of days with just a few millimeters of rainfall [36].
Regarding intense phenomena, the capacity of the model to predict very heavy precipitation days, in which the rainfall amount was more than 20 mm, in the 10-day period is shown in Table 7.
In 2019, the model correctly predicted 65.8% of the occurrence of heavy precipitation in the next dekad.

3.2. Perception of the Performance of the Different Indexes

Although the accuracy of forecasts might not seem very satisfactory, the feedback collected from the 120 surveys distributed during the cropping season, about the perception of the different indexes’ performance, showed a different and more positive picture. The answers to the following questions, rated from 1 = very weak to 5 = very high, are displayed in Table 8:
(1a)
Rate the performance of the 10-day cumulative rainfall forecast;
(1b)
Rate the performance of the number of rainy days forecast;
(1c)
Rate the performance of the number of rainy days with more than 20 mm forecast;
(1d)
Rate the performance of the maximum duration of dry spell forecast.
The rating of each index was the result of a judgment process that is related to the user’s expertise in the field, which depends on the agronomic characteristics of the municipality and the specific vulnerability to climate variability of each cropping stage. The overall appreciation of the performance of the indexes was medium or high. In particular, users rated best the capacity of the model to forecast dry spells and very heavy precipitation days. Despite the results shown in Table 3 and Table 4, the end users appreciated the ability of the forecasts to predict extreme phenomena. This information, even if not accurate in terms of numerical values, was sufficient to take some actions (i.e., waiting until the next dekad to sow, harvesting in advance, distributing fertilizers, etc.). In general, the decision that farmers make with one or more episodes of heavy precipitation forecast in a dekad is the same, so it became more essential to know if a phenomenon was expected in the next 10 days instead of knowing exactly the number of episodes.
An important aspect is to understand how the end user rates the performance of each index. Comparing, for each dekad, the rating of the user and the difference recorded with the rain gauges, we could identify the threshold implicitly adopted by users to rate the performance. Table 9 shows the range of precipitation difference, in absolute values, that were recorded during the survey for the eight municipalities.
It might be astonishing to observe that 1.1 mm of rainfall amount difference in 10 days is set as a weak forecast performance or 43.1 mm of difference set as a high forecast performance. However, these thresholds have to be contextualized in the framework of crops and season development and the relative importance of the concomitance of a dry or very wet dekad, where such a difference can produce impacts on crops (or not). In general, users rate as a very high forecast performance up to 5 mm of difference and very weak when the difference is over 40 mm but the rating is highly dependent on the period of the rainy season.
Consequently, the further question we asked ourselves is whether the users had sufficient skill to correctly evaluate the performance of the indexes. Grouping the users’ ratings by their score, we analyzed the dispersion plot of each pair, forecast and observation, for the five rating classes (Figure 3). The combined dispersion plot shows a general coherence by users in rating the forecast performance with just a few outliers. The best performance of the dispersion plot of the “very high” score (blue dots) and the diminishing quality of the following classes until the “very weak” score (red dots) that record the worst performance, demonstrate the overall capacity of users in their qualitative evaluation of the forecast performance through their own expertise.
For the second point of the survey, “Do you find this information about the forecast indexes pertinent/useful?”, in all (120) forms received the answer was a positive “yes”. This is the most encouraging aspect of the initiative, which demonstrated that reaching the farmers with tailored information was very important despite the uncertainties of the global models. Farmers already use their traditional knowledge to predict the evolution of the season [37,38] and these forecasts were mainly integrated with their own knowledge to make their choices.

3.3. Test of Forecasted Rainfall Amount Categorization

At the end of the rainy season, an ex-post analysis was made using the comparison between the predicted and observed values of dekadal rainfall amounts. Two different approaches were tested: (i) five homogeneous classes for observations and forecast values and (ii) the definition of the five classes through the application of the quantile–quantile correction for the two series, introducing a very simple bias correction. The skill evaluation between the two classification methods was done through the difference (distance) in classes from the class of forecast vs. the class of observation. Figure 4 shows the results using the 120 dekads available for the eight municipalities in 2019. The application of the quantile—quantile classification method allowed a very good probability (83.3%) to be obtained that the forecasts were in the same class as the observation. Only in 2.5% of the dekads did the forecast differ by more than one class with respect to the observation. While with the fixed classification only 38.3% of the forecasts were in the same class as the observation.

4. Discussion

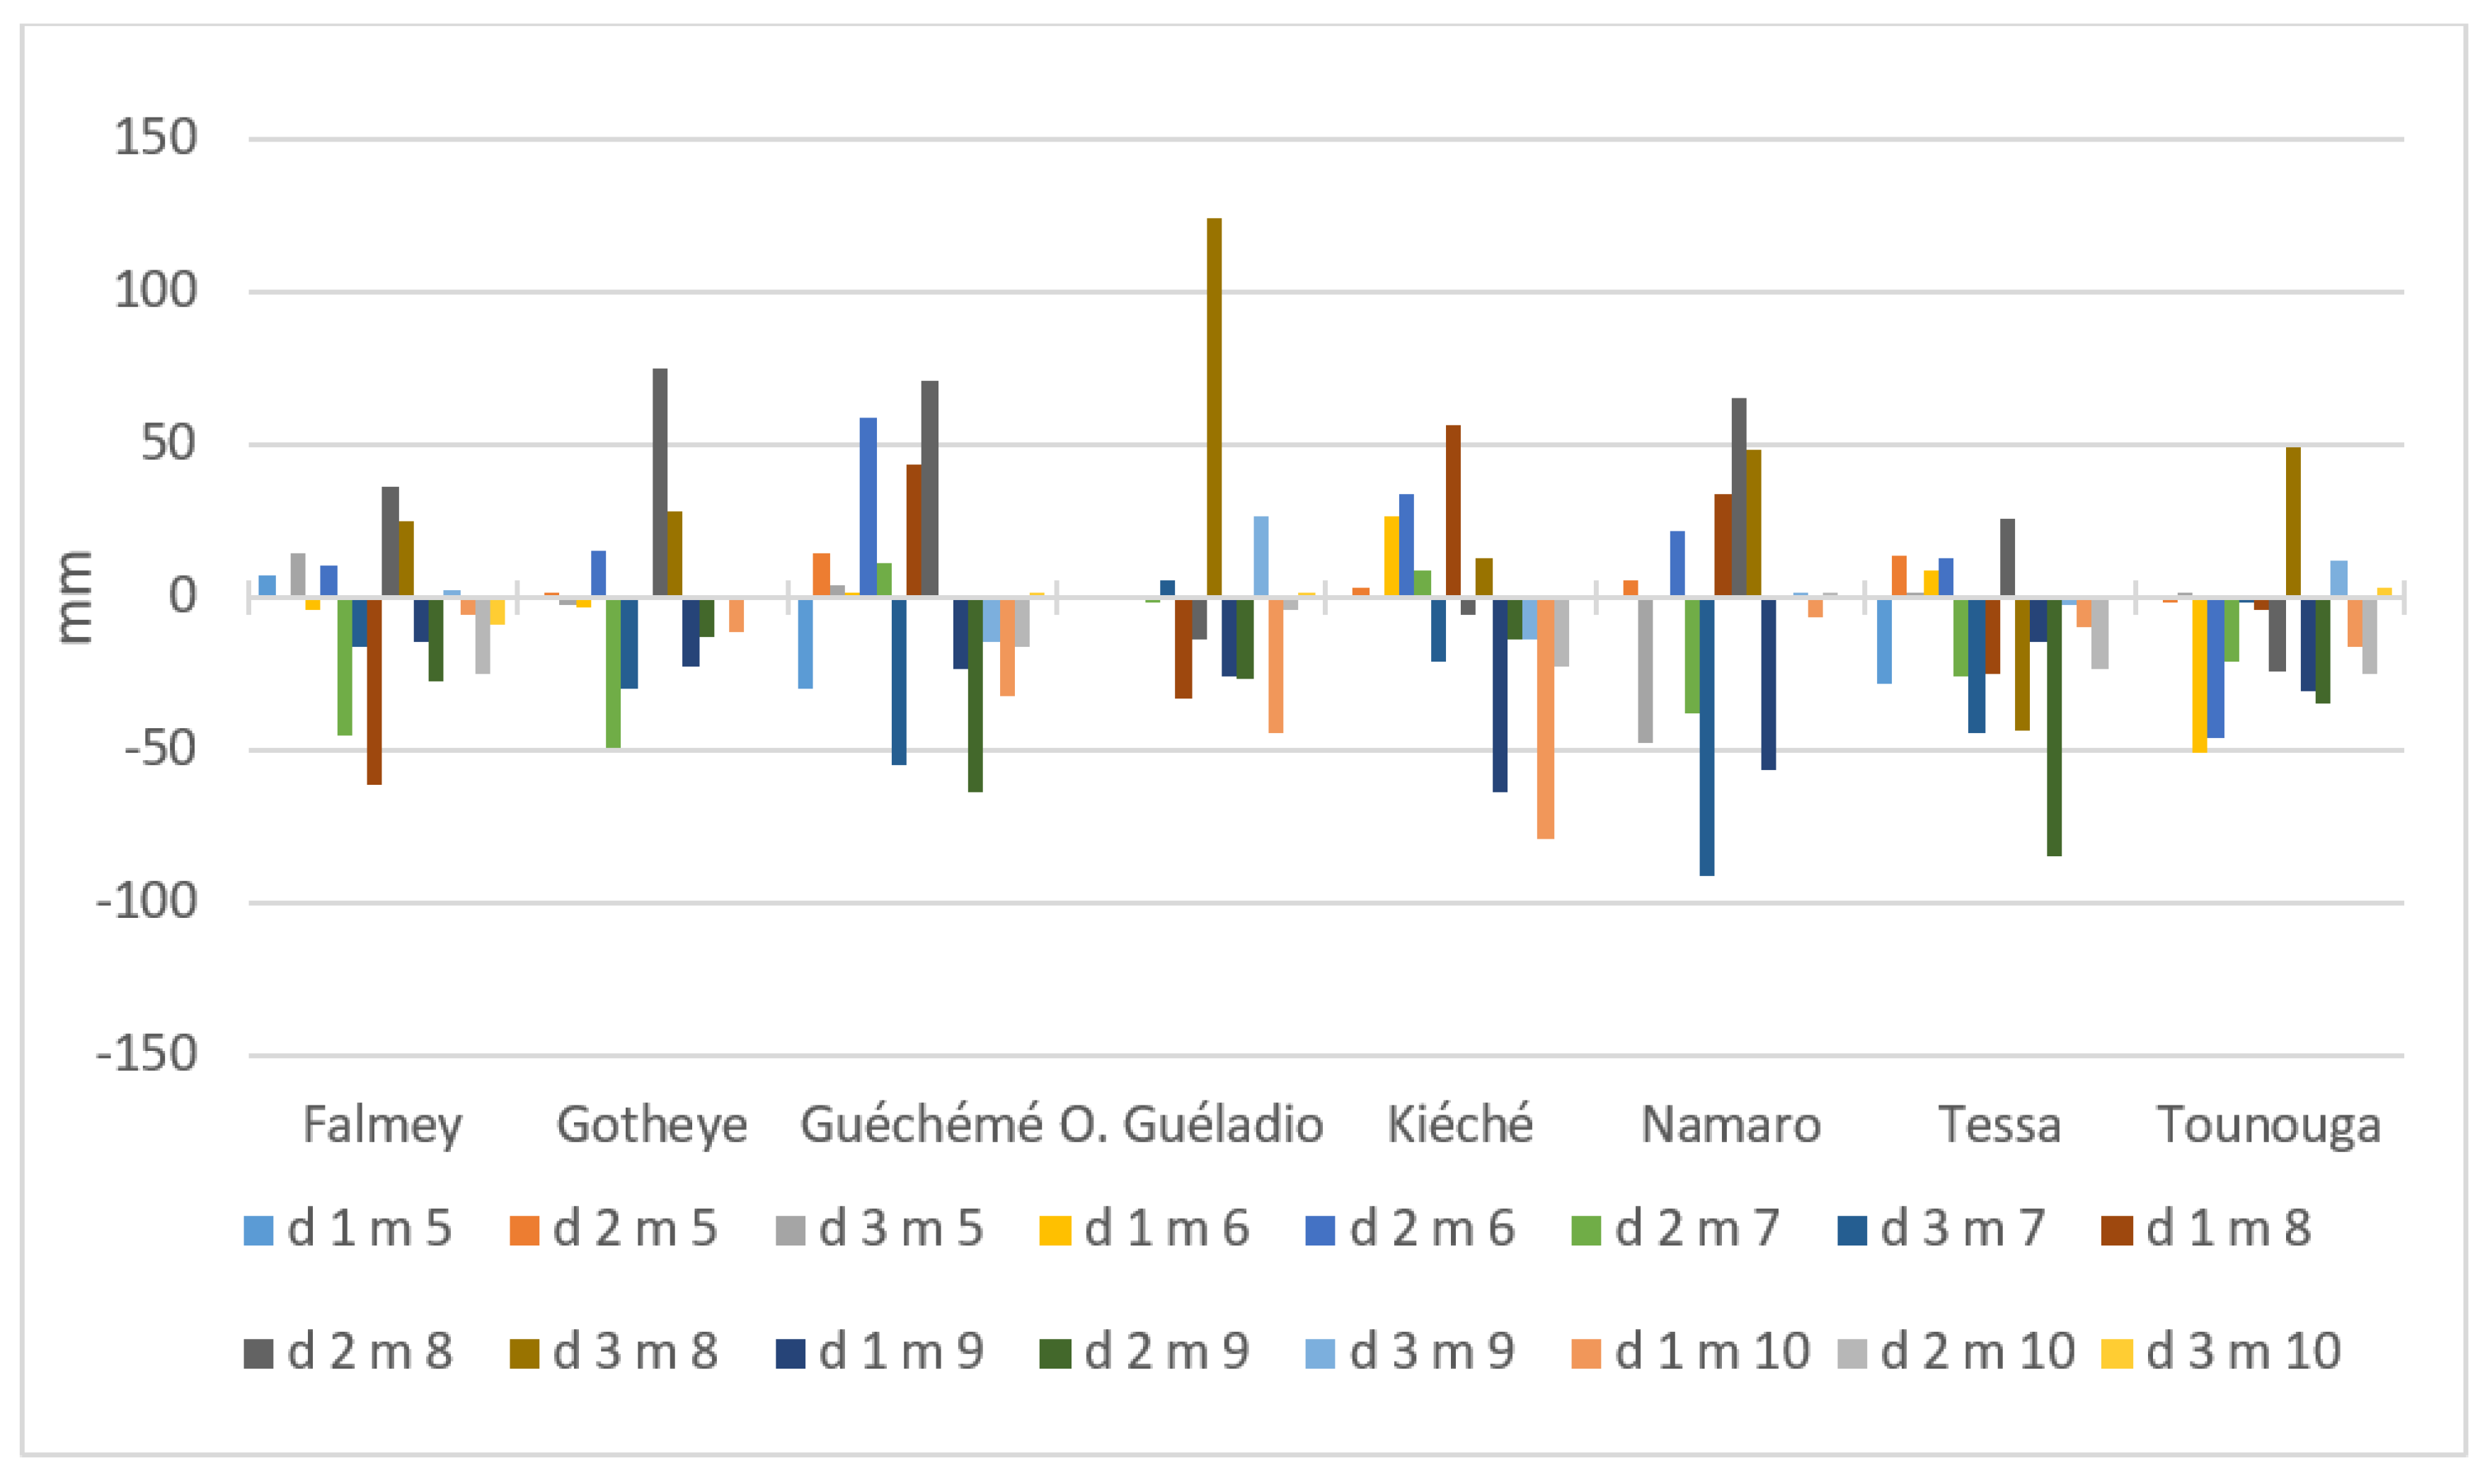
The quantitative results of the performance analysis of the 10-day forecast indexes were not very different from the results already published in the literature on the skills of medium-range weather forecasts [39,40,41,42]. The hypothesis we made at the beginning was that in a context where any weather forecast with a lead time longer than one day exists, 10-day agrometeorological forecasts, even with low accuracy, can sustain local decision making if appropriately applied. Therefore, assuming that the skill of the forecasts is good enough to guide cropping practices, some answers to our research questions are discussed hereinafter.

4.1. How Can a National Met Service Produce and Disseminate 10-Day Agrometeorological Forecasts in Remote Rural Areas in a Timely and Sustainable Way?

The question contains two different aspects concerning the availability of dissemination technology and technical expertise. Both challenges were tackled adopting simple solutions, contributing to the sustainability of the process. Very simple dissemination technology could be used effectively. Even in remote rural areas, mobile phones are widely used and even smartphones are common. The dissemination mechanism worked quite well during the two years. We had some issues at the beginning of 2019 related to internet connectivity in a few municipalities. This showed that the mechanism is more sustainable if users work with their own smartphone rather than providing new ones for the purpose of dissemination. Prepaid internet credit can simplify and encourage users to be connected but it is not strictly necessary.
The choice of plain text messages simplified the process of communication from the central to the local level. Dissemination was then ensured by local media and social networks. A key role in agrometeorological information dissemination to the public was therefore played by rural radios, which are the main information media in Niger rural areas and identified by farmers as the preferred channel to access WCSs [43,44]. For this reason, radio stations were fully engaged in the dissemination process since the beginning of the initiative.
The agrometeorological indexes were actually disseminated at the beginning of each 10 days (1st, 11th, and 21st days of the month) while the 10-day forecasts were produced each day by GFS. It would be possible to produce the agrometeorological indexes daily and send them to farmers. However, sending indexes with a daily frequency to farmers would not be sustainable, and probably also not useful. The communication mechanism was designed according to the existing DMN chain of information dissemination, so that during the two years of experimentation, the forecasts were produced and disseminated with the decadal bulletins sent by DMN each 1st, 11th, and 21st days of the month. Nonetheless, the dissemination of updates with a shorter delay, i.e., 5 days, should be considered as a possible improvement in the whole process.
The training program and further knowledge transfer were demonstrated to be critical to successfully set up and maintain a semi-automatic procedure and replicate it in other areas. We found that new technical problems could arise daily, such as changes in the data distribution and format by the NOAA, which failed to undermine the sustainability of the system. However, strong collaboration and on-the-job training allowed the procedure to be modified and fixed in a reasonable time.
In the context of weak national institutions, another important aspect of sustainability is the cost to maintain the system. The use of open and freely available programming languages and simple procedures not demanding high calculating power ensured low cost, as well as the use of GFS products that were freely available. A final aspect is the replicability and sustainability of extension to other areas, even to the whole country. The entire procedure took 30 min to run even on obsolete Pentium hardware, but the time was not proportional to the number of localities because the bottleneck is internet access (data download from GFS), not the calculating time for processing the forecasts. The system is therefore easily extendable to the whole country without a significant increase in running time.

4.2. Do 10-Day Agrometeorological Forecasts Meet the Needs of Farmers in Supporting Their Decision-Making Process?

Users perceived the agrometeorological 10-day forecasts as important for their decision-making processes, even if they were not quantitatively accurate. Indeed, the feedback received from users underlined that they are able to manage forecast uncertainties in their daily activities. Although this should not be an excuse for not improving the forecast (the forecasting skills could be improved by using a regional model and intensifying the network of observation stations to allow a better initialization of the model), it seemed to us more profitable and pertinent to tailor existing information to specific end-users’ needs.
The service was generally and unanimously perceived as positive and useful for local communities, even if some problems related to the forecast accuracy were real. The bidirectional exchange of information, strengthening collaboration between the national and local levels, was a positive outcome of the initiative. The participatory approach made local communities feel that they were engaged in a process and therefore contributed to building trust and credibility. Indeed, according to Wall [45], the process is often as important as the outcome.
According to the feedback from users, further development will concern new forecast information, such as strong winds and temperatures, which farmers perceive as useful for crop management.

4.3. How Can the Encoding of Agrometeorological Information Disseminated to Farmers Be Improved?

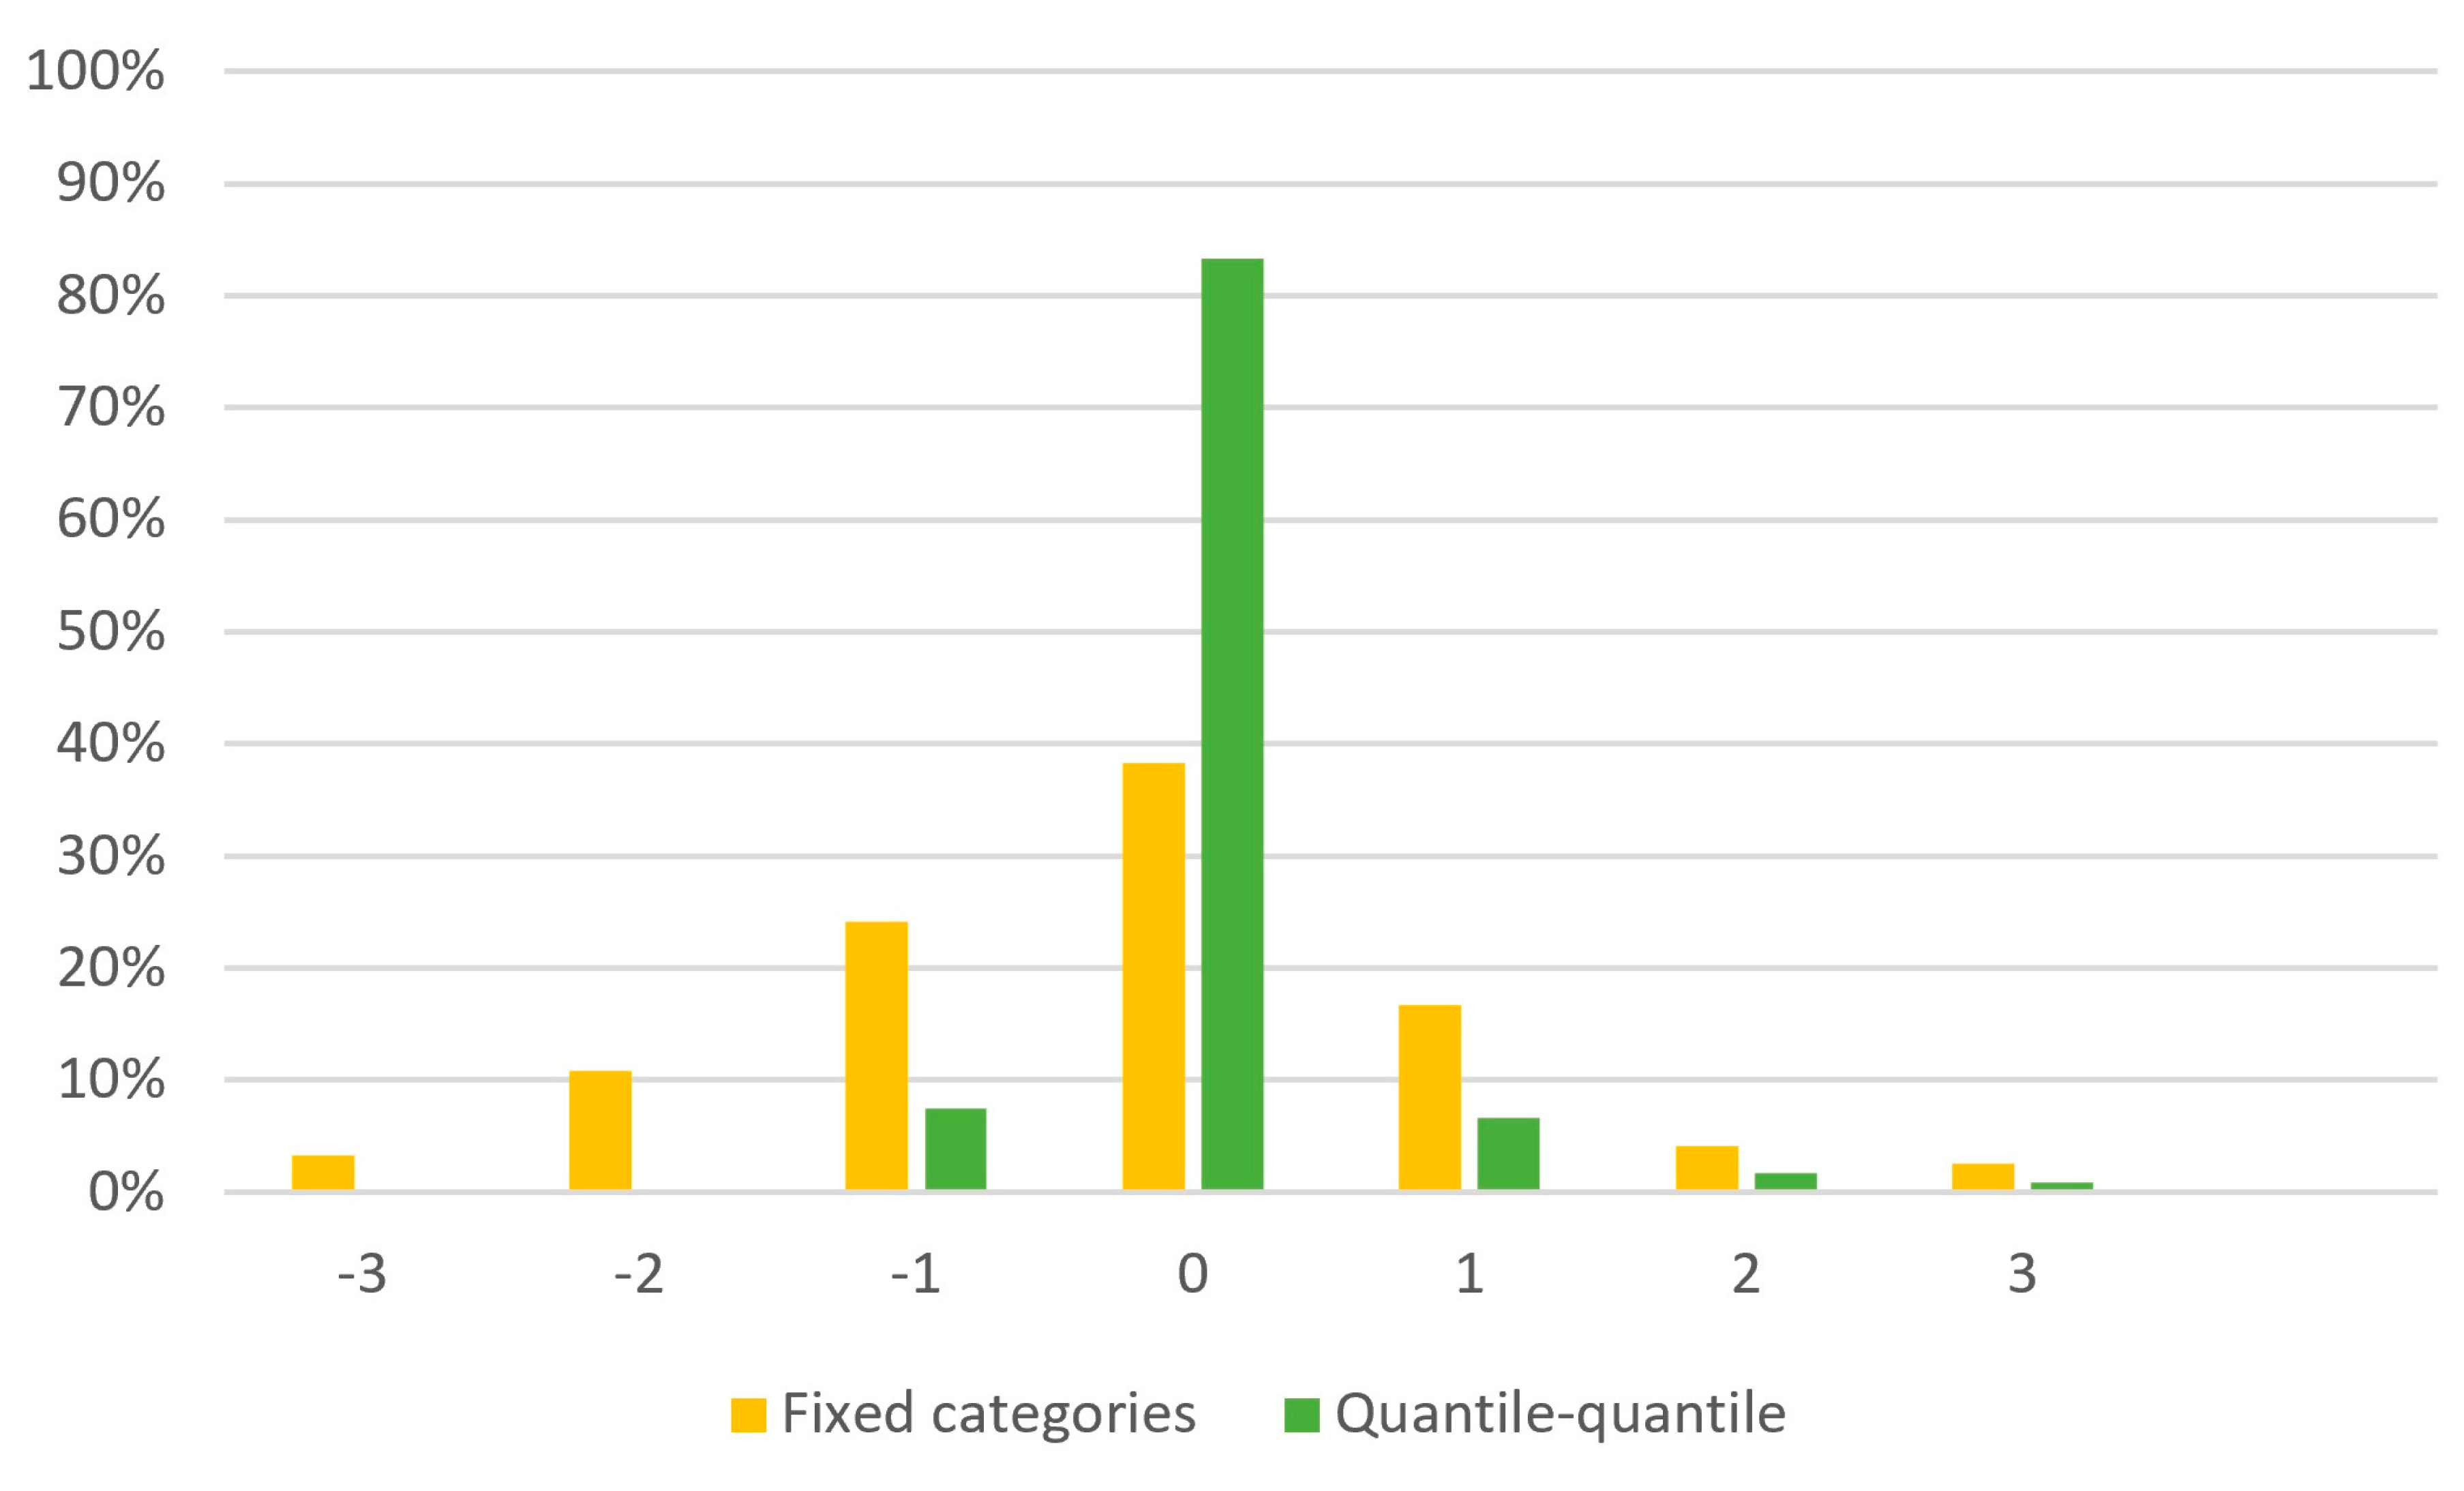
Forecast skill can be improved by using quantile–quantile categorized classification of the forecast dekadal rainfall amount. This approach allows misunderstanding due to the provision of quantitative values to be reduced and also to introduce a simple bias correction. It was not possible to adopt such an approach from the beginning because of the lack of forecasts time series. In the coming years, it will be possible to train the system to recalculate the centile every year in order to obtain more robust statistics for translating quantitative into qualitative information. However, the opportunity to translate quantitative information into qualitative (i.e., very wet, wet, almost dry, dry, etc.) must be verified with users because the language gap could become a real barrier. In many cases, the translation of the categories concept into local languages (Hausa and Djerma) could be misleading. Moreover, it is important to underline that the classified information does not have an absolute meaning for farmers because different crops and cropping systems have different needs in different periods that drive specific strategic choices. For this reason, further studies should explore the most effective way to communicate such forecasts maintaining a high level of usability.

5. Conclusions

The overall evaluation by users of the service provided was positive because, for the first time, they could access agrometeorological forecasts tailored to their own municipality. Users were really interested in accessing 10-day forecasts and were aware of their utility for crop management, particularly for extreme meteorological phenomena that could have a strong impact on their crops. Despite the uneven accuracy of the forecast, which is a common issue of 10-day forecasts, the main meteorological trends were detected and the information was perceived as useful for local decision-making processes. Indeed, farmers are used to dealing with weather uncertainties and they do not feel uncomfortable about the difference between forecast and observation. They particularly appreciated the forecast of very intense phenomena and dry spells during the next 10 days. Moreover, the local communities liked to be engaged in such a participatory process and they actively contributed to the progressive improvement of the service. This is particularly encouraging given that they were in charge of spreading the information to the wider farming community. The involvement of rural radio stations in the dissemination was shown to be really effective, thanks also to the strong collaboration between the DMN, extension officers, and journalists for the translation of information into local languages.
According to the feedback received from users, a further development of this WCS for smallholders will be to test the performance of temperature and strong wind forecasts during the 2020 rainy season. Moreover, the results showed that the adoption of categorized indexes could be very profitable for correcting biases. Nevertheless, before the setting up of an operational service, further investigation is needed to understand the most efficient way to communicate this information to smallholders in order to avoid misunderstandings.

Author Contributions

Conceptualization: M.B.; Methodology: M.B., Y.O.B., and V.T.; Developing: M.B. and Y.O.B.; Validation: M.B. and Y.O.B.; Investigation: M.B. and Y.O.B.; Writing—original draft preparation: M.B.; Writing—review and editing Y.O.B. and V.T.; Funding acquisition, V.T. All authors have read and agreed to the published version of the manuscript.

Funding

This research was co-funded by the Italian Agency for Development Cooperation, by the Institute of Bioeconomy (IBE)-National Research Council of Italy (CNR) at Florence, by the National Directorate for Meteorology of Niger (DMN), and by DIST-Politecnico and University of Turin within the project ANADIA2 [AID 010848].

Acknowledgments

The authors would like to thank the Italian Agency for Development Cooperation for supporting the ANADIA project and the actions that allowed the development of this activity. We are thankful to Gaptia Lawan Katiellou (National Directorate for Meteorology) for his support. We would like to express our deepest gratitude to Adamou Aïssatou Sitta, Binta Adamou, and Aissa Liman Diallo (National Directorate for Meteorology) for their help in the development of the activity and the personnel of the extension services of Dosso and Tillaberi for having shared data and information with us.

Conflicts of Interest

The authors declare no conflict of interest.

Appendix A

Figure A1. The form distributed in every municipality to collect the daily amount of precipitation and the number of villages receiving the rainfall.
Sustainability 12 03246 g0a1

Appendix B

Figure A2. The form distributed about the perception of the performance of the different indexes of the forecast.
Sustainability 12 03246 g0a2

References

  1. Grolle, J. Historical case studies of famines and migrations in the West African Sahel and their possible relevance now and in the future. Popul. Environ. 2015, 37, 181–206. [Google Scholar] [CrossRef]
  2. Hulme, M. Climate perspectives in Sahelian desiccation. Glob. Environ. Chang. 2011, 11, 19–29. [Google Scholar] [CrossRef] [Green Version]
  3. Shanahan, T.M. Atlantic forcing of persistent drought in West Africa. Science 2009, 324, 377–380. [Google Scholar] [CrossRef] [PubMed] [Green Version]
  4. Brooks, N. Drought in the African Sahel: Long Term Perspectives and Future Prospects; Tyndall Center for Climate Change Research: Norwich, UK, 2004; Volume 61. [Google Scholar]
  5. Institut National de la Statistique du Niger. Recensement Général de la Population et de L’habitat 2012; INS: Niamey, Niger, 2015; Available online: http://www.stat-niger.org/statistique/file/RGPH2012/ETAT_STRUCTURE_POPULATION.pdf (accessed on 22 January 2020).
  6. Institut National de la Statistique du Niger. Rapport National sur le Développement Humain (RNDH) Niger 2016, Développement Humain et Résilience des Ménages à L’insécurité Alimentaire au Niger; INS and UNDP: Niamey, Niger, 2016; Available online: http://www.stat-niger.org/statistique/file/RNDH/RNDH_2016.pdf (accessed on 22 January 2020).
  7. Alkire, S.; Santos, M.E. Measuring Acute Poverty in the Developing World: Robustness and Scope of the Multidimensional Poverty Index. World Dev. 2014, 59, 251–274. [Google Scholar] [CrossRef] [Green Version]
  8. Zakari, S.; Ying, L.; Song, B. Factors influencing household food security in West Africa: The case of Southern Niger. Sustainability 2014, 6, 1191–1202. [Google Scholar] [CrossRef] [Green Version]
  9. Gambo Boukary, A.; Diaw, A.; Wünscher, T. Factors Affecting Rural Households’ Resilience to Food Insecurity in Niger. Sustainability 2016, 8, 181. [Google Scholar] [CrossRef] [Green Version]
  10. FAO. Climate Smart Agriculture: Policies, Practices and Financing for Food Security, Adaptation and Mitigation; FAO: Rome, Italy, 2010; Available online: http://www.fao.org/3/i1881e/i1881e00.pdf (accessed on 24 March 2020).
  11. FAO. Regional Overview of Food Insecurity: African Food Insecurity Prospects Brighter Than Ever; FAO: Accra, Ghana, 2015; Available online: http://www.fao.org/3/a-i4635e.pdf (accessed on 24 March 2020).
  12. Vaughan, C.; Hansen, J.; Roudier, P.; Watkiss, P.; Carr, E. Evaluating agricultural weather and climate services in Africa: Evidence, methods, and a learning agenda. WIREs Clim. Chang. 2019, 10, 586. [Google Scholar] [CrossRef] [Green Version]
  13. Lo, M.; Dieng, M. Impact Assessment of Communicating Seasonal Climate Forecasts in Kaffrine, Diourbel, Thies and Fatick (Niakar) Regions in Senegal; CCAFS: Copenhagen, Denmark, 2015; p. 70. [Google Scholar]
  14. Anuga, S.W.; Gordon, C. Adoption of climate-smart weather practices among smallholder food crop farmers in the Techiman municipal: Implication for crop yield. Res. J. Agric. Environ. Manag. 2016, 5, 279–286. [Google Scholar]
  15. Ouedraogo, I.; Diouf, N.S.; Ouédraogo, M.; Ndiaye, O.; Zougmoré, R. Closing the gap between climate information producers and users: Assessment of needs and uptake in Senegal. Climate 2018, 6, 13. [Google Scholar] [CrossRef] [Green Version]
  16. Tarchiani, V.; Rossi, F.; Camacho, J.; Stefanski, R.; Mian, K.; Pokperlaar, D.; Coulibaly, H.; Sitta Adamou, A. Smallholder Farmers Facing Climate Change in West Africa: Decision-Making between Innovation and Tradition. J. Innov. Econ. Manag. 2017, 24, 151–176. [Google Scholar] [CrossRef]
  17. Tarchiani, V.; Camacho, J.; Coulibaly, H.; Rossi, F.; Stefanski, R. Agrometeorological services for smallholder farmers in West Africa. Adv. Sci. Res. 2018, 15, 15. [Google Scholar] [CrossRef]
  18. Roudier, P.; Alhassane, A.; Baron, C.; Louvet, S.; Sultan, B. Assessing the benefits of weather and seasonal forecasts to millet growers in Niger. Agric. For. Meteorol. 2016, 223, 168–180. [Google Scholar] [CrossRef]
  19. Genesio, L.; Bacci, M.; Baron, C.; Diarra, B.; Di Vecchia, A.; Alhassane, A.; Hassane, I.; Ndiaye, M.; Philippon, N.; Tarchiani, V.; et al. Early warning systems for food security in West Africa: Evolution, achievements and challenges. Atmos. Sci. Lett. 2011, 12, 142–148. [Google Scholar] [CrossRef]
  20. Lorenz, E.N. Deterministic nonperiodic flow. Atmos. Sci. 1963, 20, 131–140. [Google Scholar] [CrossRef] [Green Version]
  21. Meehl, G.A.; Goddard, L.; Murphy, J.; Stouffer, R.J.; Boer, G.; Danabasoglu, G.; Dixon, K.; Giorgetta, M.A.; Greene, A.M.; Hawkins, E.D.; et al. Decadal prediction: Can it be skillful? Bull. Am. Meteorol. Soc. 2009, 90, 1467–1485. [Google Scholar] [CrossRef]
  22. Fundel, V.J.; Fleischhut, N.; Herzog, S.M.; Göber, M.; Hagedorn, R. Promoting the use of probabilistic weather forecasts through a dialogue between scientists, developers and end-users. Q. J. R. Meteorol. Soc. 2019, 145, 210–231. [Google Scholar] [CrossRef] [Green Version]
  23. Mase, A.S.; Prokopy, L.S. Unrealized Potential: A Review of Perceptions and Use of Weather and Climate Information in Agricultural Decision Making. Weather Clim. Soc. 2014, 6, 47–61. [Google Scholar] [CrossRef]
  24. Baumüller, H. Agricultural Service Delivery through Mobile Phones: Local Innovation and Technological Opportunities in Kenya. In Technological and Institutional Innovations for Marginalized Smallholders in Agricultural Development; Gatzweiler, F., von Braun, J., Eds.; Springer: Cham, Switzerlad, 2016; pp. 143–162. [Google Scholar]
  25. Etwire, P.M.; Buah, S.; Ouédraogo, M.; Zougmoré, R.; Partey, S.T.; Martey, E.; Dayamba, S.D.; Bayala, J. An assessment of mobile phone-based dissemination of weather and market information in the Upper West Region of Ghana. Agric. Food Secur. 2017, 6, 8. [Google Scholar] [CrossRef] [Green Version]
  26. Leeuwis, C.; Aarts, N. Rethinking communication in innovation processes: Creating space for change in complex systems. J. Agric. Educ. Ext. 2011, 17, 21–36. [Google Scholar] [CrossRef] [Green Version]
  27. Munthali, N.; Leeuwis, C.; van Paassen, A.; Lie Asare, R.R.; van Lammeren, R.; Schut, M. Innovation intermediation in a digital age: Comparing public and private new-ICT platforms for agricultural extension in Ghana. NJAS Wagening. J. Life Sci. 2018, 86–87, 64–76. [Google Scholar] [CrossRef]
  28. Vaughan, C.; Dessai, S. Climate Services for Society: Origins, Institutional Arrangements, and Design Elements for an Evaluation Framework. WIREs Clim. Chang. 2014, 5, 587–603. [Google Scholar] [CrossRef]
  29. Vincent, K.; Daly, M.; Scannell, C.; Leathes, B. What can Climate Services learn from theory and practice of co-production? Clim. Serv. 2018, 12, 48–58. [Google Scholar] [CrossRef]
  30. Barab, S. Design-based research. In The Cambridge Handbook of the Learning Sciences; Sawyer, R.K., Ed.; Cambridge University Press: Cambridge, UK, 2006; pp. 153–170. [Google Scholar] [CrossRef]
  31. Climate Prediction Center Fast Downloading of Grib. Available online: https://www.cpc.ncep.noaa.gov/products/wesley/get_gfs.html (accessed on 10 February 2020).
  32. Perl. Available online: https://www.perl.org/ (accessed on 10 February 2020).
  33. Curl. Available online: http://www.curl.com/ (accessed on 10 February 2020).
  34. Wgrib. Available online: https://www.cpc.ncep.noaa.gov/products/wesley/wgrib.html (accessed on 10 February 2020).
  35. Climate Data Operators (CDO). Available online: https://code.mpimet.mpg.de/projects/cdo (accessed on 10 February 2020).
  36. Druyan, L.M.; Fulakeza, M.; Lonergan, P.; Worrell, R. Regional model nesting within GFS daily forecasts over West Africa. Open Atmos. Sci. J. 2010, 4, 1–11. [Google Scholar] [CrossRef]
  37. Nyong, A.; Adesina, F.; Osman Elasha, B. The value of indigenous knowledge in climate change mitigation and adaptation strategies in the African Sahel. Mitig. Adapt. Strateg. Glob. Chang. 2007, 12, 787–797. [Google Scholar] [CrossRef]
  38. Mertz, O.; Mbow, C.; Reenberg, A.; Diouf, A. Farmers’ Perceptions of Climate Change and Agricultural Adaptation Strategies in Rural Sahel. Environ. Manag. 2009, 43, 804–816. [Google Scholar] [CrossRef]
  39. Fan, Y.; van den Dool, H. Bias Correction and Forecast Skill of NCEP GFS Ensemble Week-1 and Week-2 Precipitation, 2-m Surface Air Temperature, and Soil Moisture Forecasts. Weather Forecast. 2011, 26, 355–370. [Google Scholar] [CrossRef] [Green Version]
  40. Fanglin, Y. Review of GFS Forecast Skills in 2017; Global Modeling and Data Assimilation Branch, Environmental Modeling Center, National Centers for Environmental Prediction: Court College Park, MD, USA, 2017. [Google Scholar]
  41. Novak, D.R.; Bailey, C.; Brill, K.F.; Burke, P.; Hogsett, W.A.; Rausch, R.; Schichtel, M. Precipitation and Temperature Forecast Performance at the Weather Prediction Center. Weather Forecast. 2014, 29, 489–504. [Google Scholar] [CrossRef] [Green Version]
  42. Historical Performances of Global NWP Models. Available online: https://www.emc.ncep.noaa.gov/gmb/STATS_vsdb/longterm/ (accessed on 10 February 2020).
  43. Oyekale, A.S. Access to risk mitigating weather forecasts and changes in farming operations in East and West Africa: Evidence from a baseline survey. Sustainability 2015, 7, 14599–14617. [Google Scholar] [CrossRef] [Green Version]
  44. Tarhule, A.; Lamb, P.J. Climate research and seasonal forecasting for West Africans: Perceptions, dissemination, and use? Bull. Am. Meteorol. Soc. 2003, 84, 1741–1759. [Google Scholar] [CrossRef]
  45. Wall, T.U.; Meadow, A.M.; Horganic, A. Developing evaluation indicators to improve the process of coproducing usable climate science. Weather Clim. Soc. 2017, 9, 95–107. [Google Scholar] [CrossRef] [Green Version]
Figure 1. Niger and the eight municipalities served.
Sustainability 12 03246 g001
Figure 2. Difference between dekadal forecast and observed rainfall amount per municipality during 2019. season; negative values mean that forecasts underestimated the observed data. Abbreviations: d—dekad, m—month, O. Guéladio—Ouro Guéladio.
Sustainability 12 03246 g002
Figure 3. Dispersion plot of forecast vs. observed dekadal values grouped by user rating (very weak, weak, medium, high, and very high) with trends and correlation.
Sustainability 12 03246 g003
Figure 4. Histogram of the difference in performance between using the fixed categories or quantile–quantile classification. The x-axis values are the number of classes of difference (0 = same class; n = n categories of difference).
Sustainability 12 03246 g004
Table 1. Agrometeorological indexes issued from Global Forecast System (GFS) 10-day weather forecasts.
IndexDescriptionValues
Cumulative 10 days rainfall (mm);Total amount of precipitation forecasted for the next 10 days expressed in mm0–999
Number of rainy days;The number of days, during the next 10 days, with a forecasted daily precipitation ≥ 1 mm0–10
Number of rainy days above 20 mm;The number of days, during the next 10 days, with a forecasted precipitation ≥ 20 mm0–10
Maximum number of consecutive dry days;The maximum number of consecutive days, during the next 10 days, with a forecasted precipitation < 1 mm0–10
Number of dry periods of at least 5 consecutive dry days.Number of periods, during the next 10 days, of at least 5 consecutive days with forecasted precipitation < 0.1 mm0–2
Table 2. Categorized classification and label.
ClassRangeLabel
10–2 mmDry
22–18 mmMild rainfall
318–39 mmHumid
439–66 mmVery humid
5Above 66 mmExtremely humid
Table 3. Categorized classification for forecasts and observations and labels.
ClassQuantile Range ForecastsQuantile Range ObservationsLabel
10–3.1 mm0–2 mmDry
23.1–9 mm2–18 mmMild rainfall
39–21.7 mm18–39 mmHumid
421.7–50.6 mm39–66 mmVery humid
5Above 50.6 mmAbove 66 mmExtremely humid
Table 4. Comparison of forecasted and observed annual cumulated rainfall per municipality in 2019.
MunicipalityCumulative Rainfall Forecast (mm)Rainfall Recorded (mm)Difference mmDifference %Number of Dekads
Falmey552.4662.8−110.4−17%16
Gotheye378.8384.3−5.5−1%15
Guéchémé556.6586.0−29.4−5%16
Ouro Guéladio402.6392.410.23%11
Kiéché433.3510.6−77.2−15%16
Namaro329.7388.0−58.3−15%15
Tessa557.4793.0−235.6−30%16
Tounouga498.9688.5−189.6−28%15
Table 5. Contingency table of wet and dry dekads (all municipalities in 2019).
Forecast DryForecast Wet
Observation dry414
Observation wet1101
Table 6. Index skill in 2019 (120 observations).
IndexForecastObservedDifferenceDiff. Avg. per Dekad
Number of rainy days4392931461.2
Number of rainy days above 20 mm3154−23−0.2
Number of the maximum consecutive dry days512665−153−1.3
Table 7. Contingency table of dekads with at least one rainy day above 20 mm (all municipalities in 2019).
Forecast NoneForecast Event
Observation none579
Observation event3222
Table 8. Average rate of answers about index performance in 2019.
MunicipalityAverage 1aAverage 1bAverage 1cAverage 1d
FalmeyMediumMediumMediumHigh
GotheyeMediumMediumHighHigh
GuechemeWeakHighHighMedium
GueladioWeakHighHighHigh
KiecheMediumHighHighHigh
NamaroWeakMediumHighHigh
TessaMediumHighMediumHigh
TounougaMediumMediumHighMedium
Total averageMediumMediumHighHigh
Table 9. Users’ rate of the precipitation amount forecast (1a) in terms of range of differences (mm) between forecast and observed data in 2019 (8 municipalities).
RateNumber of RatingsMinimum Difference (Absolute Value)Maximum Difference (Absolute Value)Average Difference (Absolute Value)
Very weak296124.542.4
Weak191.170.925.7
Medium191.348.516.1
High230.543.112.0
Very high1205.41.6

