Article

A Multistage Design Procedure for Planning and Implementing Public Charging Infrastructures for Electric Vehicles

1
Department of Electrical and Electronic Engineering, University of Cagliari, Via Marengo 2, 09123 Cagliari, Italy
2
Novel Electric Propulsion Systems, NEPSY srl, Via Logudoro 8, 09127 Cagliari, Italy
*
Author to whom correspondence should be addressed.
Sustainability 2020, 12(7), 2889; https://doi.org/10.3390/su12072889
Submission received: 24 February 2020 / Revised: 27 March 2020 / Accepted: 2 April 2020 / Published: 5 April 2020
(This article belongs to the Collection Urban Energy Management and Sustainable Transportation)

Abstract

:
Presented in this paper is a Multistage Design Procedure (MSDP) for planning and implementing Public Charging Infrastructures (PCIs) to satisfy intracity charging demand of Electric Vehicles (EVs). The proposed MSDP splits planning and design processes into multiple stages, from macroscale to fine-scale levels. Consequently, the preliminary results achieved at each stage can be refined at the subsequent stages, leading to determine the accurate number and precise geographical location of each charging point. The main advantage of the proposed approach is that it splits a very complicated procedure into multiple and simpler stages, at each of which appropriate goals, targets and constraints can be included. As a result, the iterative interactions among all the stakeholders involved in the PCI design process are significantly simplified. The proposed MSDP has been employed in the planning and design of the PCI of the Italian island of Sardinia, accordingly to all the public bodies.

1. Introduction

The awareness of the effects on climate change produced by greenhouse gases is forcing a significant transformation in the planning and use of primary energy sources (fossil and renewable), which influences all energy sectors deeply. Particular attention on energy planning is devoted to the transport sector, due to its high share of emissions and the expected growth of mobility demand of developing countries. Mobility has a fundamental role in the development of social and economic activities. Several economic analyses have shown a strict correlation between economic development and gross domestic product, mobility demand, freight transportation and environmental degradation [1,2,3]. Because of the dependence on fossil fuels, the equivalent CO2 emissions due to the transport sector will significantly increase if no corrective actions are taken, resulting in a relevant percentage of the overall emission inventory.
One of the main concerns regarding the transport sector is its energy demand, which is almost 30% of overall global energy consumption, relying on oil products for more than 90%. In addition, about 75% of the overall consumption is due to road vehicles [4]. In order to reduce such an oil dependence, suitable actions are desirable that ease a massive redistribution of modal shares towards more sustainable transportation modes, such as buses, metros and bicycles. Similarly, the increase of both vehicle efficiency and the amount of energy demand covered by renewable energy sources are mandatory in order to reduce emissions and pollutions due to the transport sector. In the last two decades, considerable attention has focused on Electric Vehicles (EVs) because of their higher efficiency compared to conventional vehicles, the absence of local gas and noise emissions, and their inherent predisposition to be integrated into smart mobility systems. Also, since EVs are fueled by electricity, they contribute to increasing the use of renewable energy sources in the transport sector. For these reasons, politics are fostering the electrification of transport sectors at both local and national scales, especially in the urban environment. Although the high cost of EVs restrains their wide diffusion, it is expected that, if technology improvements and public actions evolve as expected, the number of EVs on the road will outnumber conventional vehicles in the next few decades [5,6]. On one hand, even if the cost of energy-storage technology is expected to decrease rapidly, public incentives might be necessary to reduce the price of EVs further, and, thus, to fill up the economic gap with conventional vehicles. On the other hand, public initiatives are needed to develop Public Charging Infrastructures (PCIs) at the early stage of EV diffusion, when private infrastructures may be not available, especially to attract a wide number of EV adopters [7,8].
In this regard, PCIs allow for greater electric mileage of plug-in hybrid EVs and enable battery-powered EVs to cover a long distance without the so-called range anxiety issue, i.e., fearing without reason that the autonomy of the EV is not enough to cover the desired distance by unconsciously overestimating the energy demand required by the trip. Furthermore, public Charging Points (CPs) are needed in case of lack of private parking, as may occur in high-density urban contexts. The extensive analysis presented in [9] pointed out the variety of stakeholders involved in the development of charging infrastructure. Among these, EV drivers represented the end-users of the PCI, which should be operative and accessible, compatible with drivers’ vehicles and characterised by a high geographical coverage. Hence, a suitable planning methodology is needed to support the design of a PCI that matches drivers’ requirements, as well as all the other constraints coming from all the remaining stakeholders.
The literature presents many planning approaches for charging infrastructures, which mainly consist of tools that support the decisions of designers and planners. These planning approaches generally resort to traffic or land-use information, depending on data availability. Nowadays, traffic information is easily accessible, but it may not be enough for modelling potential EV owners’ needs and requirements. Differently, land-use data can provide much more information about population habits and urbanisation, which may enable a more detailed projection on EV adoption. In any case, estimating parking, and thus charging demand, is of paramount importance. One of the most popular approaches considers the EV radius of service and its short parking time to distribute at least one charging point within its mileage, so that each driver can recharge their vehicle with a high level of reliability [10,11]. Genetic algorithms can be used to find the best locations for public CPs among the most popular destinations; this is done with the aim to minimise the cost of the single recharge [12], or to find the minimum number of charging stations [12], but also to reduce the number of trips that cannot take place due to EV range limitations [13]. Differently, CP displacement can be achieved by referring to recharging cost; this can be minimised considering either electricity cost and daily habits [14] or different cost components, such as those related to queues at occupied stations and EV trips to charging stations [15]. These methods generally point out the importance of collecting and/or estimating drivers’ habits and needs, in order to forecast charging demand evolutions in time and space. For instance, the Electric Vehicle Infrastructure Projection Tool (EVI-Pro) by NREL Laboratory exploits a vast dataset of travel information and vehicle and charging station features to calculate the number and kind of CPs for each scenario [16,17]. Alternatively, drivers’ habits and needs can be used to estimate the geographic distribution of charging demand resorting to suitable models, based on which the locations characterised by the highest demand are selected for CPs installation [18]. In this regard, commercial databases are available and can ease the retrieval of relevant data about drivers, although they eventually refer to conventional vehicles [19]. Sometimes, splitting the whole planning procedure into multiple steps is required in order to manage the complexity of a problem at different geographic scale levels. A rough distribution of CPs at a macroscale level can be subsequently refined on a microscale level by using a weighted sum model, adjustable in accordance with policymakers’ requirements [20]. In this complex and changing scenario, a Multistage Design Procedure (MSDP) for PCIs to satisfy the intracity charging demand is presented in this paper. (The term intracity refers to travels that are shorter than twice the range of an average battery EV, whereas the term intercity refers to travels over distances that are greater than twice the range of an average battery EV [21].) Compared to other multistage approaches, the one presented in this paper successfully compensates for the lack of information that prevents the employment of rigorous analytical methods by using both traffic and land-use information on different scale levels and by involving a number of actors in the design process. The proposed MSDP consists of three planning stages, each of which regards a different scale level. In particular, Stage 1 (macroscale planning) regards a coarse distribution of CPs in suitable Macrozones-of-Interest (MZoI), which are identified based on the amount of estimated charging instances of potential EV commuters. Stage 2 (microscale planning) refines this distribution, particularly in regards to each of the selected MZoI being split further into Microzones-of-Interest (µZoI). Among all µZoI, the most suitable are selected in order to host the CPs preliminarily assigned to the corresponding MZoI. The last stage of the MSDP (fine-scale design) achieves the precise geographical location of each CP and the corresponding power rate by resorting to land-use information. Compared to the planning procedure presented in [22], a detailed description of Stage 1 is enclosed in this paper, together with the definition of suitable Key Performance Indexes (KPIs), based on which a comprehensive assessment of the proposed MSDP was achieved. The proposed MSDP was successfully applied in the planning of the PCI of the Italian island of Sardinia in accordance with all the public bodies [22]. In this regard, this paper shows more results compared to [22], which are related to additional Sardinian municipalities.
The paper is structured as follows: motivation and context are described in Section 2; each stage of the proposed MSDP is presented in Section 3; the KPIs and the planning results of the Sardinian PCI are presented and discussed in Section 4; and concluding remarks are given in Section 5.

2. Motivation and Context

The framework of this study derives from the will of the Italian government to support EV diffusion through an extensive set of actions to be implemented on regional scale. Particularly, in order to make EVs more affordable and convenient, the Italian Ministry of Transportation delegated regional governments to set up a number of actions tailored to the specific socio-economic context. In this paper, reference is made to the Italian island of Sardinia, which counts 377 municipalities and about 1,650,000 inhabitants distributed over 24,000 km2. However, Sardinia’s population is not evenly distributed over the whole territory: more than one-half of the total population is concentrated near to the capital and around four main cities, which are also the most important economic centers and mobility attractors of the island. Furthermore, the per capita income is relatively low compared to the Italian average value, suggesting that financing subsidies would also be required to extend EV diffusion to a reasonable number of citizens [23]. Similarly, projections of very slow EV diffusion make the installation of a charging infrastructure unattractive for private initiatives. For these reasons, the most important actions adopted by the regional government are financing EV purchases from local administrations and citizens and creating a Public Charging Infrastructure (PCI).
The present work only focuses on the decision support system developed to guide policymakers and technicians in designing the Sardinian PCI. The methodology presented in this study was developed under the following assumptions:
  • the PCI is funded by the regional government and installed in public spaces; however, since municipality administrations rule installations on public spaces, they must be included as stakeholders throughout the process;
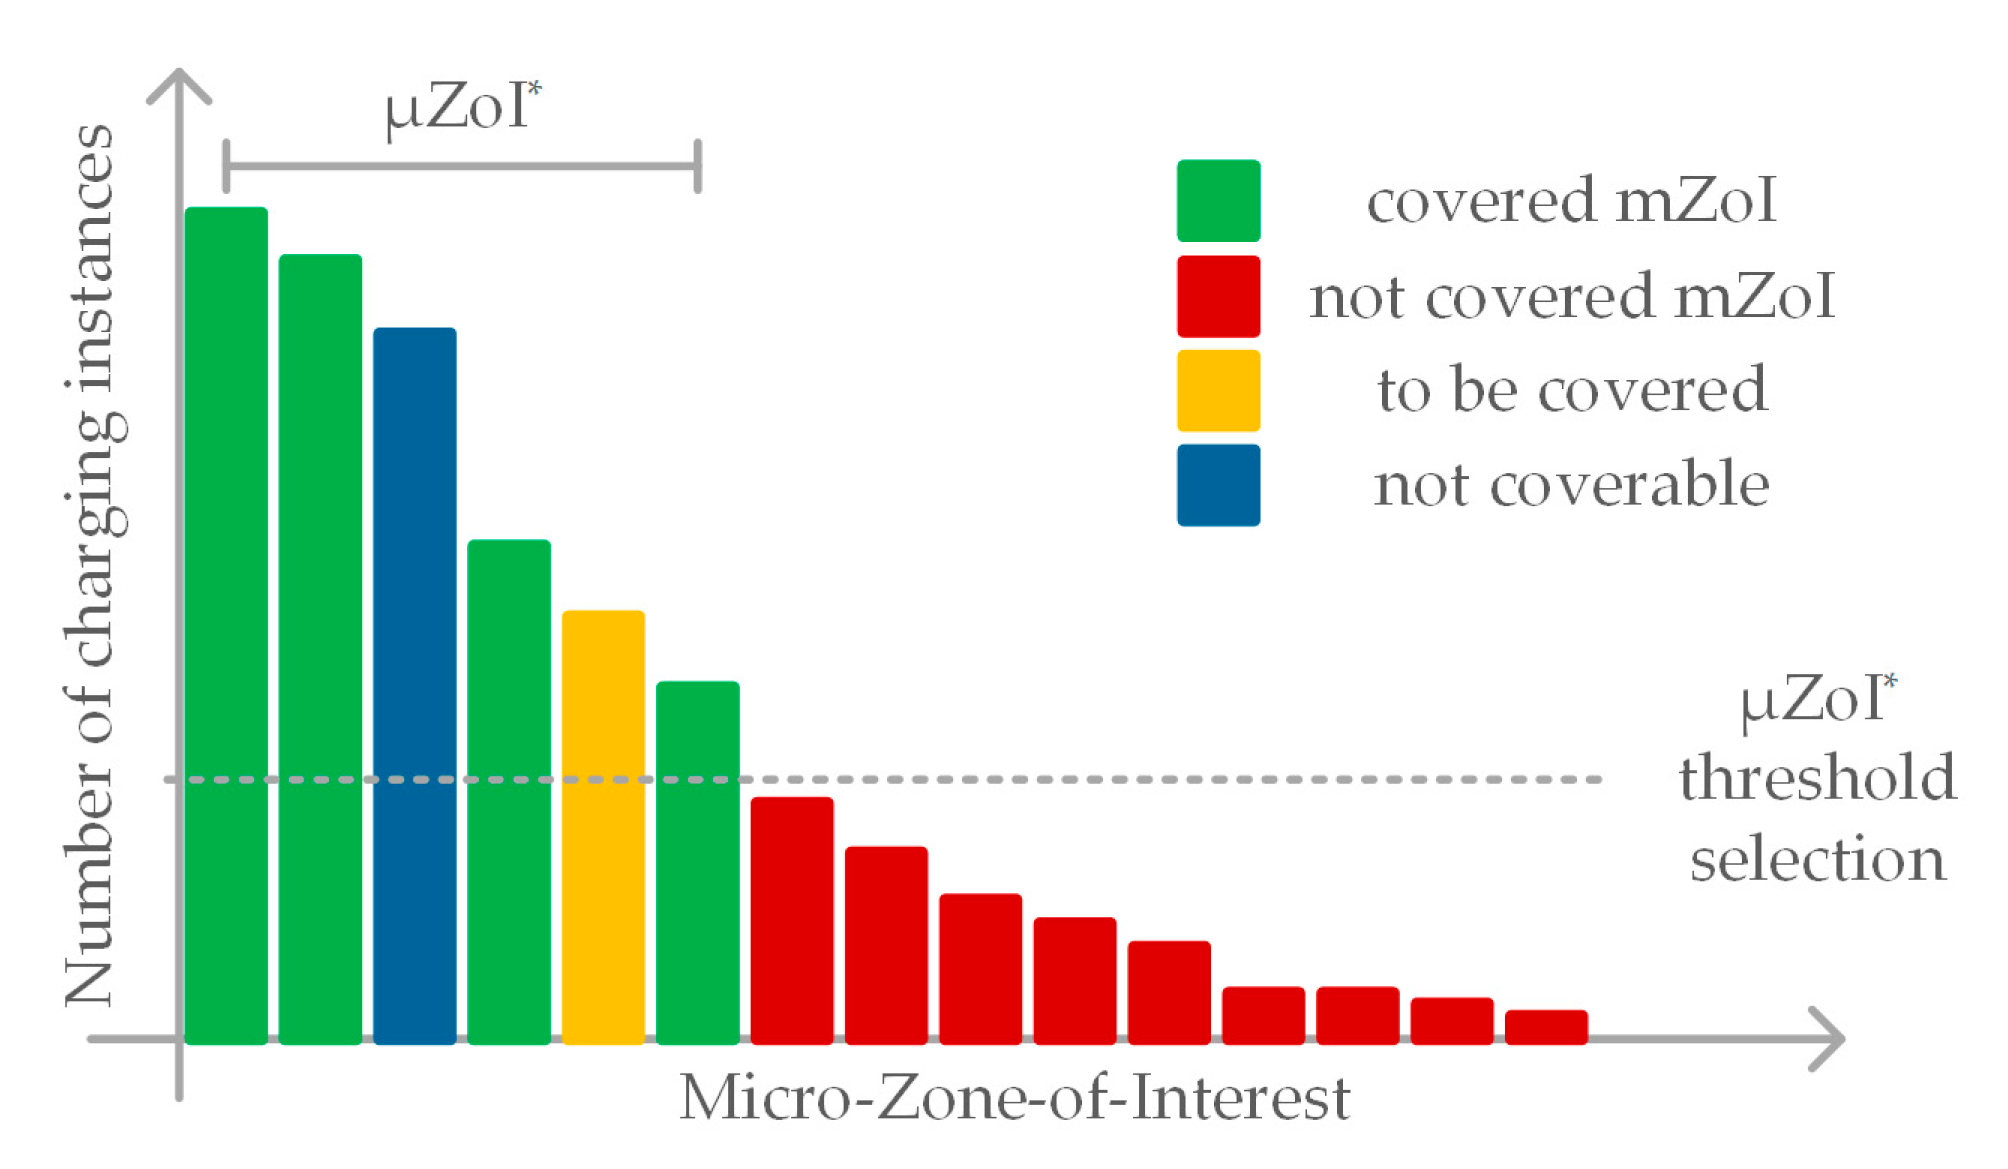
  • selecting the most important municipalities is of paramount importance in order to reduce the complexity of the design process and to deal with the limited amount of time and funds;
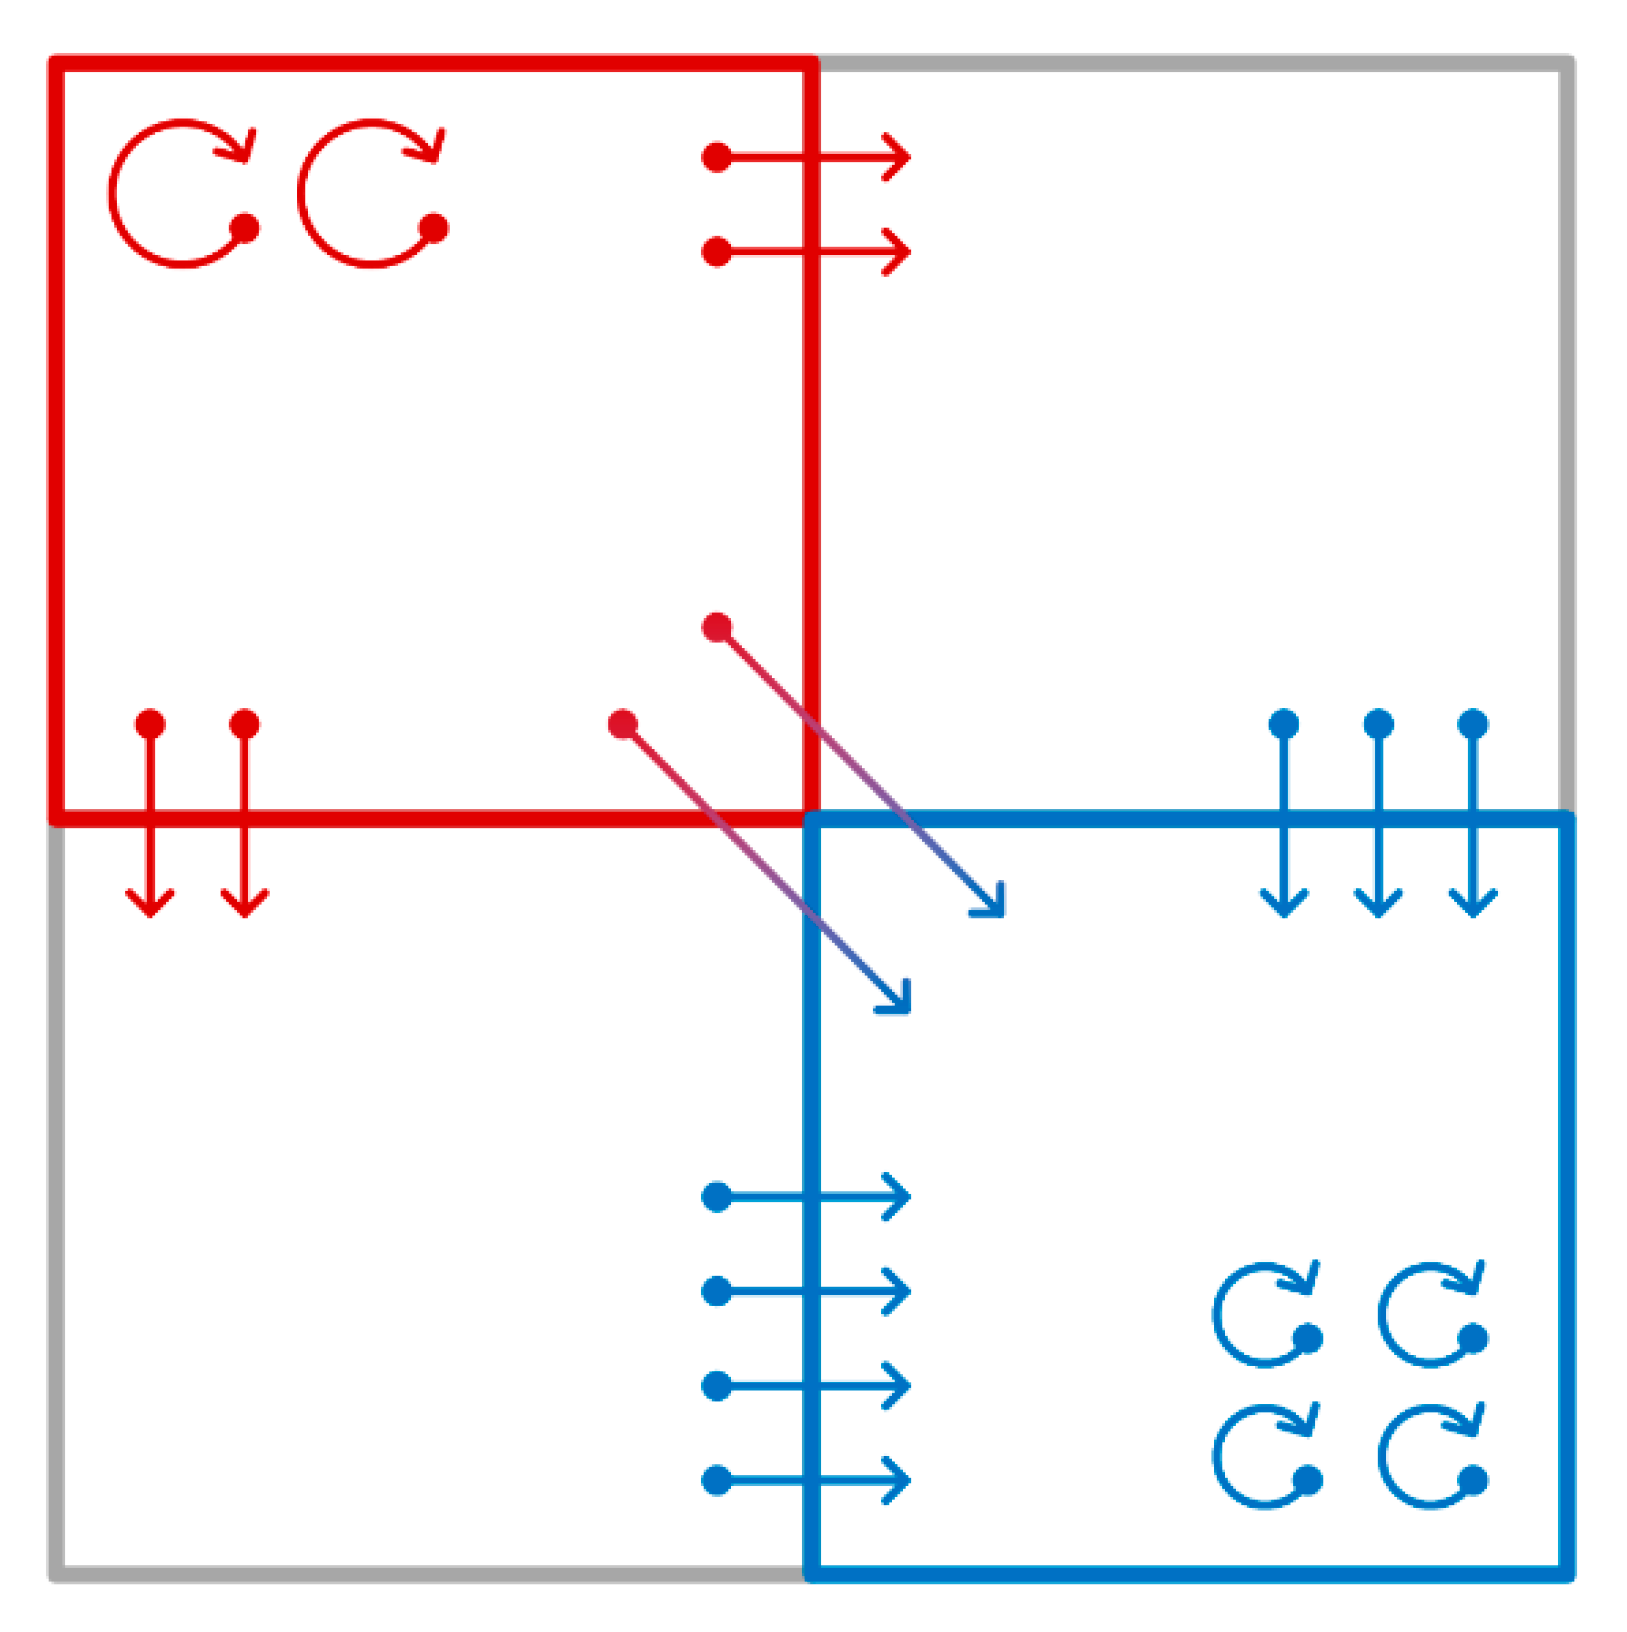
  • CPs installed in mobility attractive and high-population-density areas satisfy the charging demands of both commuters (during the day) and residents (overnight) and, thus, are preferred;
  • domestic charging is considered by assuming that all EVs leaving home commute with sufficient autonomy to reach the destination; this is reasonable because the distance covered by all commuting trips that occur in Sardinia is much shorter than the average range of EVs;
  • only intracity charging instances are considered to design the PCI presented in this paper, as a suitable PCI devoted to intercity charging instances will be developed in a second phase of the project.

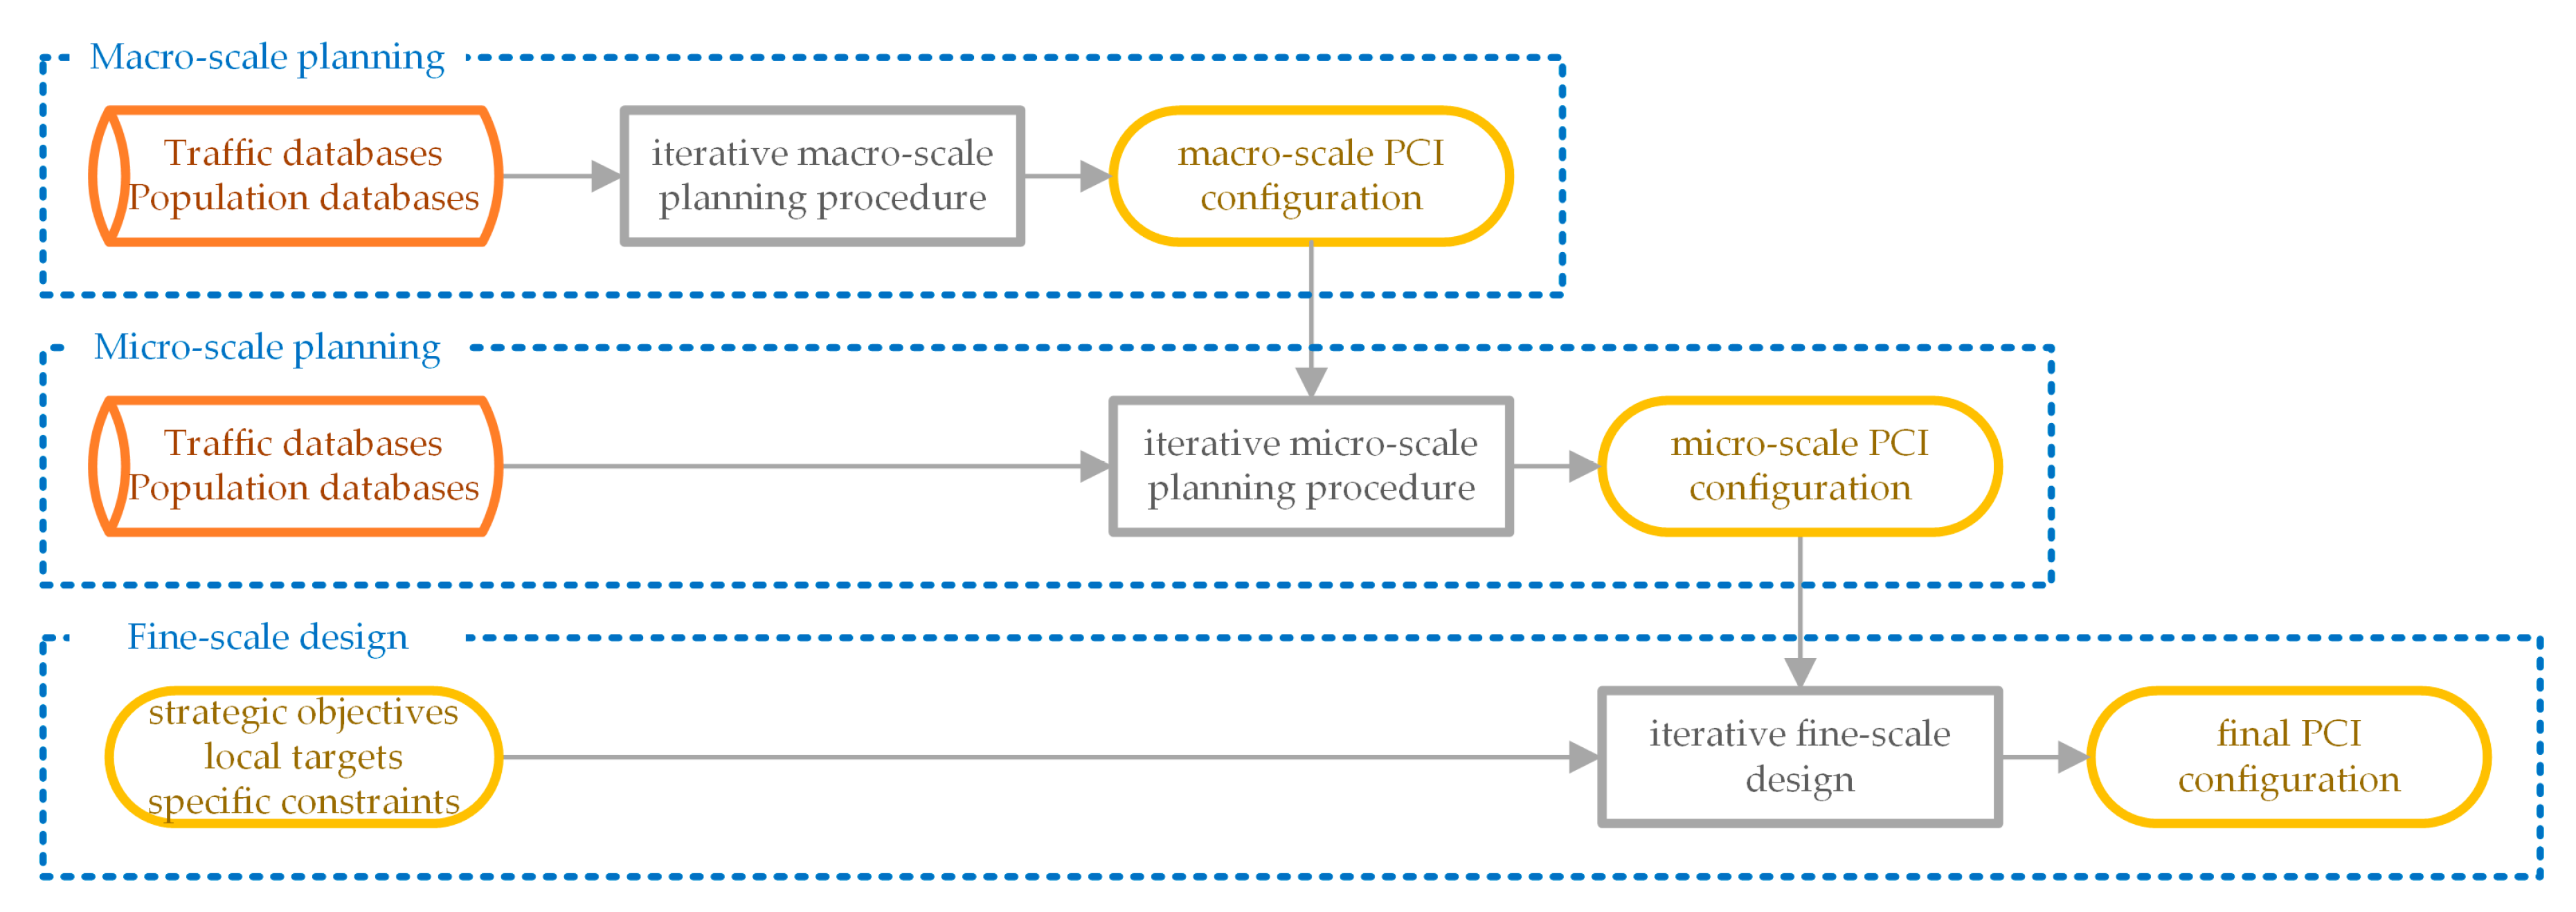
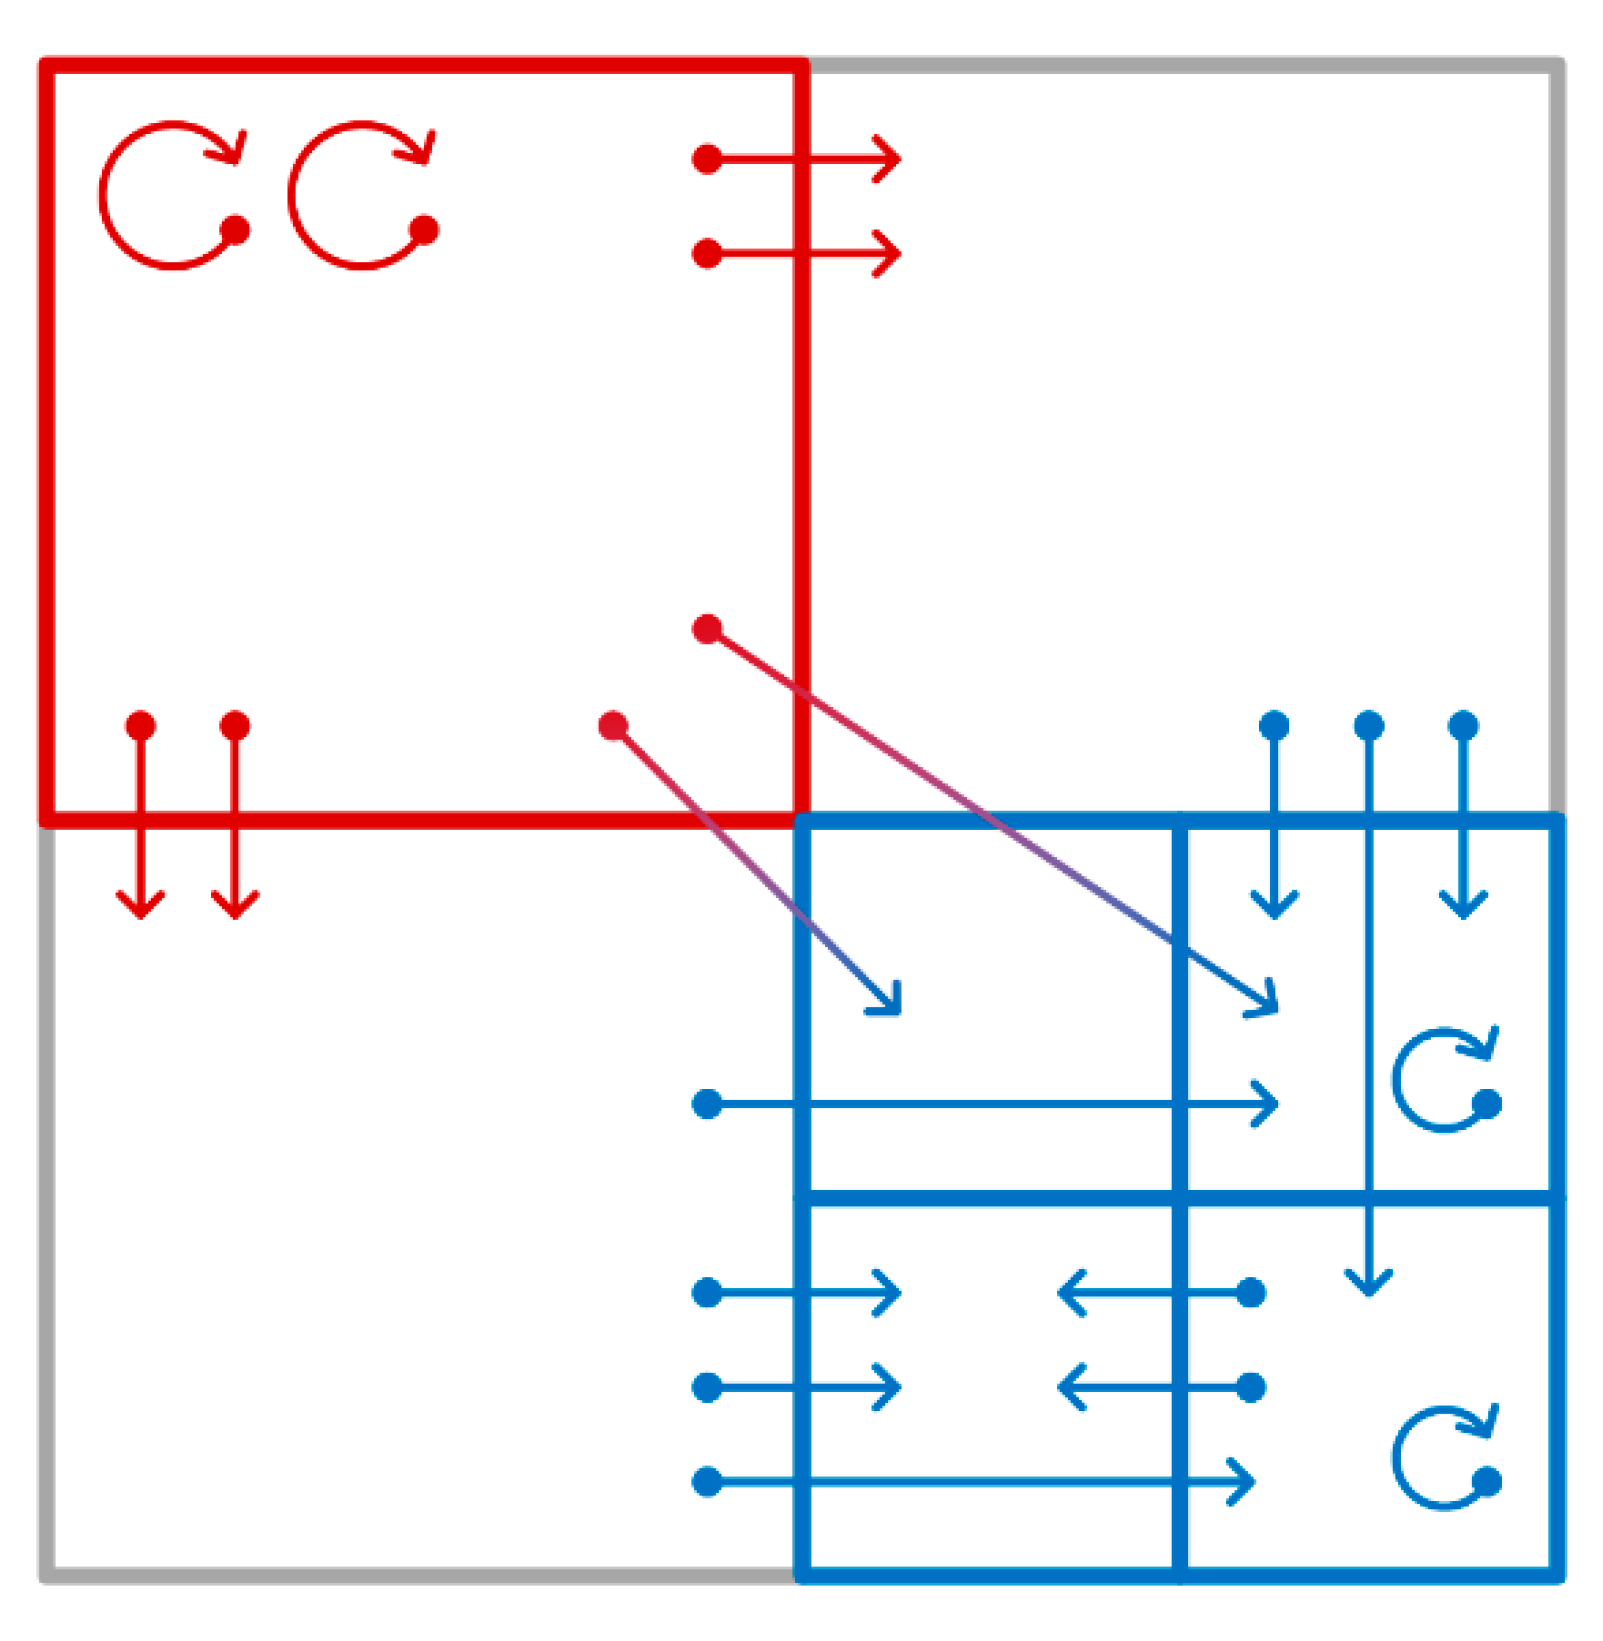
3. Multistage Design Methodology

In order to design an effective and efficient PCI, a suitable design methodology must be developed. However, theoretical optimisation methods can be difficult to employ due to multiple factors. First, the whole process involves several administrative and technical entities, which all need to be supported together, ranging from the concept to the implementation stage. Second, the multitude of players involved and the specific contingencies introduce different kinds of constraints that can be hard to model. Third, the very early stage of EV diffusion may result in information databases being incomplete or insufficient to provide reliable data to employ in the design process.
The Multistage Design Procedure (MSDP) presented in this paper consists of a multistage approach that, starting from an estimation of EV charging demand, defines a macroscale PCI configuration at first, and then ends with its precise refinement that complies with all the constraints, as shown in Figure 1. Particularly, the final outputs of the MSDP are geographic coordinates, number and power rate of each CP.
The following subsections describe each stage of the proposed methodology.

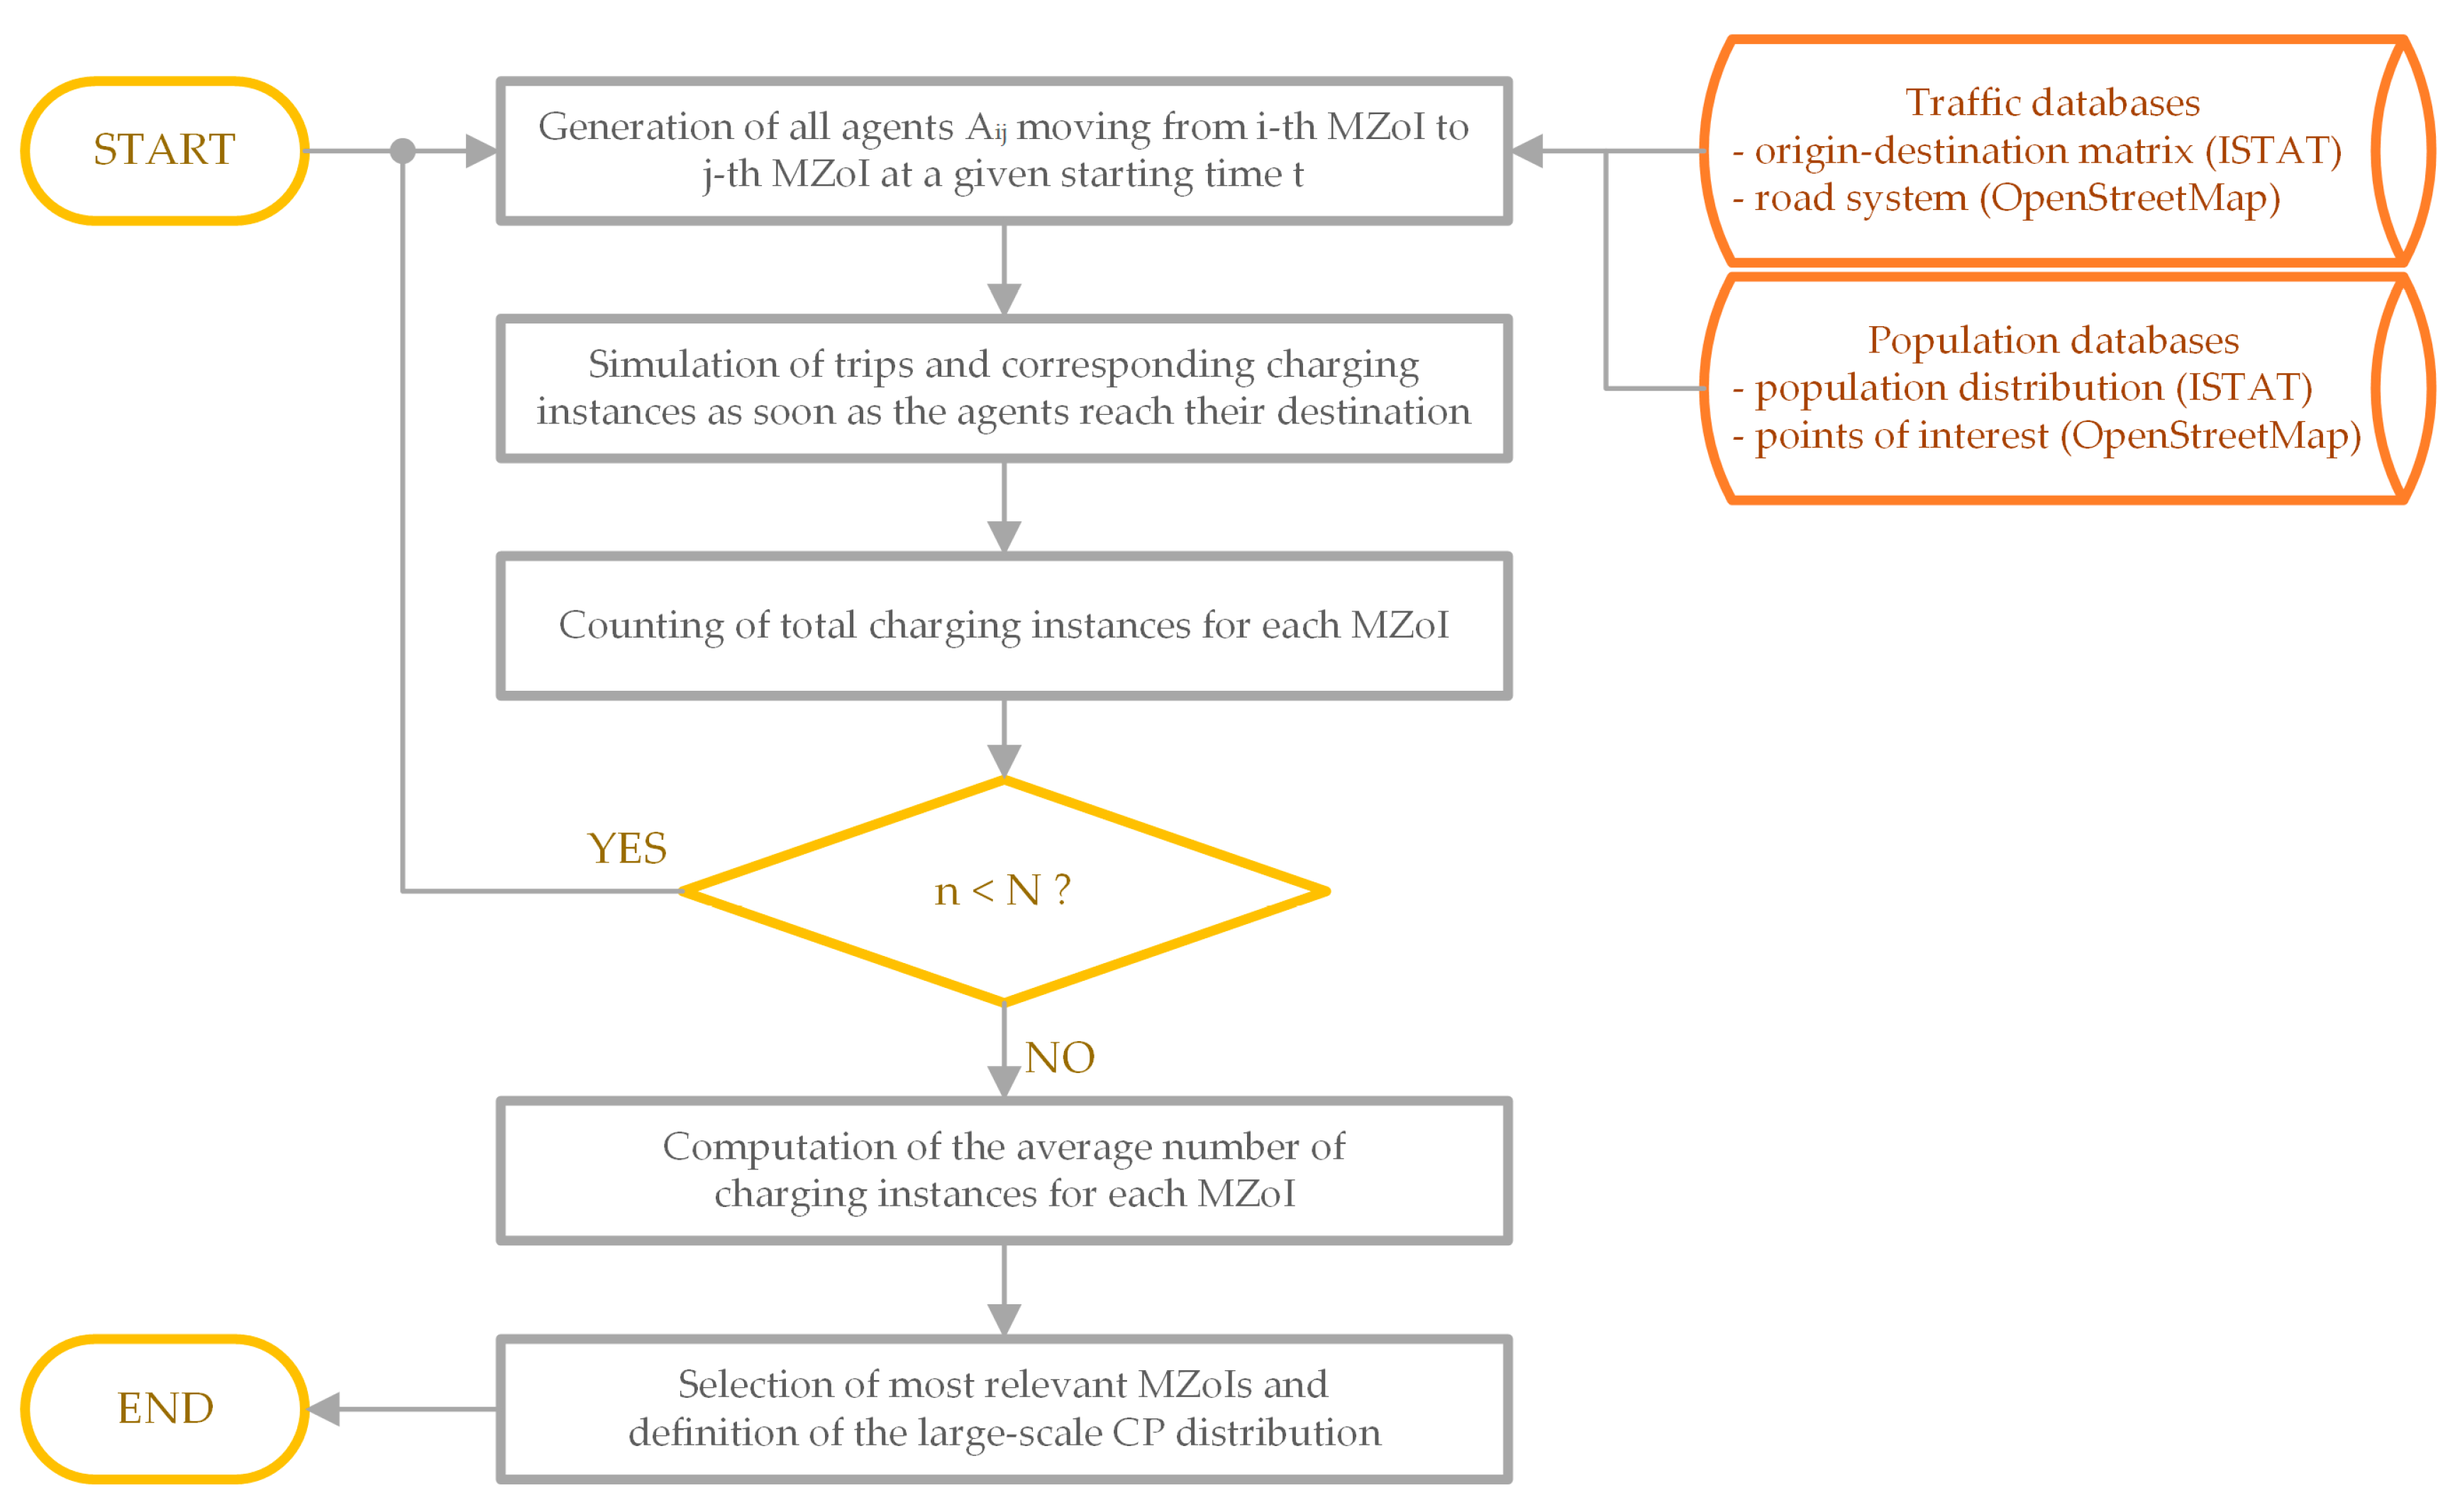
3.1. Stage 1: Macroscale Planning

The flowchart of the macroscale planning stage of the proposed MSDP is depicted in Figure 2. Its primary goal is determining a preliminary CP distribution over a coarse partition of the PCI target area. For this purpose, the target area is split into Macrozones-of-Interest (MZoIs), each of which correspond to either a single municipality or a small group of them. Based on this geographical subdivision, roadmaps and statistic data regarding population and habits are collected into a geo-referenced database. Drivers’ habits are represented by departure and destination MZoIs and departure time, which are extracted from suitable mobility-habit databases coming from national census surveys [23]. Roadmaps are retrieved from the Open Street Map road graph [24]. It is worth noting that the proposed MSDP was developed by referring to open-data solutions, which were preferred over commercial ones.
Once the geo-referenced database is set up, the origin-destination matrix and the road graph can be extracted from it accordingly to drivers’ behaviours. In particular, trips characterised by different starting and ending MZoIs are considered, as well as trips that take place within the same MZoI, as depicted in Figure 3. Then, considering the origin-destination matrix, the time evolution of potential EV charging demand for each MZoI is evaluated through traffic/parking simulations over a single day. In this regard, a generalisation of the Agent-Based Model (ABM) proposed in [25,26] is exploited. This consists of generating a set of agents that move on the road graph, which emulates the EV drivers’ behaviour and whose number is determined under specific reference scenarios of EV penetration share. Hence, each agent simulates a single EV trip, whose energy consumption is computed for each time interval by considering an average specific consumption rate (kWh/km). Subsequently, at the end of each trip, a charge instance occurs in order to reinstate the consumed energy. It is worth noting that applying the ABM on a large area split into a multitude of small partitions is challenging: it requires the analysis of a huge origin-destination matrix, whose dimension depends on the square of the number of partitions. For this reason, a suitable large-scale territory clustering can be adopted without losing accuracy because the preliminary results achieved at the macroscale planning stage will be refined suitably in the subsequent microscale planning stage.
Based on ABM outcomes, the MZoIs characterised by the highest number of charging instances are labelled as the most relevant (MZoIs*) and are selected in order to be involved in the PCI. A fair number of CPs is then assigned to each MZoI* in accordance with budget availability and strategic targets. CPs are distributed between each MZoIs* quasi-proportionally to their potential charging instances, but some variations occur due to political/administrative/urban considerations. Regarding traffic/parking simulations, it is important to note that a stochastic approach is employed: the simulation of the daily traffic is repeated N times by randomly generating the agents based on the probabilities derived from population density, territorial density of Points-of-Interest (POIs) and EV diffusion scenarios. After performing the N iterations, the results are averaged in order to obtain the time evolution of potential charging instances for each MZoI [23,24].

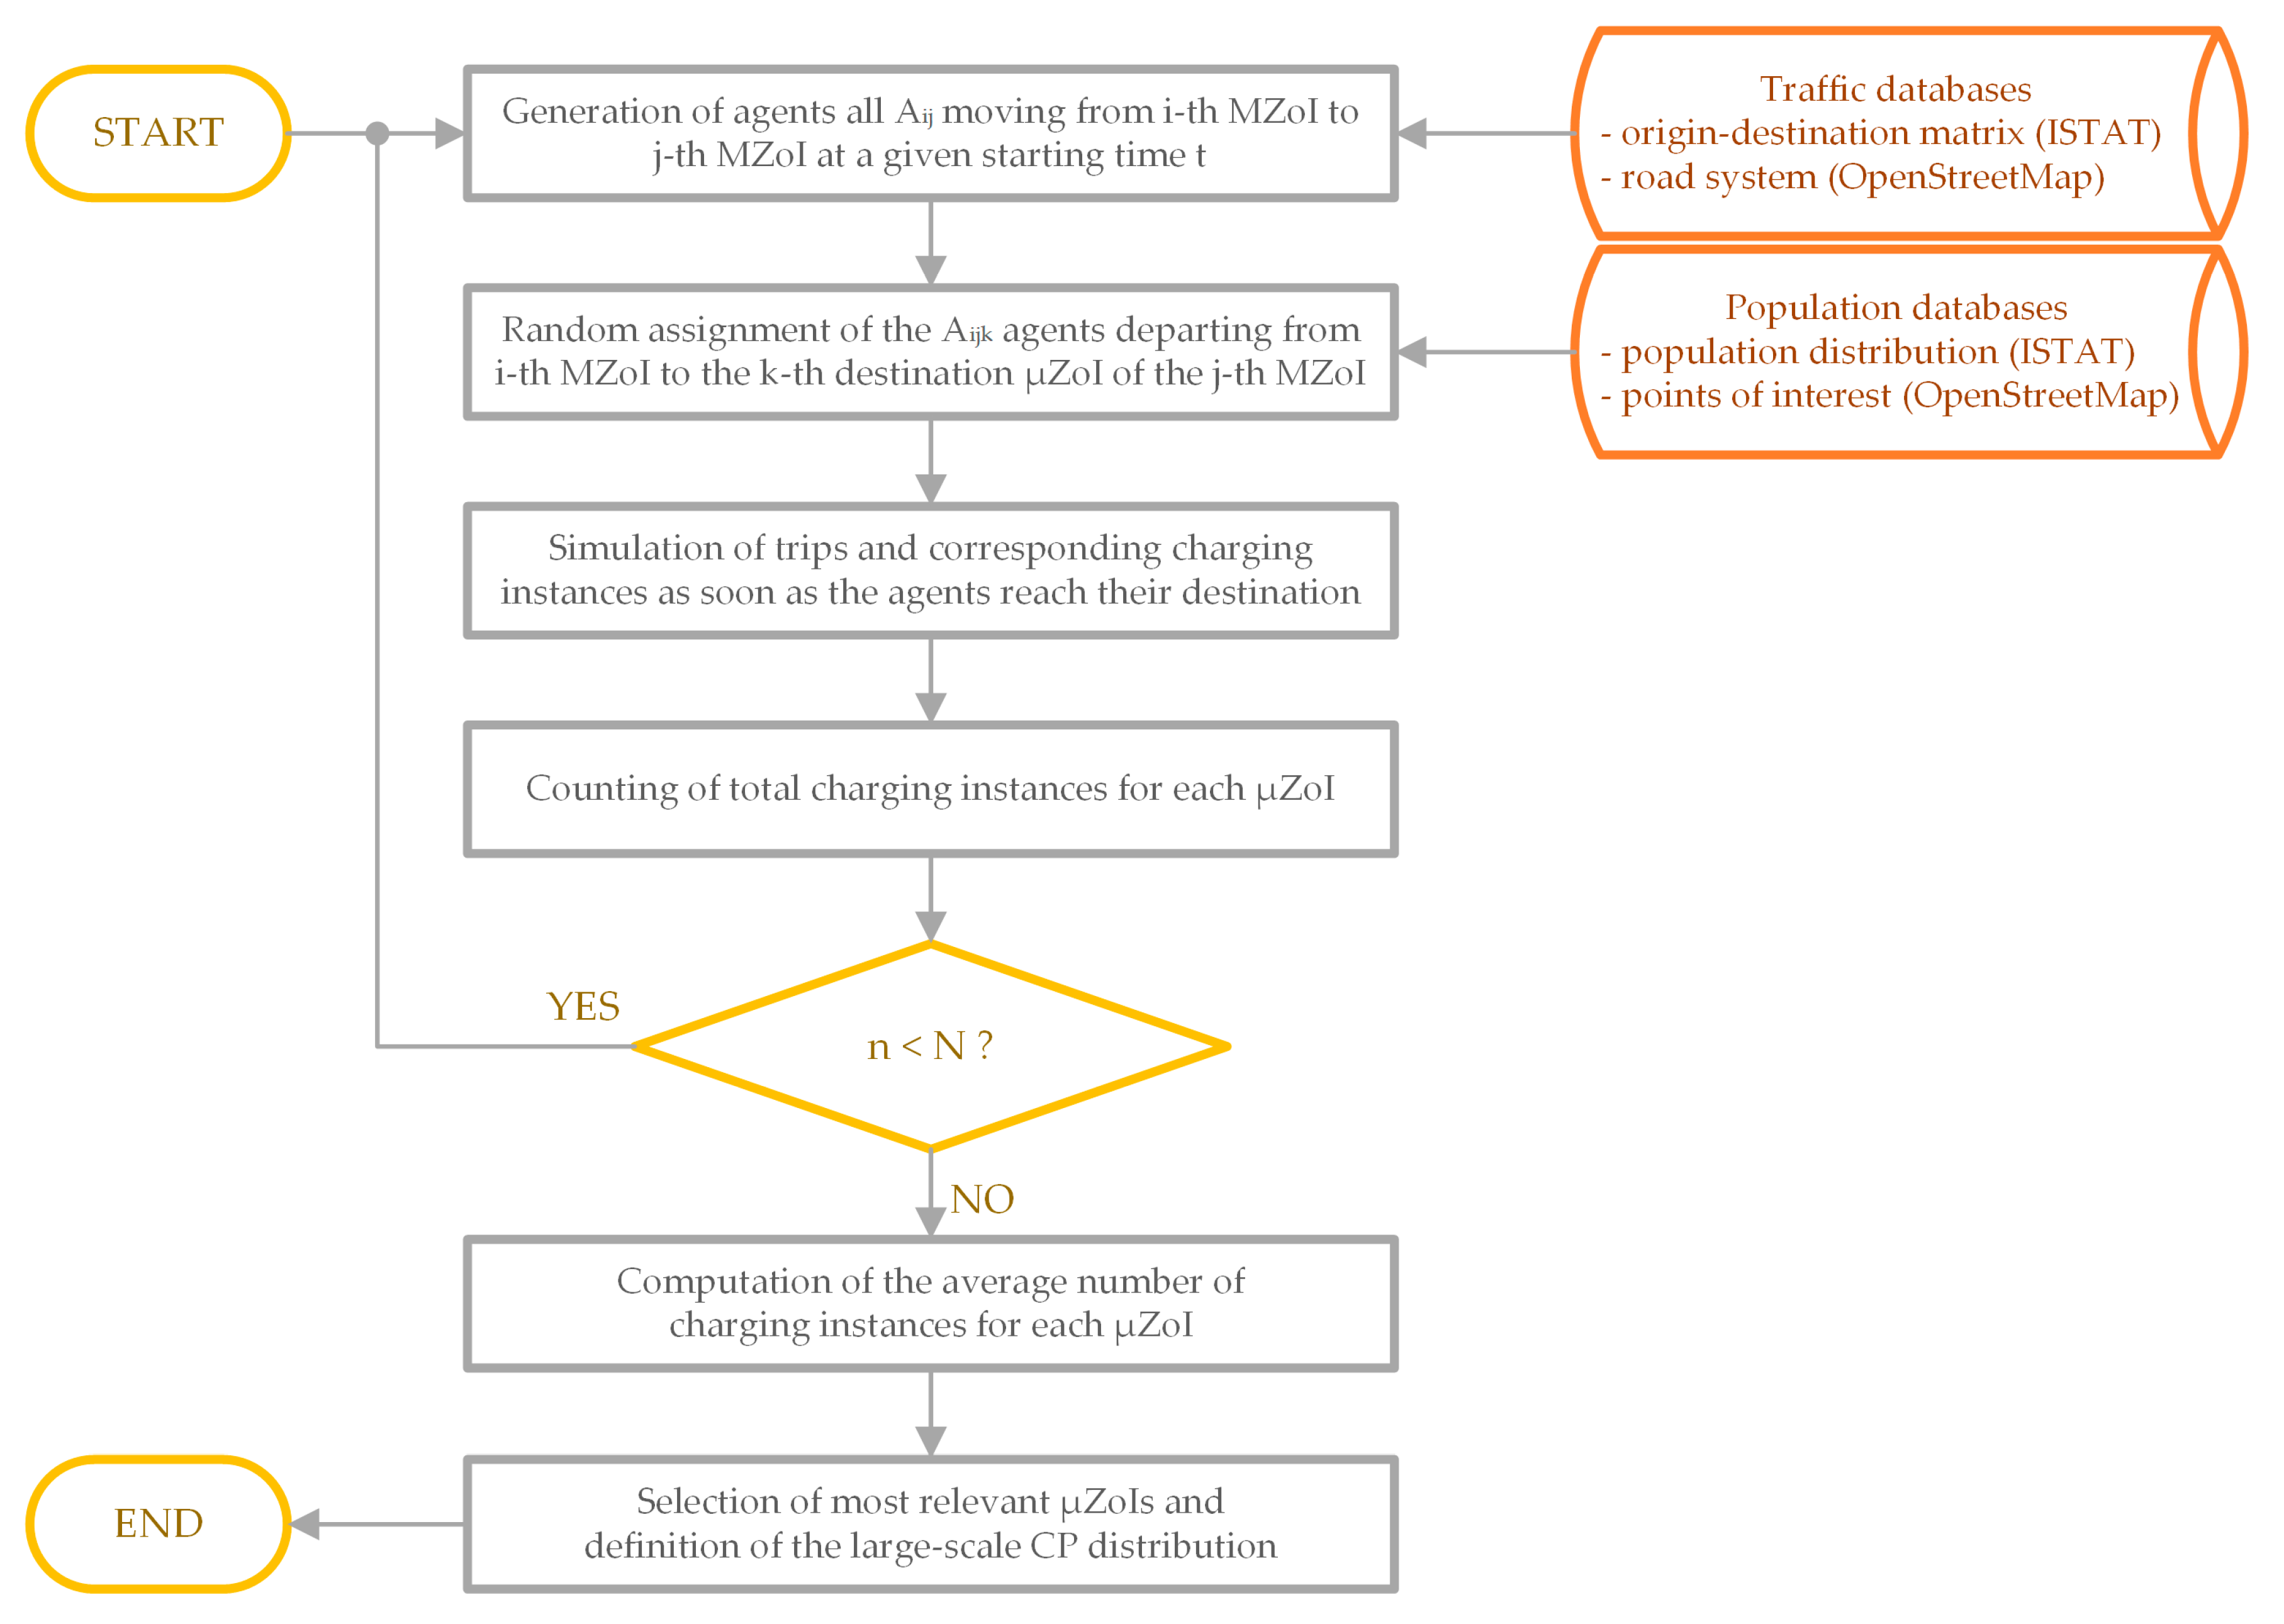
3.2. Stage 2: Microscale Planning

The coarse spatial resolution of charging instances achieved by the macroscale planning is not accurate enough to position the required CPs effectively. Hence, in order to refine the outcomes of the previous stage, microscale planning is necessary, whose flowchart is shown in Figure 4. The MZoIs* identified at the previous macroscale planning stage are further split into Microzones-of-Interest (µZoI) in accordance with the intramunicipality geographical subdivision coming from the national census. Particularly, only destination MZoIs* are modelled with higher spatial resolution, as depicted in Figure 5. This design choice comes from the following assumptions: first, all the EVs are assumed leaving with a fully charged battery, but no home-charging instances before the trip are considered for locating public CPs. Second, only commuting trips over the morning that require a public recharge after the trip are considered, together with non-habitual trips, such as those related to public services and shopping malls. Third, all the trips back to home that may resort to private domestic charging are neglected. Consequently, a high spatial resolution is adopted only when considering arrivals at each MZoIs*, while much less resolution is used when analysing departures because it would lead to higher computational effort without any advantage in precisely estimating the location of potential charging instances.
Once the µZoIs are defined, the microscale planning is carried out similarly to the macroscale planning through the ABM. A microscale distribution of charging instances is thus achieved, based on which the rough number of CPs assigned to each MZoI* is shared among the corresponding µZoIs by selecting just the most relevant ones (µZoI*). This microscale CP distribution is then further refined at the fine-scale design stage.

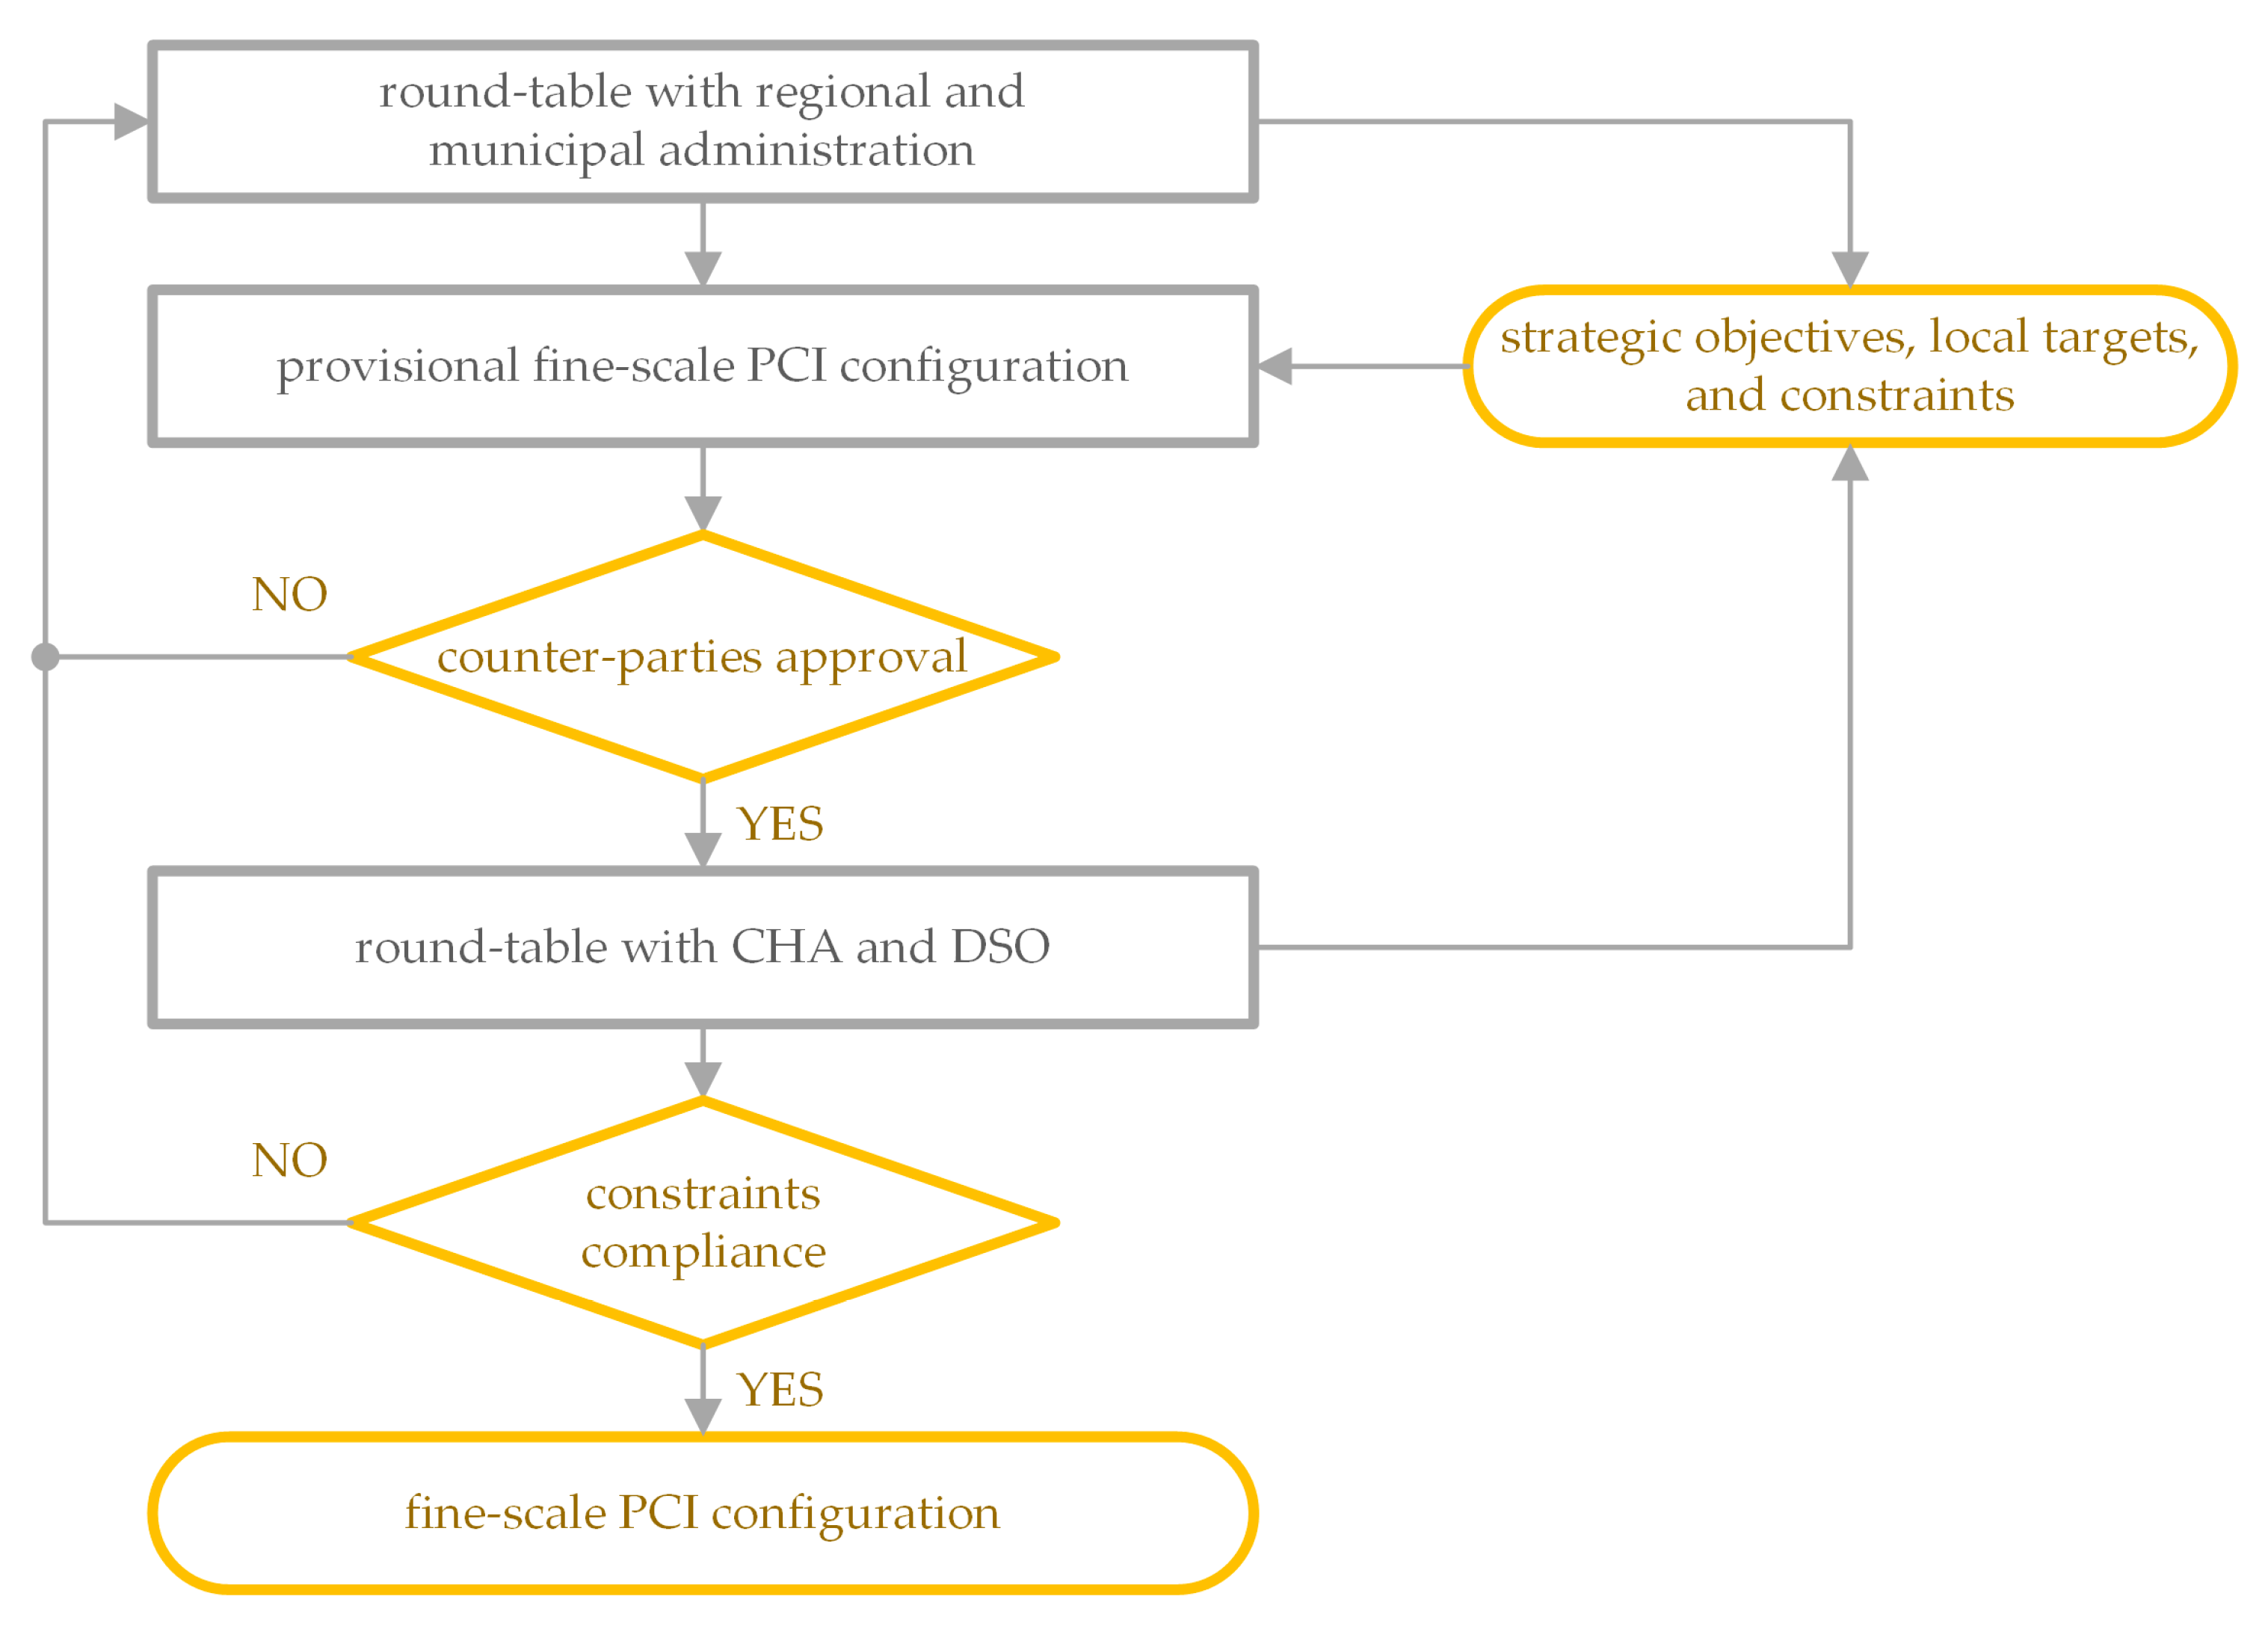
3.3. Stage 3: Fine-Scale Design

The goal of the fine-scale design is the precise definition of the location and power rate of each CP. Unavoidably, this final stage involves various counterparties, such as regional and municipal administrations, the Cultural Heritage Authority (CHA) and the Distribution System Operator (DSO). These entities supervise the compliance with strategic goals and local targets, as well as environmental, landscape and power-system constraints that must be satisfied by the proposed PCI configuration.
The fine-scale design process is illustrated in Figure 6. It starts with a preliminary round table in order to set general objectives, which are defined following the current legislation and national guidelines [27]. Subsequently, the CPs assigned to each µZoI* are positioned manually by defining their precise geographical coordinates. In order to reduce overall installation costs, CPs are clustered into single charging stations when needed, e.g., to minimise connection charges or due to a lack of parking spots. Regarding CP power rate, three different power levels are considered and assigned to each CP depending on the need for slow, quick or fast EV charging; this, in turn, depends on the specific POIs that determine the potential charging instances, which are identified by local administrations or retrieved by city thematic maps. In this regard, a slow recharge is generally sufficient when the charging process takes place over a long parking time (4–8 h, e.g., workers and residents). In this case, a low power level (7 kW) is selected. A higher power level (22 kW) is instead required for a quick recharge, which occurs over a shorter parking time (2–3 h, e.g., shop customers, hospital patients or people practicing leisure activities). When a very short charging time is expected (30 m to 1 h), a DC fast recharge (50 kW) is chosen: for this reason, fast CPs are strategically located on the main roads at the entrance/exit of each MZoI. It is worth noting that a proper number of CPs for each power level must be distributed over each µZoI*, following different EV drivers’ habits and needs.
Subsequently, the preliminary configuration has to be refined iteratively in accordance with feedbacks and observations that arise from the discussion with local administrations. In this phase, either minor or significant modifications may be required by urban plans, mobility systems and other aspects, such as tourism and environmental initiatives not previously considered. Once local administrations approve the PCI configuration, this has to be validated further by both CHA and DSO. CHA verifies that all charging stations comply with archaeological and environmental constraints, whereas DSO evaluates the impact of the PCI on the existing power system. Therefore, CHA and DSO may propose changes of CP locations in each µZoI*, each of which requires a revision of PCI planning. Further examples of specific attributes that may be discussed at the round table are: additional cost sharing for revamping distribution transformers of power substations; transfers of land ownership where the installation will take place; shape and appearance of charging devices; managing platform; customer-access modes, such as credit card, cash or radio-frequency identification (RFID) card. Consequently, an iterative process is carried out until the compliance with all goals, targets, constraints and requirements are satisfied, as highlighted in Figure 6. It is worth noting that preliminary CPs may not be distributed among the charging stations as desired. This mainly happens due to any constraints that increase the cost of the charging station excessively, e.g., a connection point is more distant than expected, or a lack of parking spots forces the split of a single charging station into multiple ones. In these cases, the preliminary fine-scale PCI configuration is refined further by properly reducing the CP number and the overall costs until it complies with the budget constraint. Even in the case of adding a µZoI* to the preliminary PCI configuration, this can be done at this stage (fine-stage design) upon approval by local administration and counter-parties. Consequently, coming back to previous stages is not required.

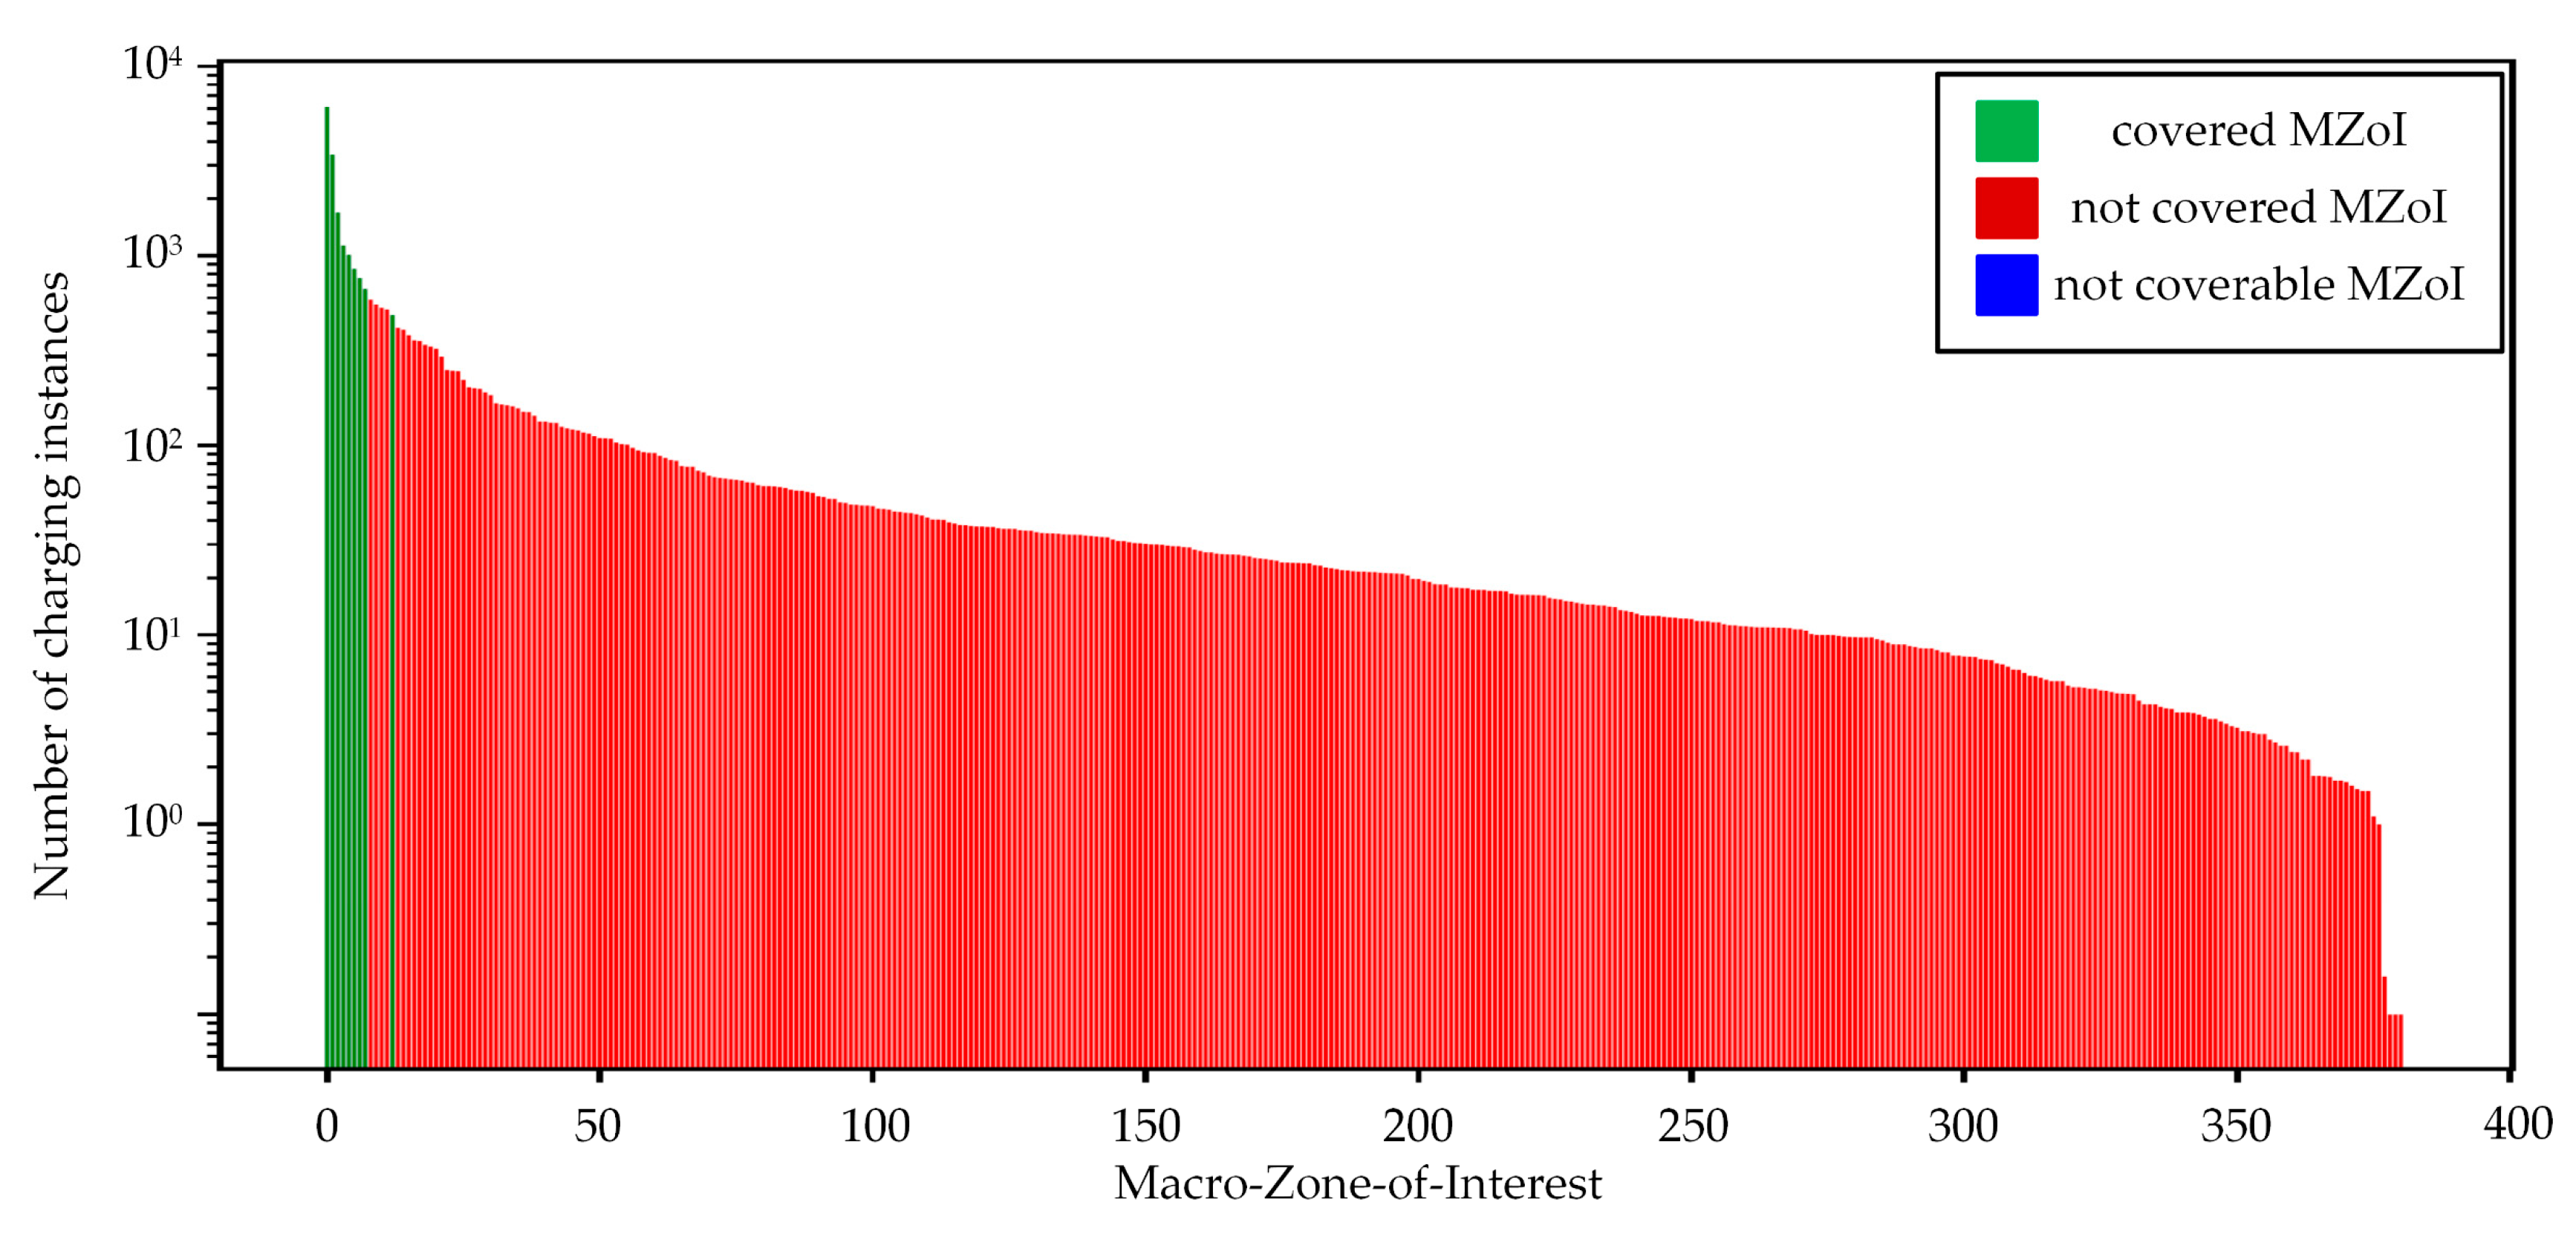
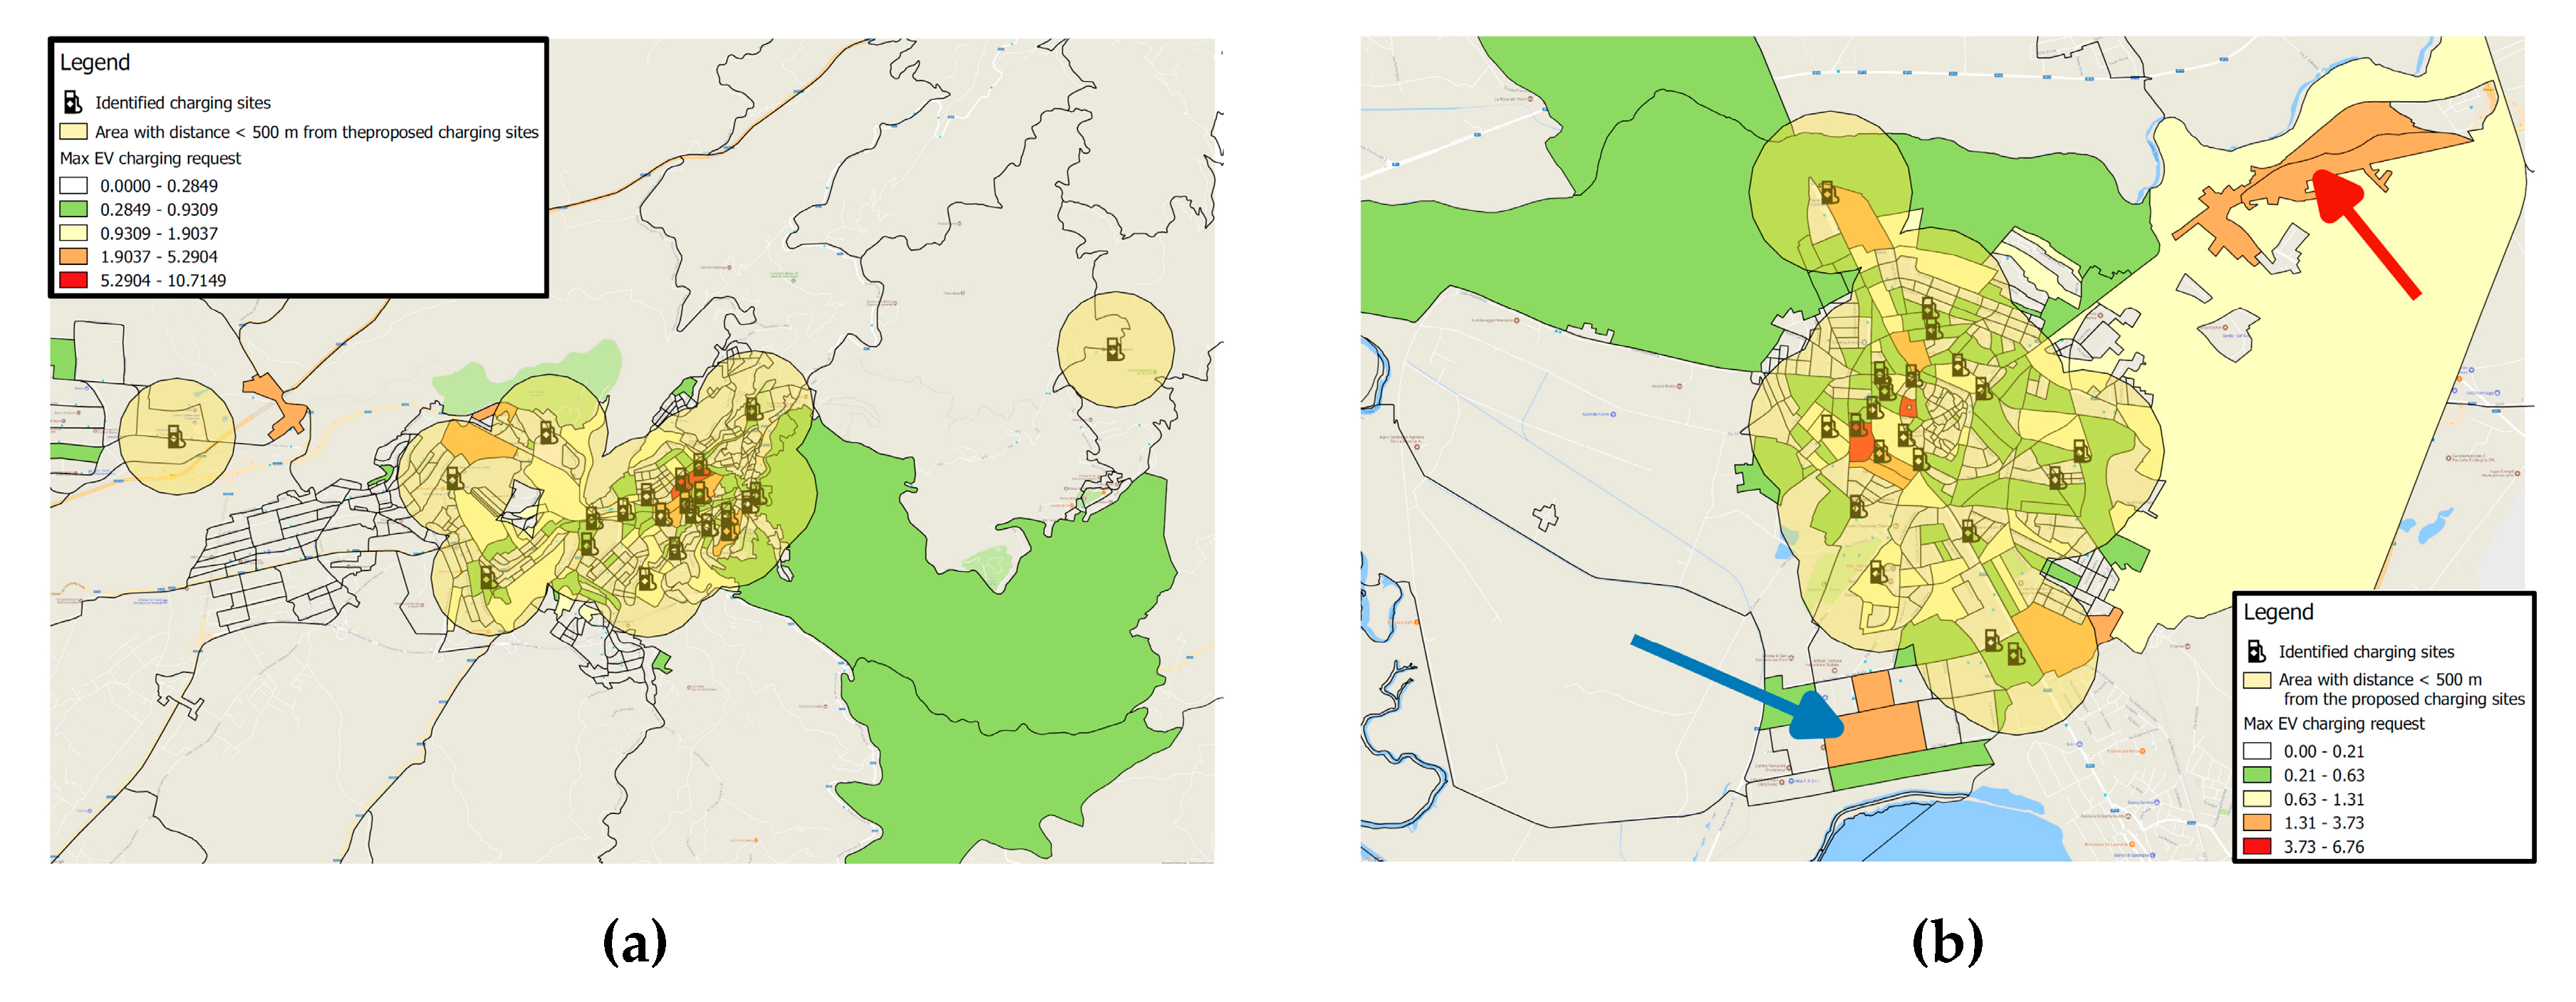
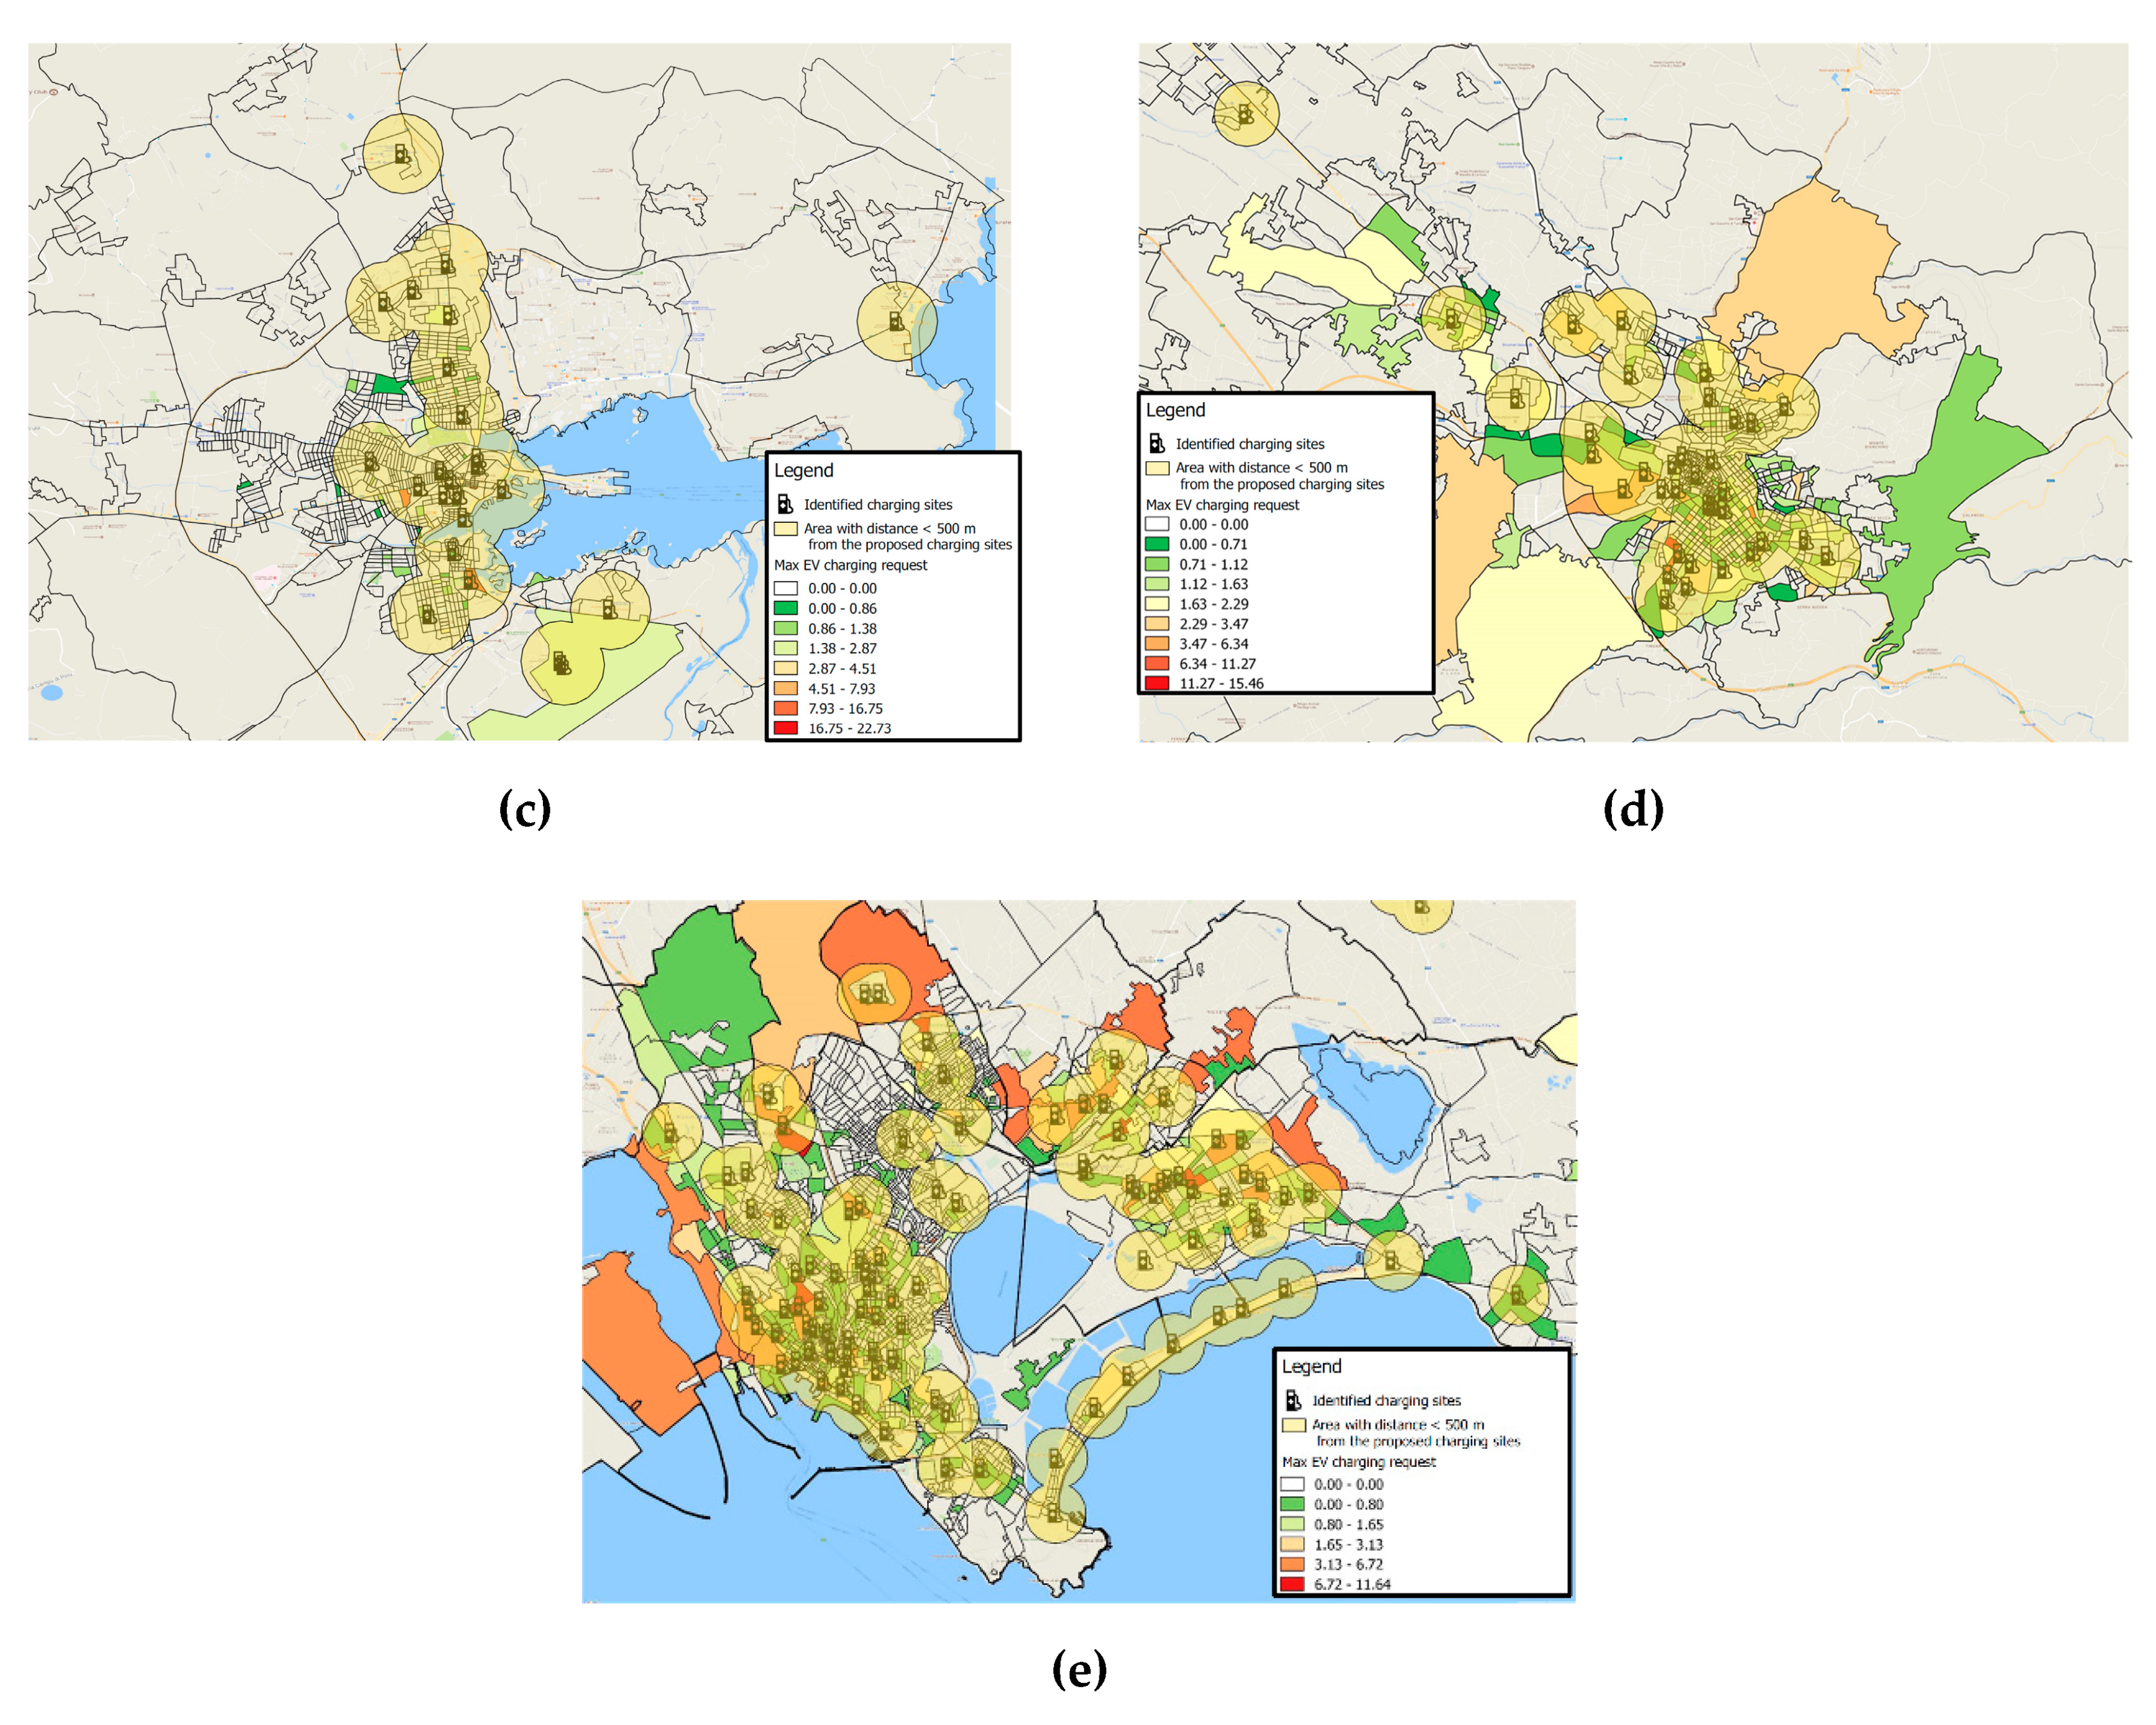
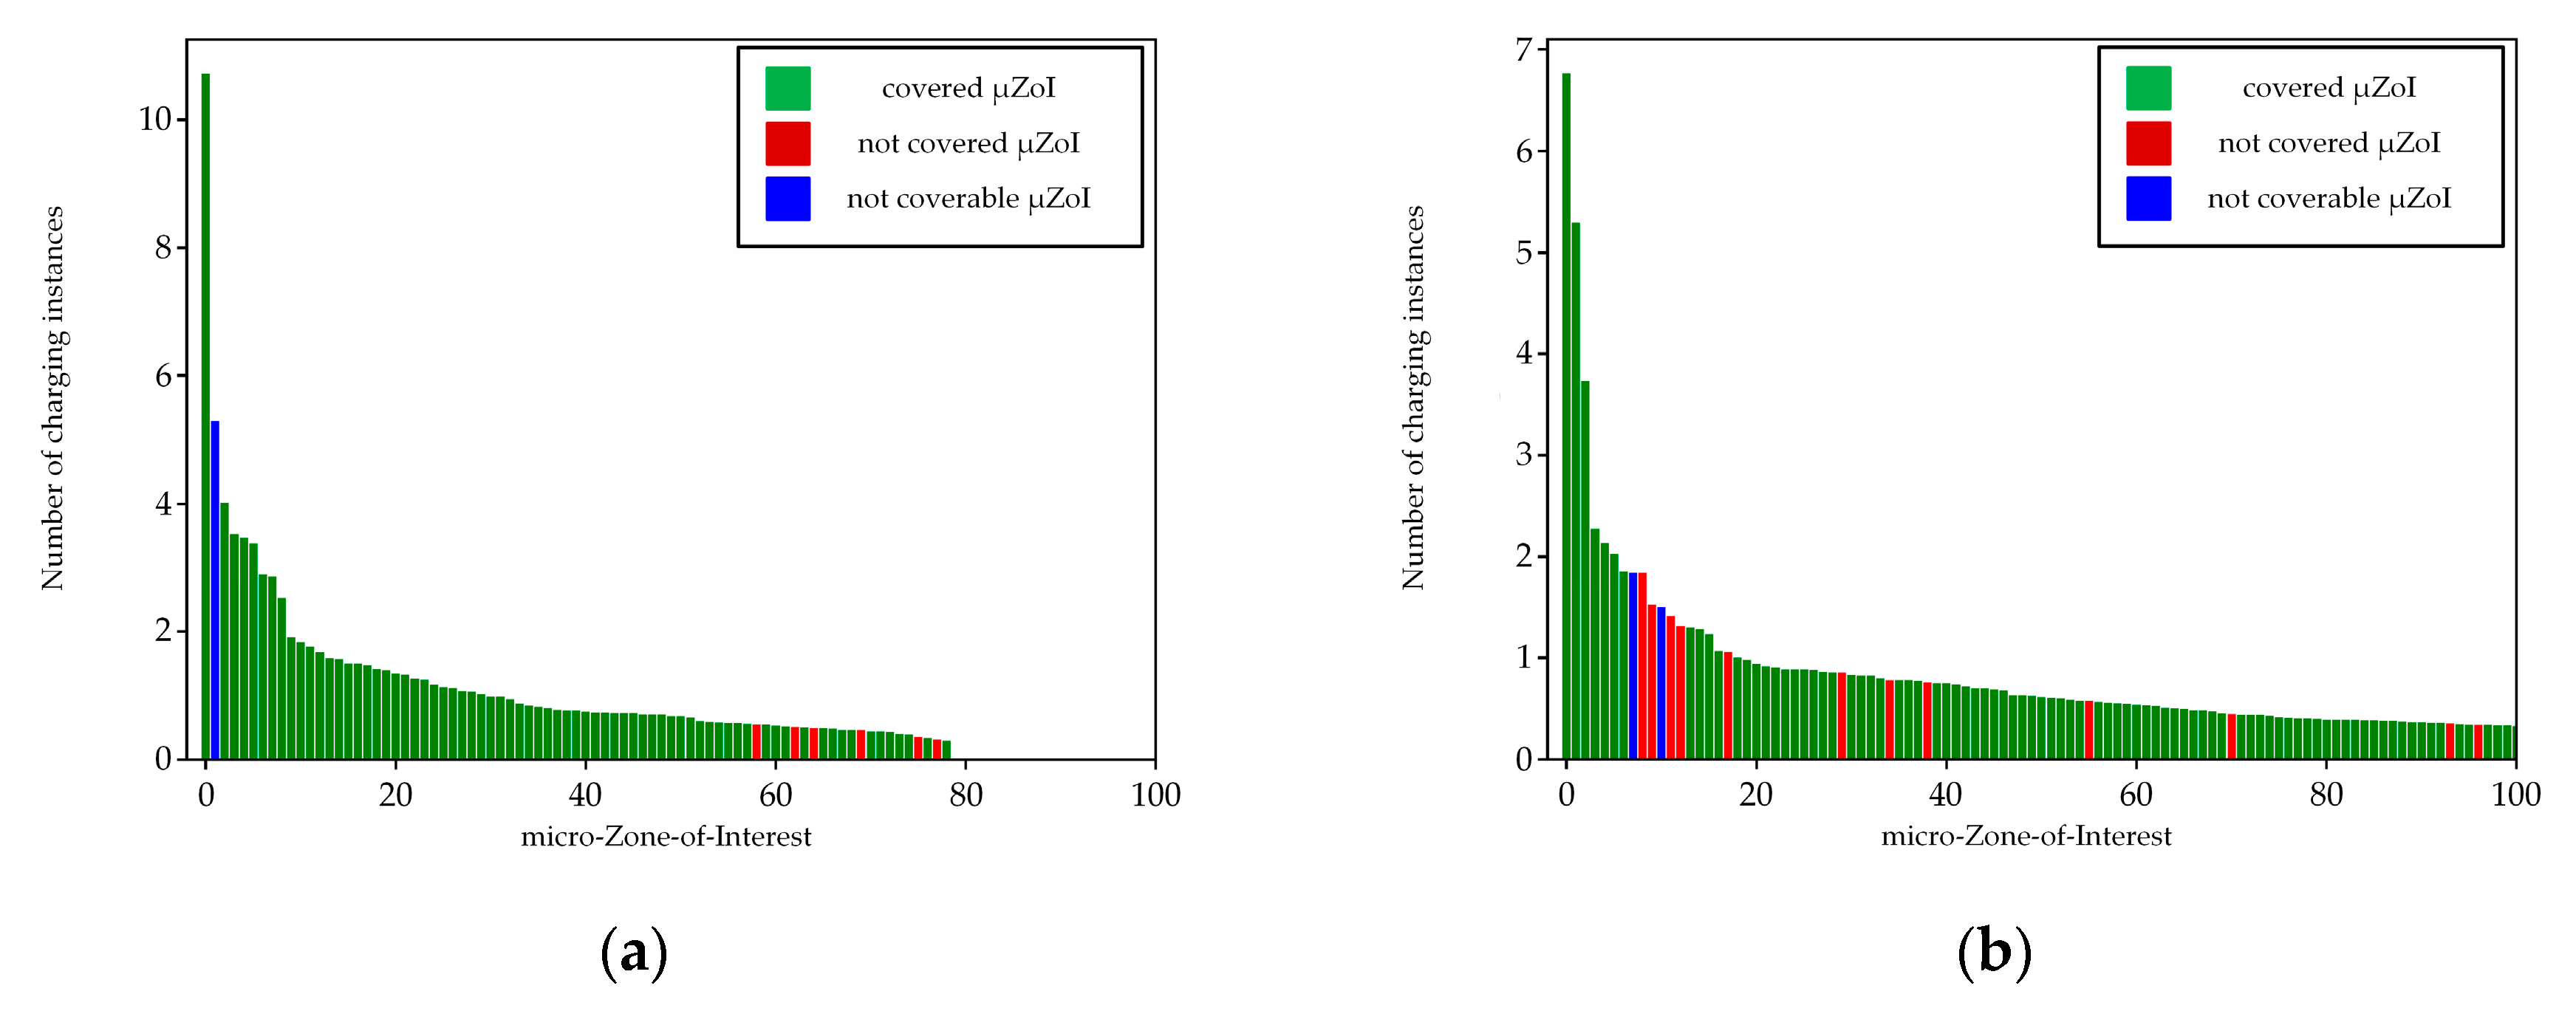
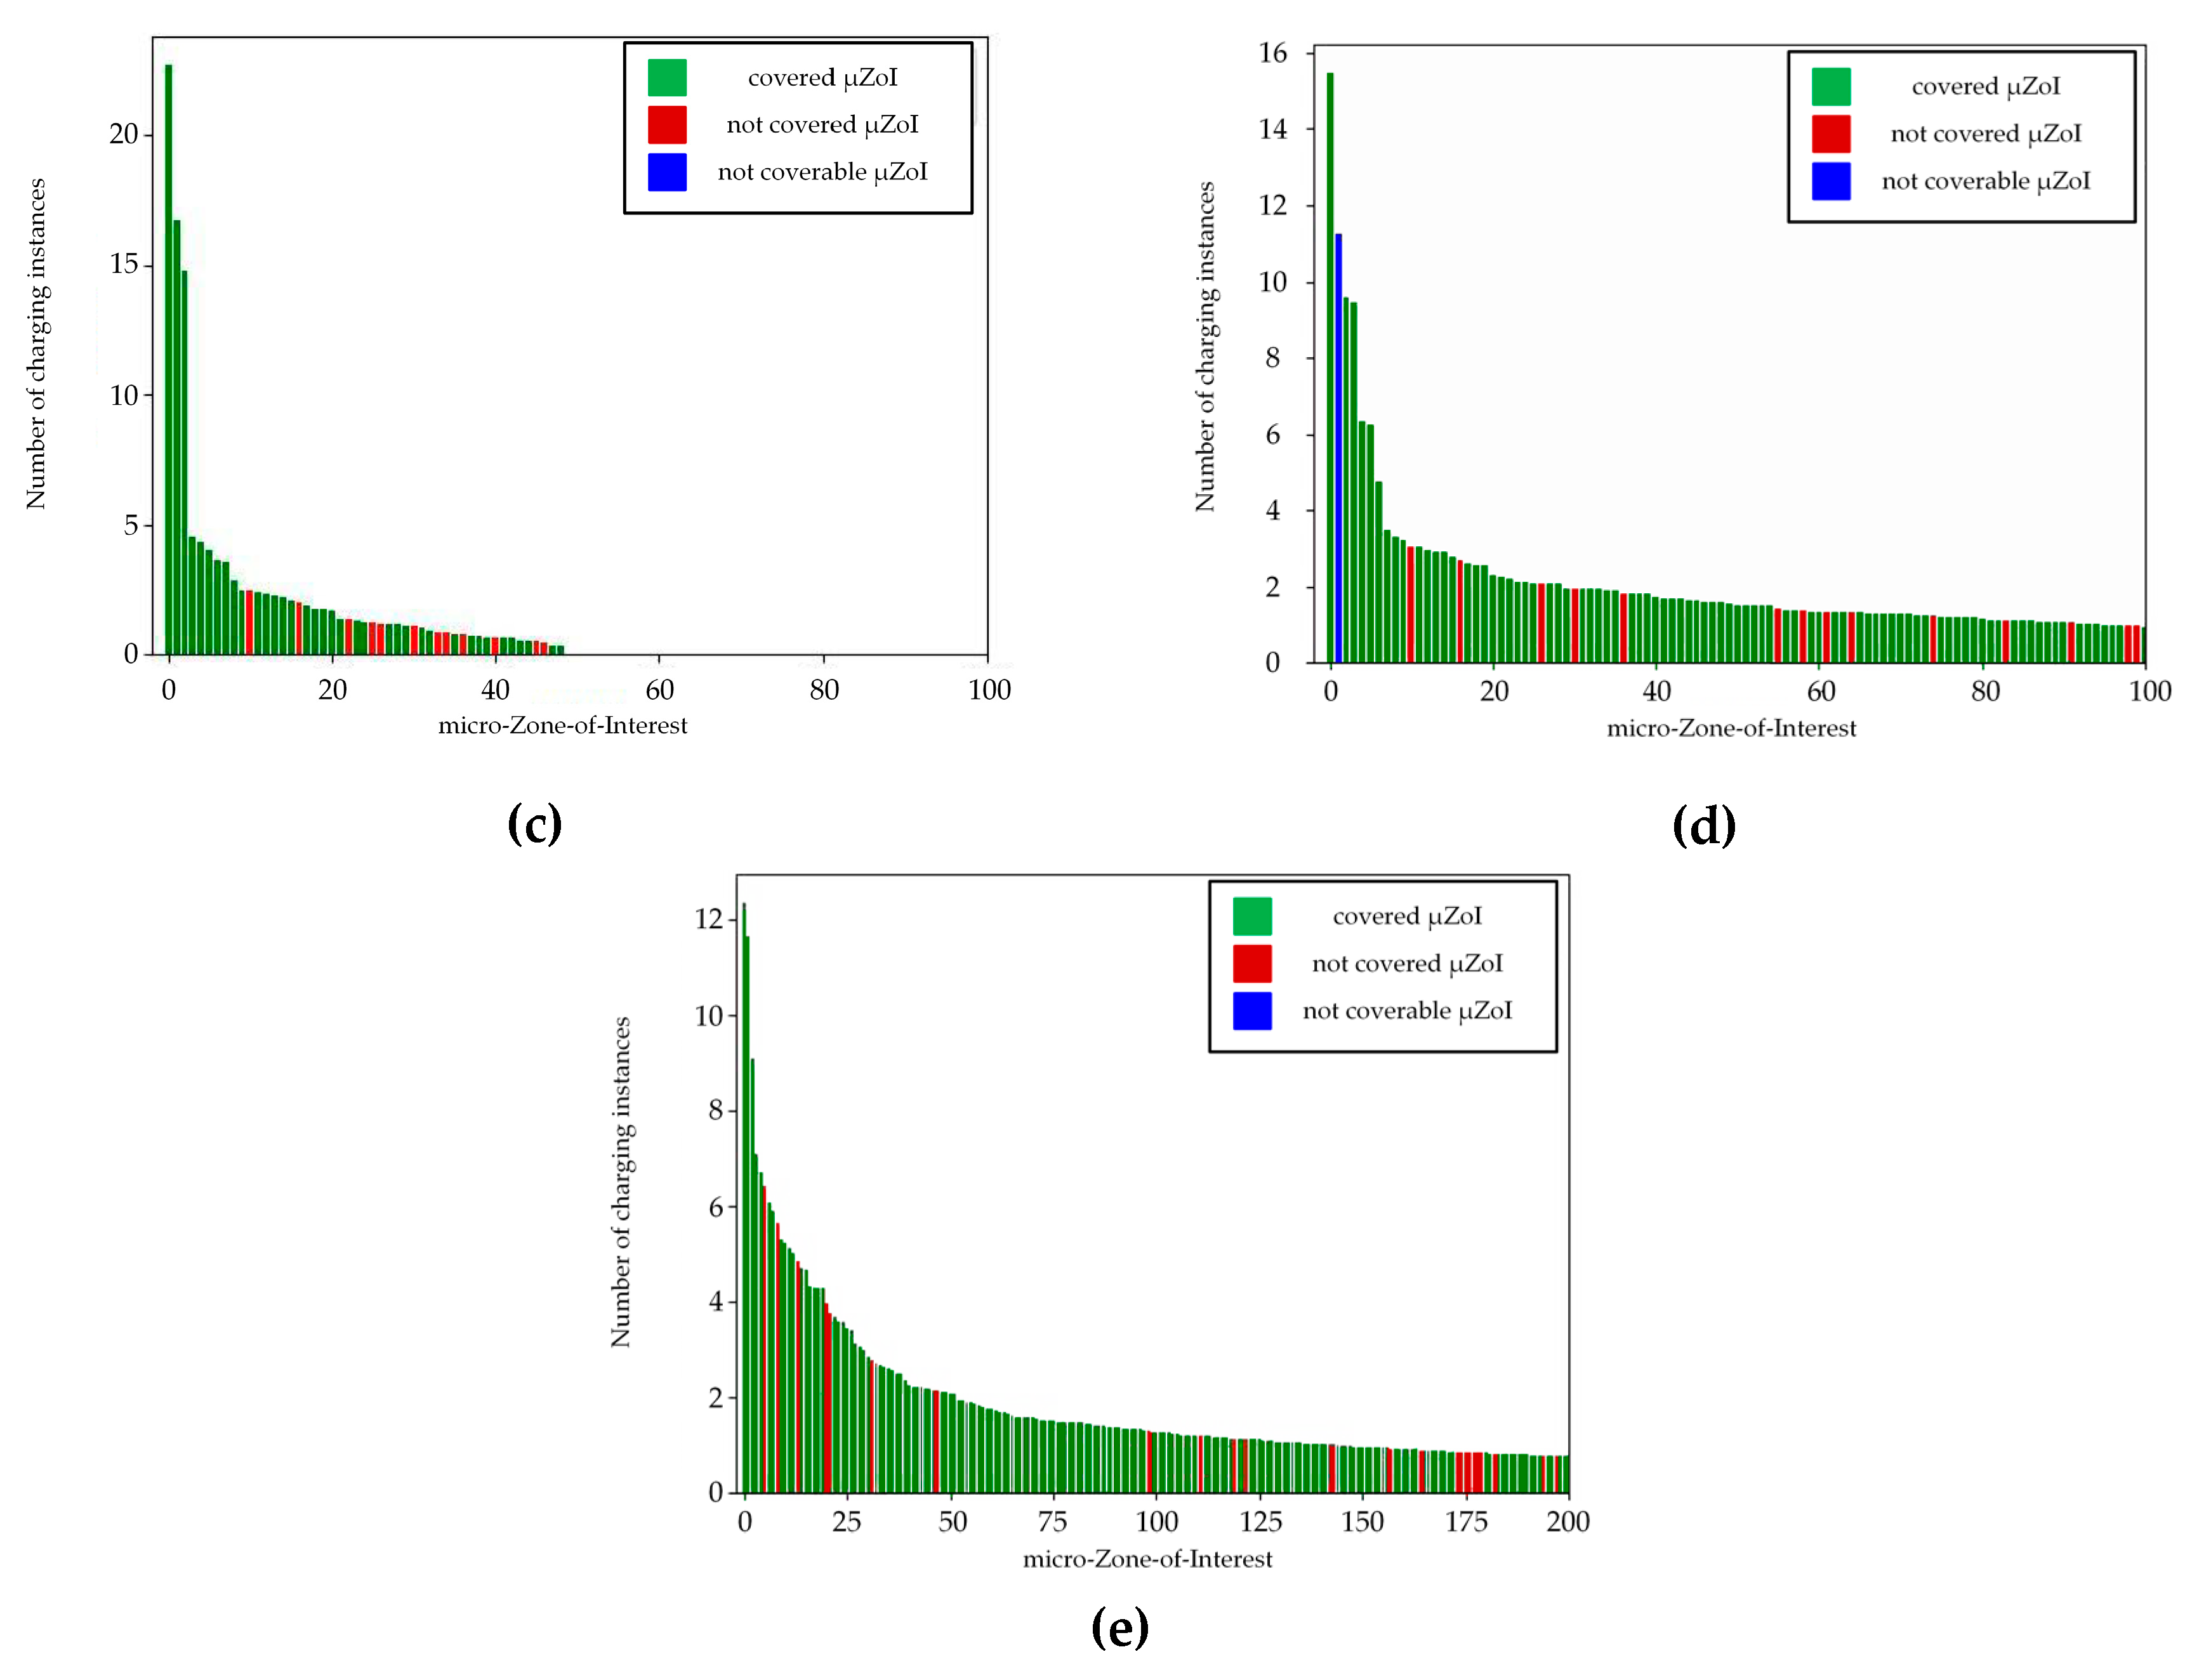
4. Experimental Validation

4.1. Key Performance Indexes

The effectiveness of the PCI design process is quantified by defining two suitable Key Performance Indexes (KPIs). The first index is the so-called Index of Specific Coverage (ISC), which is defined as
I S C m = j C j , m ( t ) A j , m j C j , m ( t ) A j , m .
This index assigns a weight (Ci,j) to each MZoI and µZoI (Aj,m) proportional to its expected charging instances. In this way, the ISC returns the normalised fraction of charging instances satisfied by the CPs. The covered/uncovered areas of interest are easily extractable by using GIS.
The second index proposed in this paper is the Set of Covered Areas (SCA), which is much more meaningful if given graphically (Figure 7). This index consists of a Pareto-style graph that shows, with a colour scheme, the areas covered by the planned charging stations, while also giving information regarding the type of the considered areas (residential, commercial, industrial) and the expected charging instances of each MZoI and µZoI. As a result, SCA facilitates the decision-makers by identifying uncovered areas. Despite being simple, this index has been fundamental during previous decision-making processes, since it clearly and easily underlined the weak spots of the planning results.
Both ISC and SCA cover a very important role in guiding the design of the PCI step by step, because they give simple, fast and effective feedback regarding the worth of the design proposal. Thus, they are preferable to complex analytical formulation when the latter is not compatible with the project size (e.g., budget, geographical extension, etc.). They are fundamental when analytical formulation is hardly achievable or even unfeasible due to a number of reasons, such as unavailability or weak quality of structured data, as evidenced in the specific case study presented in the next section.

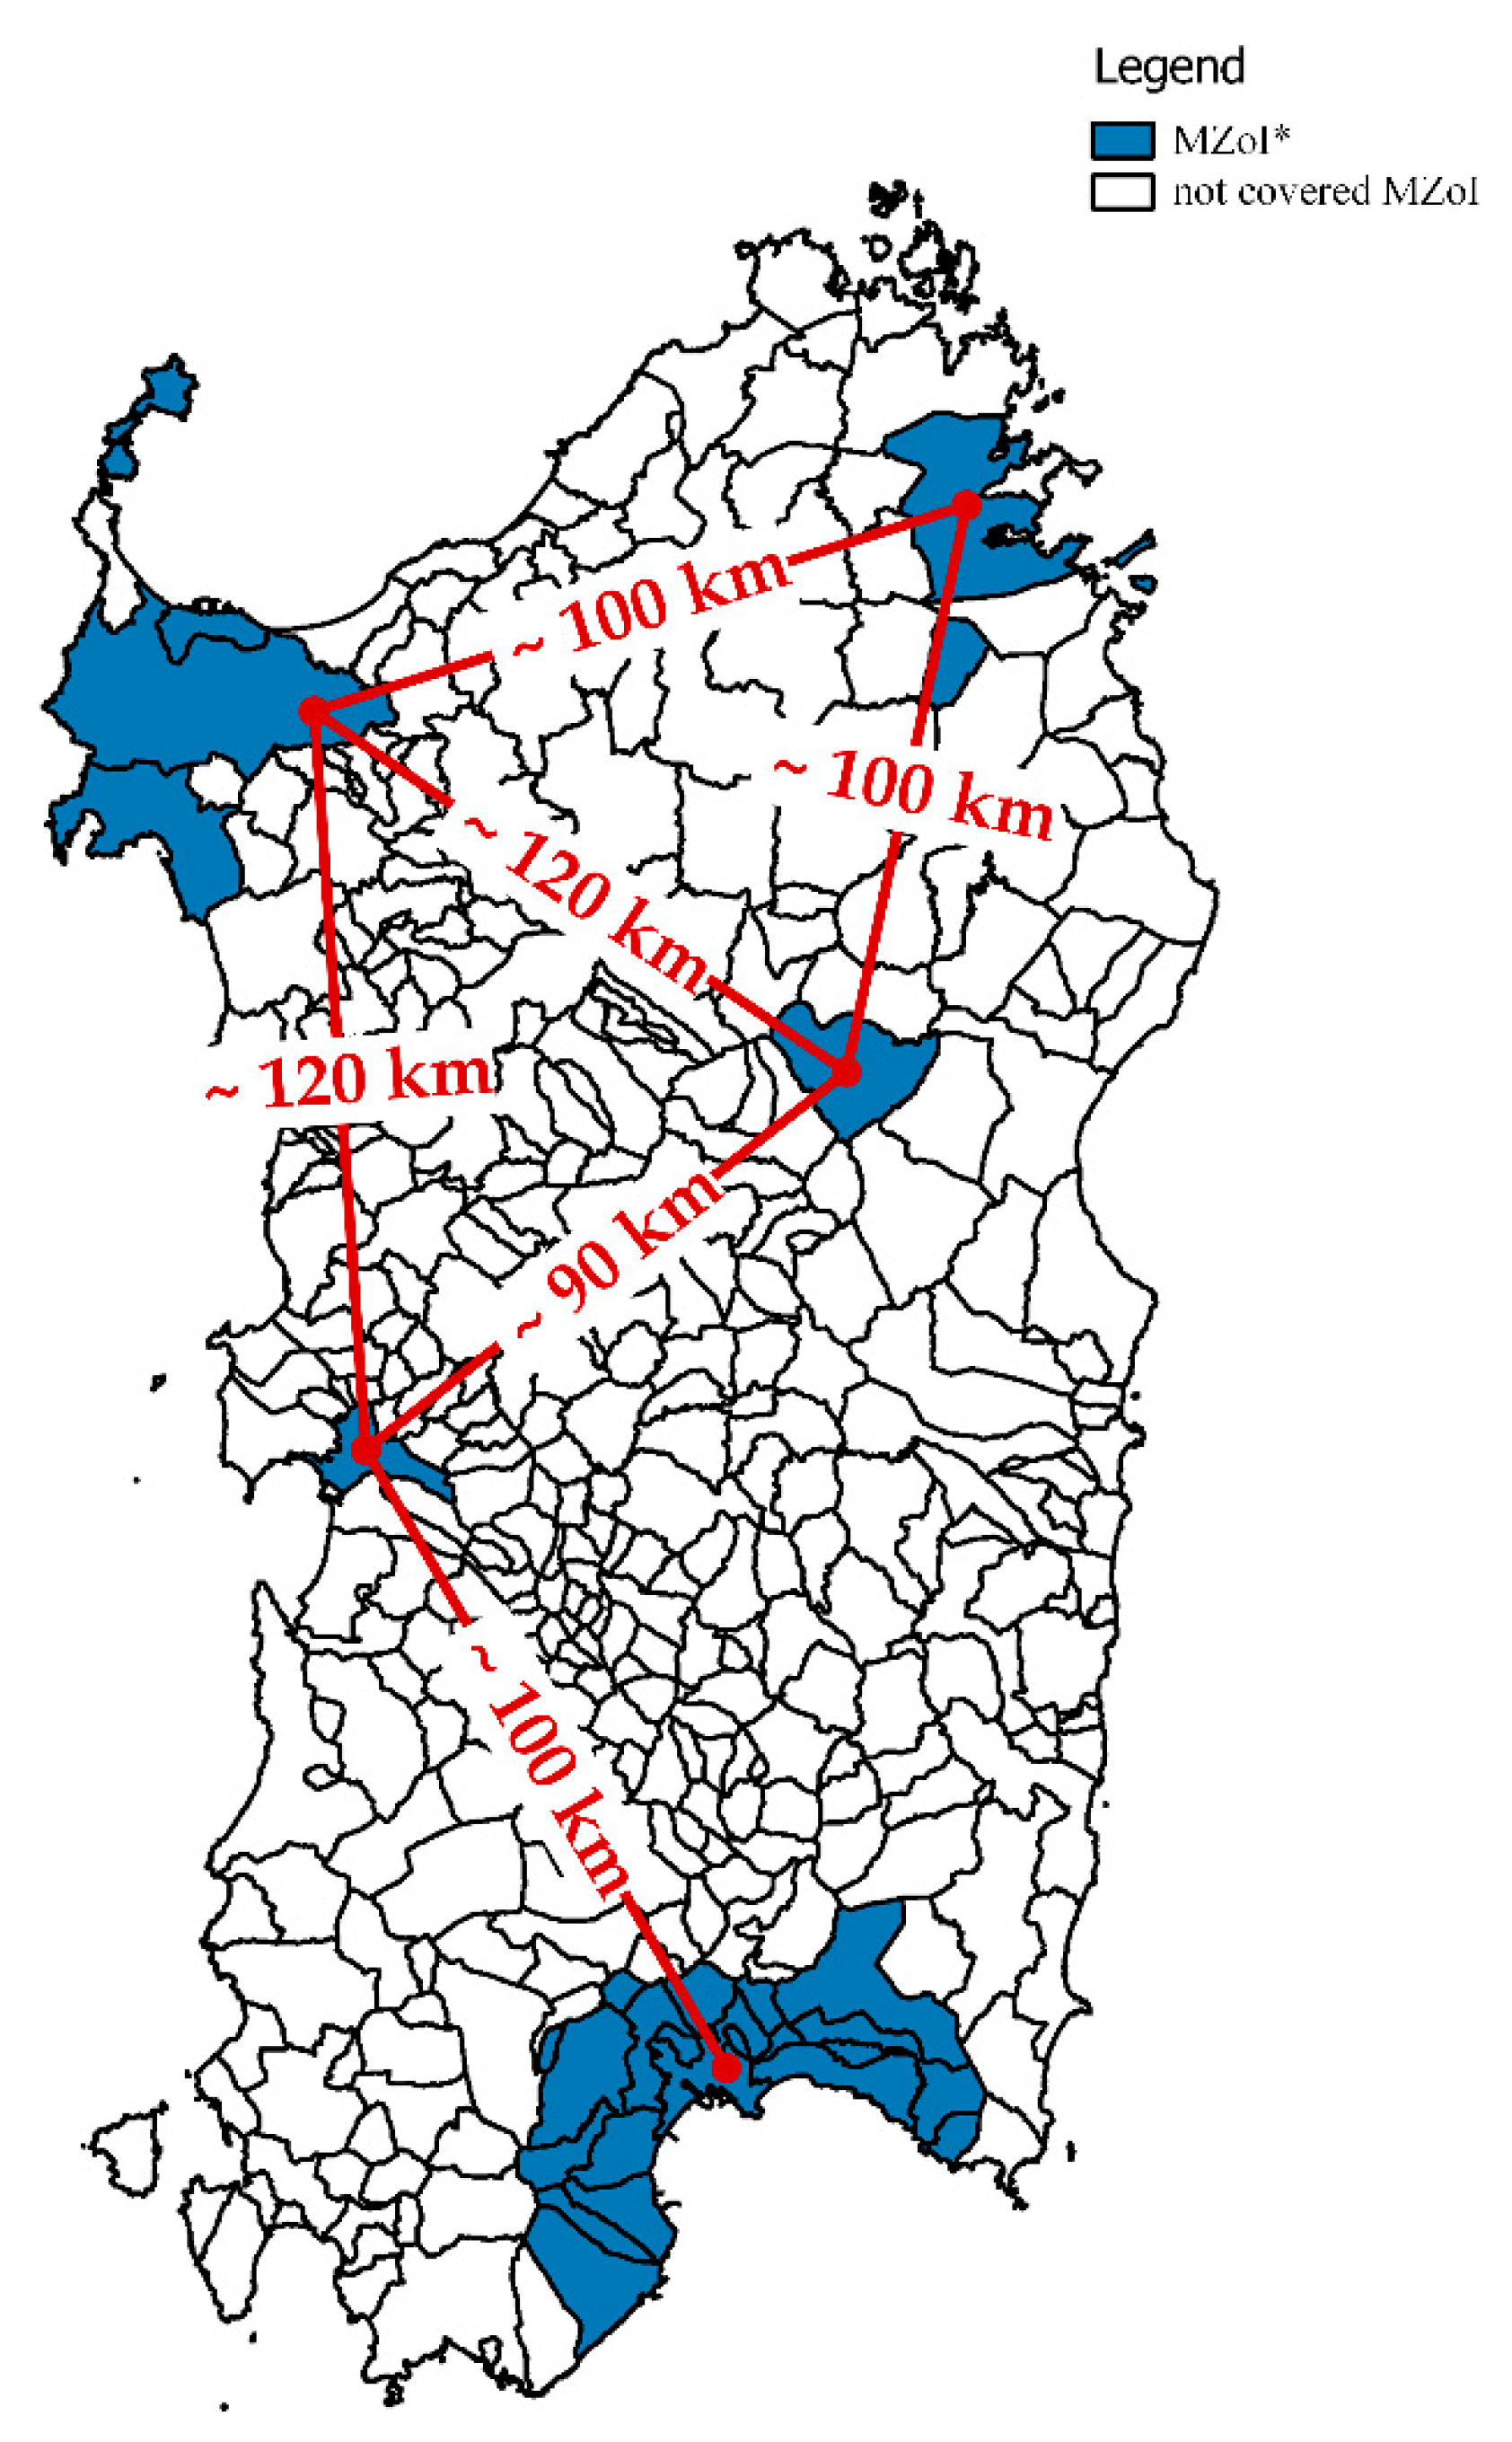
4.2. The Real Case Study: The Island of Sardinia
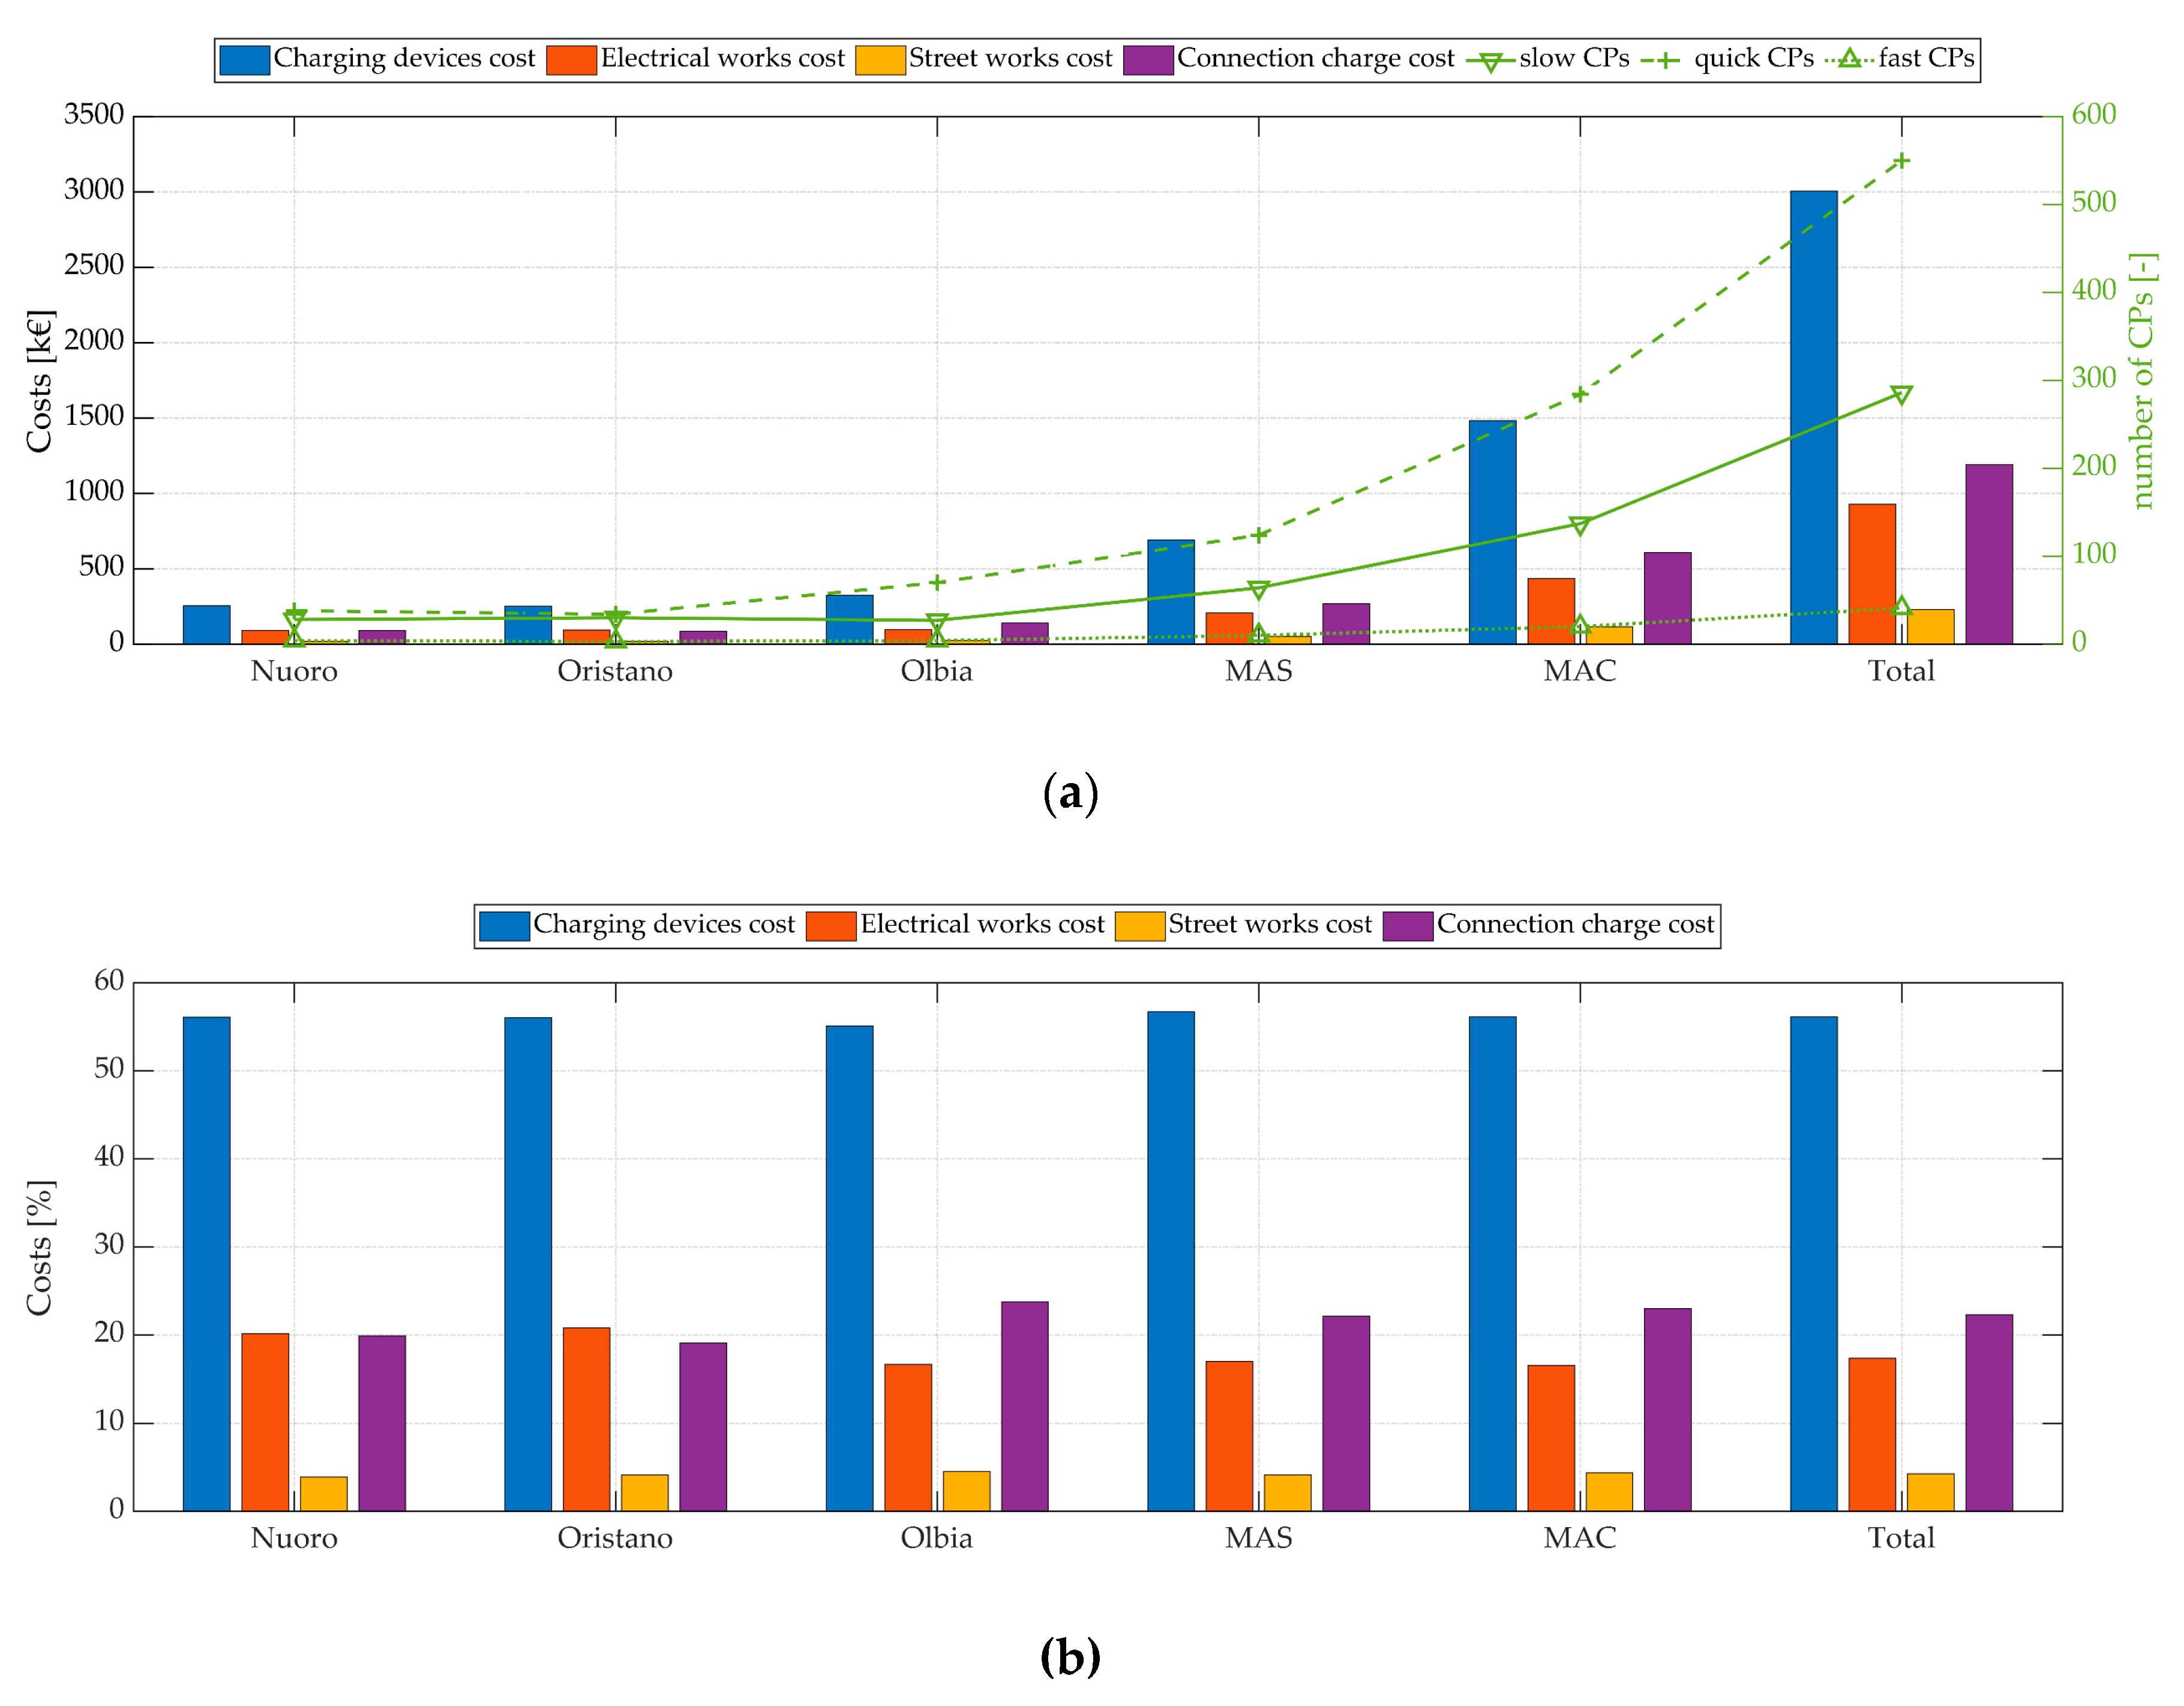
Following the proposed methodology, we first applied the macroscale planning to the Italian island of Sardinia. Each municipality was considered as a single MZoI, except for the Metropolitan Area of Cagliari (MAC) that consists of 17 municipalities, and for the Metropolitan Area of Sassari (MAS) that consists of 3 municipalities. Five MZoIs* were then selected, the geographical locations and reciprocal distances of which are highlighted in Figure 8. These MZoIs* were the cities of Oristano, Nuoro and Olbia, and the clusters MAS and MAC, which globally account for 52% of the total Sardinian population, 75% of the mobility demand and 81% of the estimated EV charging instances, as proved by the SCA depicted in Figure 9.
It is worth noting that considering every MZoI is possible but weakly effective because it leads to too many dispersed CPs, increasing complexity with a reduced benefit-to-cost ratio. Subsequently, the microscale planning stage was carried out: all MZoIs* were split into µZoIs. The number of charging instances for each µZoI is graphically represented on the maps depicted in Figure 10. Particularly, Figure 10 reports only the peak value of charging-instance evolutions over a whole day. Based on these results, µZoI* were properly selected for each MZoI*, and CPs were preliminarily distributed among them. These distributions are still detectable in Figure 10: each charging station is marked appropriately, while the corresponding SCA are plotted in Figure 11. Finally, the microscale configurations were refined during the fine-scale design stage. It is important to highlight that SCA and ISC were widely used throughout the design procedure, because an analytical formulation of the problem was unfeasible due to data unavailability. Particularly, the number of parking slots and corresponding ownership had to be verified manually, and CHA and DSO constraints were not available either.
Focusing on Nuoro and Oristano at first, only three iterations led to the final PCI configuration. This is because CHA and DSO returned only small issues after the first round of meetings, speeding up the design process. All the stakeholders easily agreed on the minor modifications that were proposed to solve these issues. The final PCI configuration consisted of 23 charging stations for each municipality, but they differed from one another in terms of power level, as detailed in Table 1. The corresponding KPIs showed good values for both the municipalities: their ISCs were higher than 85%, and Nuoro reached a much higher value (91.7%) than Oristano (85.7%). This difference was easily explained by referring to the SCA graphical representations depicted in Figure 11a,b; particularly, Oristano shows much more uncovered µZoI* than Nuoro because the latter is characterised by fewer suburbs, resulting in a higher-covering factor. The not-coverable areas highlighted blue in Figure 11a,b represent industrial areas that lack public parking slots because of the specific urban regulations. The lack of public parking slots prevented the identification of suitable locations for installing charging stations, and thus these industrial areas were not covered. A good ISC was achieved for the municipality of Olbia (89.4%), which has widely spread urbanisation prevalently based on commerce and services. Consequently, 27 charging stations were planned for this municipality, with a prevalence of quick CPs, as highlighted in Table 1.
More issues arose during the PCI design of MAS, which includes the municipality of Sassari and the two adjacent municipalities of Porto Torres and Alghero. First, the political entities of all three municipalities were included in the decision process, which increased its complexity. This increased complexity resulted in a longer iteration loop, which was performed five times, including two different rounds of checks by the authorities. In the end, the PCI design process resulted in 61 charging stations for a corresponding ISC of 88.3%. The relatively low ISC achieved by MAS was due to similarities with Oristano, namely that MAS is characterised by a lot of suburbs and industrial areas without public parking, leading to a relatively low ISC value.
The MAC deserves a separate discussion. The municipality of Cagliari, which is the capital city of Sardinia, accounts for about 10% of the inhabitants of the whole island. Due to its attraction potential, a metropolitan area has been developed in its surroundings, officially appointed in 2016. This area consists of 17 municipalities and accounts for about 30% of the population of Sardinia. Also, it attracts about 50% of the incoming mobility of the island and about 53% of the global estimated EV charging instances. Due to its elaborate organisation scheme, it was not possible to include the administrations of all the single municipalities in the decision process.
All the interactions were carried out with the intermediary administration body of the whole metropolitan area, which is in charge of representing the needs of all the municipalities involved. For this reason, the decision process was carried out asynchronously. Nevertheless, the PCI design process succeeded in five iterations, with two different validation steps by the authorities. In particular, the decision process resulted in 140 charging stations, whose distribution over the different municipalities is given in Table 2. Figure 10e shows the spatial distribution of the planned charging stations in the municipality of Cagliari and the corresponding covered area. A good visual effect is confirmed by the ISC that was estimated to be 88.6%, as well as by the SCA shown in Figure 11e.

4.3. Cost Analysis

The available budget to plan and implement the PCI was about 5 M€. For this reason, attention was continuously paid to costs throughout the project. In order to estimate the budget allocation, costs were split into four items: charging devices, electrical works, street works and connection charges, as shown in Figure 12. Charging devices costs were estimated considering three standard values, each of which are associated to slow (2.30 k€, 1 CP), quick (4.50 k€, 2 CPs each) and fast (20.00 k€, 2 CPs each) charging devices. Additional costs related to electrical works (e.g., cables, electric panels, switches and breakers) and street works (e.g., digging and reconstruction, road bollards, road signs) were estimated for each charging station; these costs were derived by a preliminary design of each charging station and by assuming standard regional costs [28]. Finally, connection charges that needed to be paid to the DSO for every connection to the distribution system were also considered, which were estimated by the DSO itself on the distance of each charging station from the electrical substation and on its overall power.
As shown in Figure 12, the charging devices were the most significant part of the overall costs, and they were proportional to the number of CPs. Furthermore, regarding electrical and street works, the latter resulted in the lowest cost item, whereas the electrical works were almost comparable to connection charges. However, as the number of CPs increased, the number of charging stations increased too, and thus the costs increased due to connection charges. Particularly, it was found that the overall connection charge cost was not negligible compared to charging-device costs, further justifying the clustering of CPs into charging stations. The proposed approach allowed connection costs to be limited to just 22% of the total project costs, as highlighted in Figure 12b. It is also worth noting that, as shown in Figure 12b, the percent cost of all items were almost constant regardless of the specific MZoI. Although charging-devices cost accounted for approximately 55% of the overall costs, connection charges and electrical works represented considerable cost shares, confirming that they must be considered when planning a charging infrastructure. In order to give a complete overview of the project, the estimated costs for each MZoI* are shown in Table 3.

5. Conclusions

A Multistage Design Procedure (MSDP) for planning and implementing Public Charging Infrastructures (PCIs) is presented in this paper. It splits planning and design processes into multiple stages, from macroscale to fine-scale levels, thus ensuring an increasing level of detail in terms of the number of charging points and their corresponding geographical locations. The effectiveness of the proposed MSDP was tested experimentally by designing the PCI of the Italian island of Sardinia.
The corresponding results show a good charging coverage achieved by the proposed MSDP for the most important Sardinian municipalities, especially in terms of Index of Specific Coverage (ISC) and Set of Covered Areas (SCA). Particularly, it is expected that the PCI satisfied more than 80% of overall charging instances, which means that a charging point is far less than 500 m from the parking point of a vehicle owner. The performance of the proposed configuration, which is going to be implemented, will be monitored and assessed according to real collected data. The forthcoming monitoring process will allow suitable refinement of the proposed MSDP, which will be presented in future works.
Although the presented MSDP was developed and tested for this specific case study, it can be applied or adapted to other areas with the similar characteristics, such as uneven density population or poor data availability.

Author Contributions

Conceptualisation, methodology, and formal analysis, M.P., A.S., M.M., A.D.; investigation, resources, and data curation, M.P., M.M.; software, M.M.; writing—original draft preparation, writing—review and editing, and visualisation, M.P., A.S.; supervision, project administration and funding acquisition, A.D. All authors have read and agreed to the published version of the manuscript.

Funding

This research was funded by Regione Autonoma della Sardegna (Fondo sviluppo e coesione 2014/2020. Linea d’Azione 1.5—Integrazione della mobilità elettrica con le Smart City).

Conflicts of Interest

The authors declare no conflict of interest.

References

  1. Rodrigue, J.-P.; Comtois, C.; Slack, B. The Geography of Transport Systems, 3rd ed.; Routledge: London, UK, 2013; ISBN 978-0-415-82253-4. [Google Scholar]
  2. Saidi, S.; Hammami, S. Modeling the causal linkages between transport, economic growth and environmental degradation for 75 countries. Transp. Res. Part Transp. Environ. 2017, 53, 415–427. [Google Scholar] [CrossRef]
  3. Gherghina, Ş.C.; Onofrei, M.; Vintilă, G.; Armeanu, D.Ş. Empirical Evidence from EU-28 Countries on Resilient Transport Infrastructure Systems and Sustainable Economic Growth. Sustainability 2018, 10, 2900. [Google Scholar] [CrossRef] [Green Version]
  4. IEA Sankey Diagram. Available online: https://www.iea.org/Sankey (accessed on 16 April 2018).
  5. International Energy Agency (IEA). Global EV Outlook 2017; IEA: Paris, France, 2017; p. 71. [Google Scholar]
  6. Energy & Strategy Group. E-Mobility Report; Politecnico di Milano: Milan, Italy, 2017. [Google Scholar]
  7. Globisch, J.; Plötz, P.; Dütschke, E.; Wietschel, M. Consumer preferences for public charging infrastructure for electric vehicles. Transp. Policy 2019, 81, 54–63. [Google Scholar] [CrossRef]
  8. Palevičius, V.; Podviezko, A.; Sivilevičius, H.; Prentkovskis, O. Decision-Aiding Evaluation of Public Infrastructure for Electric Vehicles in Cities and Resorts of Lithuania. Sustainability 2018, 10, 904. [Google Scholar] [CrossRef] [Green Version]
  9. Wirges, J. Planning the Charging Infrastructure for Electric Vehicles in Cities and Regions; KIT Scientific Publishing: Karlsruhe, Germany, 2016. [Google Scholar]
  10. Dai, Y.; Liu, M. An electricity demand-based planning of electric vehicle charging infrastructure. Wuhan Univ. J. Nat. Sci. 2017, 22, 449–454. [Google Scholar] [CrossRef]
  11. Davidov, S.; Pantoš, M. Planning of electric vehicle infrastructure based on charging reliability and quality of service. Energy 2017, 118, 1156–1167. [Google Scholar] [CrossRef]
  12. Akbari, M.; Brenna, M.; Longo, M. Optimal Locating of Electric Vehicle Charging Stations by Application of Genetic Algorithm. Sustainability 2018, 10, 1076. [Google Scholar] [CrossRef] [Green Version]
  13. Dong, J.; Liu, C.; Lin, Z. Charging infrastructure planning for promoting battery electric vehicles: An activity-based approach using multiday travel data. Transp. Res. Part C Emerg. Technol. 2014, 38, 44–55. [Google Scholar] [CrossRef] [Green Version]
  14. González, J.; Alvaro, R.; Gamallo, C.; Fuentes, M.; Fraile-Ardanuy, J.; Knapen, L.; Janssens, D. Determining Electric Vehicle Charging Point Locations Considering Drivers’ Daily Activities. Procedia Comput. Sci. 2014, 32, 647–654. [Google Scholar] [CrossRef] [Green Version]
  15. Zhao, S.Q.; Li, Z.W. The Optimization Model of Planning Electric Vehicle Charging Station. Appl. Mech. Mater. 2014, 672–674, 1183–1188. [Google Scholar] [CrossRef]
  16. Wood, E.; Rames, C.; Muratori, M.; Raghavan, S.; Melaina, M. National Plug-In Electric Vehicle Infrastructure Analysis; National Renewable Energy Lab: Golden, CO, USA, 2017; p. 74. [Google Scholar]
  17. Wood, E.; Raghavan, S.; Rames, C.; Eichman, J.; Melaina, M. Regional Charging Infrastructure for Plug-In Electric Vehicles: A Case Study of Massachusetts; National Renewable Energy Lab: Golden, CO, USA, 2017. [Google Scholar]
  18. Pagany, R.; Marquardt, A.; Zink, R. Electric Charging Demand Location Model—A User- and Destination-Based Locating Approach for Electric Vehicle Charging Stations. Sustainability 2019, 11, 2301. [Google Scholar] [CrossRef] [Green Version]
  19. De Gennaro, M.; Paffumi, E.; Martini, G. Customer-driven design of the recharge infrastructure and Vehicle-to-Grid in urban areas: A large-scale application for electric vehicles deployment. Energy 2015, 82, 294–311. [Google Scholar] [CrossRef]
  20. Csiszár, C.; Csonka, B.; Földes, D.; Wirth, E.; Lovas, T. Urban public charging station locating method for electric vehicles based on land use approach. J. Transp. Geogr. 2019, 74, 173–180. [Google Scholar] [CrossRef]
  21. National Research Council 2015 Overcoming Barriers to Deployment of Plug-in Electric Vehicles; National Academies Press: Washington, DC, USA, 2015; ISBN 978-0-309-37217-6.
  22. Porru, M.; Serpi, A.; Mureddu, M.; Damiano, A. A Combined Planning and Design Approach of a Public Charging Infrastructure for Electric Vehicles. In Proceedings of the IEEE Vehicle Power and Propulsion Conference (VPPC 2018), Chicago, IL, USA, 27–30 August 2018; p. 5. [Google Scholar]
  23. Istat.it. Available online: https://www.istat.it/en/ (accessed on 25 June 2018).
  24. OpenStreetMap. Available online: https://www.openstreetmap.org/ (accessed on 25 June 2018).
  25. Mureddu, M.; Scala, A.; Chessa, A.; Caldarelli, G.; Musio, M.; Damiano, A. An Agent Based Approach for the Development of EV fleet Charging Strategies in Smart Cities. In Proceedings of the 2nd IEEE International Electric Vehicle Conference (IEVC 2014), Florence, Italy, 17–19 December 2014; pp. 1–8. [Google Scholar]
  26. Mureddu, M.; Facchini, A.; Scala, A.; Caldarelli, G.; Damiano, A. A Complex Network Approach for the Estimation of the Energy Demand of Electric Mobility. Sci. Rep. 2018, 8, 268. [Google Scholar] [CrossRef] [PubMed] [Green Version]
  27. Ministero delle Infrastrutture e dei Trasporti. Piano Nazionale Infrastrutturale per la Ricarica dei Veicoli Alimentati ad Energia Elettrica (PNIRE) 2016; Ministero delle Infrastrutture e dei Trasporti: Rome, Italy, 2016.
  28. Regione Autonoma della Sardegna Prezzario dei Lavori Pubblici. Available online: https://www.regione.sardegna.it/j/v/572?s=1&v=9&c=4365&va=x&esp=1 (accessed on 22 March 2020).
Figure 1. The proposed Multistage Design Procedure (MSDP) workflow.
Sustainability 12 02889 g001
Figure 2. Flowchart of the macroscale planning stage of the proposed MSDP.
Sustainability 12 02889 g002
Figure 3. Road trips among Macrozones-of-Interest (MZoIs) and within them: for red-coloured MZoIs, only departures are highlighted; for blue-coloured MZoIs, only arrivals are highlighted. Circle and arrow line-terminals represent departure and destination, respectively. Square tessellation is for visualisation purposes only.
Sustainability 12 02889 g003
Figure 4. Flowchart of the microscale planning stage of the proposed MSDP.
Sustainability 12 02889 g004
Figure 5. A more detailed view of Figure 3 that highlights destination Microzones-of-Interest (µZoIs). Circle and arrow line-terminals represent departure and destination, respectively. Square tessellation is for visualisation purposes only.
Sustainability 12 02889 g005
Figure 6. Flowchart of the fine-scale design stage of the proposed MSDP.
Sustainability 12 02889 g006
Figure 7. Graphical representation of Set of Covered Areas (SCA).
Sustainability 12 02889 g007
Figure 8. The Sardinian municipalities (MZoIs) and the selected MZoI* (in blue).
Sustainability 12 02889 g008
Figure 9. The SCA achieved at the macroscale planning stage (y-axis is log-scaled).
Sustainability 12 02889 g009
Figure 10. Estimated charging instances (colour code) and CP distribution (symbol) in Nuoro (a), Oristano (b), Olbia (c), the Metropolitan Area of Sassari (MAS) (d) and the Metropolitan Area of Cagliari (MAC) (e). The yellow circles show the spatial coverage of each charging station (radius 500 m).
Sustainability 12 02889 g010aSustainability 12 02889 g010b
Figure 11. Graphical representation of SCA of Nuoro (a), Oristano (b), Olbia (c), MAS (d) and MAC (e).
Sustainability 12 02889 g011aSustainability 12 02889 g011b
Figure 12. Costs items in k€ (a) and in percent (b) of each MZoI* and for the overall project: the number of CPs for each power level is depicted in green lines in Figure 12 (a), while percent costs of Figure 12 (b) refer to the total MZoI* costs.
Sustainability 12 02889 g012
Table 1. Planned charging stations in the main MZoIs of Sardinia.
CityCharging Stations
(-)
Fast
CPs
(-)
Quick
CPs
(-)
Slow
CPs
(-)
Installed Power
(kW)
ISC
[%]
Nuoro2343828123291.7
Oristano2343430115885.7
Olbia2747027192989.4
MAS611012464367688.3
MAC14020284137826288.6
Total2744255028616,316-
Table 2. Detailed distribution of planned Charging Points (CPs) in MAC municipalities.
CityFast
CPs
(-)
Quick
CPs
(-)
Slow
CPs
(-)
Installed Power
(kW)
Assemini082190
Cagliari4120583246
Capoterra063159
Decimomannu063153
Elmas2125399
Maracalagonis02151
Monserrato066174
Pula283297
Quartu S.E.42815921
Quartucciu04088
Sarroch0209503
Selargius03818962
Sestu1127413
Settimo S. Pietro02151
Sinnai242202
Uta463353
Villa S. Pietro02151
Total202841378207
Table 3. Estimated project costs.
CityCharging Devices
k€
(%)
Electrical Works
k€
(%)
Street Works
k€
(%)
Connection Charge
k€
(%)
MZoI
Total k€
(%)
Nuoro255.4691.8817.6790.57455.58
(56.07)(20.17)(3.88)(19.88)(100.00)
Oristano251.0693.2918.4885.42448.27
(56.01)(20.81)(4.12)(19.06)(100.00)
Olbia325.1698.2026.72140.14590.23
(55.09)(16.64)(4.53)(23.74)(100.00)
MAS690.10206.6750.35269.301216.42
(56.73)(16.99)(4.14)(22.14)(100.00)
MAC1481.90436.72115.01607.102640.73
(56.12)(16.54)(4.36)(22.98)(100.00)
Total3003.68926.76228.241192.535351.21
(56.13)(17.32)(4.27)(22.28)(100.00)

