Article

Perception of Older Adults about Health-Related Functionality of Foods Compared with Other Age Groups

Department of Veterinary Forensics an Economics, University of Veterinary Medicine Budapest, 1078 Budapest, Hungary
*
Author to whom correspondence should be addressed.
Sustainability 2020, 12(7), 2748; https://doi.org/10.3390/su12072748
Submission received: 13 March 2020 / Revised: 26 March 2020 / Accepted: 28 March 2020 / Published: 1 April 2020
(This article belongs to the Special Issue Sustainability in Food Consumption and Food Security)

Abstract

:
The proportion of older adults in the population is significantly growing in the EU, therefore, wellbeing of the older population has become a social challenge. Functional foodstuffs are food products with nutritional composition that may reduce the risk of diet-related diseases or enhance physiological functions. Therefore, they could play an important role in prevention and mitigation of health-related problems, and in promotion of healthy ageing. The aim of this study is to present the impact of age on consumer preferences about functionality of foods, covering attitude aspects, nutrition claims, possible carriers, some particular health problems and expectations about sustainable production. The results are based on a representative quantitative survey. Findings highlight statistically significant (p < 0.05) differences in preferences of older adults compared to other age segments. They generally accept functional foods, especially when functionality is attached to increased vitamin, protein, and fiber content. Older adults also prefer products with lower salt and sugar content, which were less relevant for other age groups. Products of fruit and vegetable origin are distinguished as carriers of functional traits. Compared to other segments, older adults accept products of animal origin (especially milk products) and even breakfast products on a higher level. The paper provides details about particular health issues that could be addressed by functional foods based on actual consumer concerns.

1. Introduction

The relationship between health and nutrition has come to the forefront of scientific research due to global health trends and lifestyle changes. According to WHO data, chronic non-communicable diseases (CNDs) are the leading cause of death worldwide [1]. In 2016, they were responsible for 71% (41 million) of the 57 million deaths which occurred globally, and 94% of the number of deaths in Hungary. Major CNDs are cardiovascular diseases (44% of all CND deaths), cancers (22%), chronic respiratory diseases (9%), and diabetes (4%), all of which are strongly connected to dietary factors, among others [2]. Therefore, WHO formed a guideline for healthy diet to prevent chronic diseases worldwide, and national level health prevention programs also emerged [3,4,5]. Demographic statistics related to ageing shows that life expectancy (LE) and proportion of older adults in the population are increasingly growing both at global and EU level. Between 2000 and 2016, global LE at birth increased by 5.5 years, from 66.5 to 72.0 years [6]. In the EU, almost one fifth of the population (19.7%) was over the age of 65 in 2018, and the relative share of the population is projected to reach 28.5% until 2050 [7]. According to the latest country reports of the European Health & Life Expectancy Information System (EHLEIS) based on 2015 data, Hungarian LE was 18.2 years (21.2 for women and 17.9 for men) at the age 65 [8]. This index, compared to LE at birth, give better estimation to older adults, but do not give information about the quality of those years. The same report presents another indicator: the healthy life years (HLY, also called healthy life expectancy or disability-free life expectancy), which was 5.9 years in Hungary at the age 65, so 68% of elderly years (approximately 12 years) are usually spent with disabilities. LE at birth in Hungary was 75.7 years in 2015, which was nearly 5 years below the EU average, mainly due to higher death rates from cardiovascular diseases and cancer [9]. The same study highlights that only slightly more than half (56%) of Hungarians consider themselves to be in good health, which is one of the lowest rates in the EU. Besides new ways in the investigation of health-related issues [10,11,12], sustainability of food consumption (including food security) is also becoming an increasingly prominent topic for the scientific community [13,14,15,16]. Furthermore, the harmonization of a balanced and sustainable diet opened a new research regime [17].
Nowadays, a rising number of consumers follow a special or consciously composed diet because of health issues or lifestyle decisions, which have opened new opportunities for food business operators. During the last decades, a special focus was given to the health-related functionality of foodstuffs [18]. Functional foods with high added value have become the fastest growing area of the food industry, although the market share varies greatly from country to country, and there is not one generally accepted definition of functional foods in the industry, so different market data are available due to different interpretations of the category [18,19]. A study reviewed over one hundred different definitions to determine the boundaries of functional food better [20]. One even argued that functional foods might not be handled as a well-definable separate product category [21]. Although the definitions help scientific and professional dialogues, they do not have a particularly significant role from the perspective of consumers. Instead of legal definitions, consumers receive information about the functional properties of food through advertisements and labels. Regarding labels, nutrition and health claims in the EU may appear on products by following the indications of Regulation (EC) No. 1924/2006 [22] and Regulation (EU) 432/2012 [23] based on the scientific advice of the European Food Safety Authority (EFSA) [24,25].
The increasing importance of the functionality of foodstuffs was recognized even before the turn of the millennium by the food industry, which has accelerated the development of new products. However, new products had a high failure rate on the market in the 1990s, because most of them were not preceded by a deeper exploration of consumer needs [19,26]. Developing functional food is often a far more complex issue than introducing a new variation of generalized food products, which was realized by researchers and company experts in the 2000s. Many consumer-related studies emerged about functional foods from that time. The first consumer studies related to functional foods tried to explore the effect of socio-demographics factors [27,28,29], attitudinal profiles and motivations [21,30,31,32,33,34], and reactions connected to health and nutrition claims [35,36,37,38]. Based on the results of the studies that focused on the concept of functional foods in general, later studies targeted more specific product categories and novel concepts [39,40,41,42,43,44]. It also means that the focus shifted to market-related surveys and product development aspects.
The relatively few consumer-related articles, which focus on older European consumers, also follow a marketing approach, and they are connected to protein-enriched functional foods majorly [45,46,47]. In Eastern Europe, a Polish study, based on a nationwide representative consumer survey in 2009, found significant differences between age groups in functional food consumption, awareness, and perceived barriers to health improvement. Qualitative consumer studies that support the food product development for older adults have also been published [48,49]. In Hungary, however, a few consumer studies have recently emerged on the relationship between health and food consumption [50,51,52], and the perspective of older adults on functional foods have not been analyzed yet.
Based on the previous findings, physical and psychological wellbeing of the older population has become a globally significant social challenge. The aim of this study is to give an overall picture about the impact of age on consumer expectations about the functionality of foods, which covers attitude, health-related lifestyle factors, nutrition claims, carriers, health problems, and known diseases as well. It was also an important goal of our study to investigate the most common sustainability markers used on food products.

2. Materials and Methods

The results of this study are based on a quantitative consumer survey conducted between 11 July and 14 August in 2018 with 1002 respondents. For data collection, personal sampling method was used with a questionnaire designed to be suitable for self-administered completion. Research was conducted at crowded traffic junctions in different Hungarian cities: Budapest, Dombóvár, Eger, Füzesabony, Győr, Kiskunfélegyháza, Miskolc, Siófok, Szeged, Székesfehérvár, Szolnok, and Veszprém. In terms of sex, age, and geographical distribution (NUTS-2) of the respondents, the sample is representative of the total adult population of Hungary, based on the latest census [53] at the time of the data collection (Table 1). To ensure representativeness, we employed quota sampling. During the research design, besides general socio-demographic characteristics, we aimed to collect data on some further particular conditions that may affect food consumption directly according to literature [29] (Table 2).
In the beginning of the interview, the respondents were informed about the aim of the research and the management of anonymous data. If the respondents were willing to participate, before the research questions were asked, the quota parameters (age, sex, geographical location) had been recorded, that allowed the quota numbers to be tracked by the interviewers to ensure an appropriate level of representability. Although the questionnaire was designed to be self-administered, interviewers provided help to fill the questionnaire, which was important in the case of older respondents.
The questionnaire contained 288 variables, from attitude-related questions through to nutritional claims and carrier foods to questions focusing on diseases. The questionnaire employed closed-form questions predominantly. Many questions were measured on five-point Likert scale, where grade 1 meant ‘‘strongly disagree’’ and grade 5 meant ‘‘strongly agree.’’ Table A1 in Appendix A shows the content of the questionnaire in terms of all variables used in this study.
Statistical analysis of the data was carried out by IBM SPSS Statistics 22.0 software package. Beyond descriptive analysis, Kruskal-Wallis test and Pearson’s chi-square test (CI: 95%) were used to analyze data on ordinal scale when the distribution of data did not meet the criteria for normal distribution [54]. Factor analysis (principal component analysis—PCA) was used to explore overlaps and to combine correlated variables [55].

3. Results

3.1. Attitudes and Lifestyle Factors toward Nutrition

At the beginning of the survey, attitude-related 1–5 Likert questions were listed in order to characterize different age groups based on their opinion about health and age-related aspects of nutrition (Table 3).
According to the results, each age group perceived strong connection between nutrition and health. While all age groups agreed that “healthy diet has a great impact on the prevention of diseases in older adults,” the oldest group attached significantly more importance to “for older adults, diet has a more important role in health” compared to other age groups. The importance of a healthy diet increases with age according to the responses.
The questionnaire also contained lifestyle-related multiple choice questions, which allowed further differentiation of age groups (Table 4).
Significant difference between age groups was not found in terms of self-estimation of health, the need for weight loss, use of dietary supplements, and alcohol consumption habits. Younger respondents exercise more often, although they still tend to think it is below the required level. Stressful lifestyle and not enough sleep are the most common problems reported by the middle-aged groups. Older adults rarely smoke and this group has significantly more time to eat and cook than the younger respondents. Consumers between 30 and 39 years and over 60 years state that they pay more attention to diet compared to the average.

3.2. Nutrition Claims

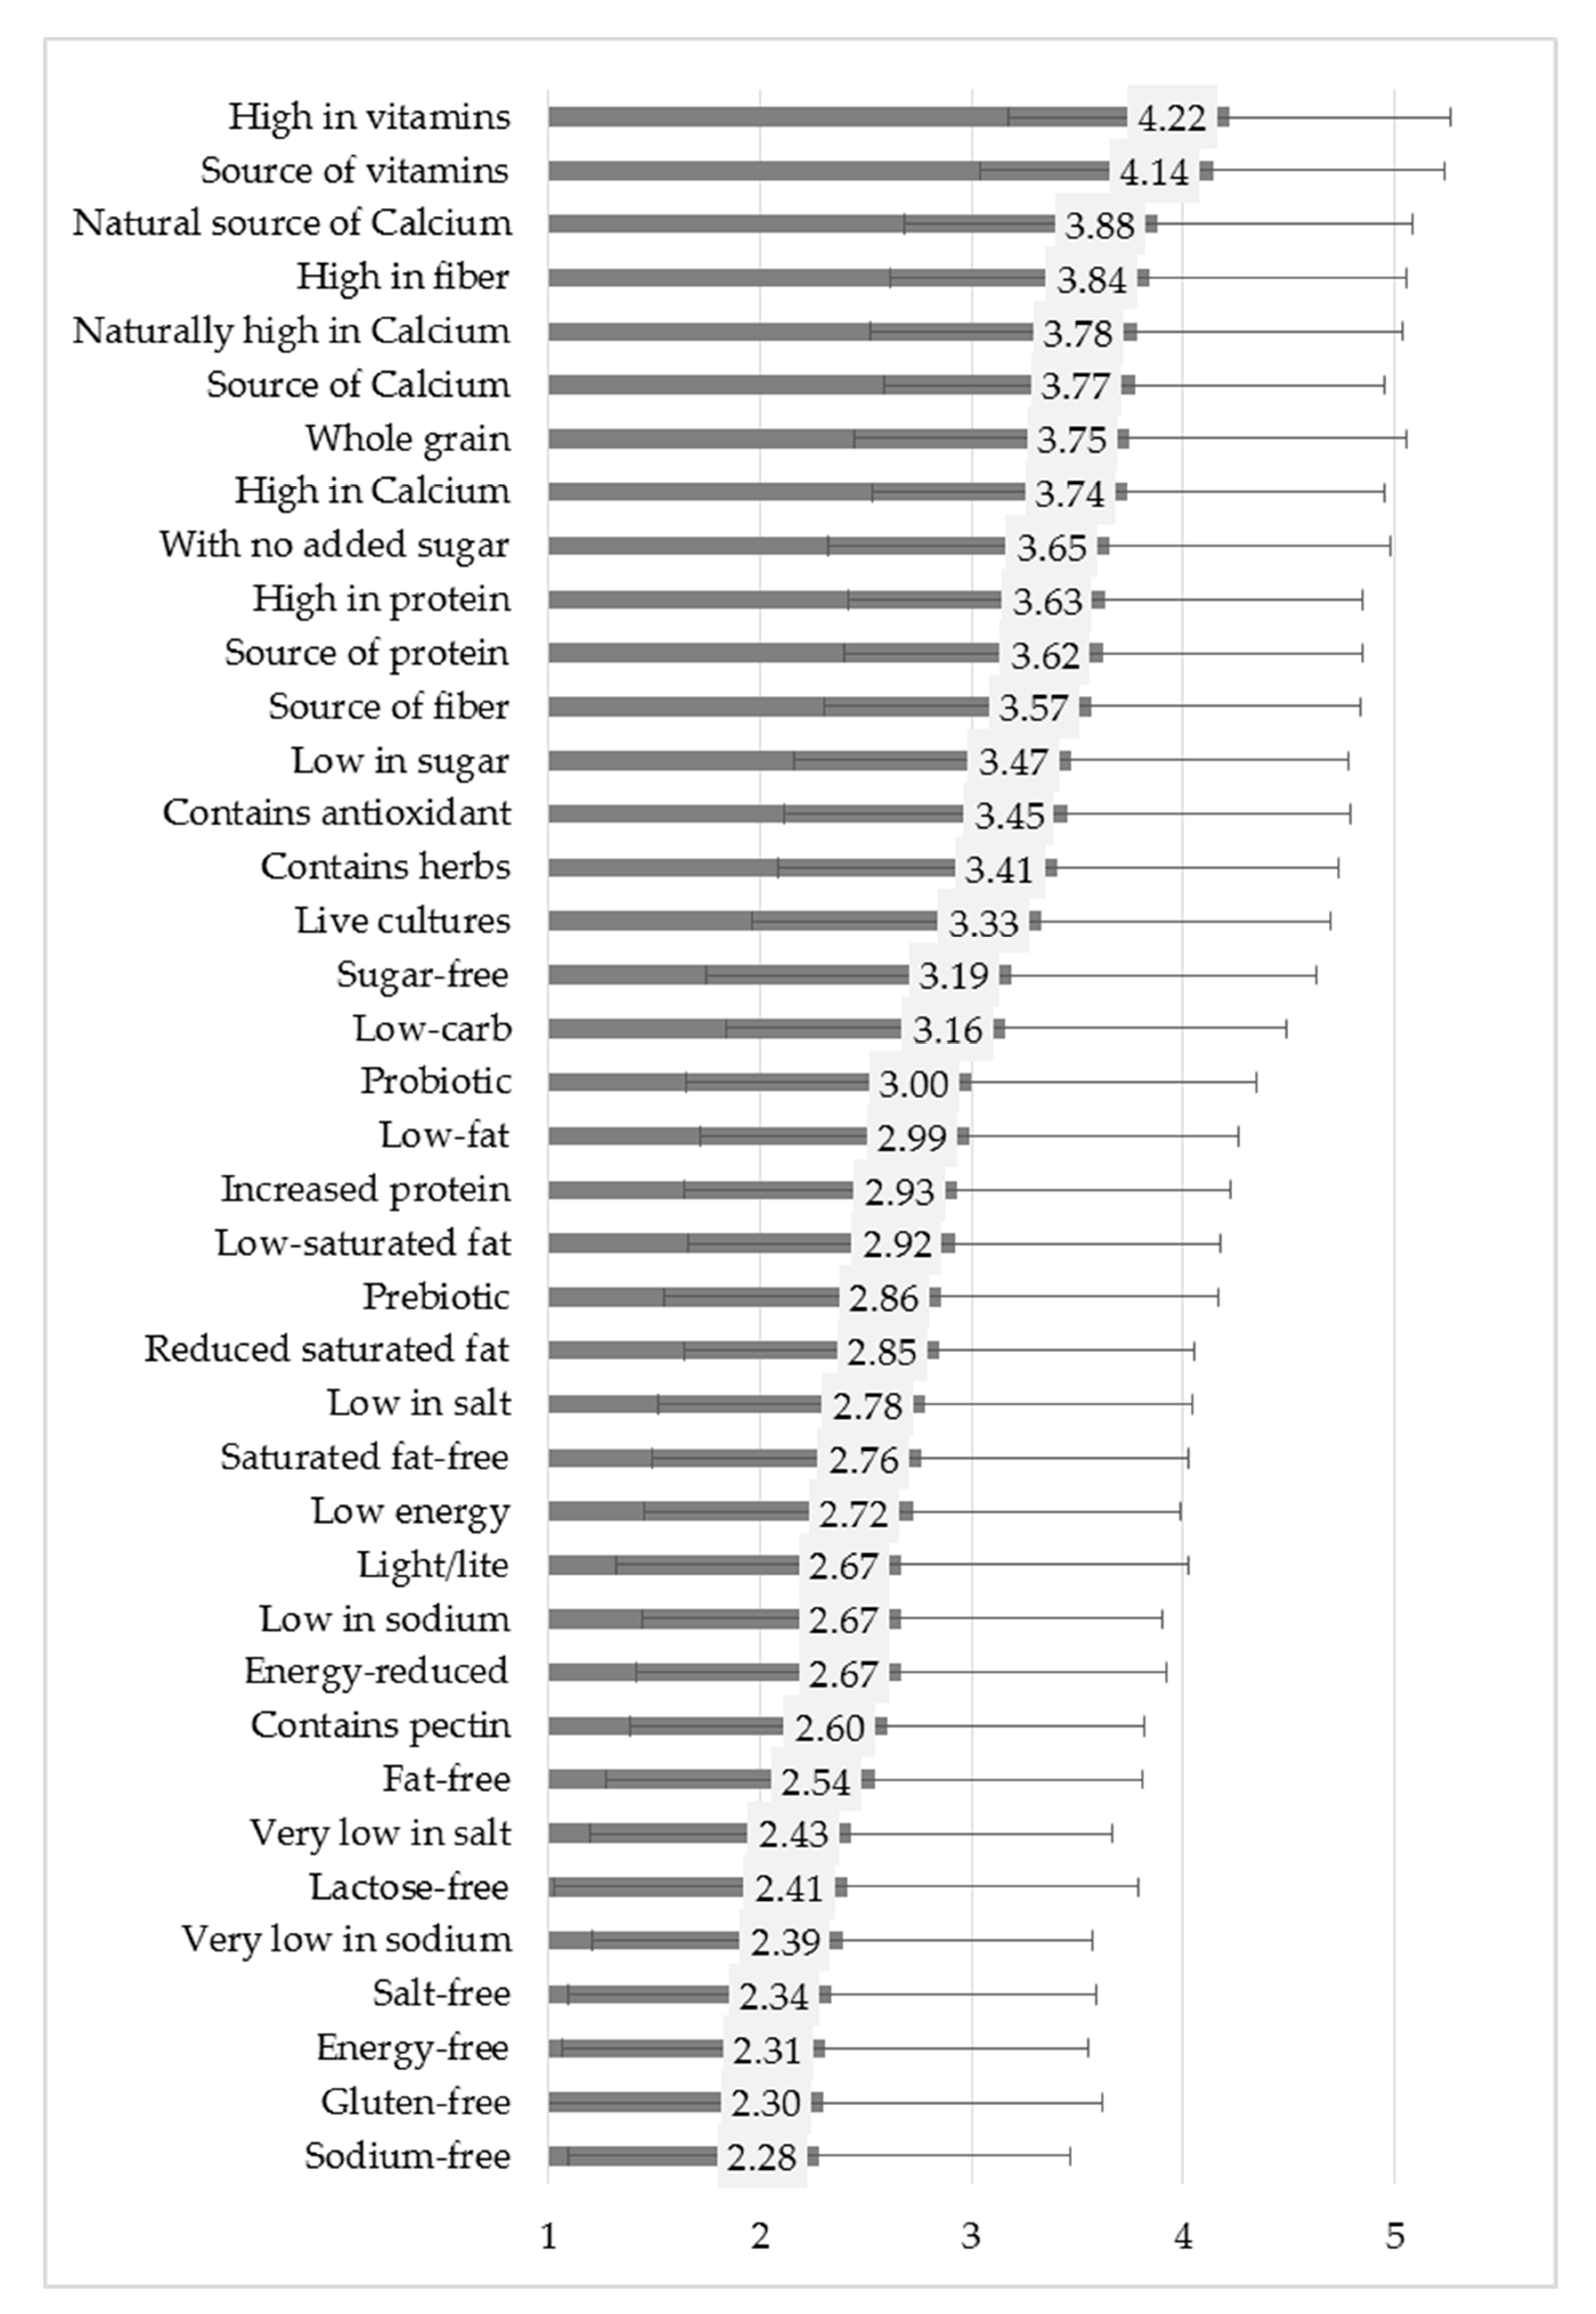
The questionnaire contained 39 nutrition claims in total, covering all options listed by the Regulation (EC) No. 1924/2006. In some cases, claims were presented through an example, such as “source of calcium,” while others used a generalized form, for instance, “source of vitamins.” EU and national level food law allow the use of the terms salt and sodium as synonyms in labelling, so both terms were included in the questionnaire. Besides the claims listed in the regulation, some other elements were also included (for example, prebiotic, contains antioxidants, etc.). Respondents expressed their opinion on 1–5 Likert scale about their preference of the listed nutrition claims shown in Figure 1. For better interpretation, PCA was used to reduce 39 items to 8 well-distinguishable nutrition claim categories (Table 5). As expected on the basis of previous relevant studies, the created categories highlighted that consumers did not perceive significant differences between multiple level claims [40,56]. Accordingly, the categories give a robust representation for multiple level claim groups (for instance, with no added sugar, low in sugar, sugar-free, within the factor named sugar).
In general, nutrition claims related to vitamins and minerals received the highest preference scores. Protein, fiber and sugar content also seem to be important for the respondents. Claims related to fat content, energy, and salt can typically be found in the middle section of the list. PCA analysis clearly indicated a group constituted by those claims that are not listed in the Regulation (EC) No. 1924/2006 (Table 5). Lactose-free and gluten-free are at the bottom of the list. In terms of salt and sodium, the former one is more preferred by the consumers, although both terms indicate the same nutritional element (Figure 1).
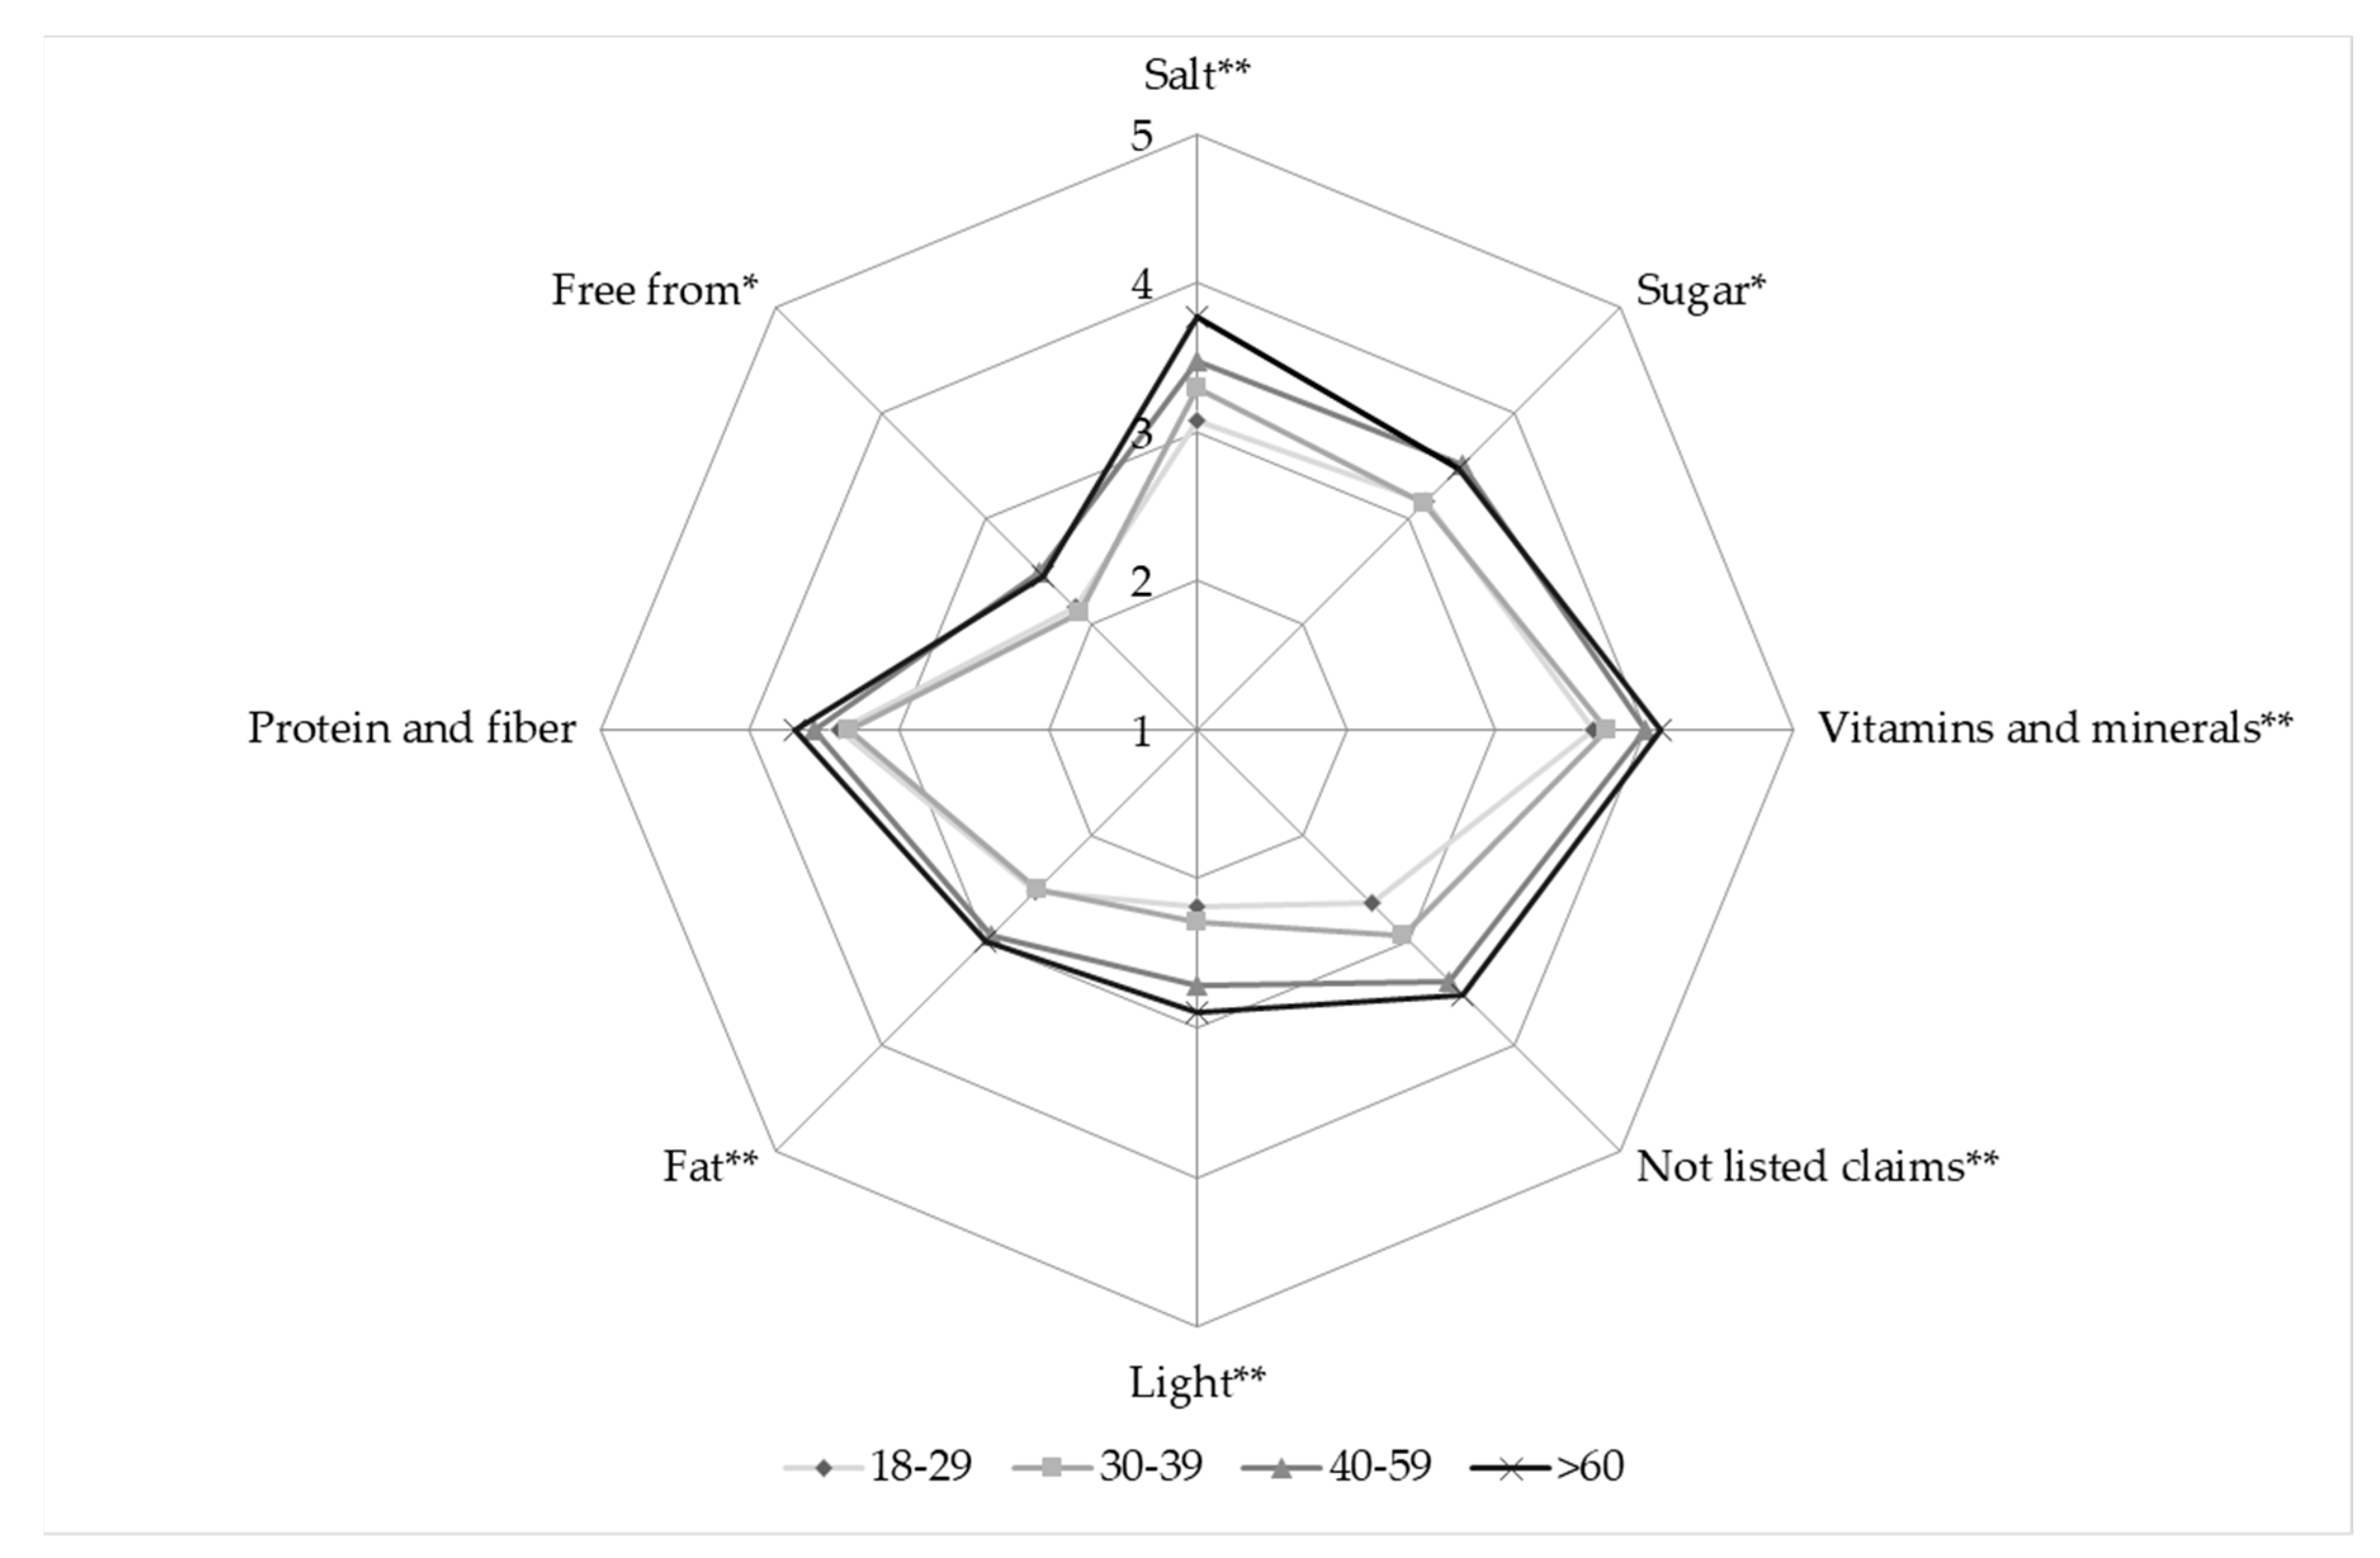
Figure 2 shows the differences between age groups in regard to the nutrition claims categories composed with PCA.
Differences between preferences of age groups are significant in all cases, except nutrition claims related to protein and fiber. Respondents over 60 years typically have stronger preference of the listed claims than the younger age groups. The most significant difference was found in the case of salt- related claims.

3.3. Carrier Foods

Previous studies highlighted the importance of the type of carrier food products regarding acceptance of health benefits by consumers [30,40,57,58]. During data collection, respondents could express their health-related preference about 25 types of foods on 1-5 Likert scale (Figure 3). Table 6 shows the 5 carrier categories composed by PCA.
Eating fruits and vegetables is the best way for keeping a healthy diet according to the respondents. “Fruits and vegetables” form an independent group by PCA, which contains processed products and mushrooms, too. The following categories are “meat, fish, and egg,” “natural products,” and “dairy products.” “Natural products” is a heterogeneous group compared to the others. It contains juice; honey; tea; nuts and other oily seeds, muesli; and herbal products. “Breakfast products,” namely fruit jam, bakery products, and margarine are at the end of the preference list.
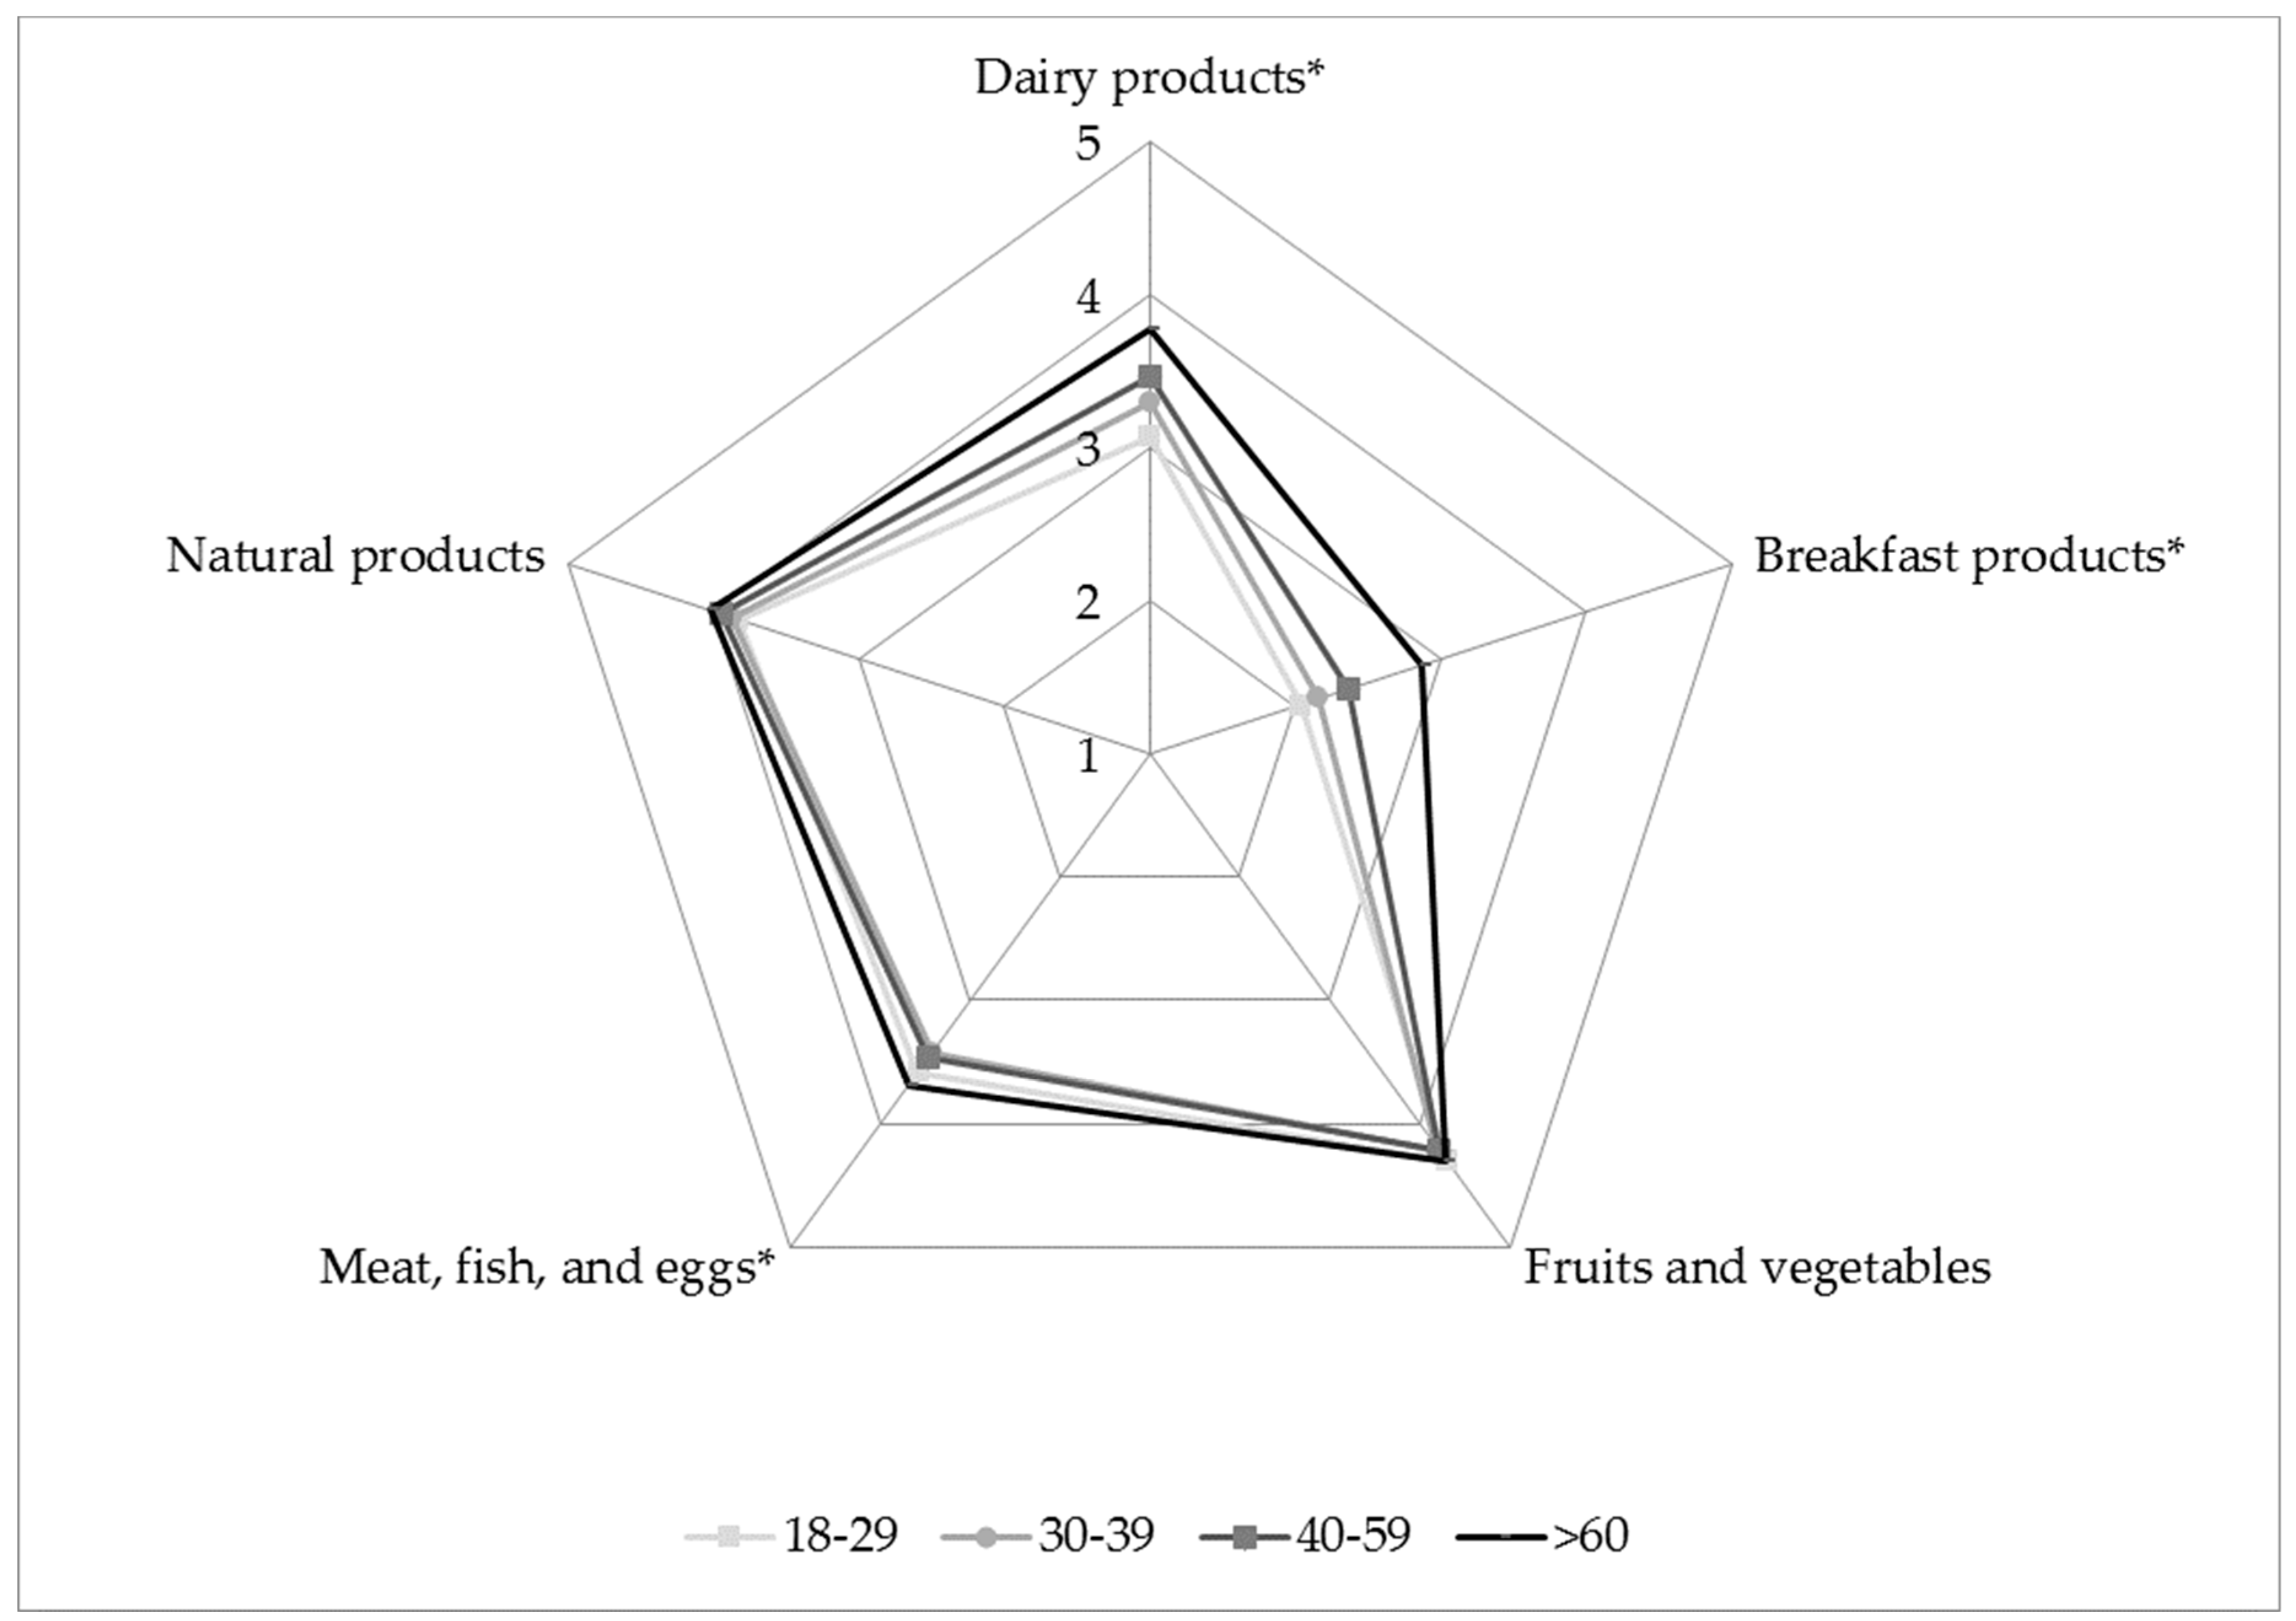
Figure 4 shows the differences between age groups connected to carrier categories composed with PCA.
Differences between preferences of age groups are significant in cases of “dairy products,” “breakfast products,” and “meat, fish, and eggs.” “Fruits and vegetables” and “natural products” are fairly important for all age groups. Older adults preferred “dairy products” and “breakfast products” to a greater extent than others.

3.4. Health problems and acceptance of functional foods

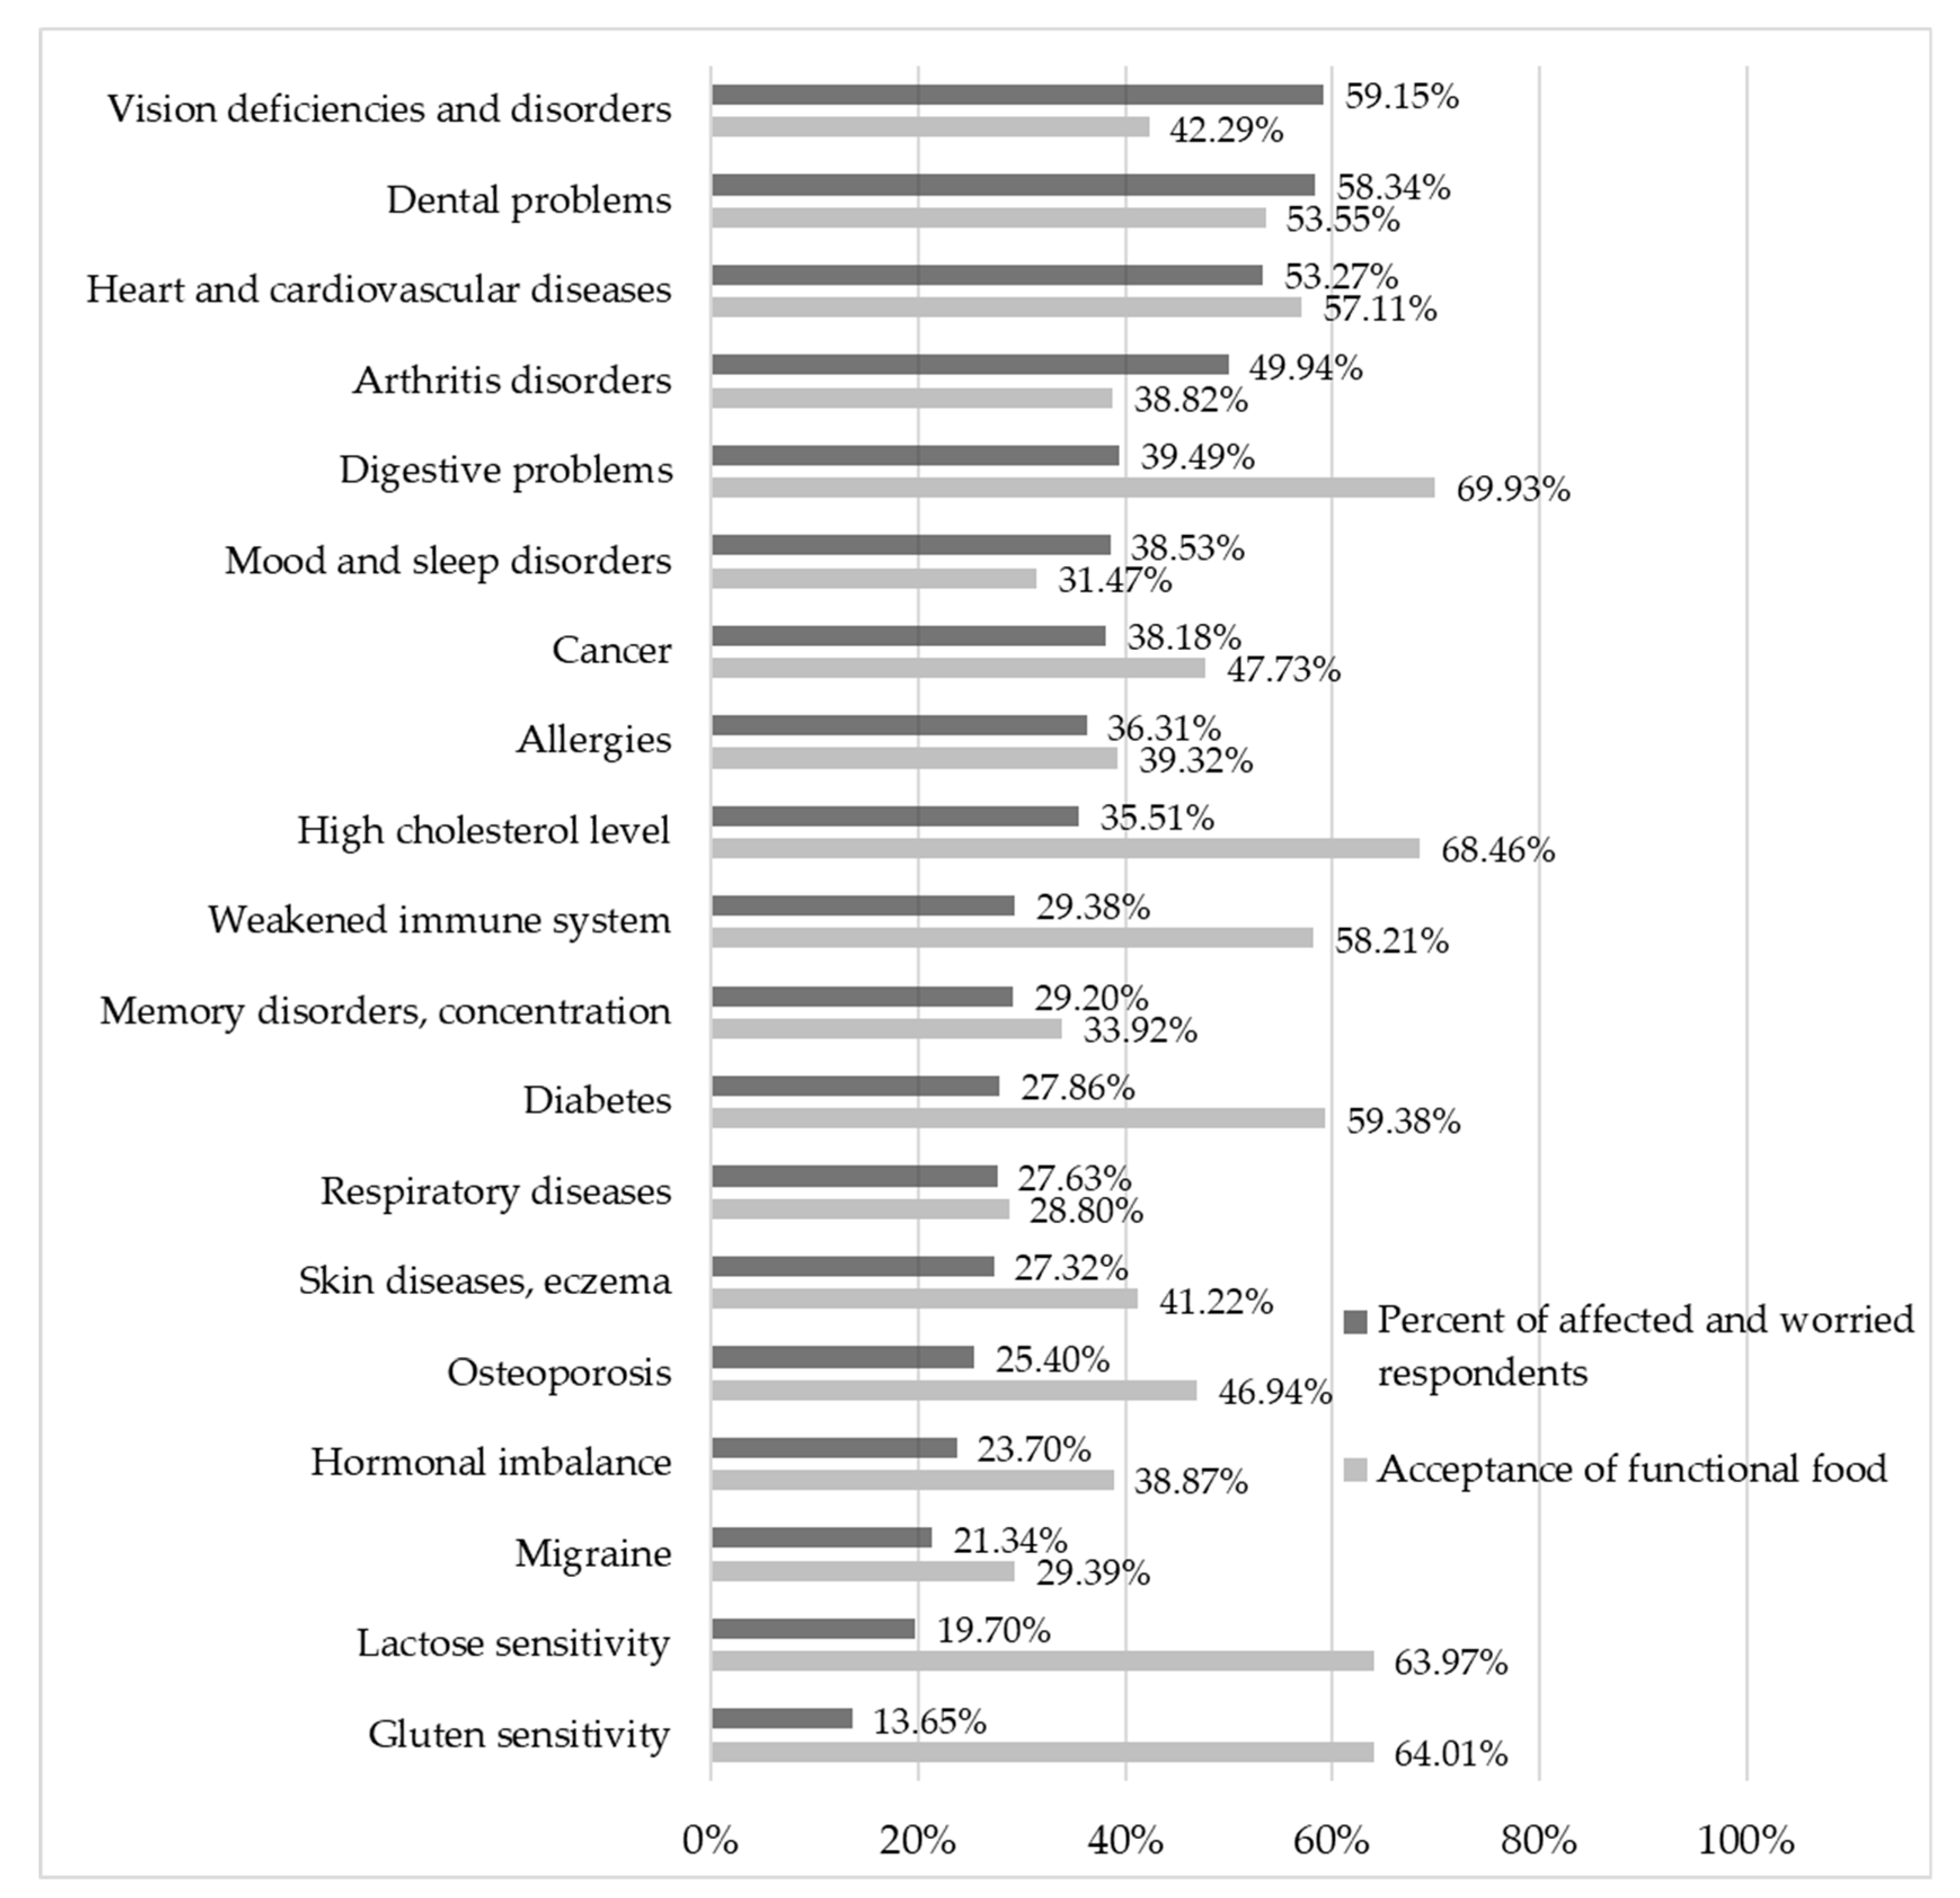
The main health problems people are most affected by and worried about compared to the acceptance of mitigation and prevention with functional foods are shown in Figure 5.
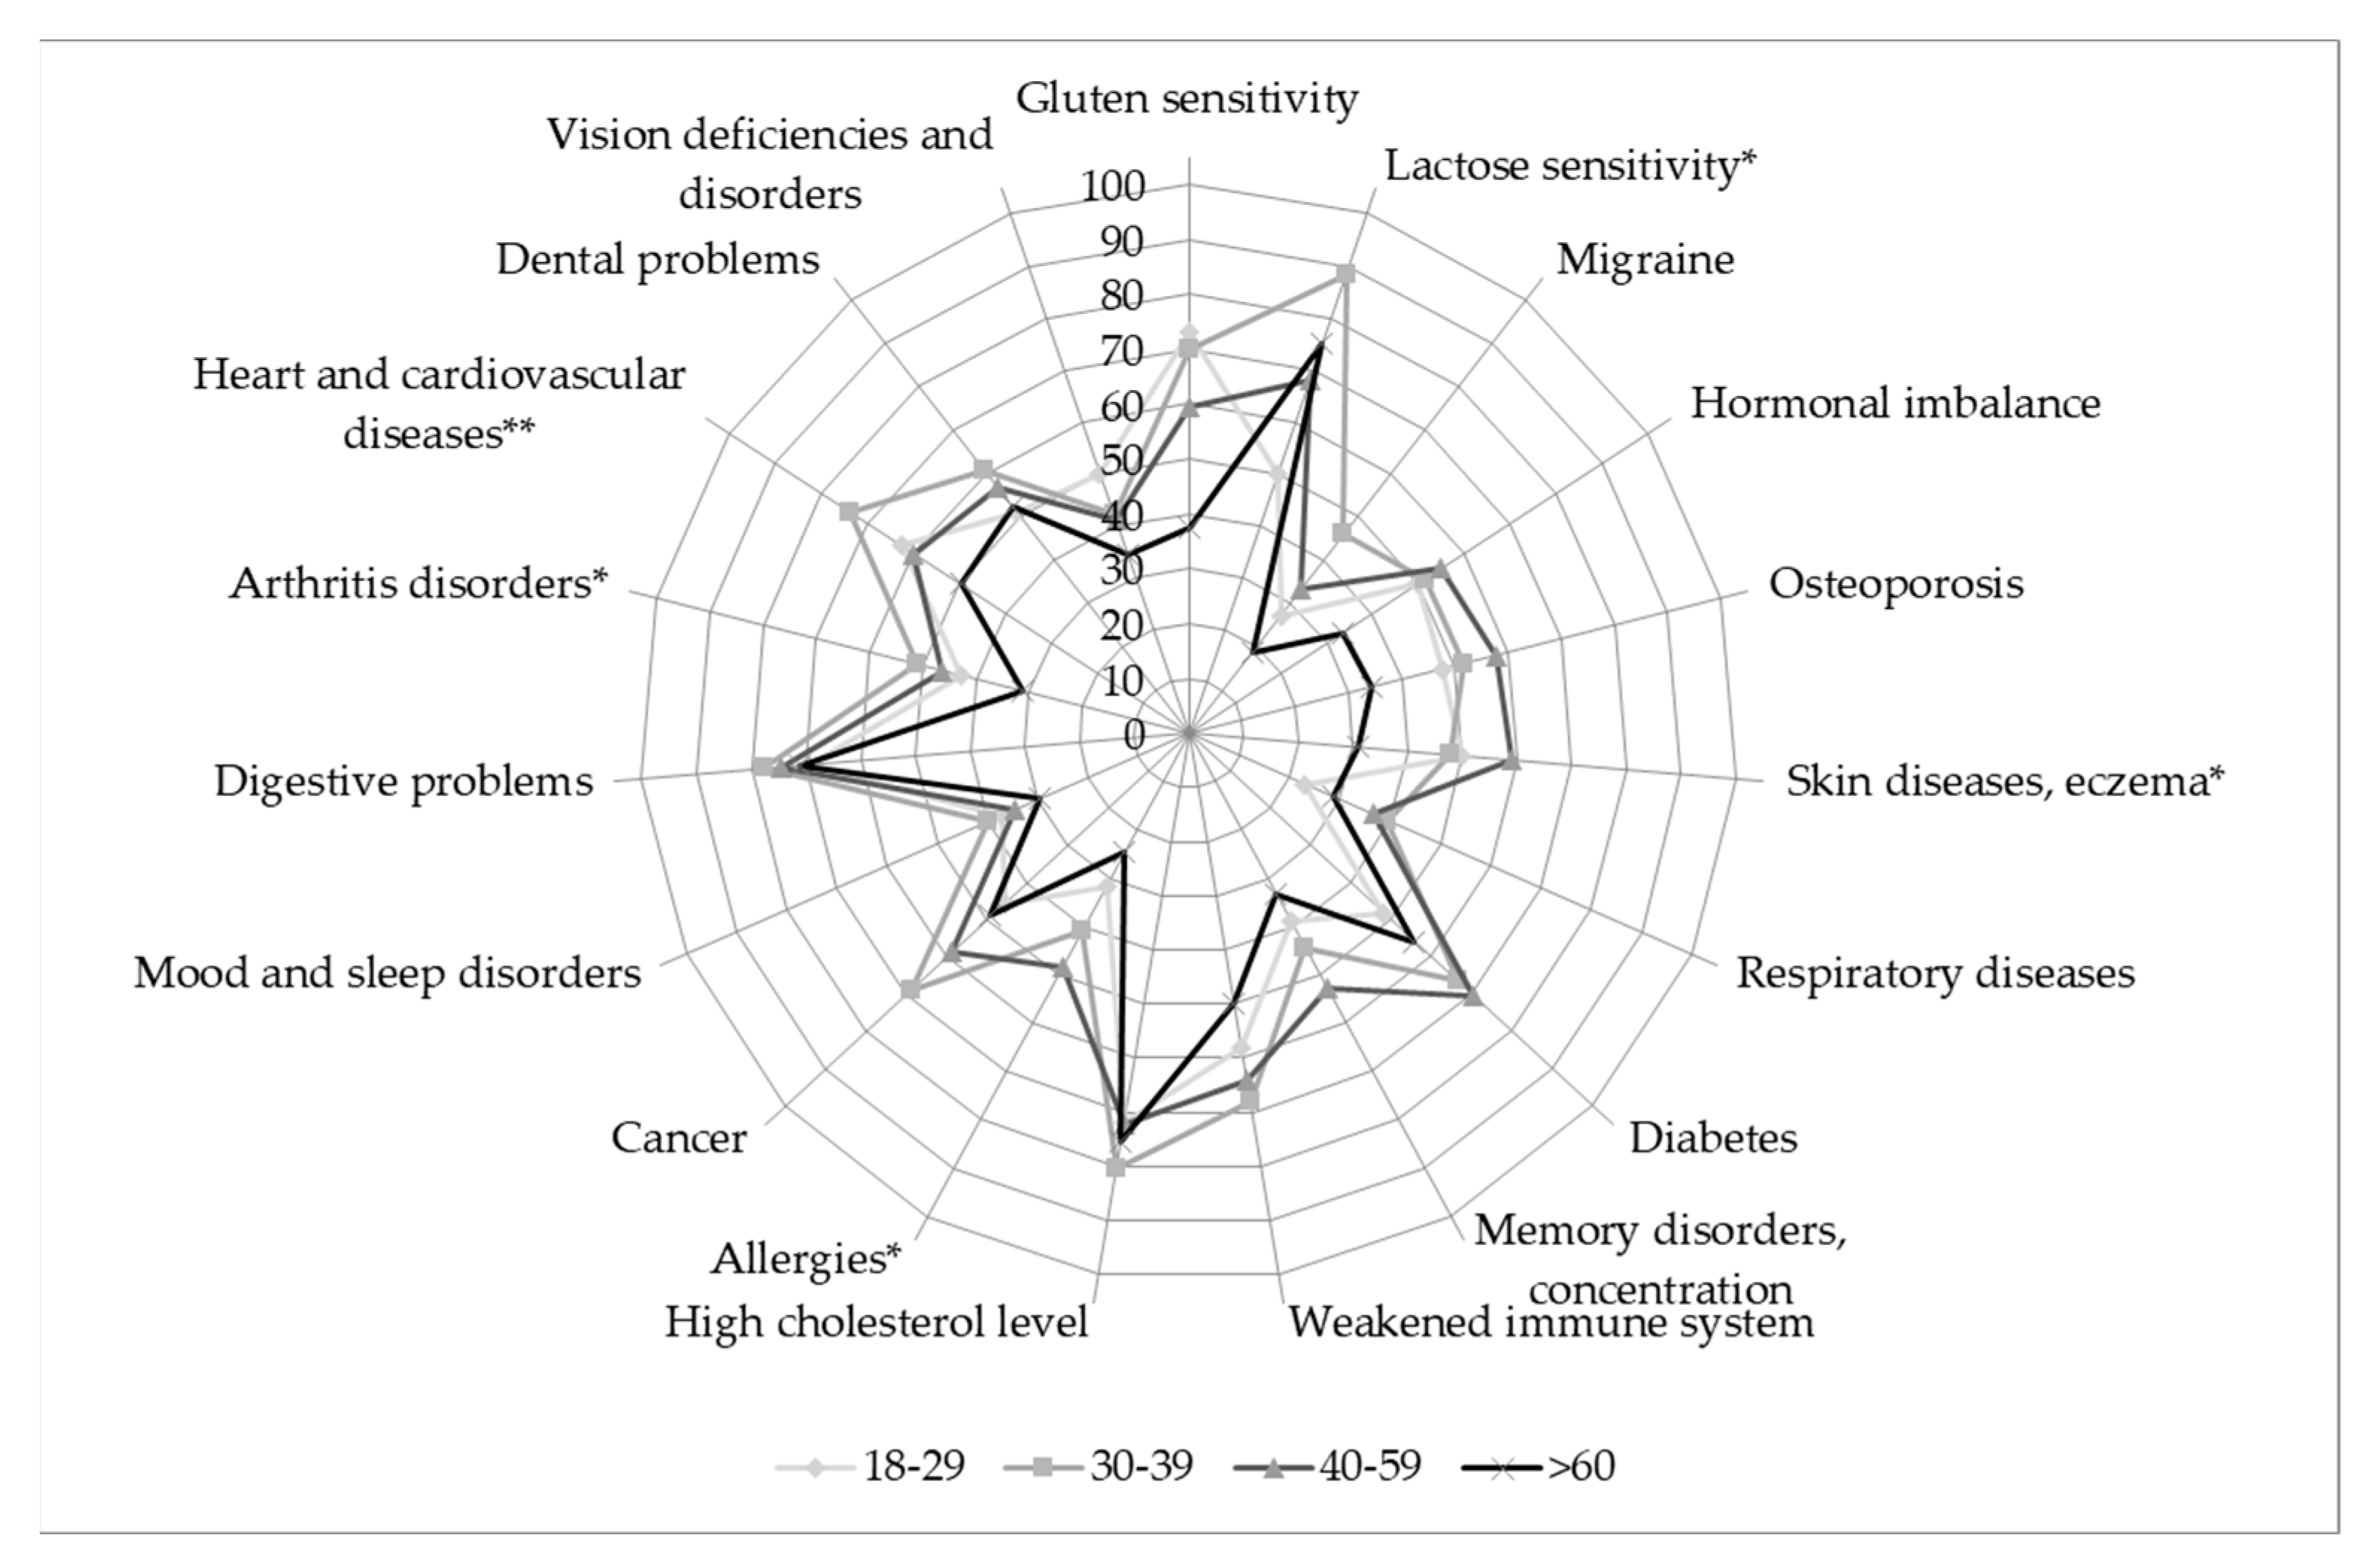
According to the results, the Hungarian population is mainly concerned/worried about the following health problems: vision deficiencies and disorders, dental problems, and heart and cardiovascular diseases. Results also highlight that diets containing functional foods for the mitigation and prevention of health problems are mainly related to digestive problems, high cholesterol level, lactose sensitivity, and gluten sensitivity according to the opinion of the respondents.
In the case of several health problems, the age of respondents has been a significant factor, shown in Table 7.
In the vast majority of cases where significant differences were detected, older adults are more affected or worried about the certain health problems. The only exception is migraine, which worries and affects younger people more.
Figure 6 shows the proportion of affected/worried consumers in the age groups, who would accept food as a solution to prevent and/or mitigate the particular health problem.
Among the affected/worried consumers, significant differences were detected between age groups in the case of heart and cardiovascular diseases, arthritis disorders, allergies, skin diseases and eczema, and lactose sensitivity. In the majority of these cases, older adults are characterized by a lower level of acceptance than the younger ones. In general, affected young adults and middle-aged adults show the highest level of acceptance of functional food products: younger adults particularly accept these in case of heart and cardiovascular diseases, and lactose sensitivity, while middle-aged adults would prefer functional food to prevent/mitigate the effect of skin diseases and eczema and allergies.

3.5. Sustainability Factors

In the context of functional food preferences, the possible value-added characteristics of certain sustainability factors were also analyzed. It gives an opportunity to identify further consumer expectations about “healthy” food products. Results about consumer perceptions are presented in Table 8.
According to the preference of the consumers, domestic origin is the most prominent aspect, followed by small-scale production and animal welfare considerations. Except in the case of animal welfare, differences between age groups were proven to be significant by using a confidence interval of 95%. All listed sustainability factors were more preferred by consumers over the age of 60, which indicates that the combination of sustainability labels (especially in regard to domestic origin) and health and nutrition claims on the package could bear a recognized value for senior conscious consumers.

4. Discussion

This paper aims to give an overall picture on the impact of age on consumer expectations about the functionality of foods based on a nationwide representative consumer survey. Besides a description of significant differences between age groups about health-related attitudes and lifestyle factors, our study analyzes the most important aspects of functionality of foods through quantification of consumer expectations and preferences.
A special focus was placed on older consumers in the analysis. The importance of the wellbeing of older adults is increasing, as their social representation grows. While there is a big variety of functional foodstuffs on the market already, their contribution to disability-free life years also depends on consumer choice. The combination of functional foods with scientifically proven health and nutrition claims and appropriate consumer perception would deliver significant social benefits.
Thirty-eight nutrition claims and 25 carrier food types were categorized with PCA to identify the most prominent decision points of older adults compared to other age groups. Respondents expressed their involvement and concerns about 19 health problems, and also gave their opinion about the appropriateness of food as a solution to prevent and/or mitigate the particular health problem. Our study also investigated the preference of the most common sustainability markers for functional foods.
Significant differences were found between age groups in consumer preferences about the functionality of foods. Results are harmonizing with previous studies, which pointed out that older adults have a more positive attitude toward functionality of foods in general [33,59,60,61].
“Vitamins and minerals,” “protein and fiber,” and claims related to sugar content were found to be the most preferred nutrition claims. Differences between preferences of age groups were significant in all cases, except nutrition claims related to protein and fiber. Respondents over 60 years typically prefer the listed claims more than younger age groups. The most important significant difference was found about salt-related claims. A recent Italian study with similar methodology also identified significant differences between age groups in regard to the preference of nutrition claims, and found similarly that claims related to vitamins are the most preferred ones by the consumers [62]. The same study found a lower level of preference about salt-related claims, which can be explained by country differences described in previous cross-country research [36]. Moreover, previous studies indicated a connection between health status and the importance people attach to nutrition and health claims [33,35]. In this case, it is important to mention that the proportion of death caused by cardiovascular diseases—where the reduction of salt intake would be one of the most important dietetic factors—is four times higher in Hungary than in Italy [63].
Based on the opinion of respondents, the following food categories are the most suitable for a healthy diet: “fruits and vegetables,” “meat, fish, and egg,” “natural products,” (e.g., juices, tea, honey), and “dairy products.” Older adults preferred the “dairy products” and “breakfast products” significantly more than the younger respondents. Related studies mostly analyzed carrier food products combined with some particular claims that contributed for product development in a more direct manner [30,40,57,58]. These studies concluded that the type of the carrier had a greater effect on the acceptance of health benefits by consumers than the type of claim. Furthermore, consumers showed higher acceptance toward the functionality of foods, where the functional ingredient was inherently contained to some extent [30,40].
A Dutch study, which analyzed health claims, pointed out that health claims related to physiological health problems (e.g., heart and cardiovascular diseases, osteoporosis, cancer) are of greater importance among such claims stated on the labels of foodstuffs than those related to psychological problems (e.g., stress, fatigue), which are in line with our results [35]. A recent Hungarian study which examined the effect of socio-demographic factors in the case of functional foods also highlighted the importance of age regarding to health problems [50]. Our results indicate that the Hungarian population is mainly concerned about the following health problems: vision deficiencies and disorders, dental problems, and heart and cardiovascular diseases. According to the respondents, functional foods are most suitable for the mitigation and prevention of digestive problems, high cholesterol level, lactose sensitivity, and gluten sensitivity. In the vast majority of cases where significant differences are detected, older adults are more affected or worried about health problems. After filtering the sample only for the affected/worried consumers, less significant differences between age groups were detected. Where significant differences were found, younger and middle-aged adults are more likely to accept food as a solution to prevent and/or mitigate the particular health problem.
In terms of key health-related sustainability factors of food products, domestic origin played the most important role, followed by small-scale production and animal welfare, which are in line with previous studies [64]. Animal welfare was the only factor found to be universally appreciated, while other factors are preferred by the older adults to a higher extent.
The results of this quantitative study highlighted the importance of considering the wellbeing of older adults during product development. The investigation proven that significant differences in attitudes and preferences do exist and might be used for product differentiation. The paper contains a detailed data set about possible carrier food and functionality combinations that might be used for subsequent academic studies and for field experts as well. However, it is important to consider country-level differences that might be reflected in the preference of carrier food and functionality combinations. In this survey, we have collected a representative sample of the Hungarian population that served the purpose of demographical comparison well, and was also able to deliver some health status specific results according to the most frequent problems. This investigation was limited to respondents in relatively good health conditions, due to the methodology of data collection, which was performed at crowded traffic junctions. To reach older adults who are affected by serious health problems, investigations must be expanded to retirement homes and hospitals. However, during our research, the main focus was on disability-free life years, which required the answers of persons with seemingly normal health conditions. The research was conducted in summer, and seasonality may effect consumer preference on foodstuffs—especially in terms of locally produced fruits and vegetables—according to certain studies [65]. However, questions were aimed to measure general attitudes. Additionally, seasonality tends to be less important in the last decades, especially in the urbanized population of economically developed countries.
This explorative study can be used as a basis for a subsequent research focusing on the ageing consumers to provide an in-depth insight into their food consumption behavior and perception of the link between nutrition and health. It must be considered for further research that a larger sample size of older adults would allow the use of sophisticated multivariate statistics methods, such as cluster analysis and structural equation modelling. By this investigation, further segmentation could be conducted to identify possible gaps in education, availability of expected health-promoting products and innovation areas. This research can also reveal behavioral reasons behind health-related food consumption habits of older adults, which, besides fostering product development, could lay the foundations of social and health-related policy actions as well.

Author Contributions

D.S. and G.K. conceived and designed the experiments; D.S. analyzed the data; D.S., L.Ó. and G.K. contributed to conceptualization and writing the paper. All authors have read and agreed to the published version of the manuscript.

Funding

The Project was supported by the European Union and co-financed by the European Social Fund: (1) EFOP-3.6.1-16-2016-00024 ‘Innovations for Intelligent Specialization on the University of Veterinary Science and the Faculty of Agricultural and Food Sciences of the Széchenyi István University Cooperation’; (2) EFOP-3.6.2-16-2017-00012 ‘Development of a product chain model for functional, healthy and safe foods from farm to fork based on a thematic research network’; and (3) EFOP-3.6.3-VEKOP-16-2017-00005 ‘Strengthening the scientific replacement by supporting the academic workshops and programs of students, developing a mentoring process’.

Conflicts of Interest

The authors declare no conflicts of interest.

Appendix A

Table A1. Summary of the questionnaire for all variables used in this study.
QuestionsSet of ValuesListed Variables
To what extent do you agree with the following statements?1-5 Likert scaleAttitude factors presented in Table 3
Which of the following lifestyle statements are relevant for you?Multiple choiceLifestyle factors presented in Table 4
To which extent do you prefer the following nutrition claims while shopping?1-5 Likert scaleNutrition claims presented in Figure 1
How much do you think the consumption of the following foods contribute to your health?1-5 Likert scaleCarrier foods presented in Figure 3
How important is it for you that a "healthy food" has the following properties?1-5 Likert scaleSustainability factors presented in Table 8
Which health problems do you worry about?Not concerned/
Concerned
Health-related problems presented in Figure 5
Would you choose “healthier foods” to prevent or mitigate the following health problems?Yes/No
Socio-demographic parameters presented in Table 1 and Table 2.

References

  1. World Health Organization. Noncommunicable Diseases Country Profiles 2018. Available online: https://www.who.int/nmh/publications/ncd-profiles-2018/en/ (accessed on 18 February 2020).
  2. World Health Organization Global Health Estimates 2016: Death by Cause, Age, Sex, by Country and by Region, 2000–2016. Geneva. Available online: https://www.who.int/healthinfo/global_burden_disease/estimates/en/index1.html (accessed on 18 February 2020).
  3. World Health Organization Diet, Nutrition, and the Prevention of Chronic Diseases: Report of a Joint WHO/FAO Expert Consultation. Available online: https://www.who.int/dietphysicalactivity/publications/trs916/en/ (accessed on 18 February 2020).
  4. Jankovic, N.; Geelen, A.; Streppel, M.T.; de Groot, L.C.P.G.M.; Orfanos, P.; van den Hooven, E.H.; Pikhart, H.; Boffetta, P.; Trichopoulou, A.; Bobak, M.; et al. Adherence to a Healthy Diet According to the World Health Organization Guidelines and All-Cause Mortality in Elderly Adults From Europe and the United States. Am. J. Epidemiol. 2014, 180, 978–988. [Google Scholar] [CrossRef] [PubMed]
  5. Kiss, A.; Popp, J.; Oláh, J.; Lakner, Z. The Reform of School Catering in Hungary: Anatomy of a Health-Education Attempt. Nutrients 2019, 11, 716. [Google Scholar] [CrossRef] [PubMed] [Green Version]
  6. World Health Organization. World health statistics 2019: Monitoring Health for the SDGs, Sustainable Development Goals. Available online: https://www.who.int/gho/publications/world_health_statistics/2019/en/ (accessed on 18 February 2020).
  7. OECD/European Observatory on Health Systems and Policies (2017), Hungary: Country Health Profile 2017, State of Health in the EU, OECD Publishing, Paris/European Observatory on Health Systems and Policies, Brussels. Available online: http://dx.doi.org/10.1787/9789264283411-en (accessed on 18 February 2020).
  8. Eurostat Healthy Life Years statistics—Statistics Explained. Available online: https://ec.europa.eu/eurostat/statistics-explained/index.php?title=Healthy_life_years_statistics#Healthy_life_years_at_birth (accessed on 18 February 2020).
  9. Eurostat. Ageing Europe—Looking at the Lives of Older People in the EU, Statistical books, 2019th ed.; Publications Office of the European Union: Luxembourg, 2019; ISBN 978-92-76-09815-7. [Google Scholar]
  10. Barabási, A.-L.; Menichetti, G.; Loscalzo, J. The unmapped chemical complexity of our diet. Nat. Food 2019, 1, 33–37. [Google Scholar] [CrossRef] [Green Version]
  11. Jacobs, D.R.; Tapsell, L.C. Food synergy: The key to a healthy diet. Proc. Nutr. Soc. 2013, 72, 200–206. [Google Scholar] [CrossRef] [PubMed] [Green Version]
  12. Giacalone, D.; Wendin, K.; Kremer, S.; Frøst, M.B.; Bredie, W.L.P.; Olsson, V.; Otto, M.H.; Skjoldborg, S.; Lindberg, U.; Risvik, E. Health and quality of life in an aging population – Food and beyond. Food Qual. Prefer. 2016, 47, 166–170. [Google Scholar] [CrossRef]
  13. Vermeir, I.; Verbeke, W. Sustainable Food Consumption: Exploring the Consumer “Attitude – Behavioral Intention” Gap. J. Agric. Environ. Ethics 2006, 19, 169–194. [Google Scholar] [CrossRef]
  14. Reisch, L.; Eberle, U.; Lorek, S. Sustainable food consumption: An overview of contemporary issues and policies. Sustain. Sci. Pract. Policy 2013, 9, 7–25. [Google Scholar] [CrossRef]
  15. Popp, J.; Oláh, J.; Kiss, A.; Lakner, Z. Food Security Perspectives in Sub-Saharan Africa. Amfiteatru Econ. J. 2019, 21, 361–376. [Google Scholar] [CrossRef]
  16. Benedetti, I.; Laureti, T.; Secondi, L. Choosing a healthy and sustainable diet: A three-level approach for understanding the drivers of the Italians’ dietary regime over time. Appetite 2018, 123, 357–366. [Google Scholar] [CrossRef]
  17. EAT-Lancet Commission. Food Planet Health - Healthy Diets from Sustainable Food Systems. Available online: https://eatforum.org/eat-lancet-commission/eat-lancet-commission-summary-report/ (accessed on 18 February 2020).
  18. Siró, I.; Kápolna, E.; Kápolna, B.; Lugasi, A. Functional food. Product development, marketing and consumer acceptance—A review. Appetite 2008, 51, 456–467. [Google Scholar]
  19. Menrad, K. Market and marketing of functional food in Europe. J. Food Eng. 2003, 56, 181–188. [Google Scholar] [CrossRef]
  20. Bigliardi, B.; Galati, F. Innovation trends in the food industry: The case of functional foods. Trends Food Sci. Technol. 2013, 31, 118–129. [Google Scholar] [CrossRef]
  21. Urala, N.; Lähteenmäki, L. Reasons behind consumers’ functional food choices. Nutr. Food Sci. 2003, 33, 148–158. [Google Scholar] [CrossRef]
  22. European Commission. Regulation (EC) No 1924/2006 of the European Parliament and of the Council of 20 December 2006 on Nutrition and Health Claims Made on Foods. Available online: https://eur-lex.europa.eu/legal-content/EN/TXT/PDF/?uri=CELEX:02006R1924-20141213 (accessed on 18 February 2020).
  23. European Union. Commission Regulation (EU) No 432/2012 of 16 May 2012 Establishing a List of Permitted Health Claims Made on Foods, other than Those Referring to the Reduction of Disease Risk and to Children’s Development and Health. Available online: https://eur-lex.europa.eu/legal-content/EN/TXT/HTML/?uri=CELEX:32012R0432&from=EN (accessed on 18 February 2020).
  24. Verhagen, H.; Vos, E.; Francl, S.; Heinonen, M.; van Loveren, H. Status of nutrition and health claims in Europe. Arch. Biochem. Biophys. 2010, 501, 6–15. [Google Scholar] [CrossRef]
  25. Verhagen, H.; van Loveren, H. Status of nutrition and health claims in Europe by mid 2015. Trends Food Sci. Technol. 2016, 56, 39–45. [Google Scholar] [CrossRef]
  26. Hilliam, M. The Market for Functional Foods. Int. Dairy J. 1998, 8, 349–353. [Google Scholar] [CrossRef]
  27. Gilbert, L.C. The functional food trend: What’s next and what Americans think about eggs. J. Am. Coll. Nutr. 2000, 19, 507S–512S. [Google Scholar] [CrossRef]
  28. Childs, N.M. Functional foods and the food industry: Consumer, economic and product development issues. J. Nutraceuticals Funct. Med. Foods 1997, 1, 25–43. [Google Scholar] [CrossRef]
  29. Verbeke, W. Consumer acceptance of functional foods: Socio-demographic, cognitive and attitudinal determinants. Food Qual. Prefer. 2005, 16, 45–57. [Google Scholar] [CrossRef]
  30. Bech-Larsen, T.; Grunert, K.G. The perceived healthiness of functional foods: A conjoint study of Danish, Finnish and American consumers’ perception of functional foods. Appetite 2003, 40, 9–14. [Google Scholar] [CrossRef]
  31. Landström, E.; Hursti, U.-K.K.; Becker, W.; Magnusson, M. Use of functional foods among Swedish consumers is related to health-consciousness and perceived effect. Br. J. Nutr. 2007, 98, 1058–1069. [Google Scholar] [CrossRef] [PubMed] [Green Version]
  32. Niva, M. ‘All foods affect health’: Understandings of functional foods and healthy eating among health-oriented Finns. Appetite 2007, 48, 384–393. [Google Scholar] [CrossRef] [PubMed]
  33. Urala, N.; Lähteenmäki, L. Consumers’ changing attitudes towards functional foods. Food Qual. Prefer. 2007, 18, 1–12. [Google Scholar] [CrossRef]
  34. Szakály, Z.; Szente, V.; Kövér, G.; Polereczki, Z.; Szigeti, O. The influence of lifestyle on health behavior and preference for functional foods. Appetite 2012, 58, 406–413. [Google Scholar] [CrossRef]
  35. Van Kleef, E.; van Trijp, H.C.; Luning, P. Functional foods: Health claim-food product compatibility and the impact of health claim framing on consumer evaluation. Appetite 2005, 44, 299–308. [Google Scholar] [CrossRef]
  36. Van Trijp, H.C.; Van der Lans, I.A. Consumer perceptions of nutrition and health claims. Appetite 2007, 48, 305–324. [Google Scholar] [CrossRef]
  37. Behrens, J.H.; Villanueva, N.D.; Da Silva, M.A. Effect of nutrition and health claims on the acceptability of soyamilk beverages. Int. J. Food Sci. Technol. 2007, 42, 50–56. [Google Scholar] [CrossRef]
  38. Urala, N.; Arvola, A.; Lähteenmäki, L. Strength of health-related claims and their perceived advantage. Int. J. Food Sci. Technol. 2003, 38, 815–826. [Google Scholar] [CrossRef]
  39. Banovic, M.; Arvola, A.; Pennanen, K.; Duta, D.E.; Brückner-Gühmann, M.; Lähteenmäki, L.; Grunert, K.G. Foods with increased protein content: A qualitative study on European consumer preferences and perceptions. Appetite 2018, 125, 233–243. [Google Scholar] [CrossRef]
  40. Verbeke, W.; Scholderer, J.; Lähteenmäki, L. Consumer appeal of nutrition and health claims in three existing product concepts. Appetite 2009, 52, 684–692. [Google Scholar] [CrossRef]
  41. Wortmann, L.; Enneking, U.; Daum, D. German Consumers’ Attitude towards Selenium-Biofortified Apples and Acceptance of Related Nutrition and Health Claims. Nutrients 2018, 10, 190. [Google Scholar] [CrossRef] [PubMed] [Green Version]
  42. Micale, R.; Giallanza, A.; Russo, G.; La Scalia, G. Selection of a Sustainable Functional Pasta Enriched with Opuntia Using ELECTRE III Methodology. Sustainability 2017, 9, 885. [Google Scholar] [CrossRef] [Green Version]
  43. Sagan, A.; Blicharz-Kania, A.; Szmigielski, M.; Andrejko, D.; Sobczak, P.; Zawiślak, K.; Starek, A. Assessment of the Properties of Rapeseed Oil Enriched with Oils Characterized by High Content of α-linolenic Acid. Sustainability 2019, 11, 5638. [Google Scholar] [CrossRef] [Green Version]
  44. Annunziata, A.; Vecchio, R. Consumer perception of functional foods: A conjoint analysis with probiotics. Food Qual. Prefer. 2013, 28, 348–355. [Google Scholar] [CrossRef]
  45. van der Zanden, L.D.; van Kleef, E.; de Wijk, R.A.; van Trijp, H.C. Knowledge, perceptions and preferences of elderly regarding protein-enriched functional food. Appetite 2014, 80, 16–22. [Google Scholar] [CrossRef]
  46. van der Zanden, L.D.; van Kleef, E.; de Wijk, R.A.; van Trijp, H.C. Understanding heterogeneity among elderly consumers: An evaluation of segmentation approaches in the functional food market. Nutr. Res. Rev. 2014, 27, 159–171. [Google Scholar] [CrossRef] [Green Version]
  47. van der Zanden, L.D.; van Kleef, E.; de Wijk, R.A.; van Trijp, H.C. Examining heterogeneity in elderly consumers’ acceptance of carriers for protein-enriched food: A segmentation study. Food Qual. Prefer. 2015, 42, 130–138. [Google Scholar] [CrossRef]
  48. Doma, K.M.; Farrell, E.L.; Leith-Bailey, E.R.; Soucier, V.D.; Duncan, A.M. Older Adults’ Awareness and Knowledge of Beans in Relation to Their Nutrient Content and Role in Chronic Disease Risk. Nutrients 2019, 11, 2680. [Google Scholar] [CrossRef] [Green Version]
  49. Collins Orla; Bogue Joe Designing health promoting foods for the ageing population: A qualitative approach. Br. Food J. 2015, 117, 3003–3023. [CrossRef]
  50. Plasek, B.; Lakner, Z.; Kasza, G.; Temesi, Á. Consumer Evaluation of the Role of Functional Food Products in Disease Prevention and the Characteristics of Target Groups. Nutrients 2020, 12, 69. [Google Scholar] [CrossRef] [Green Version]
  51. Temesi, Á.; Bacsó, Á.; Grunert, K.G.; Lakner, Z. Perceived correspondence of health effects as a new determinant influencing purchase intention for functional food. Nutrients 2019, 11, 740. [Google Scholar] [CrossRef] [PubMed] [Green Version]
  52. Dávid Szakos; Ózsvári László; Kasza Gyula Consumer demand analysis in the Hungarian functional food market focused on the main health problems. Gradus 2020, 7, 62–66.
  53. Hungarian Central Statistical Office (HCSO). Hungarian Census Data 2016. Available online: https://www.ksh.hu/mikrocenzus2016/kotet_3_demografiai_adatok (accessed on 18 February 2020).
  54. Clason, D.L.; Dormody, T.J. Analyzing data measured by individual Likert-type items. J. Agric. Educ. 1994, 35, 4. [Google Scholar] [CrossRef]
  55. Grafen, A.; Hails, R. Modern Statistics for the Life Sciences, 2002nd ed.; Oxford University Press: Oxford, UK, 2002; Volume 351.
  56. Hooker, N.H.; Teratanavat, R. Dissecting Qualified Health Claims: Evidence from Experimental Studies. Crit. Rev. Food Sci. Nutr. 2008, 48, 160–176. [Google Scholar] [CrossRef] [PubMed]
  57. Ares, G.; Gámbaro, A. Influence of gender, age and motives underlying food choice on perceived healthiness and willingness to try functional foods. Appetite 2007, 49, 148–158. [Google Scholar] [CrossRef]
  58. Williams, P.; Ridges, L.; Batterham, M.; Ripper, B.; Hung, M.C. Australian consumer attitudes to health claim—food product compatibility for functional foods. Food Policy 2008, 33, 640–643. [Google Scholar] [CrossRef] [Green Version]
  59. Urala, N.; Lähteenmäki, L. Attitudes behind consumers’ willingness to use functional foods. Food Qual. Prefer. 2004, 15, 793–803. [Google Scholar] [CrossRef]
  60. Bimbo, F.; Bonanno, A.; Nocella, G.; Viscecchia, R.; Nardone, G.; De Devitiis, B.; Carlucci, D. Consumers’ acceptance and preferences for nutrition-modified and functional dairy products: A systematic review. Appetite 2017, 113, 141–154. [Google Scholar] [CrossRef] [Green Version]
  61. Messina, F.; Saba, A.; Turrini, A.; Raats, M.; Lumbers, M. Older people’s perceptions towards conventional and functional yoghurts through the repertory grid method: A cross-country study. Br. Food J. 2008, 110, 790–804. [Google Scholar] [CrossRef] [Green Version]
  62. Cavaliere, A.; Ricci, E.C.; Banterle, A. Nutrition and health claims: Who is interested? An empirical analysis of consumer preferences in Italy. Food Qual. Prefer. 2015, 41, 44–51. [Google Scholar] [CrossRef]
  63. European Hearth Network European Cardiovascular Disease Statistics 2017. Available online: http://www.ehnheart.org/cvd-statistics.html (accessed on 18 February 2020).
  64. Grunert, K.G.; Hieke, S.; Wills, J. Sustainability labels on food products: Consumer motivation, understanding and use. Food Policy 2014, 44, 177–189. [Google Scholar] [CrossRef] [Green Version]
  65. Wilkins, J.L. Seasonality, food origin, and food preference: A comparison between food cooperative members and nonmembers. J. Nutr. Educ. 1996, 28, 329–337. [Google Scholar] [CrossRef]
Figure 1. Preference of nutrition claims on food (1–5 Likert scale, where 5 means the highest level of preference).
Sustainability 12 02748 g001
Figure 2. Preference of nutrition claims categories composed with PCA, between different age groups (* p < 0.05; ** p < 0.01).
Sustainability 12 02748 g002
Figure 3. Preference of different food carriers (1-5 Likert scale, where 5 means the highest level of preference).
Sustainability 12 02748 g003
Figure 4. Preference of food carrier categories composed with PCA, between different age groups (* p < 0.05).
Sustainability 12 02748 g004
Figure 5. Consumer concerns in regard to certain health problems and the perceived suitability of functional foods to prevent or mitigate these problems.
Sustainability 12 02748 g005
Figure 6. Proportion of affected/worried consumers in the age groups, who accepted food as a solution to prevent and/or mitigate a particular health problem (* p < 0.05; ** p < 0.01).
Sustainability 12 02748 g006
Table 1. Representative socio-demographic characteristics of the sample (% of respondents, n = 1002).
Socio-demographic CategoriesSamplePopulation *
SexFemale53.1953.07
Male46.8146.93
Age18–2917.9617.59
30–3916.9717.04
40–5934.5333.83
>6030.5431.54
Geographical distribution (NUTS-2)Central Hungary31.0430.75
Central Transdanubia10.7810.80
Western Transdanubia10.1810.03
Southern Transdanubia8.689.13
Northern Hungary11.4811.62
Northern Great Plain15.0714.90
Southern Great Plain12.7712.78
* Latest census data of Hungarian Central Statistical Office to adult Hungarian population [53].
Table 2. Further socio-demographic characteristics of the sample (valid % of respondents).
Socio-demographic Categories%
Place of livingVillage15.49
Another city61.54
Capital city22.98
Highest accomplished qualificationPrimary and vocational school11.46
High school (graduated)33.37
Higher education55.17
Income level (subjective estimation)Below average13.11
Average68.16
Above average17.17
Economic statusActive worker54.64
Entrepreneur6.25
Retiree27.12
Job seeker1.51
Homemaker1.41
Student9.07
Children under 15 years of age in the householdYes20.04
No79.96
Number of persons living in the household116.48
240.88
317.83
414.18
5 or more10.63
Special dietary needsRespondent49.50
Another person in the family10.68
No34.53
Did not respond5.29
Table 3. Attitudes toward nutrition in different age groups (level of agreement, 1–5 Likert scale).
VariablesTotal Sample18–2930–3940–59>60Sig.
M (SD)
Nutrition has a direct impact on health4.60 (0.783)4.51 (0.897)4.60 (0.751)4.61 (0.744)4.64 (0.773)0.362
Healthy diet has great impact on the prevention of diseases in older adults4.50 (0.822)4.57 (0.703)4.43 (0.868)4.50 (0.830)4.49 (0.852)0.534
For older adults, diet has a more important role in health4.31 (0.976)4.34 (0.871)4.16 (1.046)4.28 (0.971)4.42 (0.976)0.003
Healthy diet is important for me4.28 (0.885)4.05 (0.878)4.16 (0.879)4.31 (0.827)4.45 (0.920)<0.0001
Table 4. Perception of health-related lifestyle factors in different age groups.
VariablesTotal Sample18–2930–3940–59>60Sig.
%
I feel healthy in general59.9667.0557.2357.8559.720.184
I want to lose weight, and I do something about this41.6338.0739.7644.7741.130.461
I exercise regularly37.6448.3043.0335.1730.850.001
I have a stressful lifestyle36.0236.9349.4043.6018.37<0.0001
I do not sleep enough33.7531.8240.9639.5323.67<0.0001
I do not exercise enough32.5732.3934.3438.1924.820.005
I pay more attention to my diet than average30.0322.7334.3428.7833.570.049
I use dietary supplements25.7022.1628.9227.3324.030.400
I can spend only a little time on eating and cooking19.0933.5225.9019.196.01<0.0001
I smoke every day15.1720.4521.0816.576.71<0.0001
I try to consume less alcohol17.4421.5917.4716.5715.900.431
Table 5. Nutrition claims factor categories based on PCA (Rotation method: Varimax; KMO: 0.944; Bartlett: < 0.0001).
Factor NamesIncluded VariablesTotal Variance Explained
% of VarianceCumulative %
Vitamins and mineralsHigh in vitamins13.46913.469
Source of vitamins
Natural source of Calcium
Naturally high in Calcium
Source of Calcium
High in Calcium
SaltLow in salt13.35326.822
Low in sodium
Very low in salt
Very low in sodium
Salt-free
Sodium-free
Not listed claimsWhole grain11.71438.536
Contains antioxidant
Contains herbs
Live cultures
Probiotic
Prebiotic
Contains pectin
LightLow energy9.60148.137
Light/lite
Energy-reduced
Energy-free
SugarWith no added sugar8.45156.588
Low in sugar
Sugar-free
Low-carb
FatLow-fat8.10864.697
Low-saturated fat
Reduced saturated fat
Saturated fat-free
Fat-free
Protein and fiberHigh in fiber7.36972.065
High in protein
Source of protein
Source of fiber
Increased protein
Free fromLactose-free4.69376.758
Gluten-free
Table 6. Carrier factor categories based on PCA (Rotation method: Varimax; KMO: 0.848; Bartlett: < 0.0001).
Factor NamesIncluded VariablesTotal Variance Explained
% of VarianceCumulative %
Dairy productsYogurt14.54114.541
Kefir
Cheese
Cottage cheese
Milk
Butter
Sour cream
Breakfast productsMargarine10.25624.797
Bakery products
Fruit jam
Fruits and vegetablesFruits10.03834.835
Vegetables
Fruit-based products
Vegetable-based products
Mushroom-based products
Meat, fish, and eggsFish and fish-based products9.78344.619
Poultry meals
Egg and egg-based products
Pork meals
Meat products
Natural productsJuice (fruit, vegetable)9.34953.967
Honey
Tea
Nuts and other oily seeds, muesli
Herbal products
Table 7. Presence of particular health concerns in different age groups.
Health Problem18–2930–3940–59>60Sig.
%
Vision deficiencies and disorders46.0643.0464.5772.97<0.0001
Dental problems40.8557.8665.9161.21<0.0001
Heart and cardiovascular diseases27.5345.2448.8654.93<0.0001
Arthritis disorders27.1137.3453.9769.70<0.0001
Digestive problems29.4535.6745.0042.360.0063
High cholesterol level19.8831.4534.5651.60<0.0001
Memory disorders, concentration23.4926.4228.1938.020.0142
Diabetes17.5826.5829.7734.500.0033
Osteoporosis13.2520.1327.6536.79<0.0001
Migraine22.4225.1624.9110.860.0017
Table 8. Preference of certain sustainability factors in regard to functional food products in different age groups.
VariablesTotal Sample18–2930–3940–59>60Sig.
M (SD)
Domestic product3.85 (1.213)3.24 (1.370)3.86 (1.086)3.85 (1.170)4.21 (1.085)<0.0001
Small-scale production3.77 (1.215)3.06 (1.289)3.71 (1.224)3.92 (1.105)4.05 (1.125)<0.0001
Animal welfare considerations3.73 (1.228)3.51 (1.403)3.77 (1.179)3.73 (1.150)3.83 (1.220)0.143
Traditional product3.53 (1.159)2.87 (1.257)3.43 (1.257)3.64 (1.067)3.87 (0.981)<0.0001
Organic product3.47 (1.281)3.08 (1.379)3.29 (1.291)3.61 (1.203)3.65 (1.246)<0.0001
Produced with modern technology2.93 (1.212)2.52 (1.178)2.69 (1.231)2.95 (1.225)3.29 (1.217)<0.0001

