Article

Salmon Intake Intervention in the Vulnerable Group of Young Polish Women to Maintain Vitamin D Status during the Autumn Season

Department of Dietetics, Institute of Human Nutrition Sciences, Warsaw University of Life Sciences (SGGW-WULS), 159c Nowoursynowska Street, 02-776 Warsaw, Poland
*
Author to whom correspondence should be addressed.
Sustainability 2020, 12(7), 2829; https://doi.org/10.3390/su12072829
Submission received: 1 March 2020 / Revised: 27 March 2020 / Accepted: 30 March 2020 / Published: 2 April 2020
(This article belongs to the Special Issue Sustainability in Food Consumption and Food Security)

Abstract

:
Fish products are the main dietary source of vitamin D, but due to a low fish intake in the majority of European countries, an inadequate vitamin D intake is common, especially in the vulnerable group of young women for whom it is essential for the osteoporosis prevention. The aim of the presented study was to assess the possibility of applying salmon intake intervention for maintaining vitamin D status in young Polish women during the autumn season, in which in Poland there is not enough sunshine exposure to generate skin synthesis. The dietary intervention within VISA Study (Vitamin D In Salmon) comprised eight weeks of daily consumption of 50 g of Atlantic salmon and was conducted in a group of 47 women aged 20–30 years. Within the study, their changes of total serum 25-hydroxyvitamin D (25(OH)D) levels were analyzed and the effectiveness of the intervention depending on age, body mass index (BMI), and baseline 25(OH)D were assessed. Until the 4th week, 25(OH)D in the studied group decreased from 57.1 nmol/L to 39.9 nmol/L (p < 0.0001), but afterward it increased until the 8th week to 54.1 nmol/L (p = 0.0005), contributing to results not differing from the baseline (p = 0.7964). At the same time, the share of respondents characterized by an inadequate vitamin D status increased until the 4th week, but afterward, it decreased until the 8th week (p = 0.0002). Neither the age (in the assessed range), nor the BMI influenced 25(OH)D during the study, but only the baseline 25(OH)D was correlated with the BMI (p = 0.0419; R = −0.2980). The baseline 25(OH)D was associated with its levels during the intervention, as well as with 25(OH)D change from the baseline values (p < 0.0001). It may be concluded that, in spite of the initial decline of the 25(OH)D observed (probably connected to the starting time of the study), afterward the salmon intake intervention contributed to its increase, while the baseline 25(OH)D status was an important determinant of the intervention effectiveness during the autumn season.

1. Introduction

Vitamin D is of the highest importance for the skeletal system, promoting calcium and phosphorus absorption in the gut, maintaining their adequate concentrations, and for bone growth and remodeling by osteoblasts and osteoclasts [1]. Studies also suggest an association between vitamin D status or intake and various diseases and disorders. Recent meta-analyses show that vitamin D deficiency is associated with a higher risk of sleep disorders [2] and may be related to autoimmune thyroid disease [3], whereas high vitamin D serum levels have a protective effect on breast cancer in premenopausal women [4]. They also indicate that vitamin D supplementation significantly reduces cancer mortality [5], as well as the rate of asthma exacerbations [6]. Taking it into account, scientists agree that vitamin D goes beyond influencing bone health only [7,8].
However, vitamin D status is a global problem. Based on protocols of the Vitamin D Standardization Program (VDSP) by National Institutes of Health (NIH) [9], the analysis of data for 14 European countries indicated the prevalence of vitamin D deficiency of 13% [10], while defined by the United States (US) Institute of Medicine (IoM) and the United Kingdom National Osteoporosis Society (NOS) as serum 25-hydroxyvitamin D (25(OH)D) level lower than 30 nmol/L (12 ng/mL, 1 nmol/L = 0.4 ng/mL) [11,12]. At the same time, for the alternate threshold for vitamin D deficiency of serum 25(OH)D level lower than 50 nmol/L, which is suggested by the US Endocrine Society [13], European Food Safety Authority (EFSA) [14] and Polish recommendations [15], the prevalence was 40.4% [10]. Among healthy adolescents, the prevalence of vitamin D deficiency (25(OH)D level lower than 50 nmol/L) sometimes reaches even 42% [16] and in teenage girls living in northern Europe, in the winter season, even 92% [17]. In young women aged 18–29 years living in France, the prevalence of vitamin D deficiency (25(OH)D level lower than 50 nmol/L) amounts to 48.4% and is the highest among female groups [18].
The main source of vitamin D is the skin synthesis of cholecalciferol from 7-dehydrocholesterol [19] as a result of UVB radiation (290–320 nm) from sunshine exposure, which depends on the latitude, the season, and the time of the day [7]. In countries such as Poland, which are situated in a moderate climate, endogenous vitamin D synthesis is possible from April to October only [20]. The other source of vitamin D is dietary intake—mainly from animal products, especially from fatty fish [21]. However, the vitamin D content in fish species differs significantly—in Poland, from 30 μg/100 g for eel, 19 μg/100 g for herring, and 13 μg/100 g for salmon to 1 μg/100 g for cod and 0.8 μg/100 g for flounder [22].
Due to a low fish intake in most European countries [23], inadequate vitamin D intake has been observed for years [19]. In Poland, it has been reported that for women the average vitamin D intake is 3.3 μg [24], whereas the most prominent recommendations indicate at least 10 μg as the reference intake of vitamin D for adults [11,25,26]. The problem of inadequate vitamin D intake is most serious when it comes to women under 30 years of age, since this is the group in which the intake of vitamin D is the lowest according to the 2003–2006 National Health and Nutrition Examination Survey (NHANES) [27]. Moreover, until the age of 30, the maximum bone density and peak bone mass are reached [28], which is influenced by vitamin D, so obtaining adequate vitamin D intake and status would be especially important in that vulnerable group of young women.
In recent years, intervention studies with the aim of improving vitamin D status through fish intake increase have been conducted in various European countries [29]. Their efficacy differed depending on the studied group, the type of intervention (fish species, dose, frequency), and intervention duration. However, no effective and recommended intervention has been defined in order to improve vitamin D intake and status in young women. Taking this into account, the aim of the presented study was to assess the efficacy of salmon intake intervention on vitamin D status in young Polish women during autumn.

2. Materials and Methods

2.1. Ethical Statement
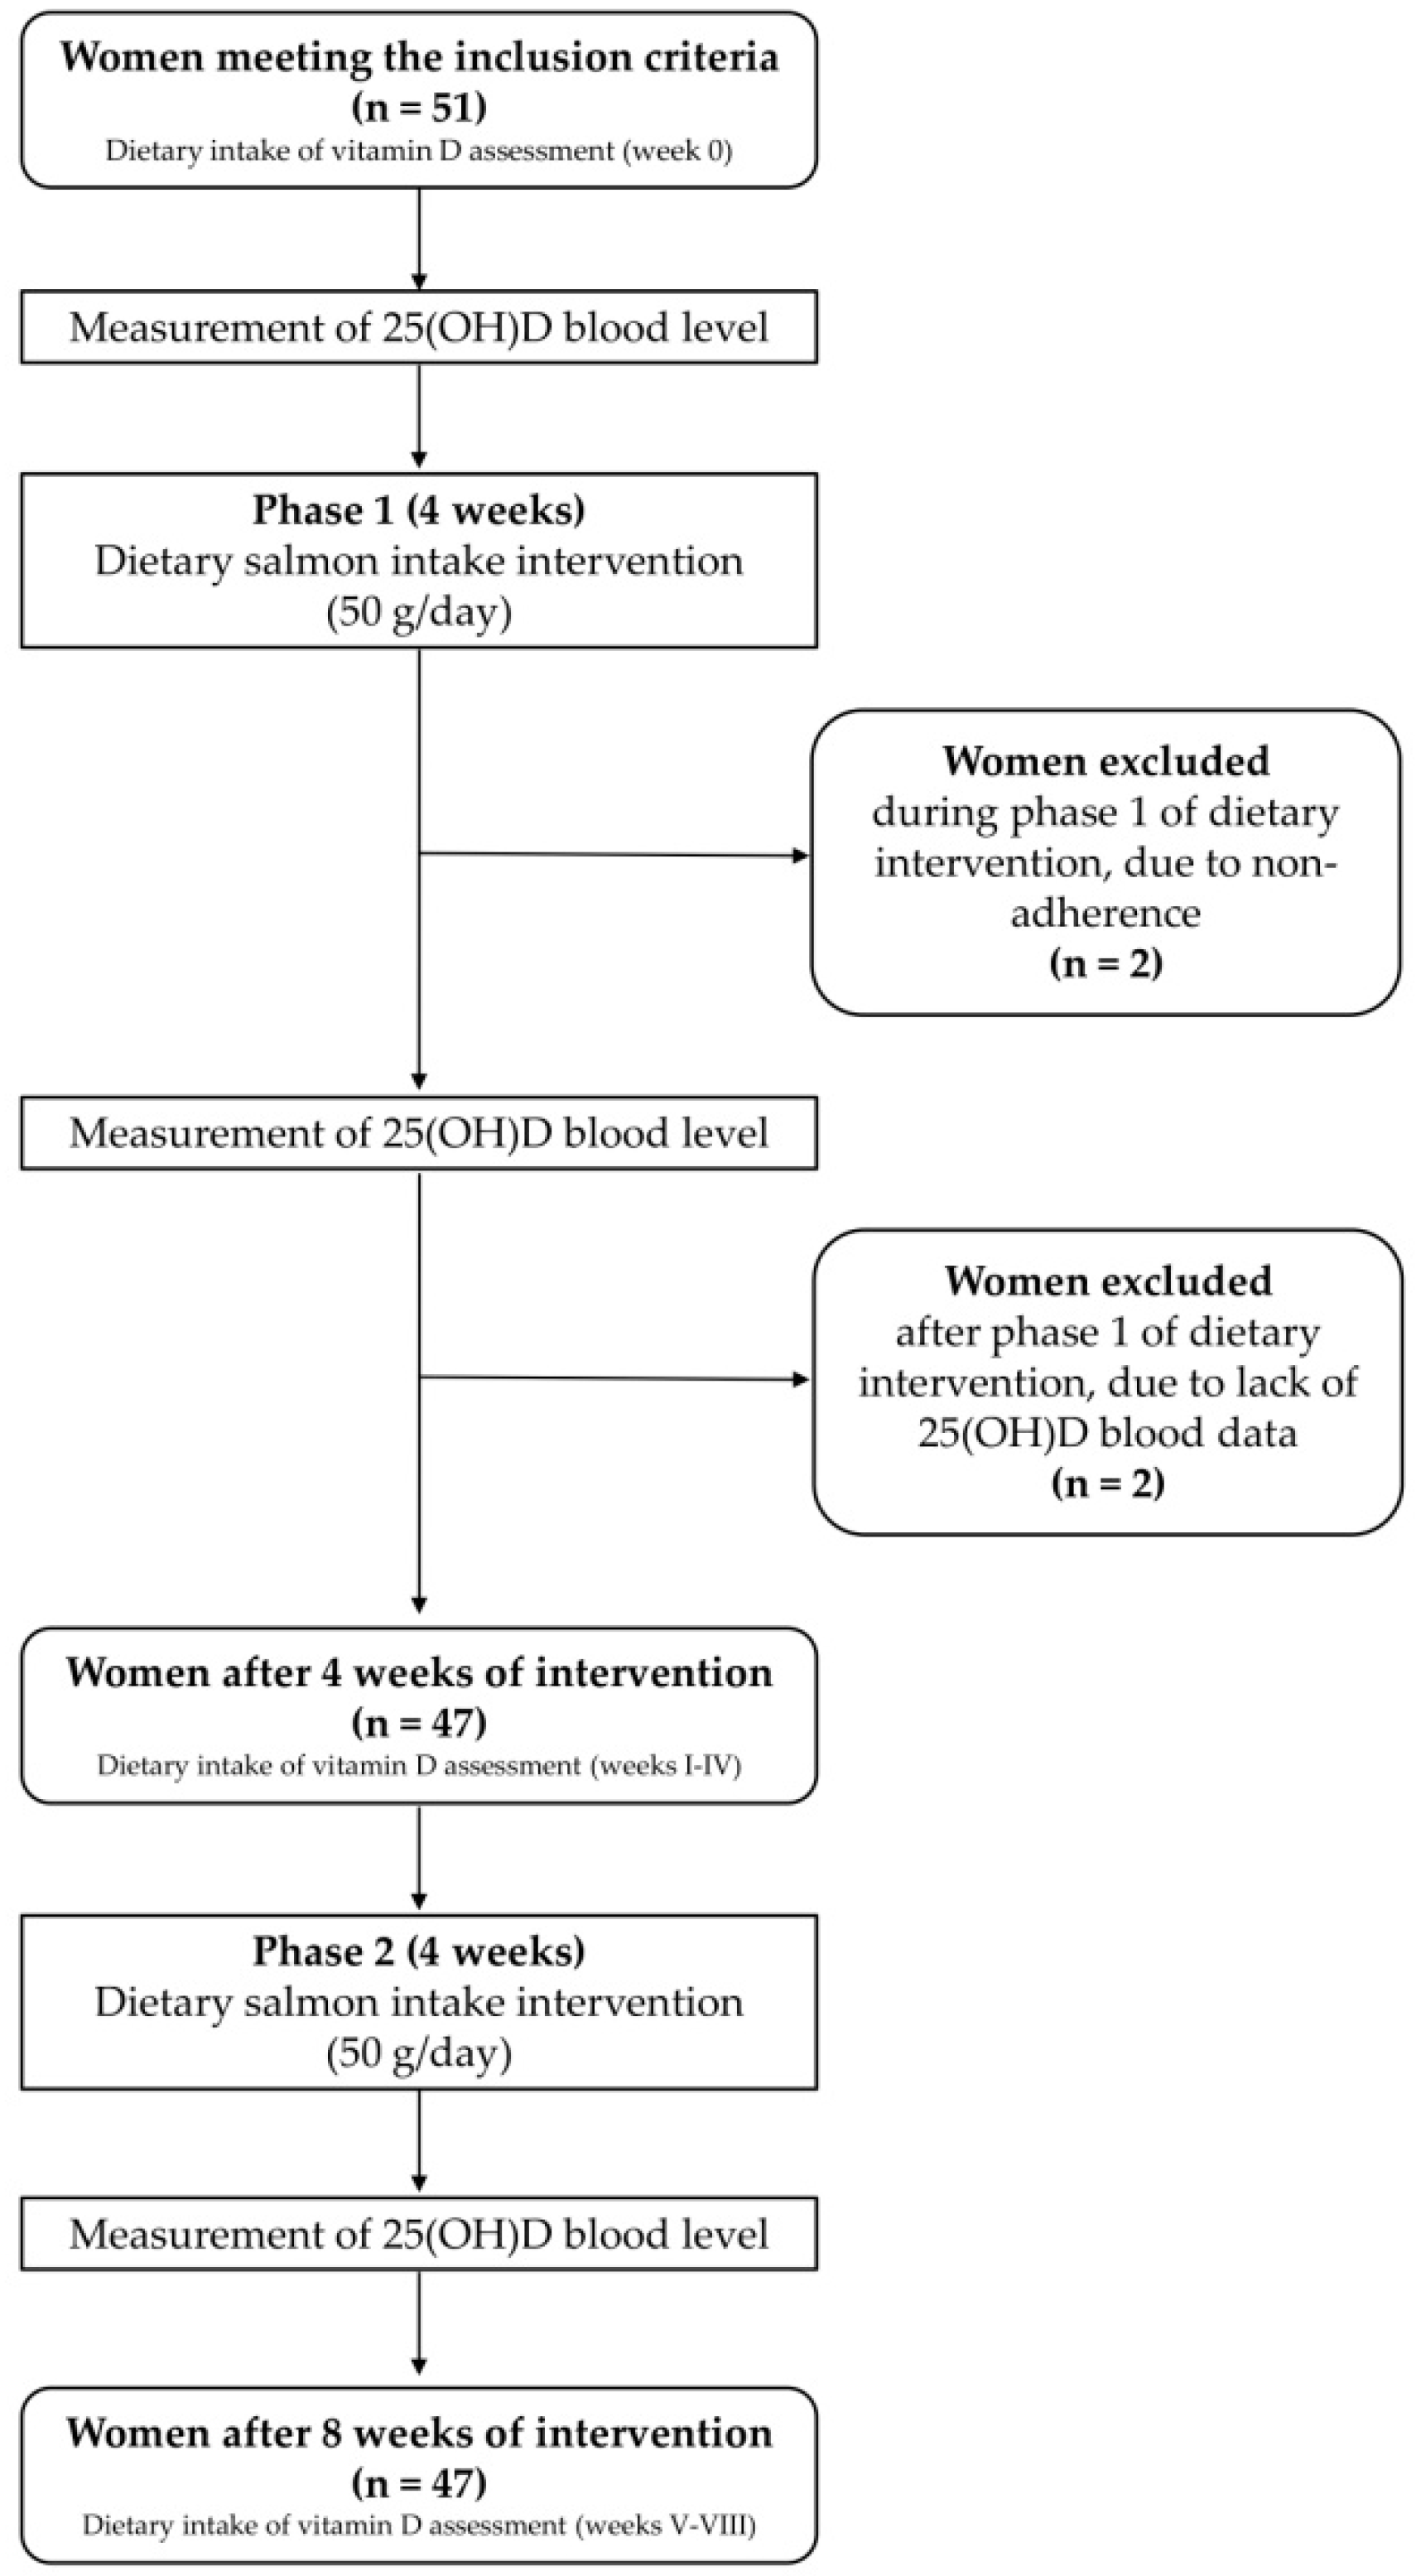
The VISA Study (Vitamin D In Salmon) was conducted according to the guidelines of the Declaration of Helsinki and it was approved by the Ethics Committee of the Faculty of Human Nutrition and Consumer Sciences of the Warsaw University of Life Sciences (No 27/2018).

2.2. Studied Group

The studied group of young women was recruited in a procedure of convenience sampling, with the snowball effect, while announced in university social media. The inclusion criteria were as follows:
females,
Caucasian,
aged 20–30 years,
living in Warsaw or its surroundings (necessary to visit Dietetic Outpatient Clinic of the Department of Dietetics, Warsaw University of Life Sciences (WULS-SGGW) once a week for 8 weeks of the study duration),
providing written informed consent to participate in the study.
The exclusion criteria were as follows:
pregnancy,
lactation,
obesity, defined based on the criteria of the World Health Organization [30] as body mass index (BMI) ≥ 30 kg/m2,
fish and/or seafood allergy,
following any diet with fish consumption restriction (e.g., vegetarian diet),
vitamin D supplementation use up to 3 weeks before beginning of study and/or planned during study time,
diseases and/or use of medicines changing vitamin D metabolism,
planned travels to countries below the 40th parallel (countries with adequate sun exposure to obtain cutaneous vitamin D synthesis during study time),
planned solarium use during study time.
In total, 51 individuals met the criteria and were included in the study and in this group the salmon intake intervention was conducted.

2.3. Dietary Intervention

The intervention study was designed to assess the efficacy of daily Atlantic farmed smoked salmon intake intervention on serum 25(OH)D level. All participants were enrolled in and finished the study at the same time. The fish intake intervention lasted from October 24, 2018 to December 18, 2018. The period of intervention was planned because from other studies it is known that in countries such as Poland, skin synthesis of vitamin D, which is the major source of the vitamin, is only possible from April to October [20], so it was decided to conduct the study directly after this period.
Atlantic farmed smoked salmon was chosen in the intervention as a source of vitamin D that is possible to be applied in practice, for numerous reasons. Salmon contains significant amounts of vitamin D (17.1 μg/100 g for smoked salmon, based on United States Department of Agriculture—USDA food composition tables [31]) and is widely available on the Polish market, independently from the region of the country [32]. Moreover, Atlantic farmed salmon is a species that contains very little mercury (≤ 0.1 μg/g) and dioxins (0.5–4 pg Toxic Equivalent (TEQ)/g), so it is classified to the first and second group respectively when it comes to the smallest content of those contaminants [33]. The very high content of eicosapentaenoic acid (EPA) and docosahexaenoic acid (DHA) (> 15 mg/g) also contributes to the Food and Agriculture Organization (FAO) of the United Nations and the World Health Organization (WHO) [33] recommending salmon as a fish species having much more benefits than risks.
The Atlantic farmed smoked salmon that was used for the study was obtained from one producer, one of the leading salmon sellers in Poland (Suempol Polska Ltd.), and for all the participants, the provided salmon was obtained from the same batch, in identical sliced tray modified atmosphere packaging.
Studies show a large variation in the content of vitamin D in salmon [34], therefore its content was measured in the smoked Atlantic salmon used in the study by a leading vitamin laboratory in Europe – Eurofins Vitamin Testing Denmark (EN 12821: 2009-08, LC-DAD, accredited methodology no. 581). The measured content of vitamin D was 21.3 ± 5.55 μg/100 g, which is higher than the value typical for smoked salmon, like the one shown in the Polish Food Composition Tables [22].
The daily intake was planned as 50 g, so it was attributed to around 10.65 μg of vitamin D, which covers the recommended 10 μg [11,25,26]. Atlantic farmed smoked salmon was packed in 50 g portions to facilitate consuming 1 portion (50 g) each day. Participants were given 7 packages (7 × 50 g) of smoked salmon once a week, for 8 weeks of the study duration. To increase adherence to intervention, participating women were asked to report their intake daily. Participants were asked to incorporate the given salmon in their daily food intake substituting it for other products such as meat, cheese, or eggs. They were not recommended to exclude other fish products from their diet, so if they had previously consumed them, they were recommended not to change this habit.
Participants had their serum 25(OH)D level measured three times: before the dietary intervention (at baseline (t0)), after 4 weeks of dietary intervention (t4), and after 8 weeks of intervention (after the study (t8)). The study course is shown in Figure 1.

2.4. Measurements

Anthropometric measurements included body mass and height. Body mass was assessed using a calibrated weighing scale with an accuracy of ± 0.1 kg and body height was assessed using a stadiometer with an accuracy of ± 0.5 cm. The measurements were conducted by a professional nutritionist, according to the recommended procedure [35]. Afterward, the BMI was calculated, based on the Quetelet equation and interpreted to verify the exclusion criteria [30].
Vitamin D status was assessed based on the total serum 25(OH)D level at baseline (t0), after 4 weeks of dietary intervention (t4), and after 8 weeks of intervention (t8). For the analysis, venous blood samples were drawn by a qualified nurse in a certified medical analysis laboratory in Warsaw, Poland; participants did not have to be in a fasting state before blood collection. Total serum 25(OH)D level tests were performed on BS Mindray BS-200 Chemistry Analyzer using Diazyme EZ Vitamin D assay and the dual vial liquid stable (latex enhanced immunoturbidimetric) method, which enabled determination of total 25(OH)D in the range of 19.0–369.5.8 nmol/L. For this method, a comparison of the EZ Vitamin D assay (y) using samples measured with LC–MS (liquid chromatography–mass spectrometry)/MS in the validation gave the following correlation: y = 1.0297x−0.813 for R2 = 0.9622 and a comparison of the EZ Vitamin D assay using samples measured with a commercially available 25(OH)D immunoassay in the validation gave the following correlation: y = 1.1537x−1.2321 for R2 = 0.9716. The assay precision for the method is defined by percent coefficient of variation (%CV) lower than 5% at 75 nmol/L. The method is certified by the Centers for Disease Control and Prevention within the Vitamin D Standardization–Certification Program (CDC VDSCP) and meets the performance target set by the Vitamin D External Quality Assessment Scheme (DEQAS) advisory panel.
Each sample was assessed by the same person, in the same conditions, with the same equipment, and using exactly the same methodology, for each sample within 1 hour from drowing the blood samples. The obtained results of total serum 25(OH)D level were compared to the following reference values: < 50 nmol/L—inadequate, 50–250 nmol/L—adequate, > 250 nmol/L—potentially toxic [11,25,36,37].
In order to provide the necessary safety precautions, during the whole experiment, participants had their vitamin D intake and blood pressure controlled. As the intervention comprised additional intake of vitamin D, the total vitamin D intake was controlled throughout the experiment, using the Vitamin D Estimation Only—Food Frequency Questionnaire (VIDEO-FFQ), which was previously validated in a group of Polish women aged 20–30 years [38]. Afterward, the obtained vitamin D intake was compared with the upper intake level (UL) of 100 μg [14]. At the same time, because of high salt content in smoked salmon (1.5 g/50 g), the blood pressure of participants was controlled throughout the experiment (once a week), using Omron Healthcare BP 710N blood pressure monitor, according to the recommended procedure [39]. The observed systolic and diastolic blood pressure values were compared with the standard reference values of 140 mmHg and 90 mmHg, respectively, and the increase of blood pressure above the recommended values observed during two following weeks was decided to be interpreted as a reason to suspend participation in the experiment. Neither for vitamin D intake, nor for blood pressure were the excessive values stated, so it was interpreted as obtaining the required safety of dietary intervention.

2.5. Statistical Analysis

The distribution of the obtained values was verified using Shapiro–Wilk test. The groups were compared using the t-Student test (for parametric distributions), the Mann–Whitney U test, and the Kruskal–Wallis Analysis of Variance (ANOVA) with multiple comparisons (for non-parametric distributions), as well as the chi2 test. The correlations were verified using Pearson correlation coefficient (for parametric distributions) and Spearman rank correlation coefficient (for non-parametric distributions).
The accepted level of significance was p ≤ 0.05. The following software was used: Statistica 8.0 (Statsoft Inc., Tulsa, OK, USA), Statgraphics Plus for Windows 4.0 (Statgraphics Technologies Inc., The Plains, VA, USA).

3. Results

The characteristics of the studied group and vitamin D status throughout the intervention are presented in Table 1. While comparing the serum 25(OH)D level, it was stated that the results differed throughout the study (p = 0.0001; Kruskal-Wallis ANOVA), but for multiple comparisons, it was stated that the results after 8 weeks of intervention did not differ from the results at baseline (p = 0.7964). However, during phase I of the study (weeks I-IV), a significant decrease of serum 25(OH)D level was observed (p < 0.0001 for the comparison of t0 and t4 results), whereas during phase II (weeks V-VIII), a significant increase was noted (p = 0.0005 for the comparison of t4 and t8 results).
The dietary vitamin D intake in the studied group throughout the study is presented in Table 2. It was observed that, at baseline, the dietary intake of vitamin D was significantly lower than those assessed after four weeks of intervention (p < 0.0001), as well as after eight weeks of intervention (p < 0.0001). At the same time, the dietary intakes of vitamin D assessed after four weeks of intervention and those assessed after eight weeks of intervention did not differ (p = 0.5758).
The assessment of the adequacy of vitamin D status throughout the study is presented in Table 3. While comparing the share of participants characterized by adequate and inadequate serum 25(OH)D level, it was stated that it did not differ between baseline assessment and assessment after eight weeks of intervention (p = 1.0000, chi2). At the same time, the share of respondents characterized by inadequate serum 25(OH)D levels increased during phase I of the study (p = 0.0002 for the comparison of t0 and t4 shares, chi2), but decreased during phase II (p = 0.0002 for the comparison of t4 and t8 shares, chi2).
The analysis of correlations between age or BMI and vitamin D status throughout the study are presented in Table 4. It was stated that neither age nor BMI influenced 25(OH)D level during the study, as well as its changes, apart from the baseline 25(OH)D level which was significantly correlated with BMI (p = 0.0419; R = −0.2980).
The analysis of correlations between vitamin D status before the intervention and its later levels and changes throughout the study is presented in Table 5. It was stated that the 25(OH)D level before the intervention was associated with its levels during the intervention (p < 0.0001). It was also associated with 25(OH)D changes from the baseline values (p < 0.0001), but not with the following changes (from t4 to t8).
The comparison of the vitamin D status throughout the study between subgroups characterized by various baseline statuses is presented in Table 6.
For the serum 25(OH)D level, all differences were statistically significant (p ≤ 0.05) and higher levels were observed for participants characterized by adequate baseline status. However, for the serum 25(OH)D level, for participants characterized by inadequate baseline status, lower decreases from t0 to t4 and higher increases from t4 to t8 were noted, when compared to participants with adequate baseline status.

4. Discussion

In the presented study, it was stated that the baseline 25(OH)D level had a profound impact on the changes observed after the intervention, so it may be concluded that the efficacy of the applied dietary intervention of daily salmon intake depends on the baseline 25(OH)D level. In the total studied group, the median change after eight weeks of intervention was −8.1 nmol/L. Taking into consideration only the participants with adequate 25(OH)D level (≥ 50 nmol/L), it was also a drop (median = −6.7 nmol/L), whereas in participants with inadequate 25(OH)D level (< 50 nmol/L) after eight weeks of intervention, a median rise of 8.2 nmol/L was observed.
While comparing the obtained results with studies by other authors, it may be supposed that it is a general association—in groups with lower baseline 25(OH)D levels, a higher effect of intervention may be observed, so it may confirm that the baseline 25(OH)D blood level plays an important role. In a similar intervention study, lasting eight weeks, conducted in wintertime in Iceland, Spain, and Ireland, in which its participants (mean baseline 25(OH)D blood level 61.9 nmol/L) consumed around 450 g of salmon per week (compared to 350 g per week in our study), the mean rise of 25(OH)D was 8.4 nmol/L [40]. In another study conducted in Finland, on participants with a much higher mean baseline 25(OH)D level of 124.0 nmol/L, no significant increase in 25(OH)D was noted when consuming 300–600 g of fatty fish (including salmon) per week after eight weeks of intervention [41]. However, most studies of this type are small intervention studies with a limited number of participants, therefore comparing the obtained results with the conclusions from a meta-analysis summarizing the most essential results may be helpful. According to a meta-analysis of Lehmann et al. [29], the mean change in 25(OH)D for interventions lasting 4–8 weeks was 3.8 nmol/L; whereas in intervention groups with an inadequate mean 25(OH)D baseline (< 50 nmol/L), the change was 6.1 nmol/L; and in groups with adequate (≥ 50 nmol/L) 25(OH)D blood levels at baseline, the change was only 3.9 nmol/L. Taking into account the results of various studies, presented above, it may be confirmed that the most important factor for the efficacy may be the baseline 25(OH)D level.
However, in the presented study in the total study group, a decrease of 25(OH)D level after four weeks of intervention (phase I) was stated and later on (phase II), an increase (compared to the level after four weeks) was observed. The decline is very surprising, as salmon is known to be a good source of vitamin D [22,26], and in numerous studies, an increase in 25(OH)D was shown, also only after a four-week-long intervention of salmon intake in the winter [29]. Nevertheless, a recent intervention study conducted in Norway indicated that even a weekly consumption of 750 g (compared to 350 g in the presented study) of salmon for eight weeks was not sufficient to prevent the 25(OH)D decrease [42]. In that study, 25(OH)D decreased both in the salmon intervention and the control group, however, the decline was significantly lower in the salmon group compared to the control group.
What should be underlined is that the intervention period in the referred study [42] was from August/September to October/November, whereas in the presented study it was later—from October to December. Therefore, the decline seen in the presented study from week 0 to week 4 may correspond to the one observed in the Norwegian study (after eight weeks of intervention). In the presented study, the amount of salmon consumed was more than two times less than in the Norwegian one, and still in the second part of the intervention (from week four to week eight) an increase in 25(OH)D was observed. Unfortunately, to our best knowledge, the reason why such high amounts of dietary vitamin D from fish do not contribute to an immediate increase of 25(OH)D is not yet described or well known. There are only some hypotheses that could be listed.
The decrease may be attributed to a lack of adequate sunshine exposure to cause skin vitamin D synthesis during the time of intervention. From other studies, it is known that in countries such as Poland, skin synthesis of vitamin D is observed only from April to October (if the sunshine exposure is adequate) [20]. According to a recent Polish study [43], the highest levels of 25(OH)D in Poland are observed in August and the lowest in January, which could be explained by insolation and 25(OH)D synthesis during summer and the mobilization of vitamin D stored in the body (during the summer months) in the winter.
This hypothesis corresponds to the initial decrease of 25(OH)D levels in the presented study, which was performed from October to December. Therefore, it may be assumed that in phase I (until week four), not dietary vitamin D, but rather previously stored vitamin D had been used by the organism causing the constant decrease of 25(OH)D blood level, but in phase II (from week five to week eight), in which not enough vitamin D was stored in the body anymore, the daily intake of 50 g of fish and dietary vitamin D provided must have been intensively stored and metabolized to improve its status. Other studies also emphasize that it is the vitamin D storage from sun exposure and its release from fat tissues in winter that is the major factor contributing to 25(OH)D levels throughout the year [44], and dietary vitamin D is associated with 25(OH)D mainly in the winter and spring [45], in which perhaps not that much vitamin D is left in fat tissue and, therefore, the body must depend on vitamin D from food sources. This could also be the reason for the observed impact of baseline vitamin D status (adequate or inadequate) on 25(OH)D changes throughout the study, since in participants with inadequate vitamin D status, a lower decrease in phase I and a higher increase in phase II were seen, compared to participants with adequate vitamin D status at baseline.
Another possible explanation could be the difference in dietary vitamin D intake throughout the study. The statistical comparison of participants with inadequate (< 50 nmol/L) and adequate (≥ 50 nmol/L) 25(OH)D levels at baseline showed that at week four (t4) participants with adequate (≥ 50 nmol/L) 25(OH)D levels had a close to significant (p = 0.0515) higher vitamin D intake (median = 10.65 µg) in the first part of the intervention (t0 to t4) compared to the ones with inadequate (< 50 nmol/L) 25(OH)D levels (median intake = 9.73 µg). What should be noted is that the dietary vitamin D intake of participants with adequate (≥ 50 nmol/L) 25(OH)D levels covered the recommended 10 µg [11,25,26], which was also assumed in the study. Therefore, the possible reason for having an adequate 25(OH)D level at week four could be the higher (covering the recommended 10 µg) intake of vitamin D in the preceding time (from t0 to t4). At week eight, the vitamin D intakes did not differ significantly between groups (p = 0.3411), therefore the influence of vitamin D intake on different outcomes at that time remains unclear.
There are also other possible explanations, such as levels of other nutrients, that are related to the metabolism of vitamin D [46]. It may have been influenced by a decreased calcium level prior to the study [47]. This level was not assessed in the presented study, but if this level is lowered, it may influence not only the 25(OH)D level, but also the 1,25(OH)2D level, and the activity of 25(OH)D 1-α-hydroxylase [47].
Therefore, it may be hypothesized that apart from baseline 25(OH)D levels, it is the starting time of intervention and the dietary intake of vitamin D and other nutrients that play a big role in the outcomes of such short-term fish intake interventions. Other hypothetical possible explanations to such intervention outcomes could be that the digestive system needs to adjust to utilize vitamin D from the smoked salmon. Another could be that the metabolism and storage of vitamin D are faster in the case of high dietary supply (intervention) while the levels of vitamin D stored from the summer exposure are also high, which might lead to lower 25(OH)D levels because the whole consumed amount of vitamin D is converted to other metabolites in a dynamic way. Last but not least, the vitamin D metabolism might have other various pathways depending on the baseline level, exposure, dietary intake, and applied intervention, which we are not yet aware of.
Based on the meta-analysis of Lehmann et al. [29], it may be indicated that the length of the intervention also plays a key role—short-term studies (4-8 weeks) revealed a mean difference of 3.8 nmol/L and long-term studies (around six months) revealed 8.3 nmol/L [29]. If the interventions last longer, there is more time for a change of 25(OH)D. Therefore, it may be supposed that prolonging the conducted intervention would have resulted in a higher increase of 25(OH)D in the studied group. It may be hypothesized especially for participants with an adequate 25(OH)D level for whom after eight weeks of intervention a lower 25(OH)D serum level (median 56.8 nmol/L) than at baseline (median 70.4 nmol/L) was still observed, but higher than after four weeks of intervention (median 45.4 nmol/L), so a progressive increase may be supposed.
In spite of a number of arguments for choosing salmon as a vitamin D source in diet, namely its availability, as well as the content of nutrients and other components, the price of this product is quite high [48], contributing to low consumption in Poland (in 2017: 0.63 kg/person/year) [48]. There are other much cheaper (and therefore consumed more often) fish species available in Poland with significant vitamin D and combined EPA and DHA content, as well as low mercury and dioxin levels, that should be recommended, such as herring and rainbow trout. Both those species have very high (> 15 mg/g) combined EPA and DHA content, low (≤ 0.1μg/g) mercury levels, as well as quite low (0.5–4 pg TEQ/g) dioxin content, so according to the FAO and WHO [32] similarly as in the case of farmed Atlantic salmon, consuming them has more benefits than risks. Their prices in Poland are lower than salmon and they are as follows: rainbow trout—23.62 PLN/kg (approx. 5.42 €/kg) and herring—16.03 PLN/kg (approx. 3.68 €/kg), compared to 57.90 PLN/kg for salmon (approx. 13.28 €/kg) [48].
Moreover, herring and rainbow trout contain significant amounts of vitamin D: 19.00 μg and 13.50 μg/100 g, respectively [22]. There were some single intervention studies in which participants consumed 750 g/week of herring for six weeks [49] or 400–600 g/week of fatty fish including herring and rainbow trout for eight weeks [42] which did not reveal any significant effect of the applied dietary intervention on total 25(OH)D. What should be pointed out is that the study groups consisted of only 32 [49] and 11 participants [41]. Therefore, similar intervention studies with herring or rainbow trout should be conducted in larger study groups in order to explore the influence of consumption of those species on 25(OH)D blood levels. If they also have a positive influence on vitamin D status, it could have a greater impact on Polish people to recommend them to eat more of those fish species, as they can afford and already consume them in higher amounts than salmon (herring 2.56, trout 0.50 kg/person/year in 2017) [48].
According to the American Heart Association [50], as well as the Polish National Food and Nutrition Institute [51], the recommended fish (especially fatty fish) intake is at least two times a week. Fatty fish include the fish species mentioned above such as salmon, herring, and rainbow trout, which are good sources of vitamin D, and should not be reduced from the diet, as they contain less mercury and dioxins than other species. From other studies, it is known that fish intake is the most influential food source contributor to vitamin D intake [52,53], and there may be a strong correlation between fatty fish intake and 25(OH)D levels [54]. A recent cross-sectional Norwegian study revealed that for a median vitamin D intake of 10.3 μg, the mean 25(OH)D level was 64.0 nmol/L, while the prevalence of deficiency (defined as 25(OH)D < 50 nmol/L) was only 24.7%; in such a situation, a low vitamin D deficiency prevalence was observed, even in winter [55]. This suggests that with an adequate vitamin D intake (at least 10 μg/day) it is possible to achieve an adequate 25(OH)D level, maybe even in seasons with limited sunshine exposure such as the autumn and winter seasons in Poland. It corresponds with the obtained results, as even as short a period as eight weeks of dietary intervention of adequate vitamin D intake influenced the 25(OH)D levels and was revealed to be a promising option.
The novelty of the study is the fact that it was the first fish intake intervention study to asses 25(OH)D levels in a Polish population. Moreover, it is one of the first fish intake intervention studies in which a decrease in 25(OH)D was observed despite high salmon intake. The hypothetical explanations for that are listed above. Nevertheless, this indicates that this matter needs further study.
Although the presented study was the first fish intervention study conducted in Poland to access the efficacy of such intervention on 25(OH)D serum levels, limitations of the study should be indicated. The most important issue is associated with the fact that in the presented study there was no control group with no dietary intervention, which makes it more challenging to draw conclusions. However, this study is not the first one to analyze the influence of fish intake intervention on vitamin D status (measured as total 25(OH)D). Similar studies were conducted in other countries (but not in Poland), such as one in Iceland, Spain, and Ireland [39], with similar dietary intervention and similar results. Thus, it can be hypothesized that in the present study, the reason for the recovery of 25(OH)D was also due to fish intake and the presented study is of great importance, despite the lack of a control group.
Taking it into account, it must be stated that this matter needs further study, as there are not many studies conducted on that topic, and, what has to be underlined, there were no such studies in Poland, so far. Finally, the studies conducted in other countries are frequently carried out on very specific participants such as prisoners [56], sex offenders [57], overweight individuals following a low-calorie diet [39], and 8-9-year-old children [58], therefore, there is a great need for similar intervention studies (conducted using various, but defined fish species) on larger, homogenous study groups covering various ages for both male and female participants.

5. Conclusions

Although in the presented intervention study an initial decline of 25(OH)D blood level was observed (probably connected to the starting time of the study), afterward the daily salmon intake contributed to its increase. Based on the observed results, it may be stated that the baseline 25(OH)D status is an important determinant of the intervention effectiveness during the autumn season, as it is more effective in participants with inadequate vitamin D status. It may be concluded that an increase in farmed Atlantic salmon intake may be a good way to improve vitamin D status, especially in vitamin D-deficient individuals.

Author Contributions

D.G. made conception; Z.U. and D.G. performed the research; Z.U. and D.G. analyzed the data; and Z.U. and D.G. wrote the paper. All authors have read and agreed to the published version of the manuscript.

Funding

This research was funded by the Polish Ministry of Science and Higher Education within funds of the Institute of Human Nutrition Sciences, Warsaw University of Life Sciences (WULS), for scientific research. The experiment was financed by Suempol Polska Ltd.

Conflicts of Interest

The funders had no role in the design of the study; in the collection, analyses, or interpretation of data; in the writing of the manuscript; or in the decision to publish the results. None of the authors declare any conflict of interest.

References

  1. Lips, P.; van Schoor, N.M. The effect of vitamin D on bone and osteoporosis. Best Pract. Res. Clin. Endocrinol. Metab. 2011, 25, 585–591. [Google Scholar] [PubMed]
  2. Gao, Q.; Kou, T.; Zhuang, B.; Ren, Y.; Dong, X.; Wang, Q. The Association between Vitamin D Deficiency and Sleep Disorders: A Systematic Review and Meta-Analysis. Nutrients 2018, 10, 1395. [Google Scholar]
  3. Wang, J.; Lv, S.; Chen, G.; Gao, C.; He, J.; Zhong, H.; Xu, Y. Meta-analysis of the association between vitamin D and autoimmune thyroid disease. Nutrients 2015, 7, 2485–2498. [Google Scholar] [PubMed] [Green Version]
  4. Estébanez, N.; Gómez-Acebo, I.; Palazuelos, C.; Llorca, J.; Dierssen-Sotos, T. Vitamin D exposure and Risk of Breast Cancer: A meta-analysis. Sci. Rep. 2018, 8, 9039. [Google Scholar]
  5. Keum, N.; Lee, D.H.; Greenwood, D.C.; Manson, J.E.; Giovannucci, E. Vitamin D supplementation and total cancer incidence and mortality: A meta-analysis of randomized controlled trials. Ann. Oncol. 2019, 30, 733–743. [Google Scholar]
  6. Wang, M.; Liu, M.; Wang, C.; Xiao, Y.; An, T.; Zou, M.; Cheng, G. Association between vitamin D status and asthma control: A meta-analysis of randomized trials. Respir. Med. 2019, 150, 85–94. [Google Scholar]
  7. Christakos, S.; Dhawan, P.; Verstuyf, A.; Verlinden, L.; Carmeliet, G. Vitamin D: Metabolism, Molecular Mechanism of Action, and Pleiotropic Effects. Physiol. Rev. 2016, 96, 365–408. [Google Scholar]
  8. Caprio, M.; Infante, M.; Calanchini, M.; Mammi, C.; Fabbri, A. Vitamin D: Not just the bone. Evidence for beneficial pleiotropic extraskeletal effects. Eat. Weight Disord. Stud. Anorex. Bulim. Obes. 2017, 22, 27–41. [Google Scholar] [CrossRef]
  9. Durazo-Arvizu, R.A.; Tian, L.; Brooks, S.P.J.; Sarafin, K.; Cashman, K.D.; Kiely, M.; Merkel, J.; Myers, G.L.; Coates, P.M.; Sempos, C.T. The Vitamin D Standardization Program (VDSP) Manual for Retrospective Laboratory Standardization of Serum 25-Hydroxyvitamin D Data. J. AOAC Int. 2017, 100, 1234–1243. [Google Scholar] [CrossRef]
  10. Cashman, K.D.; Dowling, K.G.; Škrabáková, Z.; Gonzalez-Gross, M.; Valtueña, J.; De Henauw, S.; Moreno, L.; Damsgaard, C.T.; Michaelsen, K.F.; Mølgaard, C.; et al. Vitamin D deficiency in Europe: Pandemic? Am. J. Clin. Nutr. 2016, 103, 1033–1044. [Google Scholar] [CrossRef] [Green Version]
  11. National Academies Press (US). Institute of Medicine (US) Committee to Review Dietary Reference Intakes for Vitamin D and Calcium. In Dietary Reference Intakes for Calcium and Vitamin D; Ross, A.C., Taylor, C.L., Yaktine, A.L., Del Valle, H.B., Eds.; The National Academies Collection: Reports funded by National Institutes of Health; National Academies Press (US): Washington, DC, USA, 2011. [Google Scholar]
  12. Aspray, T.J.; Bowring, C.; Fraser, W.; Gittoes, N.; Javaid, M.K.; Macdonald, H.; Patl, S.; Selby, P.; Tanna, N.; Francis, R.M. National Osteoporosis Society Vitamin D Guideline Summary. Age Ageing 2014, 43, 592–595. [Google Scholar] [PubMed] [Green Version]
  13. Holick, M.F.; Binkley, N.C.; Bischoff-Ferrari, H.A.; Gordon, C.M.; Hanley, D.A.; Heaney, R.P.; Murad, M.H.; Weaver, C.M. Evaluation, Treatment, and Prevention of Vitamin D Deficiency: An Endocrine Society Clinical Practice Guideline. J. Clin. Endocrinol. Metab. 2011, 96, 1911–1930. [Google Scholar]
  14. EFSA Panel on Dietetic Products. N. and A. (NDA) Dietary reference values for vitamin D. EFSA J. 2016, 14, e04547. [Google Scholar] [CrossRef]
  15. Rusińska, A.; Płudowski, P.; Walczak, M.; Borszewska-Kornacka, M.K.; Bossowski, A.; Chlebna-Sokół, D.; Czech-Kowalska, J.; Dobrzańska, A.; Franek, E.; Helwich, E.; et al. Vitamin D Supplementation Guidelines for General Population and Groups at Risk of Vitamin D Deficiency in Poland-Recommendations of the Polish Society of Pediatric Endocrinology and Diabetes and the Expert Panel with Participation of National Specialist Consultants and Representatives of Scientific Societies-2018 Update. Front. Endocrinol. 2018, 9, 246. [Google Scholar]
  16. Gordon, C.M.; DePeter, K.C.; Feldman, H.A.; Grace, E.; Emans, S.J. Prevalence of Vitamin D Deficiency among Healthy Adolescents. Arch. Pediatr. Adolesc. Med. 2004, 158, 531–537. [Google Scholar]
  17. Andersen, R.; Mølgaard, C.; Skovgaard, L.T.; Brot, C.; Cashman, K.D.; Chabros, E.; Charzewska, J.; Flynn, A.; Jakobsen, J.; Kärkkäinen, M.; et al. Teenage girls and elderly women living in northern Europe have low winter vitamin D status. Eur. J. Clin. Nutr. 2005, 59, 533–541. [Google Scholar]
  18. ENNS: Étude Nationale Nutrition Santé /Enquêtes et Etudes /Nutrition et Santé /Maladies Chroniques et Traumatismes /Dossiers Thématiques /Accueil. Available online: http://invs.santepubliquefrance.fr/Dossiers-thematiques/Maladies-chroniques-et-traumatismes/Nutrition-et-sante/Enquetes-et-etudes/ENNS-etude-nationale-nutrition-sante (accessed on 25 June 2019).
  19. Calvo, M.S.; Whiting, S.J.; Barton, C.N. Vitamin D Intake: A Global Perspective of Current Status. J. Nutr. 2005, 135, 310–316. [Google Scholar]
  20. Webb, A.R.; Kline, L.; Holick, M.F. Influence of season and latitude on the cutaneous synthesis of vitamin D3: Exposure to winter sunlight in Boston and Edmonton will not promote vitamin D3 synthesis in human skin. J. Clin. Endocrinol. Metab. 1988, 67, 373–378. [Google Scholar]
  21. Schmid, A.; Walther, B. Natural Vitamin D Content in Animal Products. Adv. Nutr. 2013, 4, 453–462. [Google Scholar] [PubMed]
  22. Kunachowicz, H.; Przygoda, B.; Nadolna, I.; Iwanow, K. Tabele Składu i Wartości Odżywczej Żywności; Wydawnictwo Lekarskie PZWL: Warsaw, Poland, 2017. [Google Scholar]
  23. National Food Institute. European Nutrition and Health Report 2009; Elmadfa, I., Ed.; Karger: Basel, Switzerland; New York, NY, USA, 2009. [Google Scholar]
  24. Flynn, A.; Hirvonen, T.; Mensink, G.B. Intake of selected nutrients from foods, from fortification and from supplements in various European countries. Food Nutr. Res. 2009, 12, 2038. [Google Scholar]
  25. Nordiska Ministerrådet. Nordic Nutrition Recommendations 2012. Part 3: Vitamins A, D, E, K, Thiamin, Riboflavin, Niacin, Vitamin B6, Folate, Vitamin B12, Biotin, Pantothenic acid and Vitamin C; Nordisk Ministerråd: Copenhagen, Denmark, 2014. [Google Scholar]
  26. SACN Vitamin D and Health Report. Available online: https://www.gov.uk/government/publications/sacn-vitamin-d-and-health-report (accessed on 20 May 2019).
  27. Bailey, R.L.; Dodd, K.W.; Goldman, J.A.; Gahche, J.J.; Dwyer, J.T.; Moshfegh, A.J.; Sempos, C.T.; Picciano, M.F. Estimation of Total Usual Calcium and Vitamin D Intakes in the United States. J. Nutr. 2010, 140, 817–822. [Google Scholar] [CrossRef] [PubMed] [Green Version]
  28. Benjamin, R.M. Bone health: Preventing osteoporosis. J. Am. Diet. Assoc. 2010, 110, 498. [Google Scholar] [CrossRef] [PubMed] [Green Version]
  29. Lehmann, U.; Gjessing, H.R.; Hirche, F.; Mueller-Belecke, A.; Gudbrandsen, O.A.; Ueland, P.M.; Mellgren, G.; Lauritzen, L.; Lindqvist, H.; Hansen, A.L.; et al. Efficacy of fish intake on vitamin D status: A meta-analysis of randomized controlled trials. Am. J. Clin. Nutr. 2015, 102, 837–847. [Google Scholar] [CrossRef] [PubMed] [Green Version]
  30. Body Mass Index—BMI. Available online: http://www.euro.who.int/en/health-topics/disease-prevention/nutrition/a-healthy-lifestyle/body-mass-index-bmi (accessed on 24 July 2019).
  31. United States Department of Agriculture, Agricultural Research Service. Available online: https://fdc.nal.usda.gov/fdc-app.html#/food-details/337771/nutrients (accessed on 24 March 2020).
  32. Fish and Seafood Market in Poland. 2018. Available online: https://gain.fas.usda.gov/Recent%20GAIN%20Publications/2017%20Fish%20and%20Seafood%20Market%20in%20Poland_Warsaw_Poland_2-21-2018.pdf (accessed on 19 August 2019).
  33. FAO/WHO. Report of the Joint FAO/WHO Expert Consultation on the Risks and Benefits of Fish Consumption: Rome, 25–29 January 2010; FAO: Rome, Italy, 2011. [Google Scholar]
  34. Jakobsen, J.; Smith, C.; Bysted, A.; Cashman, K.D. Vitamin D in Wild and Farmed Atlantic Salmon (Salmo Salar)—What Do We Know? Nutrients 2019, 11, 982. [Google Scholar] [CrossRef] [PubMed] [Green Version]
  35. International Society for Advancement of Kinanthropometry. International Standards for Anthropometric Assessment; International Society for the Advancement of Kinanthropometry: Potchefstroom, South Africa, 2001. [Google Scholar]
  36. Reference Values DACH-Referenzwerte. Available online: http://www.sge-ssn.ch/grundlagen/lebensmittel-und-naehrstoffe/naehrstoffempfehlungen/dachreferenzwerte/ (accessed on 2 August 2019).
  37. Jarosz, M.; Rychlik, E.; Stoś, K.; Wierzejska, R.; Wojtasik, A.; Charzewska, J.; Mojska, H.; Szponar, L.; Sajór, I.; Kłosiewicz-Latoszek, L.; et al. Normy Żywienia dla Populacji Polski; Instytut Żywności i Żywienia: Warszawa, Poland, 2017. [Google Scholar]
  38. Głąbska, D.; Guzek, D.; Sidor, P.; Włodarek, D. Vitamin D Dietary Intake Questionnaire Validation Conducted among Young Polish Women. Nutrients 2016, 8, 36. [Google Scholar] [CrossRef] [Green Version]
  39. Ogedegbe, G.; Pickering, T. Principles and techniques of blood pressure measurement. Cardiol. Clin. 2010, 28, 571–586. [Google Scholar] [CrossRef] [Green Version]
  40. Lucey, A.J.; Paschos, G.K.; Cashman, K.D.; Martínéz, J.A.; Thorsdottir, I.; Kiely, M. Influence of moderate energy restriction and seafood consumption on bone turnover in overweight young adults. Am. J. Clin. Nutr. 2008, 87, 1045–1052. [Google Scholar] [CrossRef] [Green Version]
  41. Erkkilä, A.T.; Schwab, U.S.; de Mello, V.D.F.; Lappalainen, T.; Mussalo, H.; Lehto, S.; Kemi, V.; Lamberg-Allardt, C.; Uusitupa, M.I.J. Effects of fatty and lean fish intake on blood pressure in subjects with coronary heart disease using multiple medications. Eur. J. Nutr. 2008, 47, 319–328. [Google Scholar] [CrossRef]
  42. Bratlie, M.; Hagen, I.V.; Helland, A.; Midttun, Ø.; Ulvik, A.; Rosenlund, G.; Sveier, H.; Mellgren, G.; Ueland, P.M.; Gudbrandsen, O.A. Five salmon dinners per week was not sufficient to prevent the reduction in serum vitamin D in autumn at 60° north latitude: A randomised trial. Br. J. Nutr. 2019, 123, 1–21. [Google Scholar] [CrossRef]
  43. Smyczyńska, J.; Smyczyńska, U.; Stawerska, R.; Domagalska-Nalewajek, H.; Lewiński, A.; Hilczer, M. Seasonality of vitamin D concentrations and the incidence of vitamin D deficiency in children and adolescents from central Poland. Pediatr. Endocrinol. Diabetes Metab. 2019, 25, 54–59. [Google Scholar] [CrossRef]
  44. Diffey, B.L. Modelling vitamin D status due to oral intake and sun exposure in an adult British population. Br. J. Nutr. 2013, 110, 569–577. [Google Scholar] [CrossRef] [PubMed] [Green Version]
  45. Macdonald, H.M.; Mavroeidi, A.; Barr, R.J.; Black, A.J.; Fraser, W.D.; Reid, D.M. Vitamin D status in postmenopausal women living at higher latitudes in the UK in relation to bone health, overweight, sunlight exposure and dietary vitamin D. Bone 2008, 42, 996–1003. [Google Scholar] [CrossRef] [PubMed]
  46. Dale, M.M.; Haylett, D.G. Rang and Dale’s Pharmacology Flashcards; Churchill Livingstone Elsevier: London, UK, 2014. [Google Scholar]
  47. Kumar, R. The metabolism and mechanism of action of 1,25-dihydroxyvitamin D3. Kidney Int. 1986, 30, 793–803. [Google Scholar] [CrossRef] [Green Version]
  48. Rynek Ryb [Fish Market]. Available online: https://www.ierigz.waw.pl/publikacje/analizy-rynkowe/rynek-ryb/20873,3,3,0,nr-26-2017-rynek-ryb.html (accessed on 16 August 2019).
  49. Scheers, N.; Lindqvist, H.; Langkilde, A.M.; Undeland, I.; Sandberg, A.-S. Vitamin B12 as a potential compliance marker for fish intake. Eur. J. Nutr. 2014, 53, 1327–1333. [Google Scholar] [CrossRef] [PubMed]
  50. Fish and Omega-3 Fatty Acids. Available online: https://www.heart.org/en/healthy-living/healthy-eating/eat-smart/fats/fish-and-omega-3-fatty-acids (accessed on 19 August 2019).
  51. Piramida Zdrowego Żywienia i Aktywności Fizycznej [Food and Physical Activity Pyramid]. Available online: http://www.izz.waw.pl/attachments/article/7/Piramida%20Zdrowego%20%C5%BBywienia%20i%20Aktywno%C5%9Bci%20Fizycznej%20Broszura.pdf (accessed on 19 August 2019).
  52. Becker, W.; Pearson, M.; Metod Och Resultatanalys. Livsmedelsverket, Uppsala, Sverige, Riksmaten 1997–1998. Available online: https://www.livsmedelsverket.se/globalassets/matvanor-halsa-miljo/kostrad-matvanor/matvaneundersokningar/riksmaten-1997-1998-resultat-och-metodrapport.pdf (accessed on 19 August 2019).
  53. Pietinen, P.; Paturi, M.; Reinivuo, H.; Tapanainen, H.; Valsta, L.M. FINDIET 2007 Survey: Energy and nutrient intakes. Public Health Nutr. 2010, 13, 920–924. [Google Scholar] [CrossRef] [PubMed] [Green Version]
  54. Van der Meer, I.M.; Boeke, A.J.P.; Lips, P.; Grootjans-Geerts, I.; Wuister, J.D.; Devillé, W.L.J.M.; Wielders, J.P.M.; Bouter, L.M.; Middelkoop, B.J.C. Fatty fish and supplements are the greatest modifiable contributors to the serum 25-hydroxyvitamin D concentration in a multiethnic population. Clin. Endocrinol. Oxf. 2008, 68, 466–472. [Google Scholar] [CrossRef] [Green Version]
  55. Petrenya, N.; Lamberg-Allardt, C.; Melhus, M.; Broderstad, A.R.; Brustad, M. Vitamin D status in a multi-ethnic population of northern Norway: The SAMINOR 2 Clinical Survey. Public Health Nutr. 2019, 1–15. [Google Scholar] [CrossRef] [Green Version]
  56. Hansen, A.L.; Dahl, L.; Bakke, L.; Frøyland, L.; Thayer, J.F. Fish consumption and heart rate variability: Preliminary results. J. Psychophysiol. 2010, 24, 41–47. [Google Scholar] [CrossRef]
  57. Hansen, A.L.; Dahl, L.; Olson, G.; Thornton, D.; Graff, I.E.; Frøyland, L.; Thayer, J.F.; Pallesen, S. Fish Consumption, Sleep, Daily Functioning, and Heart Rate Variability. J. Clin. Sleep Med. 2014, 10, 567–575. [Google Scholar] [CrossRef] [Green Version]
  58. Vuholm, S.; Teisen, M.N.; Buch, N.G.; Stark, K.D.; Jakobsen, J.; Mølgaard, C.; Lauritzen, L.; Damsgaard, C.T. Is high oily fish intake achievable and how does it affect nutrient status in 8-9-year-old children? The FiSK Junior trial. Eur. J. Nutr. 2019, 59, 1205–1218. [Google Scholar] [CrossRef]
Figure 1. Study design and number of participants.
Sustainability 12 02829 g001
Table 1. Characteristics of the studied group accompanied by vitamin D status throughout the study.
VariablesMean ± SDMedian (Min–Max)
CharacteristicsAge (years)22.9 ± 1.623.0 * (20.0–28.0)
BMI (kg/m2)21.43 ± 2.4921.27 (16.92–27.96)
Serum level25(OH)D for t0 (nmol/L)58.4 ± 20.257.1 (19.7–93.1)
25(OH)D for t4 (nmol/L)41.2 ± 14.139.9 * (15.1–90.3)
25(OH)D for t8 (nmol/L)52.5 ± 11.454.1 (25.6–72.9)
Change of serum level25(OH)D change from t0 to t4 (nmol/L)−17.2 ± 13.9−16.7 (−44.5–11.4)
25(OH)D change from t4 to t8 (nmol/L)11.3 ± 12.28,8 * (−18.5–38.8)
25(OH)D change from t0 to t8 (nmol/L)−6.0 ± 16.1−8.1 (−36.8–24.2)
* non-parametric distribution (verified using Shapiro–Wilk test; p ≤ 0.05); 25(OH)D—25-hydroxyvitamin D; t0—baseline; t4—after 4 weeks of intervention; t8—after 8 weeks of intervention.
Table 2. Dietary vitamin D intake in the studied group throughout the study.
VariablesMean ± SDMedian (Min–Max)p
Intake for t0 (µg)Total3.02 ± 1.362.79 * (1.04–7.74)-
25(OH)D < 50 nmol/L3.02 ± 1.632.66 * (1.04–7.74)0.7510
25(OH)D ≥ 50 nmol/L3.02 ± 1.202.90 * (1.09–5.99)
Intake for t4 (µg)Total10.08 ± 1.349.82 * (7.84–13.91)-
25(OH)D < 50 nmol/L9.88 ± 1.269.73 * (7.84–13.15)0.0515
25(OH)D ≥ 50 nmol/L10.73 ± 1.4610.65 * (8.62–13.91)
Intake for t8 (µg)Total9.85 ± 1.969.71 * (1.81–13.82)-
25(OH)D < 50 nmol/L9.44 ± 2.439.59 * (1.81–13.82)0.3411
25(OH)D ≥ 50 nmol/L10.11 ± 1.609.89 * (6.77–12.78)
* non-parametric distribution (verified using Shapiro–Wilk test; p ≤ 0.05); t0—baseline; t4—after 4 weeks of intervention; t8—after 8 weeks of intervention.
Table 3. Assessment of adequacy of vitamin D status throughout the study while compared with the reference values.
Serum 25-hydroxyvitamin D level
Inadequate
(<50 nmol/L) *
Adequate
(50–250 nmol/L) *
Potentially Toxic
(> 250 nmol/L) *
Before intervention18 (38%)29 (62%)0 (0%)
After 4 weeks of intervention36 (77%)11 (23%)0 (0%)
After 8 weeks of intervention18 (38%)29 (62%)0 (0%)
* reference values of 50 nmol/L and 250 nmol/L [11,25,36,37].
Table 4. Analysis of correlations between age, or BMI, and vitamin D status throughout the study.
VariablesAgeBMI
pRpR
Serum level25(OH)D for t0 (nmol/L)0.0880−0.25120.0419 *−0.2980
25(OH)D for t4 (nmol/L)0.5753 *−0.08380.0663 *−0.2701
25(OH)D for t8 (nmol/L)0.2300−0.17860.4038 *−0.1247
Change of serum level25(OH)D change from t0 to t4 (nmol/L)0.46300.10960.3604 *0.1364
25(OH)D change from t4 to t8 (nmol/L)0.4387 *0.11570.4776 *0.1062
25(OH)D change from t0 to t8 (nmol/L)0.2010−0.18970.1362 *0.2206
* Spearman rank correlation coefficient for non-parametric distributions (for parametric distribution Pearson correlation coefficient applied); 25(OH)D—25-hydroxyvitamin D; t0—baseline; t4—after 4 weeks of intervention; t8—after 8 weeks of intervention.
Table 5. Analysis of correlations between vitamin D status before intervention and its later levels and changes throughout the study.
VariablespR
Serum level25(OH)D for t4 (nmol/L)< 0.0001 *0.7474
25(OH)D for t8 (nmol/L)< 0.00010.6089
Change of serum level25(OH)D change from t0 to t4 (nmol/L)< 0.0001−0.7154
25(OH)D change from t4 to t8 (nmol/L)0.1257 *−0.2265
25(OH)D change from t0 to t8 (nmol/L)< 0.0001−0.8274
* Spearman rank correlation coefficient for non-parametric distributions (for parametric distribution Pearson correlation coefficient applied); 25(OH)D—25-hydroxyvitamin D; t0—baseline; t4—after 4 weeks of intervention; t8—after 8 weeks of intervention.
Table 6. Comparison of vitamin D status throughout the study between subgroups characterized by various baseline statuses.
VariablesInadequate 25(OH)D
(< 50 nmol/L)
Adequate 25(OH)D
(≥ 50 nmol/L)
Mean ± SDMedian (Min–Max)Mean ± SDMedian (Min–Max)p **
Serum level25(OH)D for t0 (nmol/L)37.5 ± 10.136.4 (19.7–48.9)71.4 ± 12.470.4 (53.2–93.1)<0.0001
25(OH)D for t4 (nmol/L)31.2 ± 8.829.2 (15.1–51.7)47.4 ± 13.345.4 (28.5–90.3) *<0.0001
25(OH)D for t8 (nmol/L)47.1 ± 12.746.8 (25.6–72.9) *55.8 ± 9.256.8 (39.8–72.1)0.0198
Change of serum level25(OH)D change from t0 to t4 (nmol/L)−5.0 ± 13.0−8.5 (−21.2–32.9)−17.4 ± 24.0−16.4 (−53.7–41.3)0.0501
25(OH)D change from t4 to t8 (nmol/L)15.9 ± 12.615.1 (−0.3–37.0)8.4 ± 11.27.1 (−18.5–38.8)0.0381
25(OH)D change from t0 to t8 (nmol/L)10.9 ± 16.08.2 (−10.3–52.0)−9.0 ± 23.9−6.7 (−52.0–53.0) *0.0005
* Distribution differs from normal; ** Student’s t-test (if normal distribution) or Mann–Whitney U test (if distribution differs from normal); 25(OH)D—25-hydroxyvitamin D; t0—baseline; t4—after 4 weeks of intervention; t8—after 8 weeks of intervention.

