Flood Depth‒Damage Curves for Spanish Urban Areas

 , , ,
, , , 
Abstract
1. Introduction
2. Literature Review and Analysis
2.1. Flood Damage Models
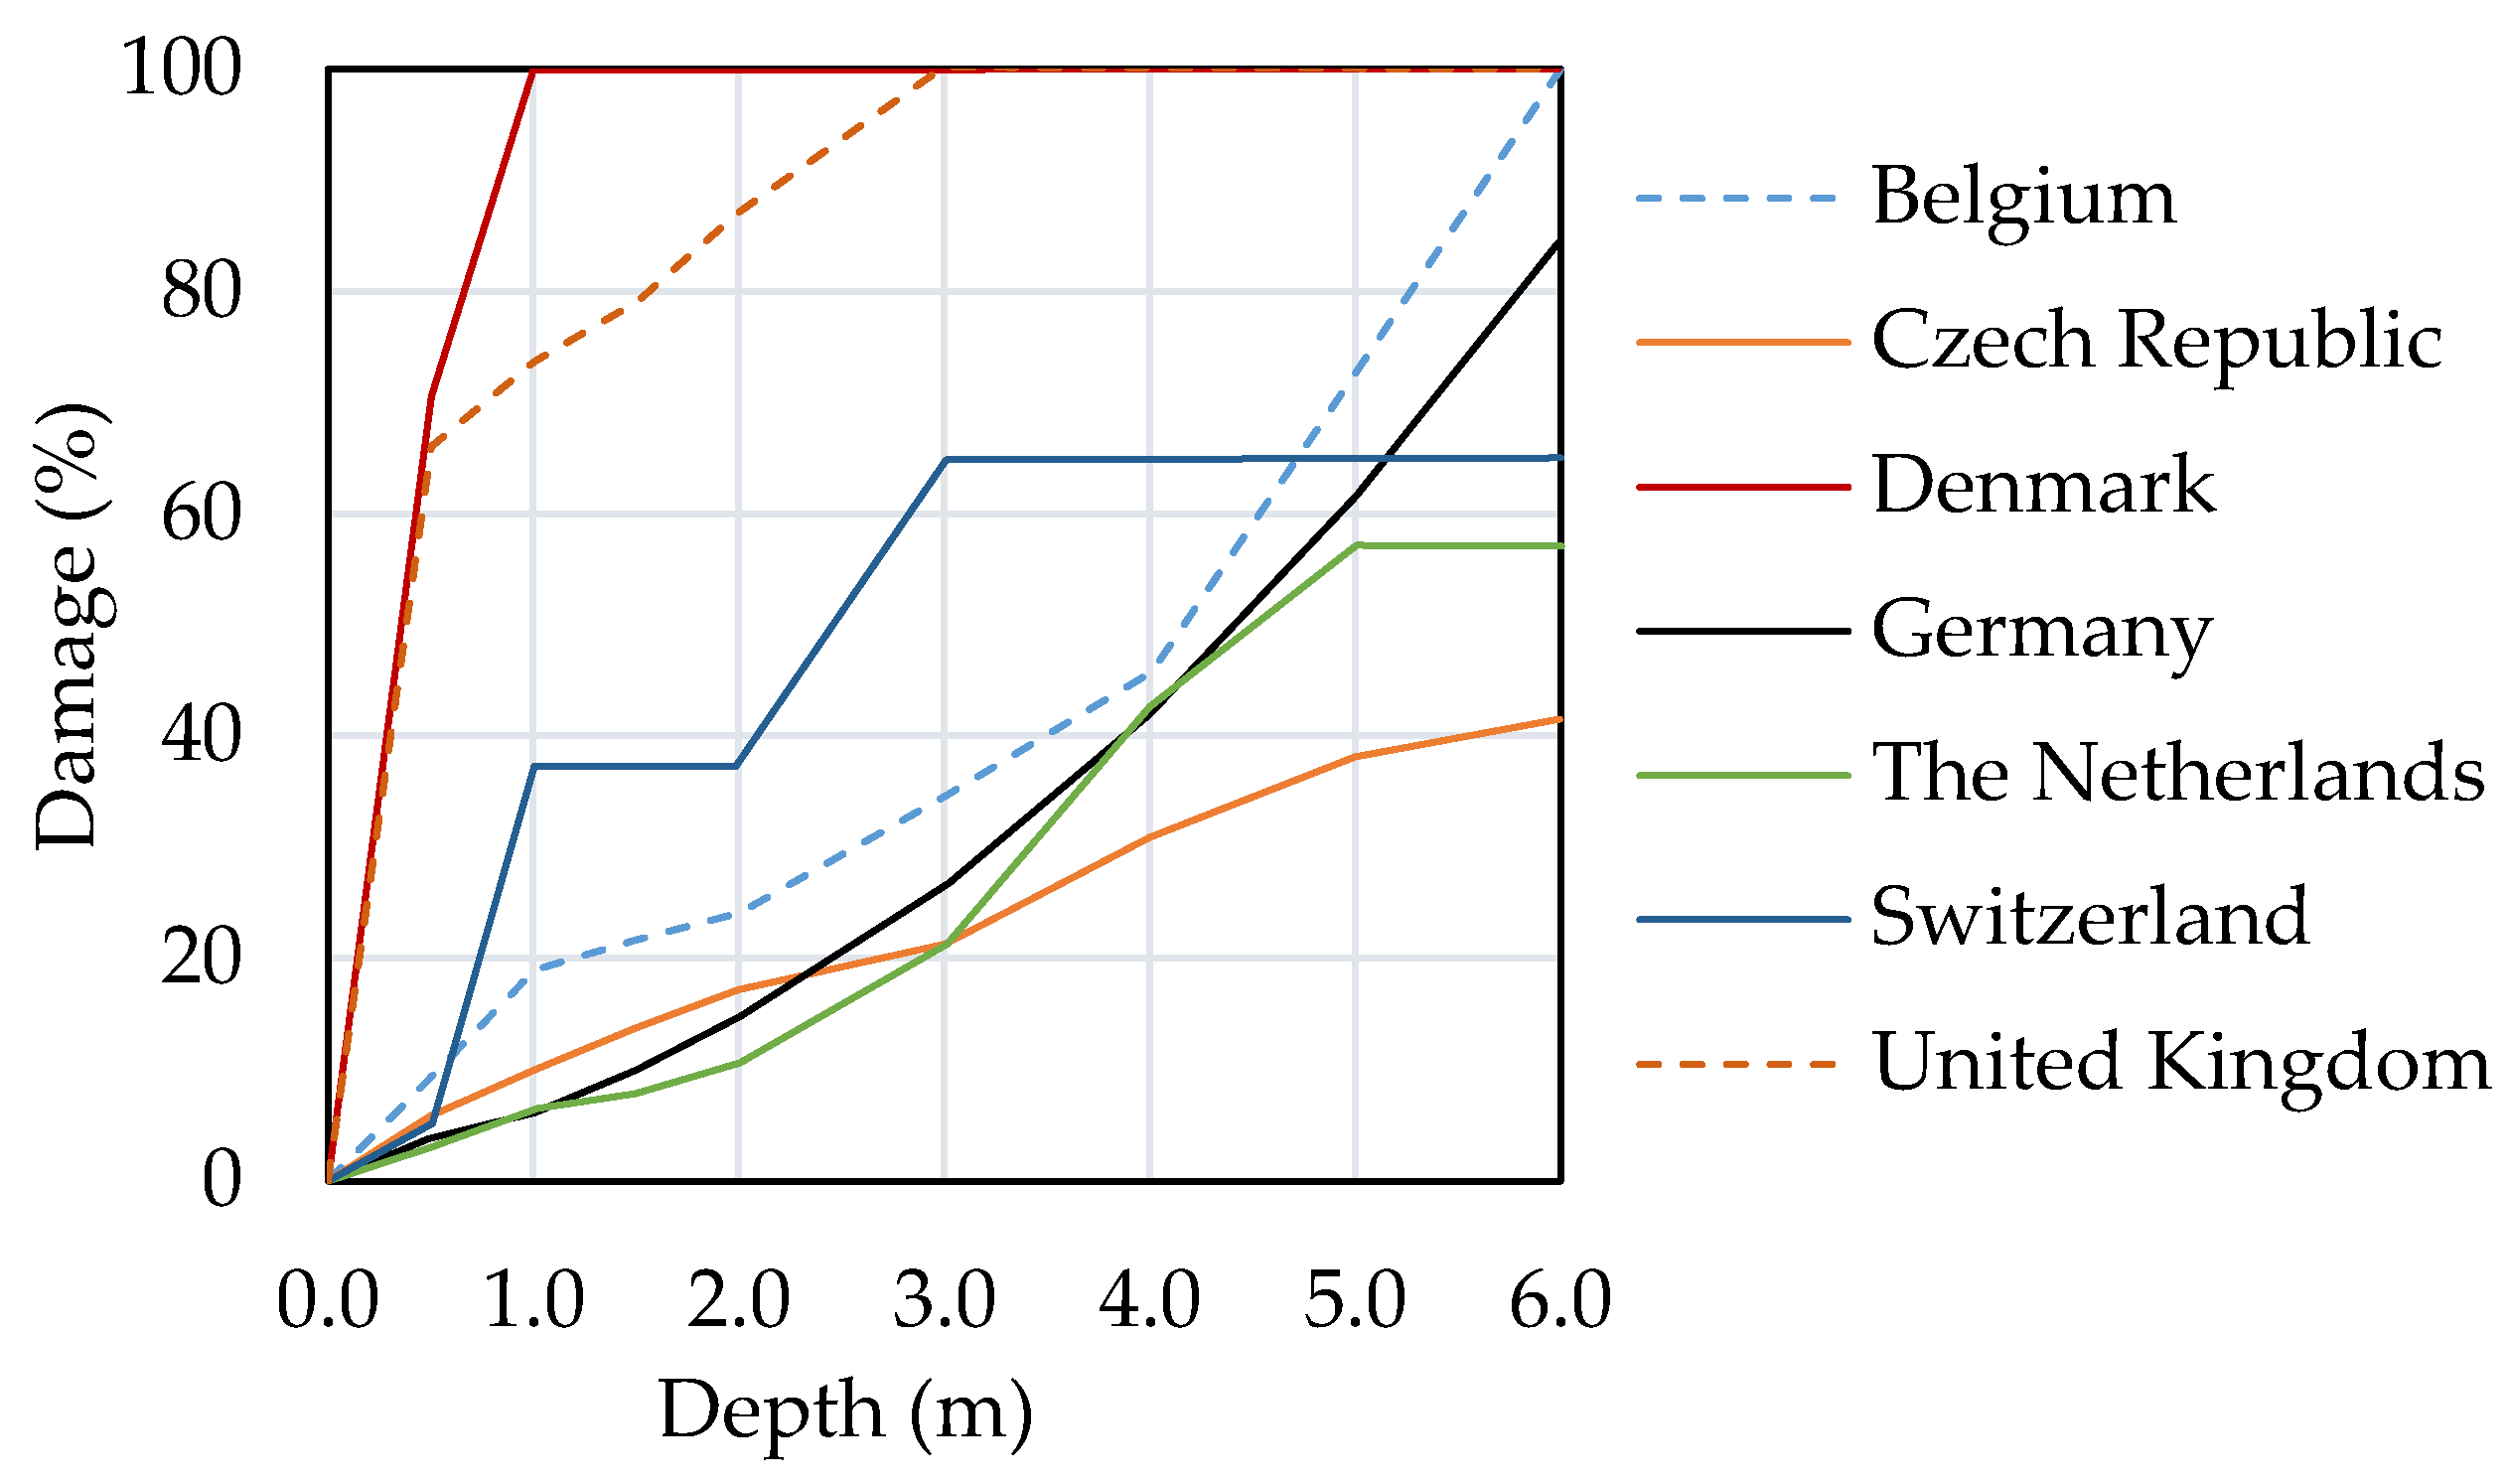
2.2. Depth‒Damage Curves in the World
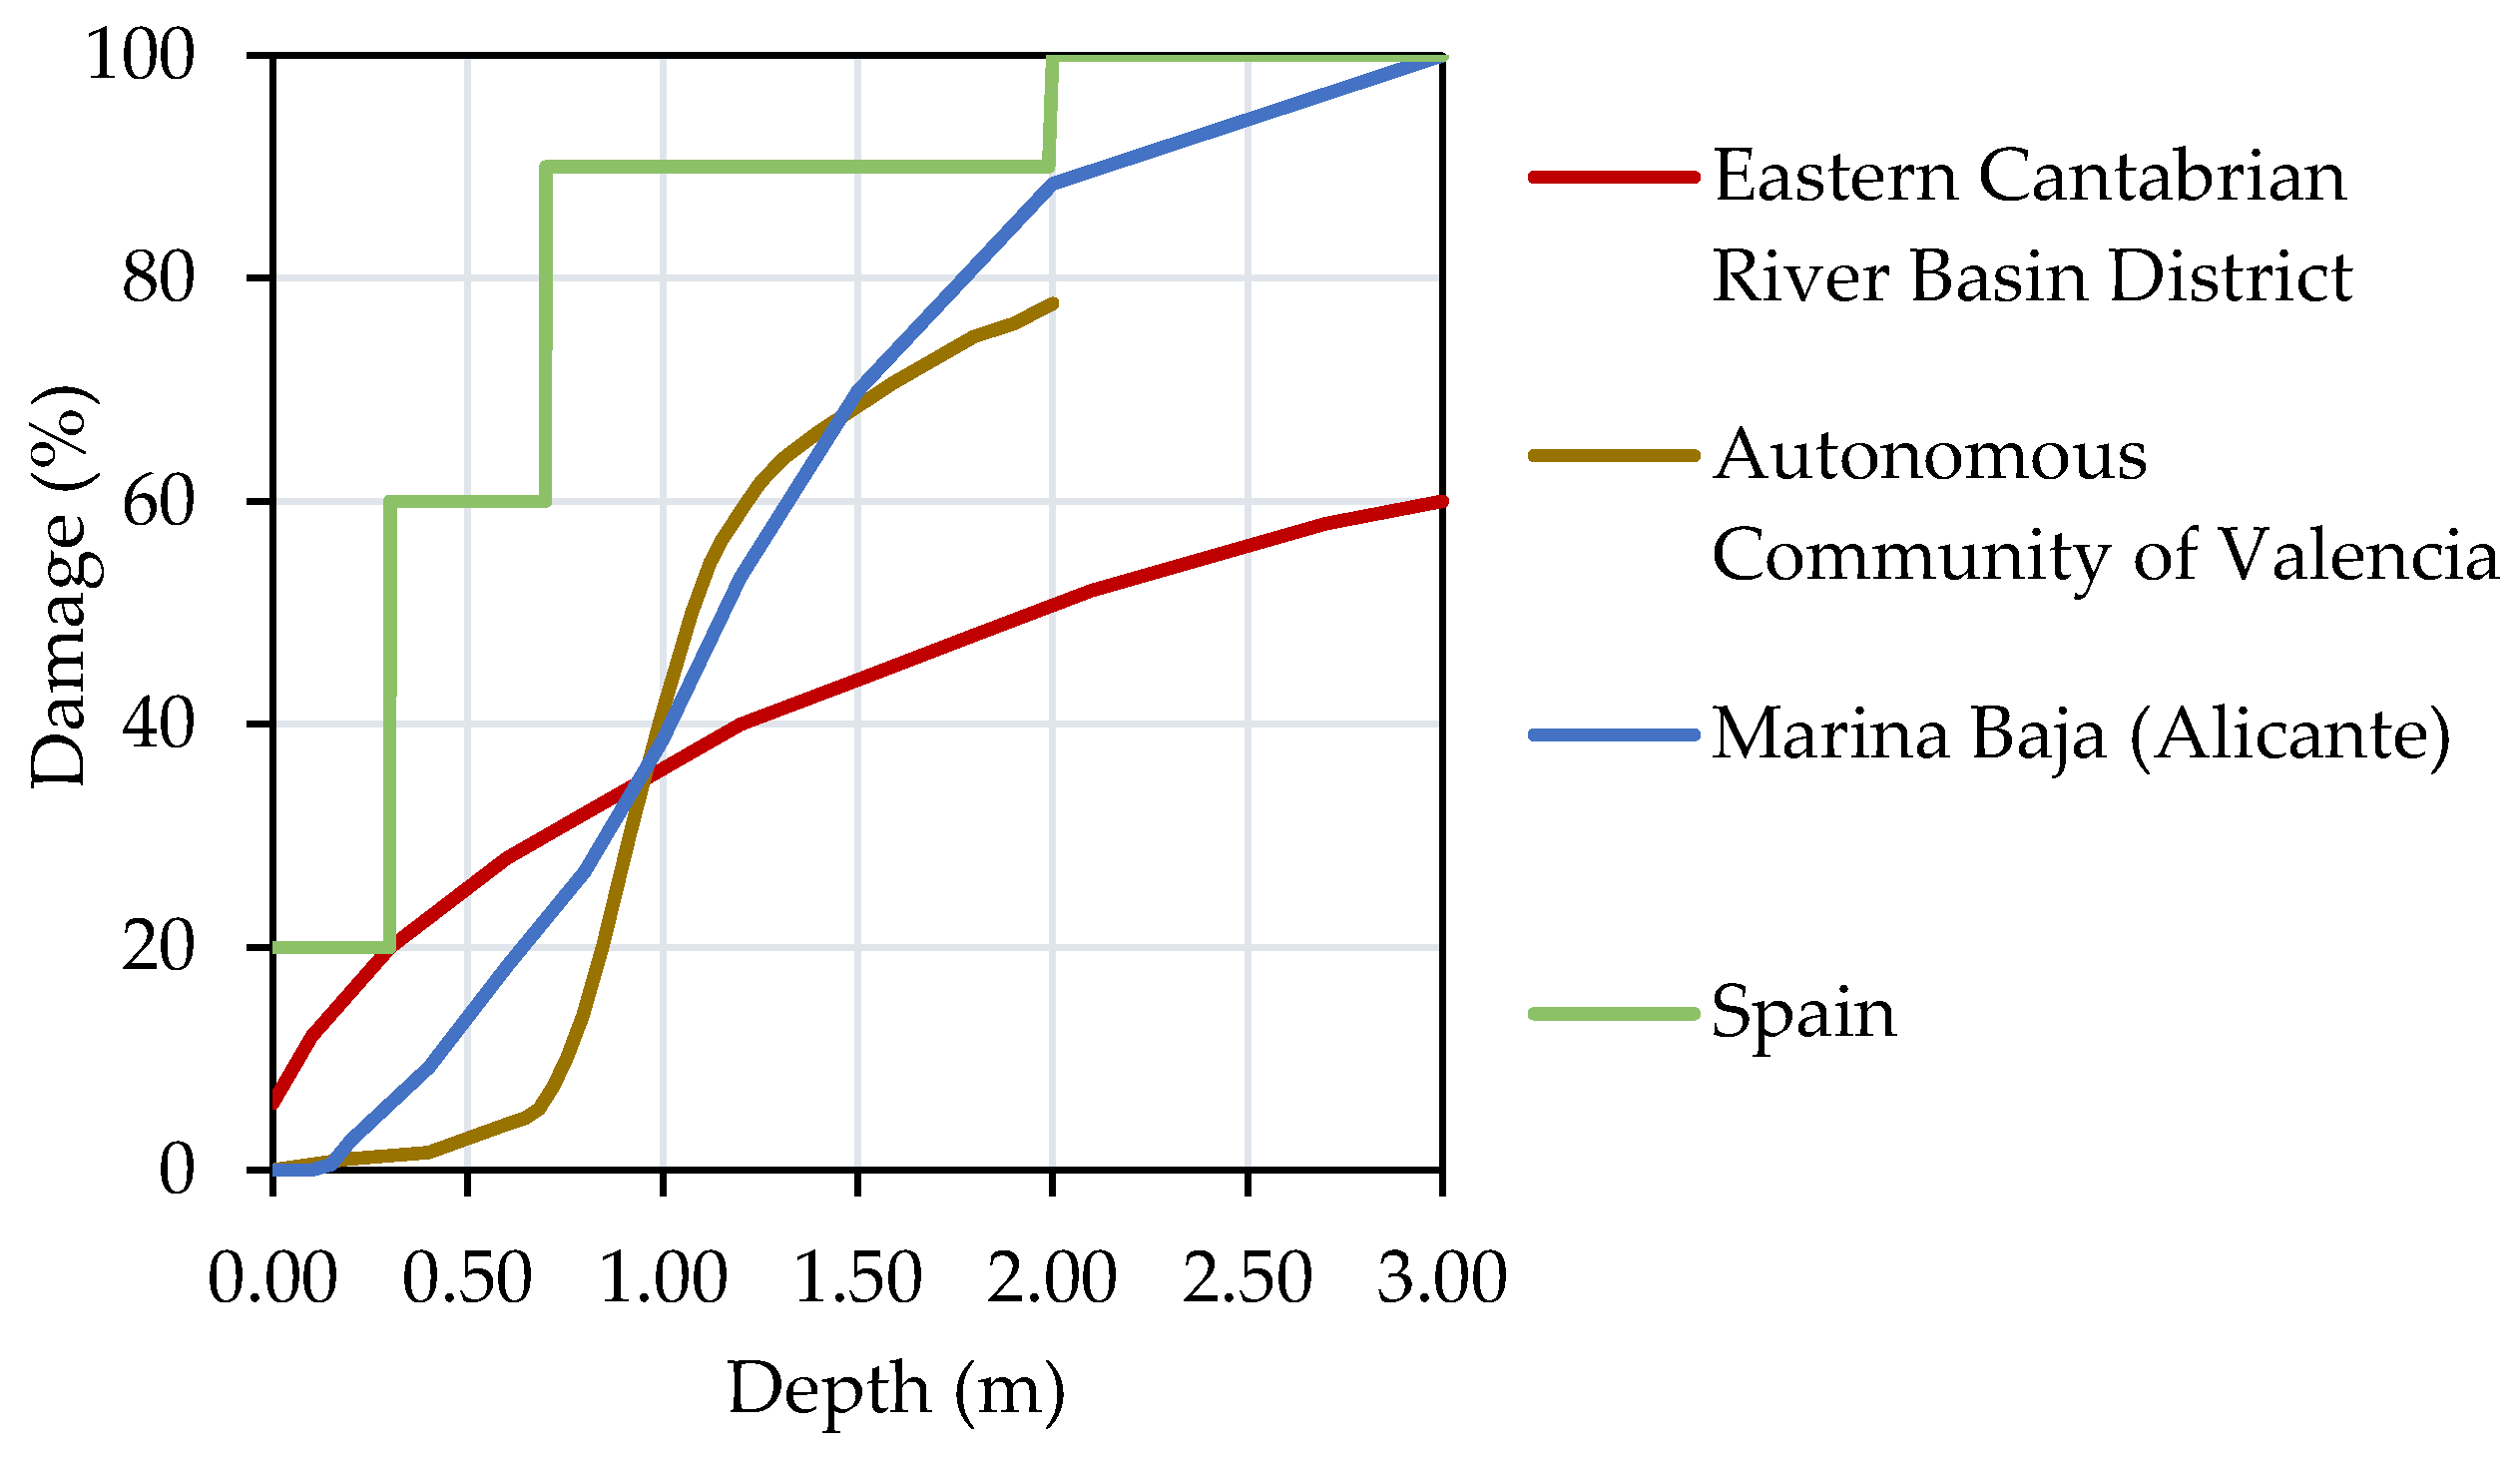
2.3. Depth‒Damage Curves in Spain
3. Materials and Methods
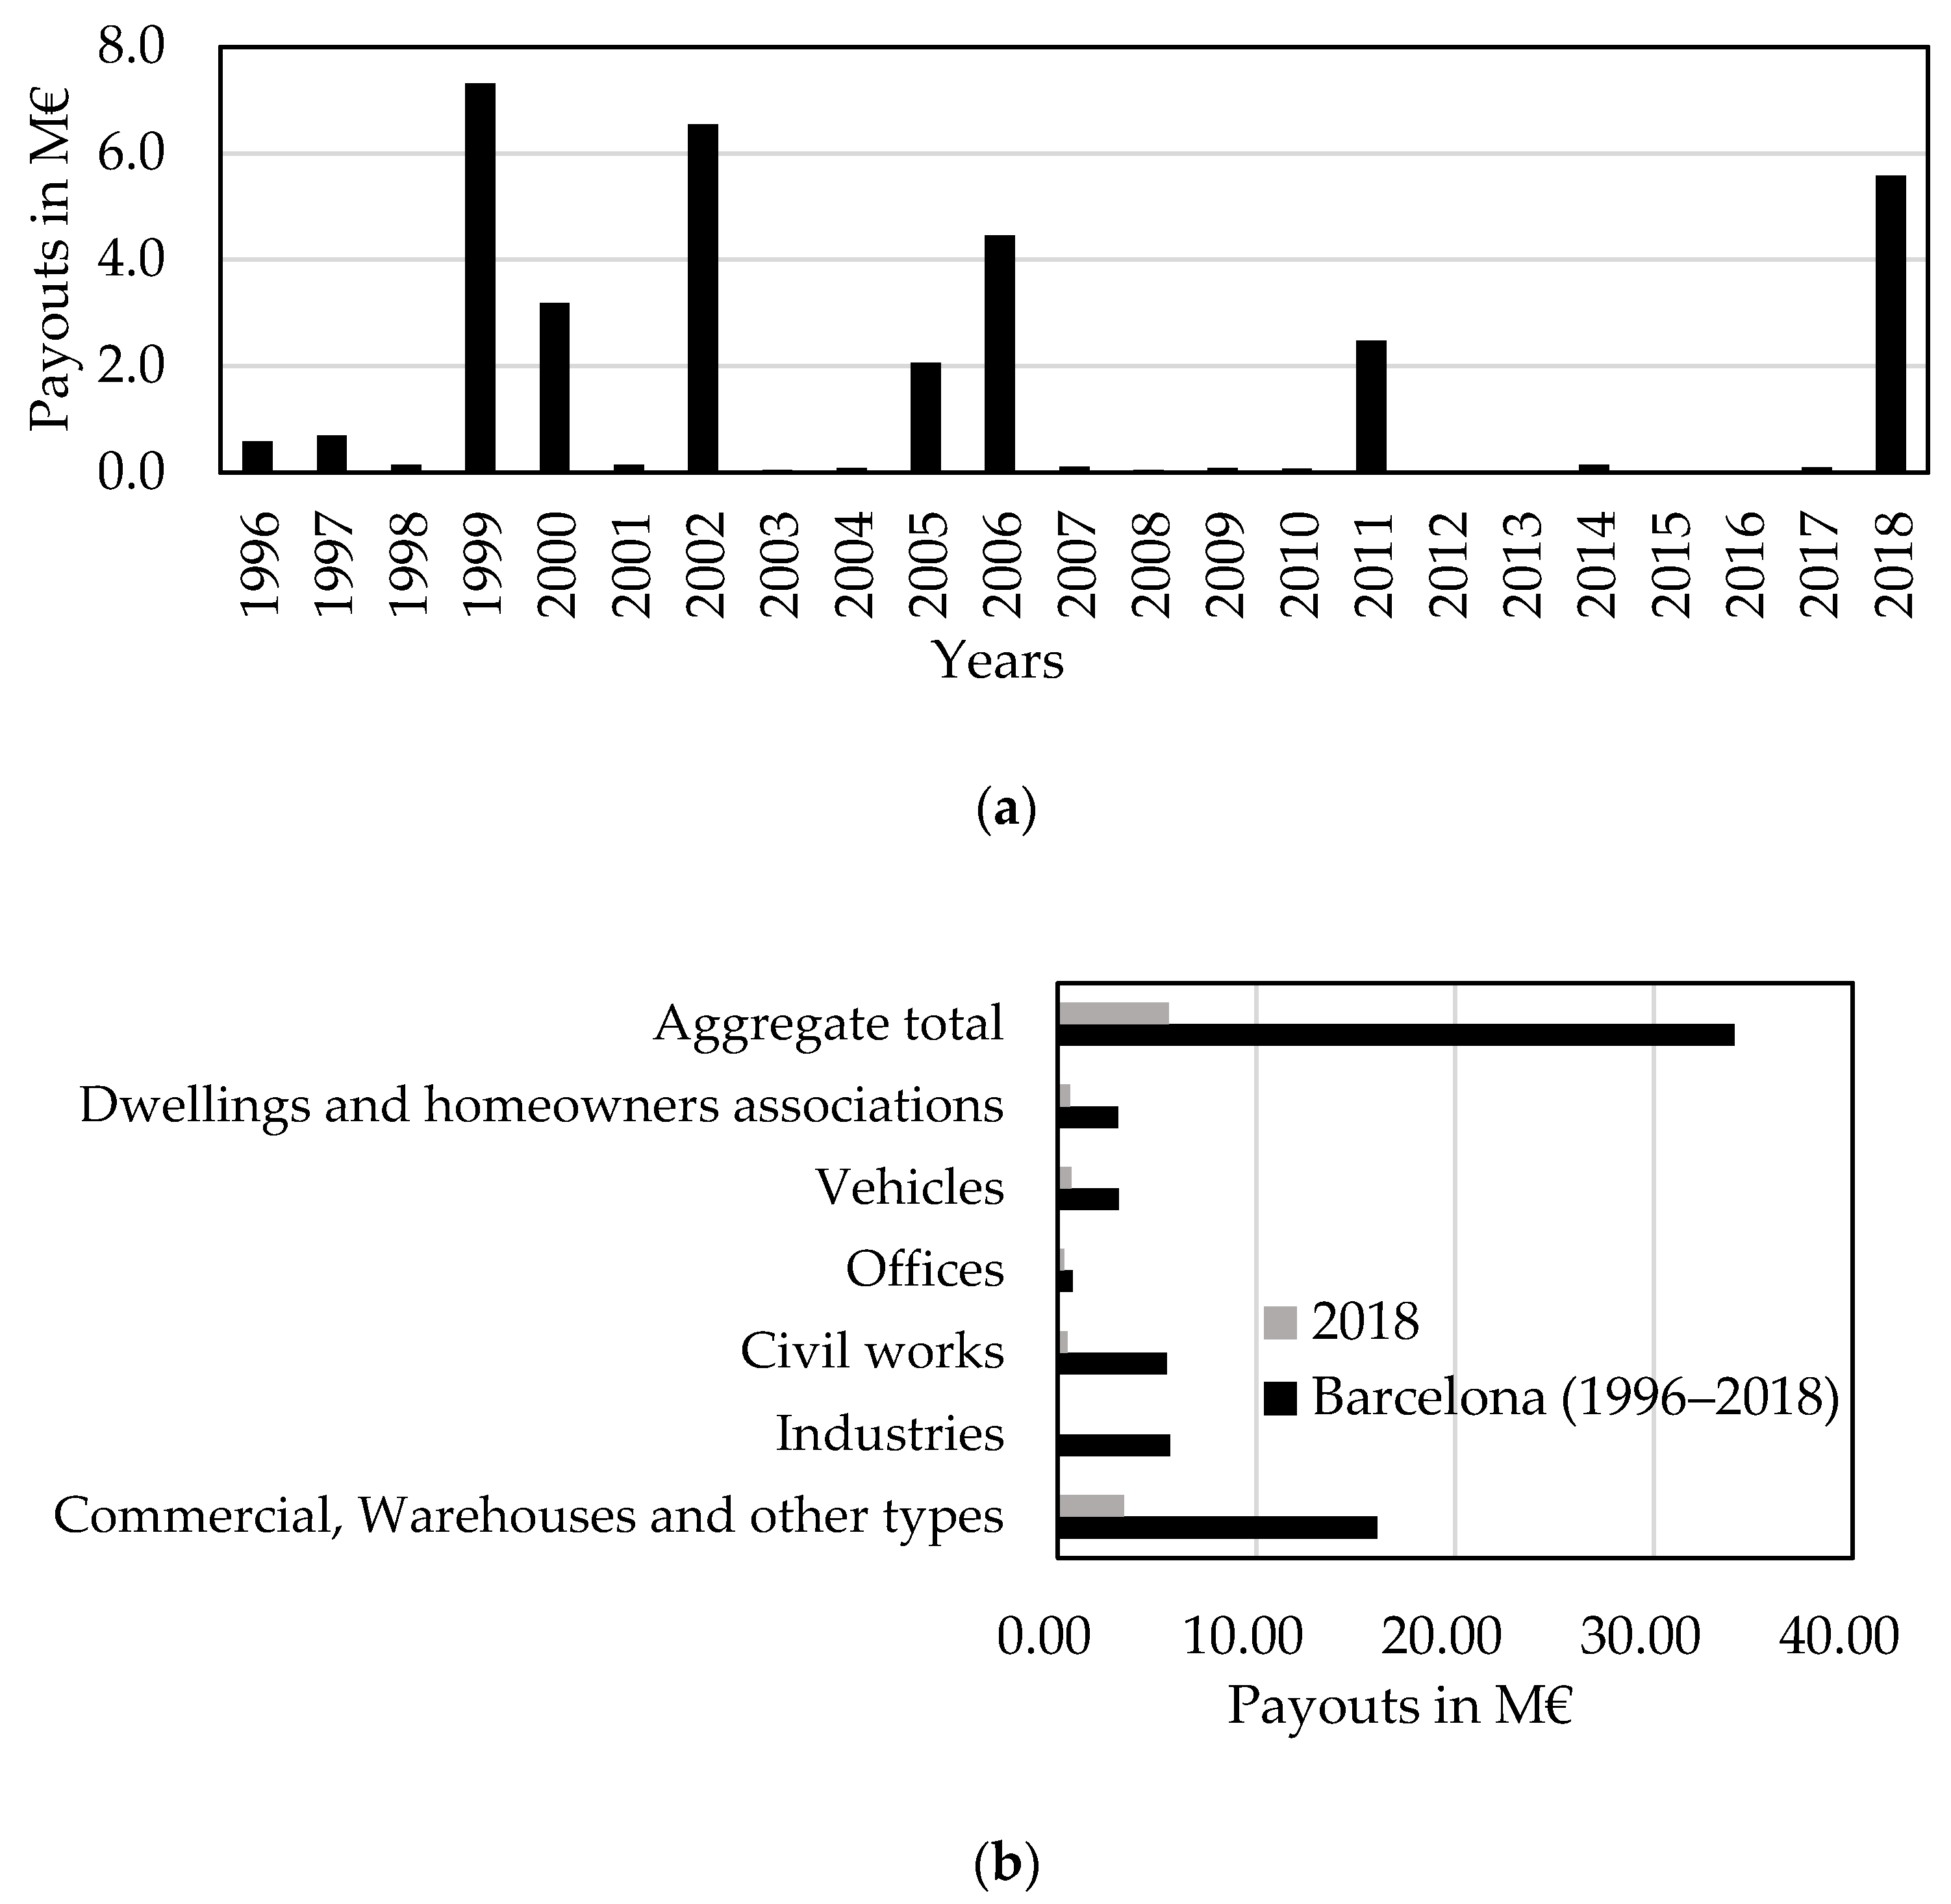
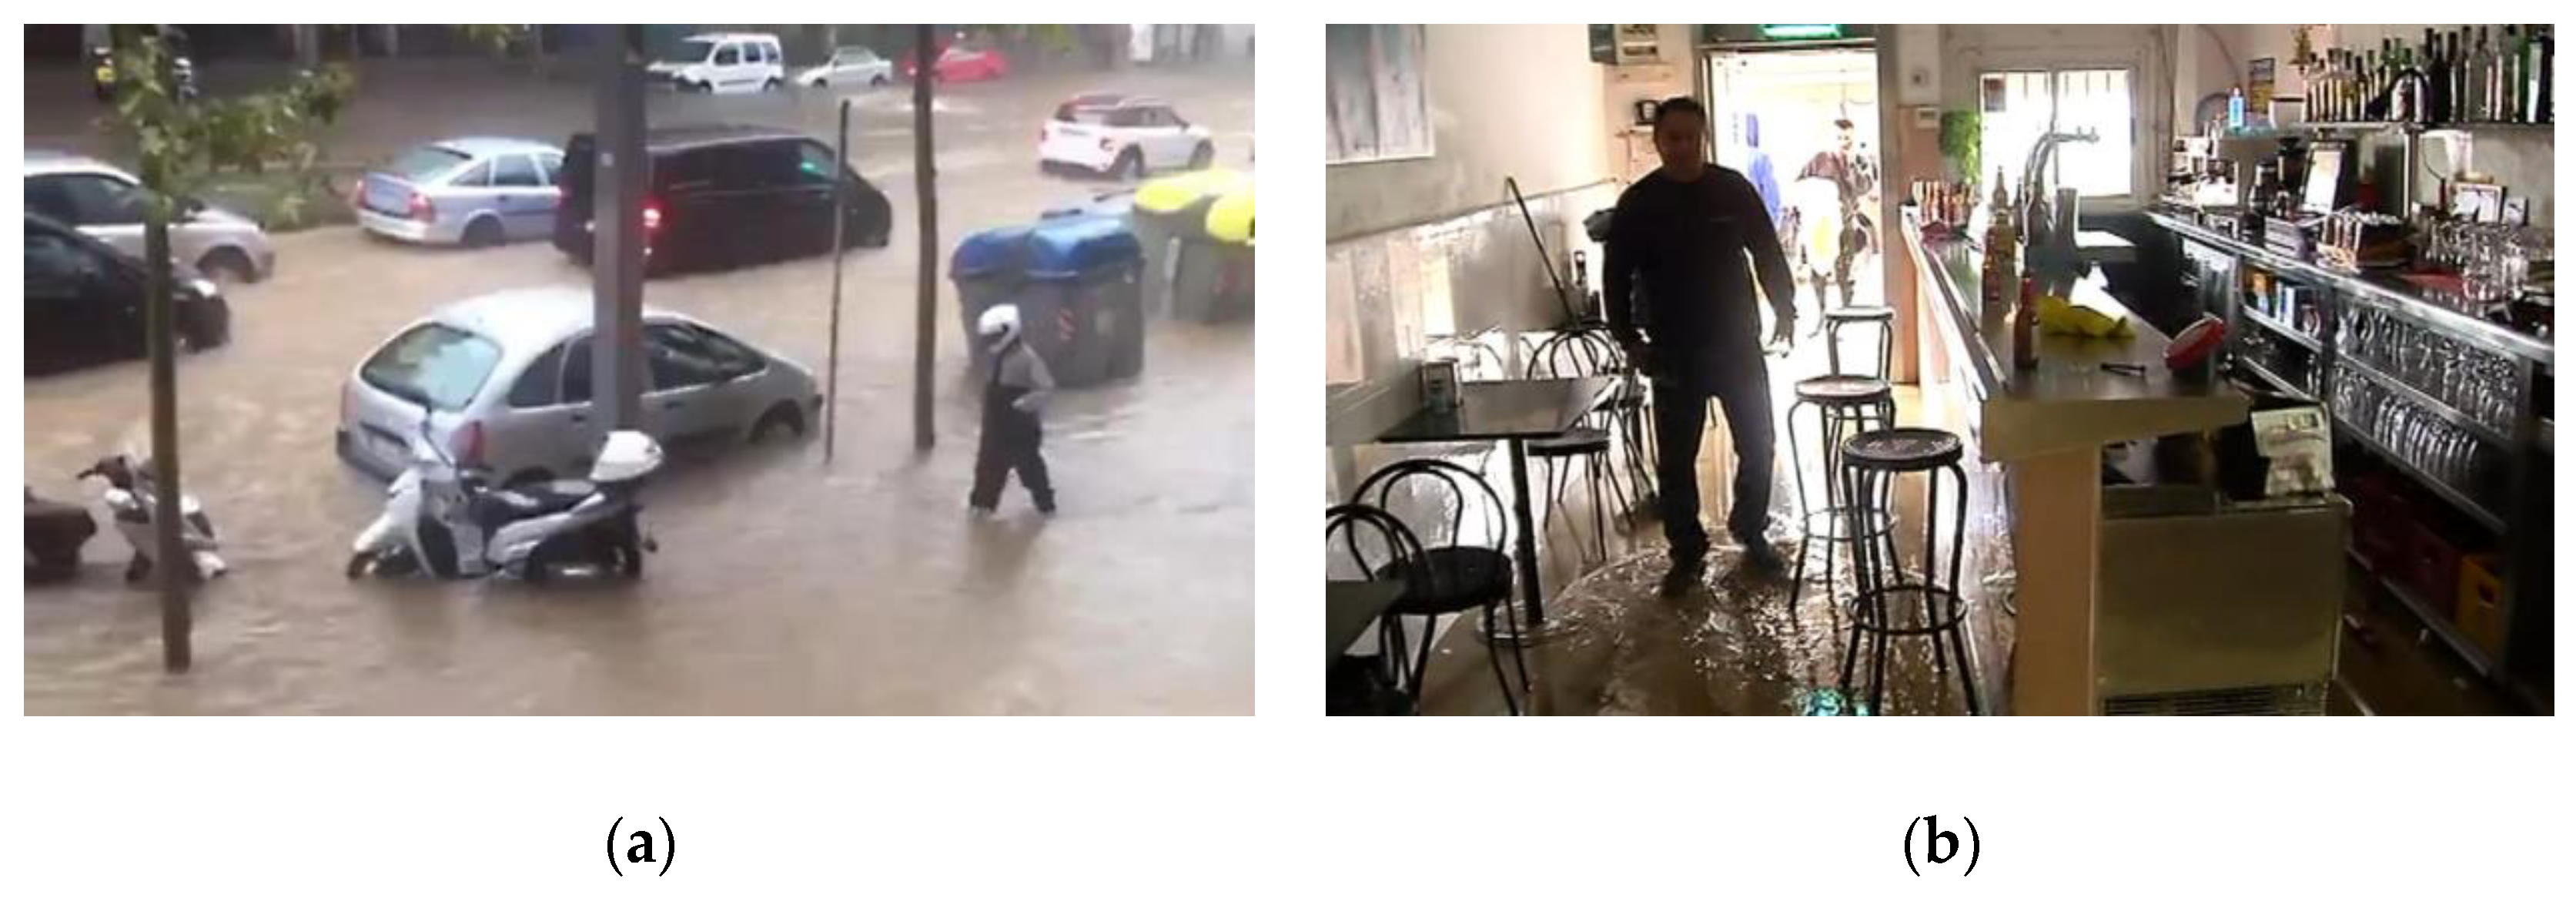
3.1. Context of Pluvial Floods in Barcelona
3.2. The Role of the Spanish Insurance Company, Insurance Compensation Consortium (Consorcio de Compensación de Seguros, CCS)
3.3. Methodology
3.3.1. Data
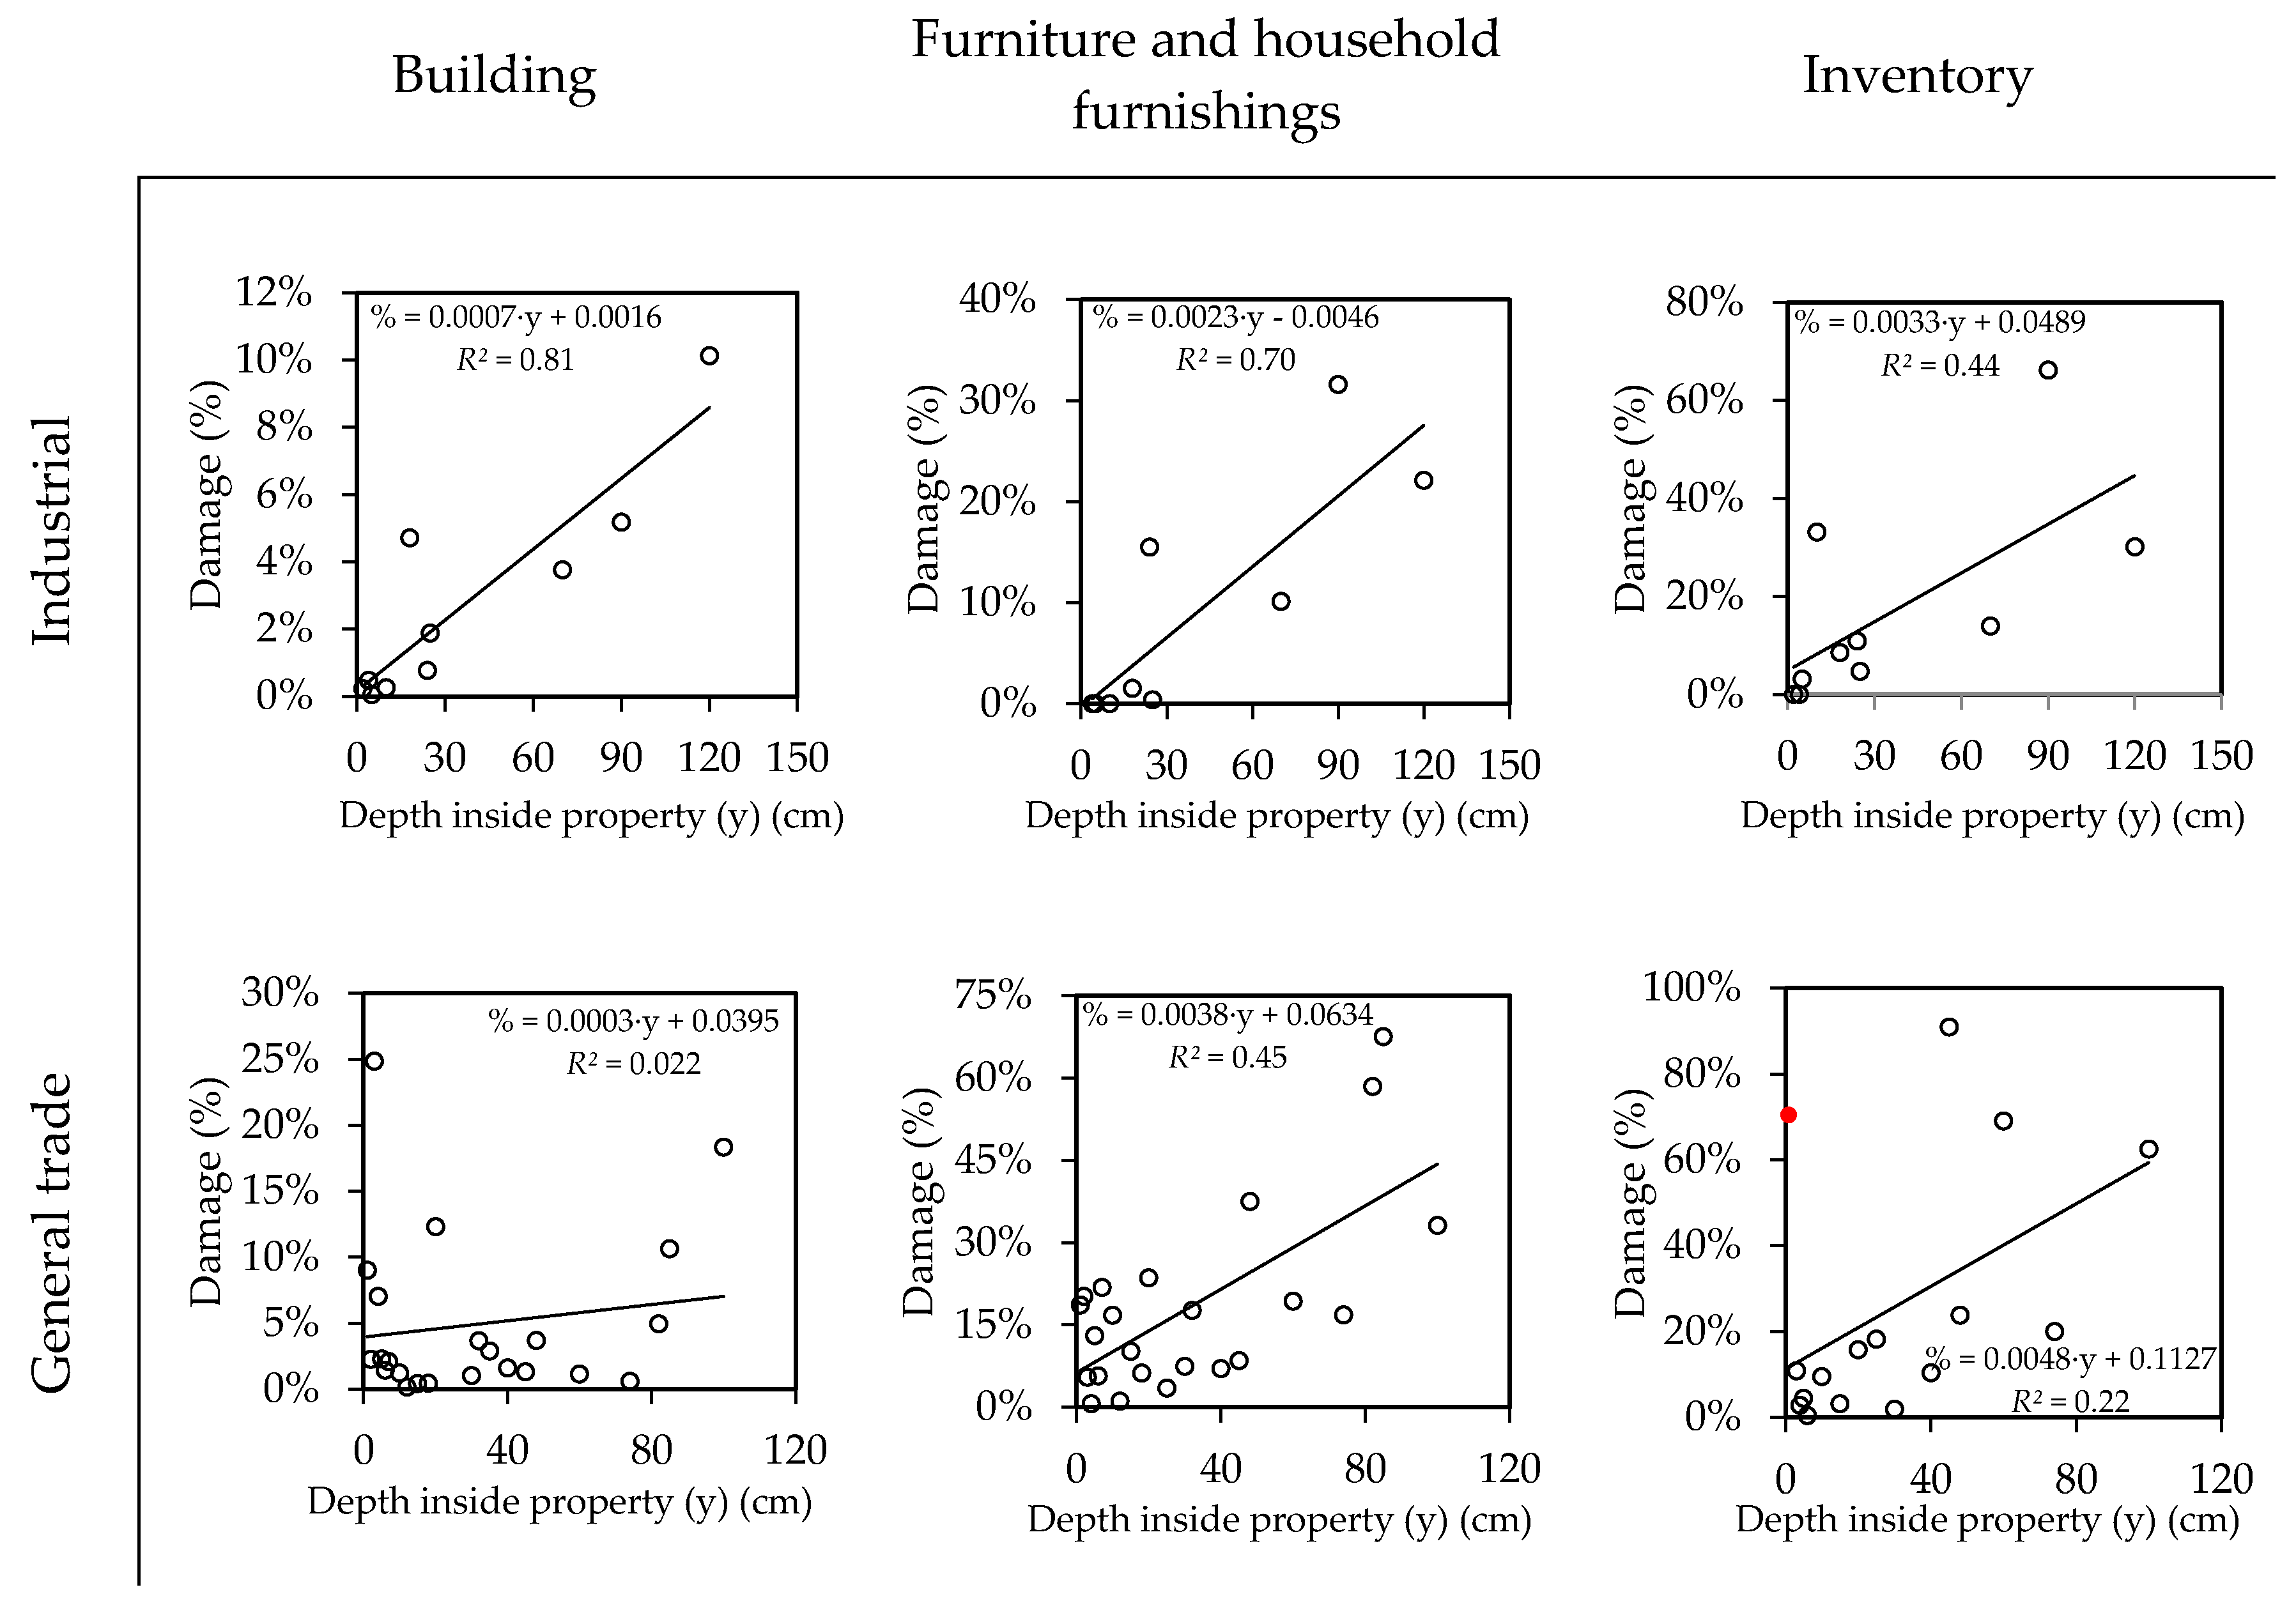
3.3.2. Analysis
- The general trade category includes a variety of trades. They range from those that are more flood-resilient, such as outlets established in an industrial warehouse, to those more vulnerable to floods, such as fashion boutiques with parquet floors, cladding, and wood furniture.
- Damage to the inventory of chilled food trade occurs in a cascade. When cold stores are flooded with even a low floodwater depth, the damage could be total. However, in the case of a trade of construction materials, even when part of the inventory is flooded, it is possible to salvage the inventory placed on upper floors.
3.3.3. Depth‒Damage Curves’ Development for Barcelona
3.3.4. Regional Transferability to Other Spanish Urban Areas
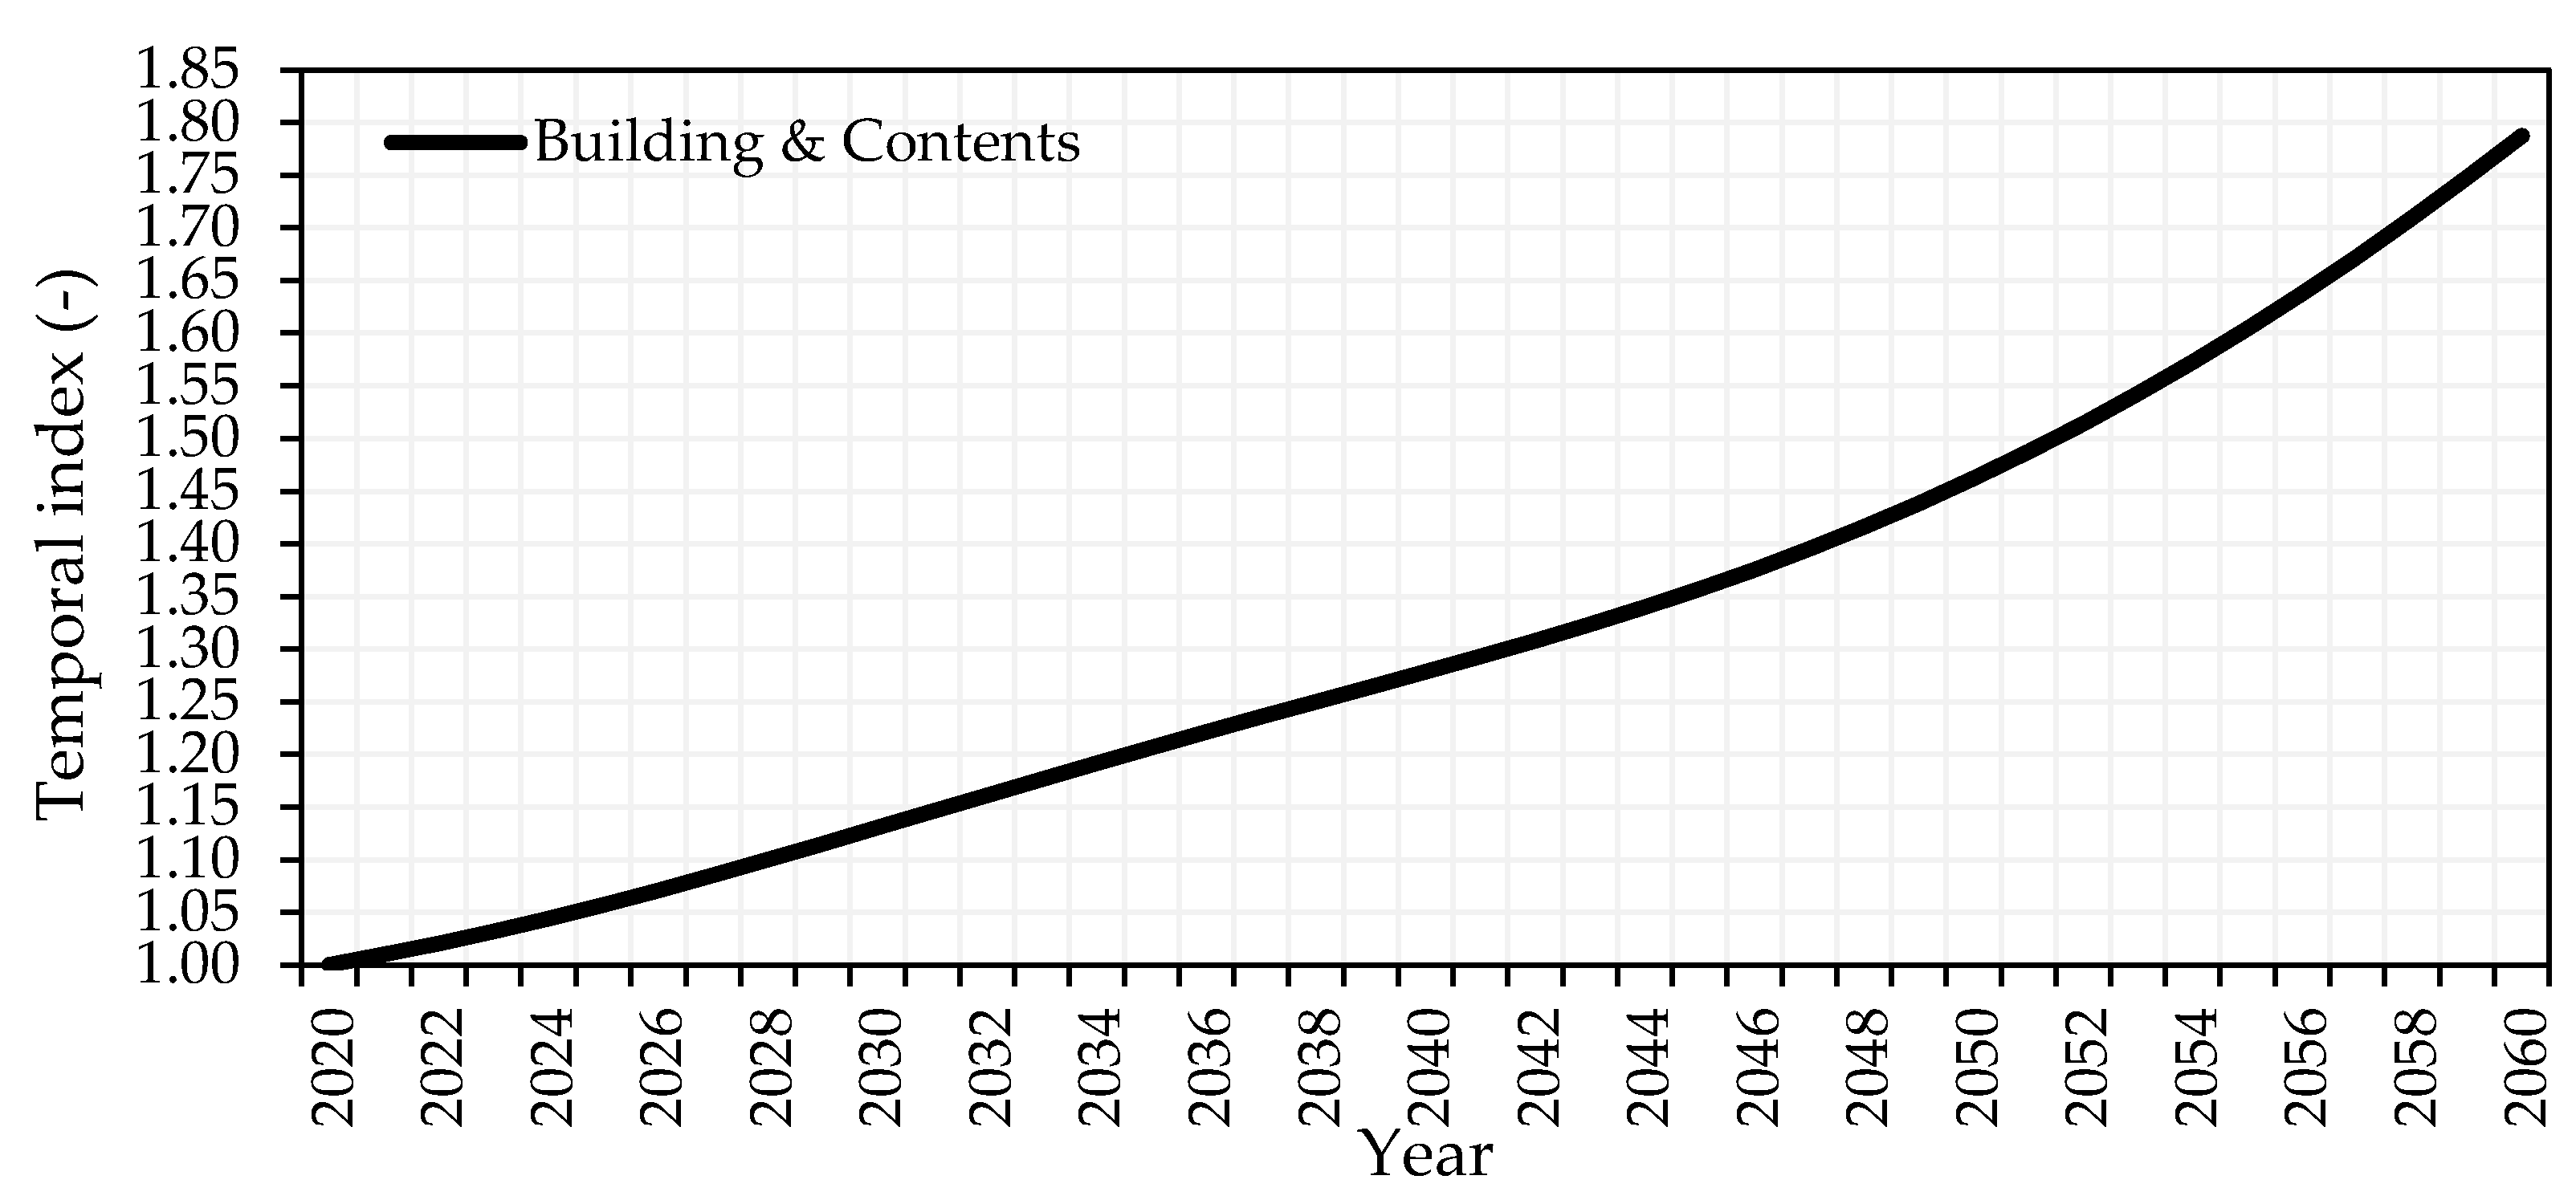
3.3.5. Temporal Transferability
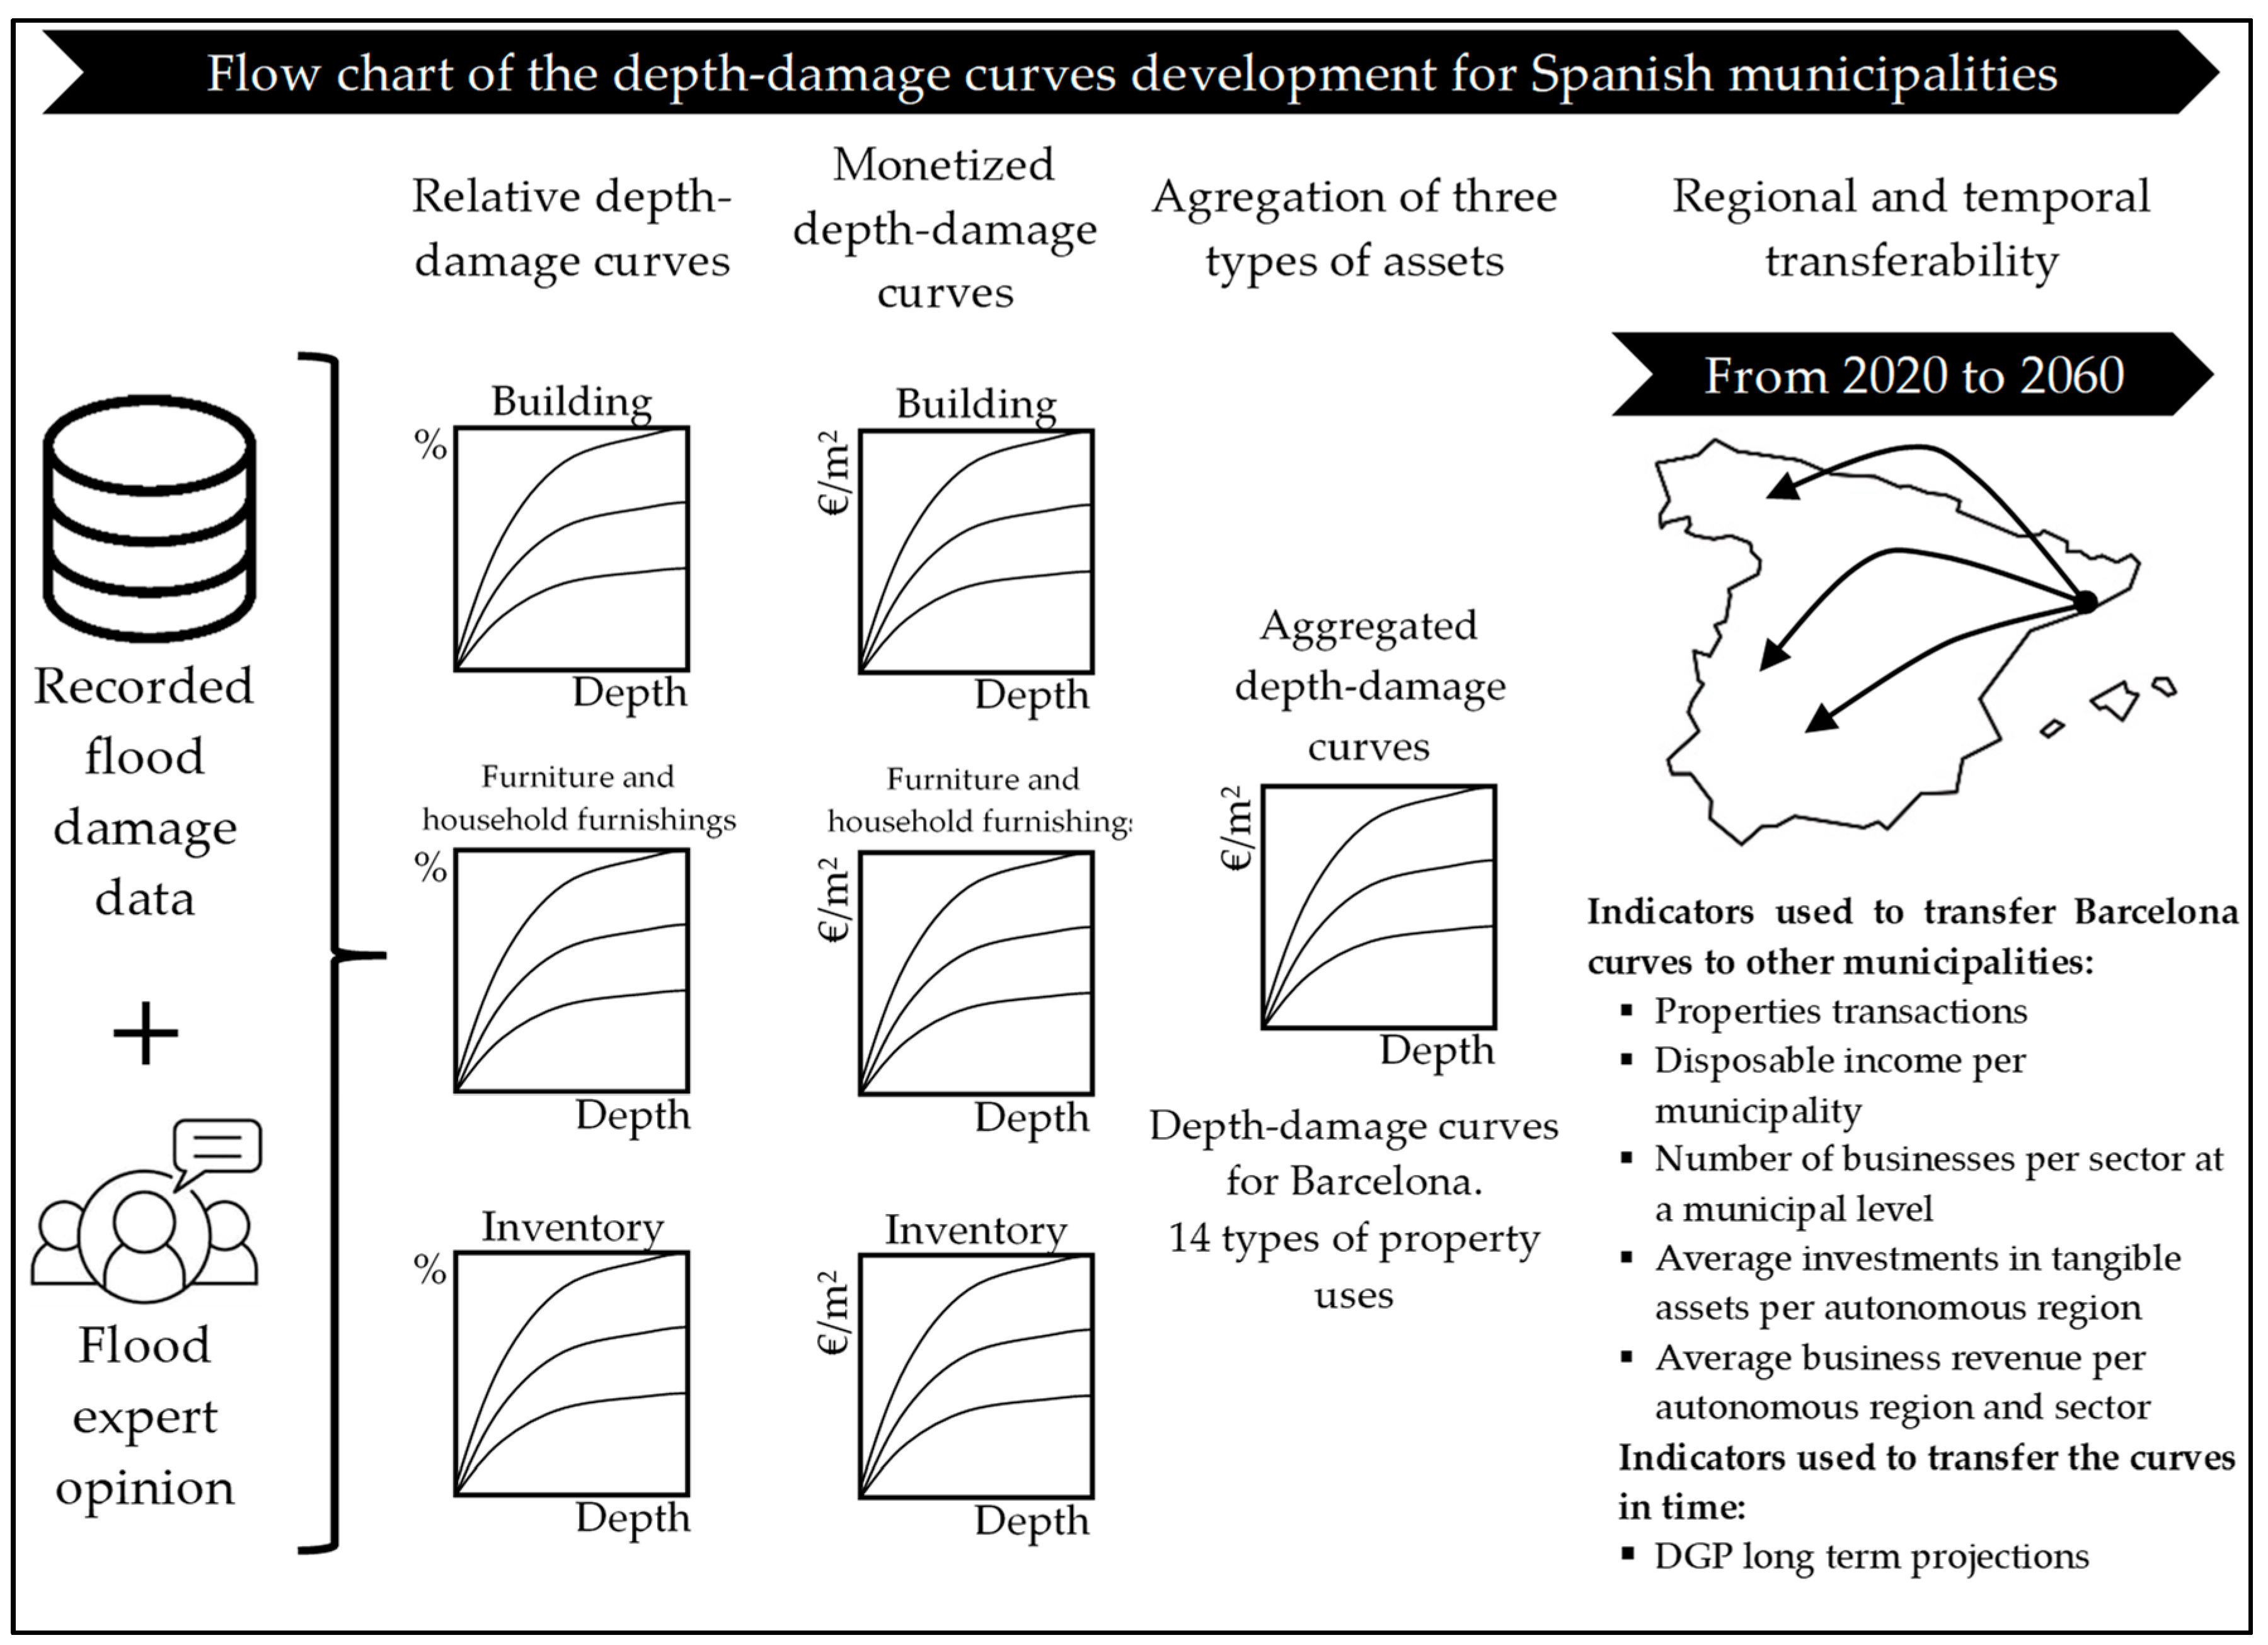
3.3.6. Graphical Overview of the Proposed Methodology
4. Results
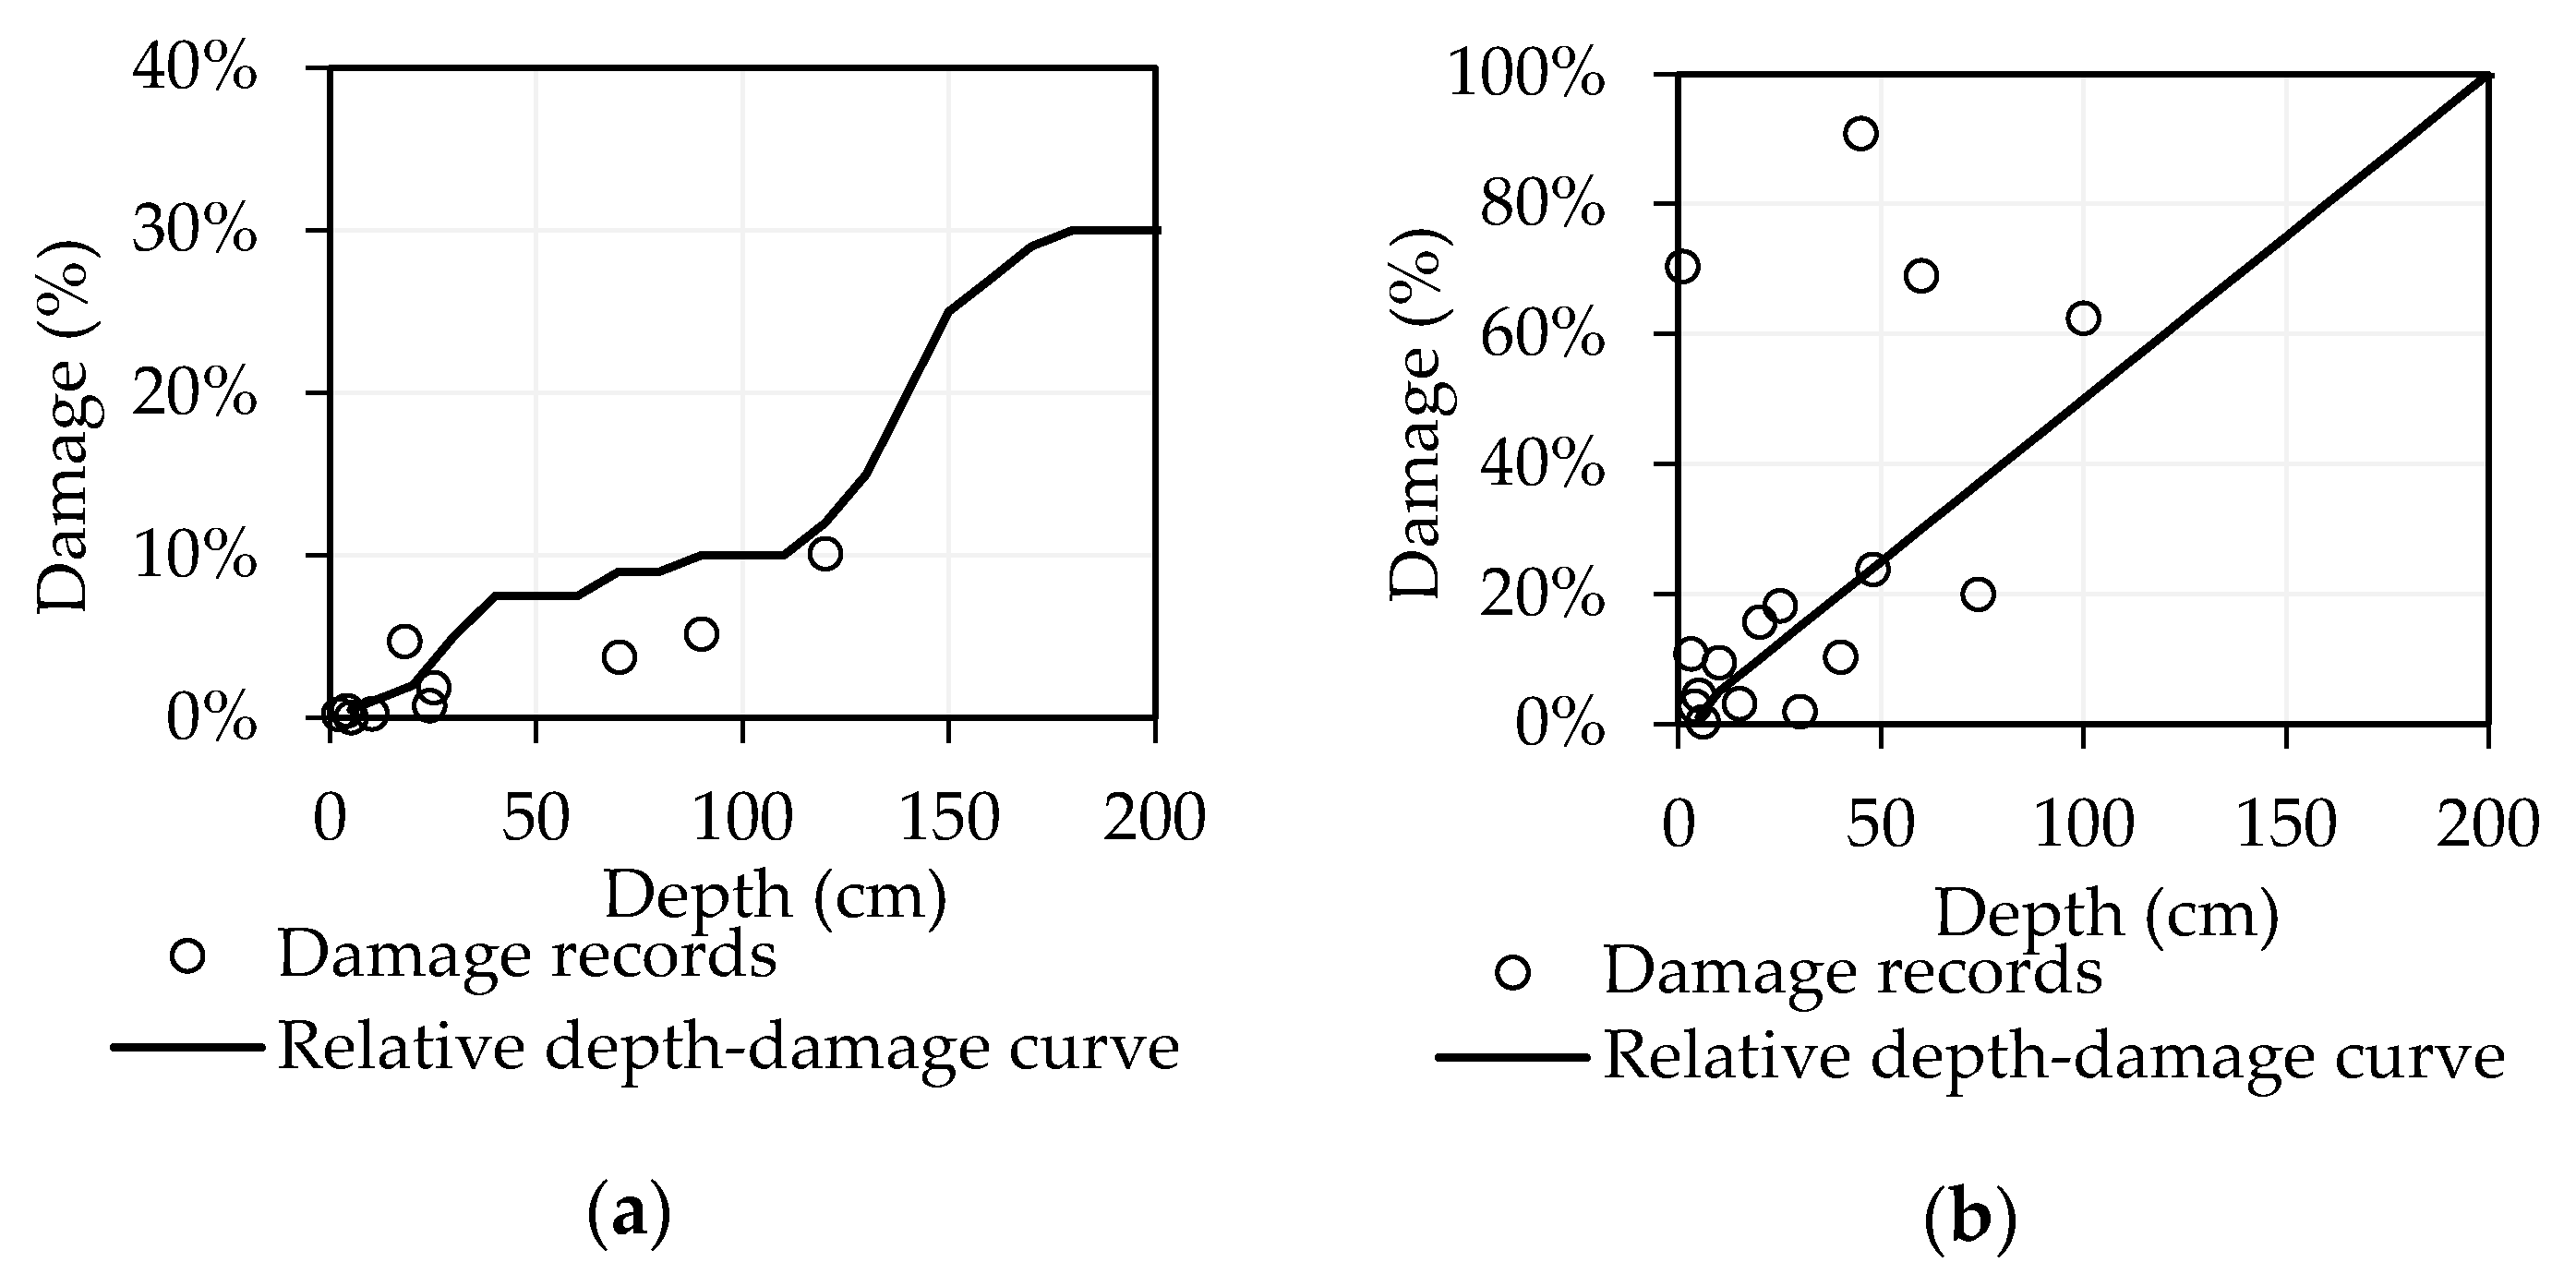
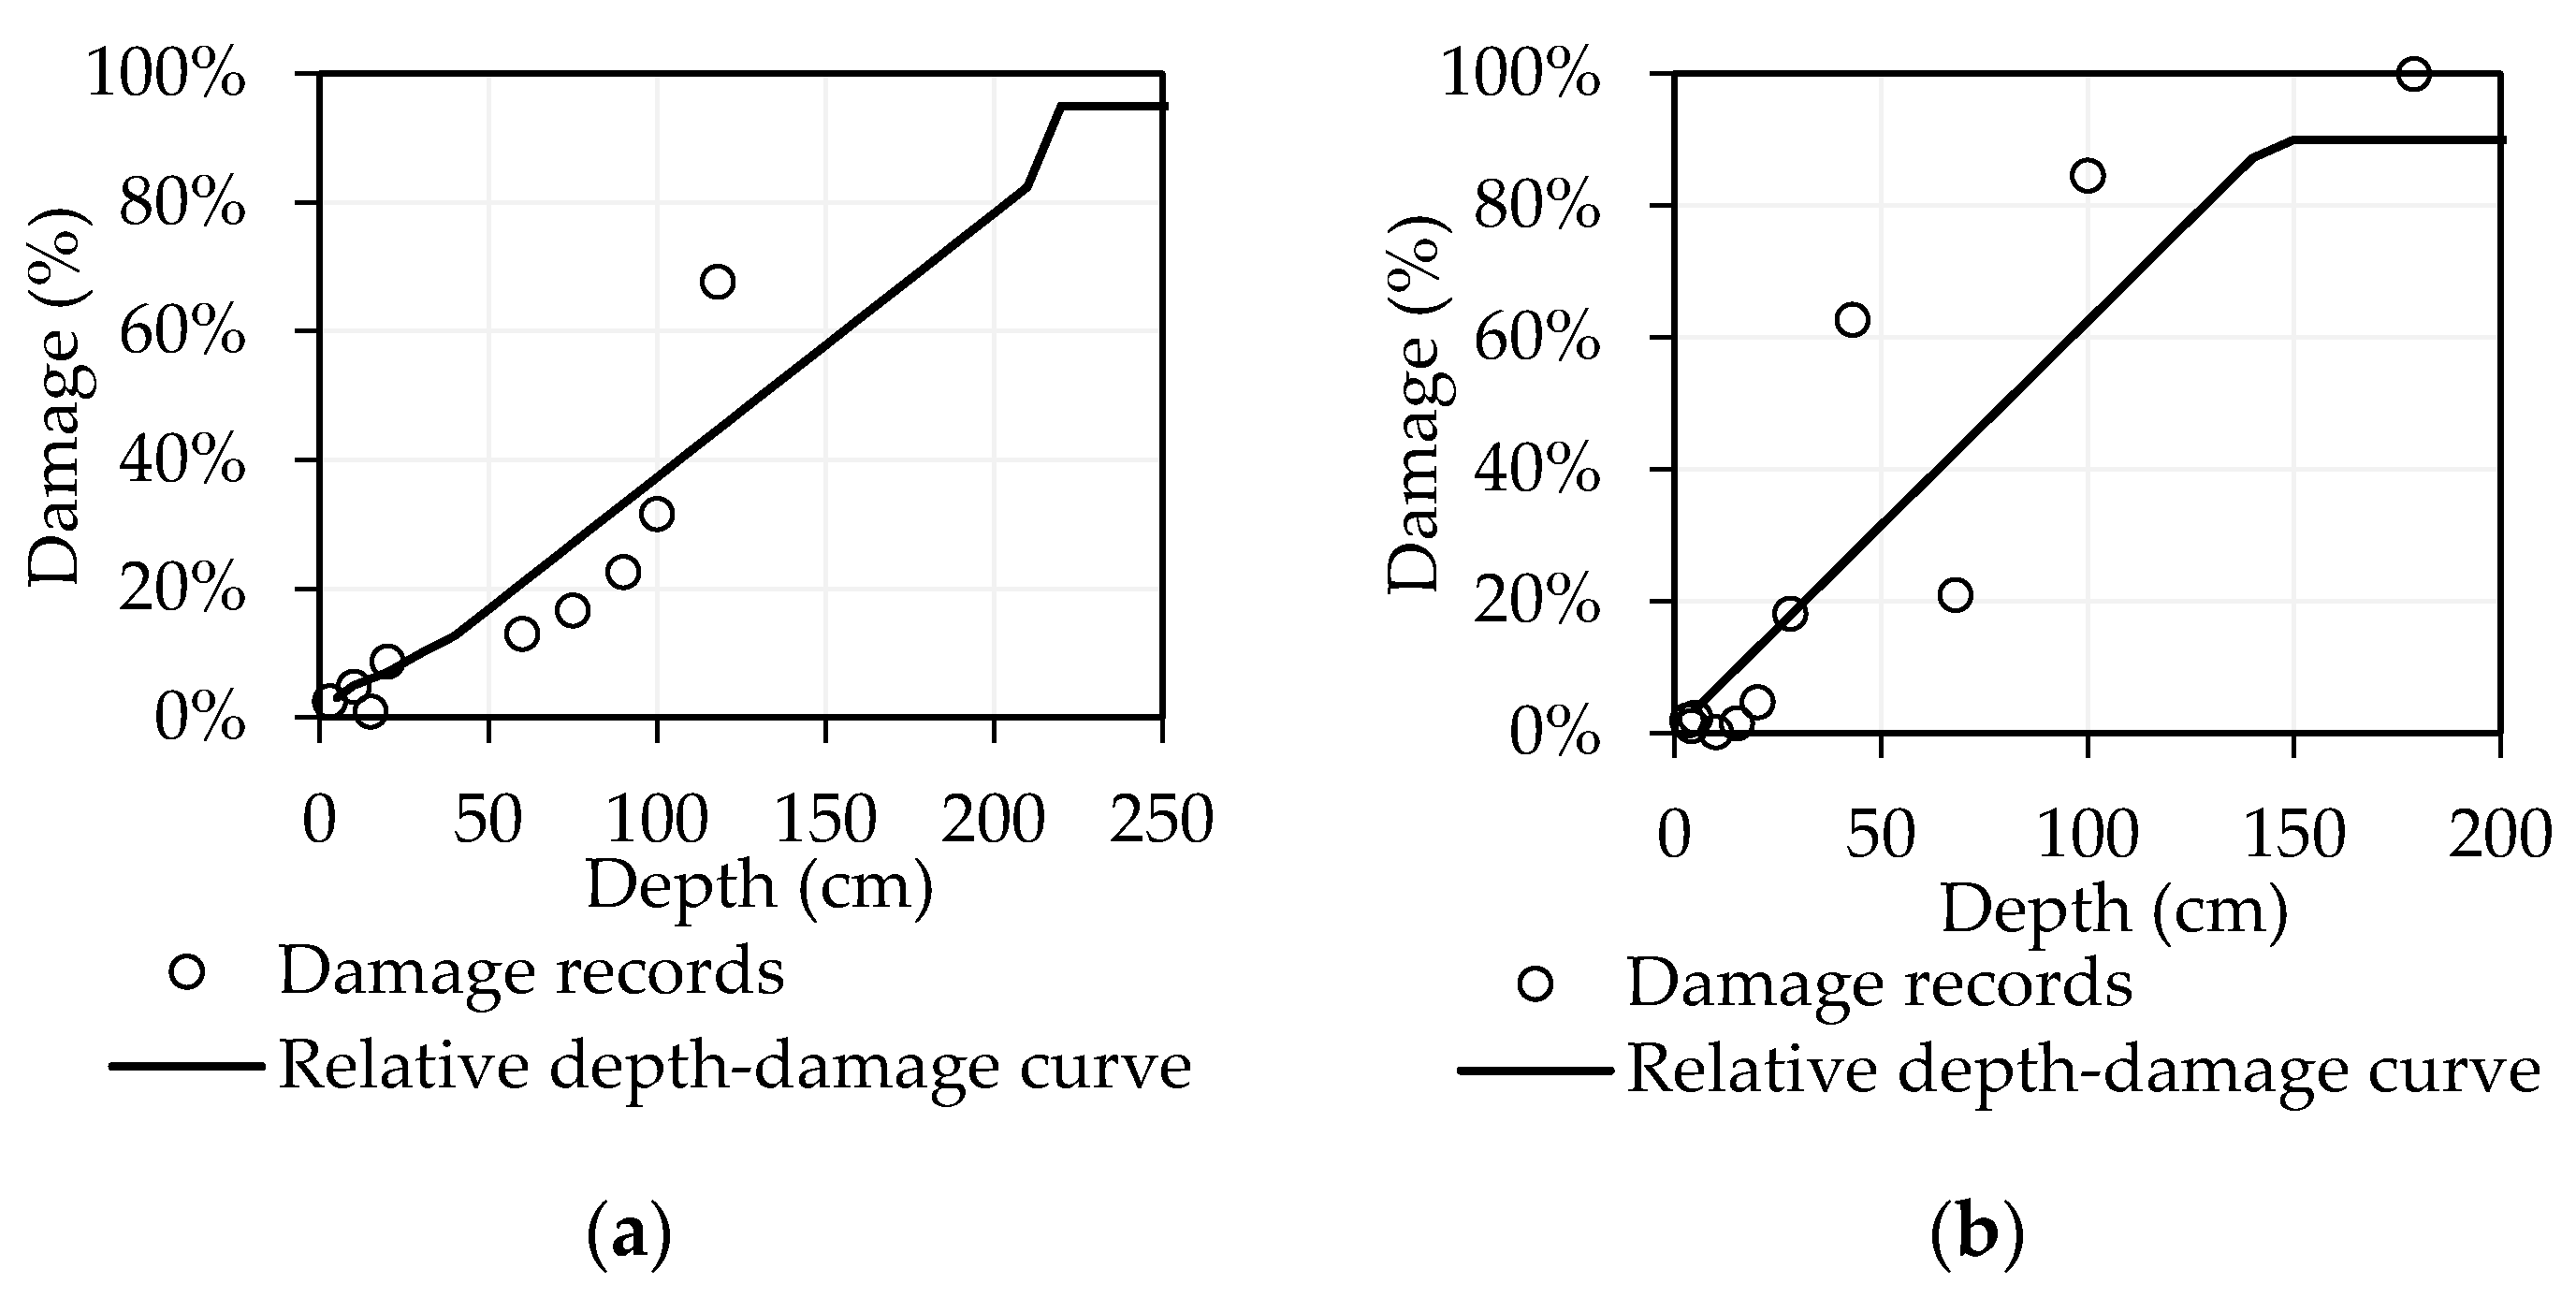
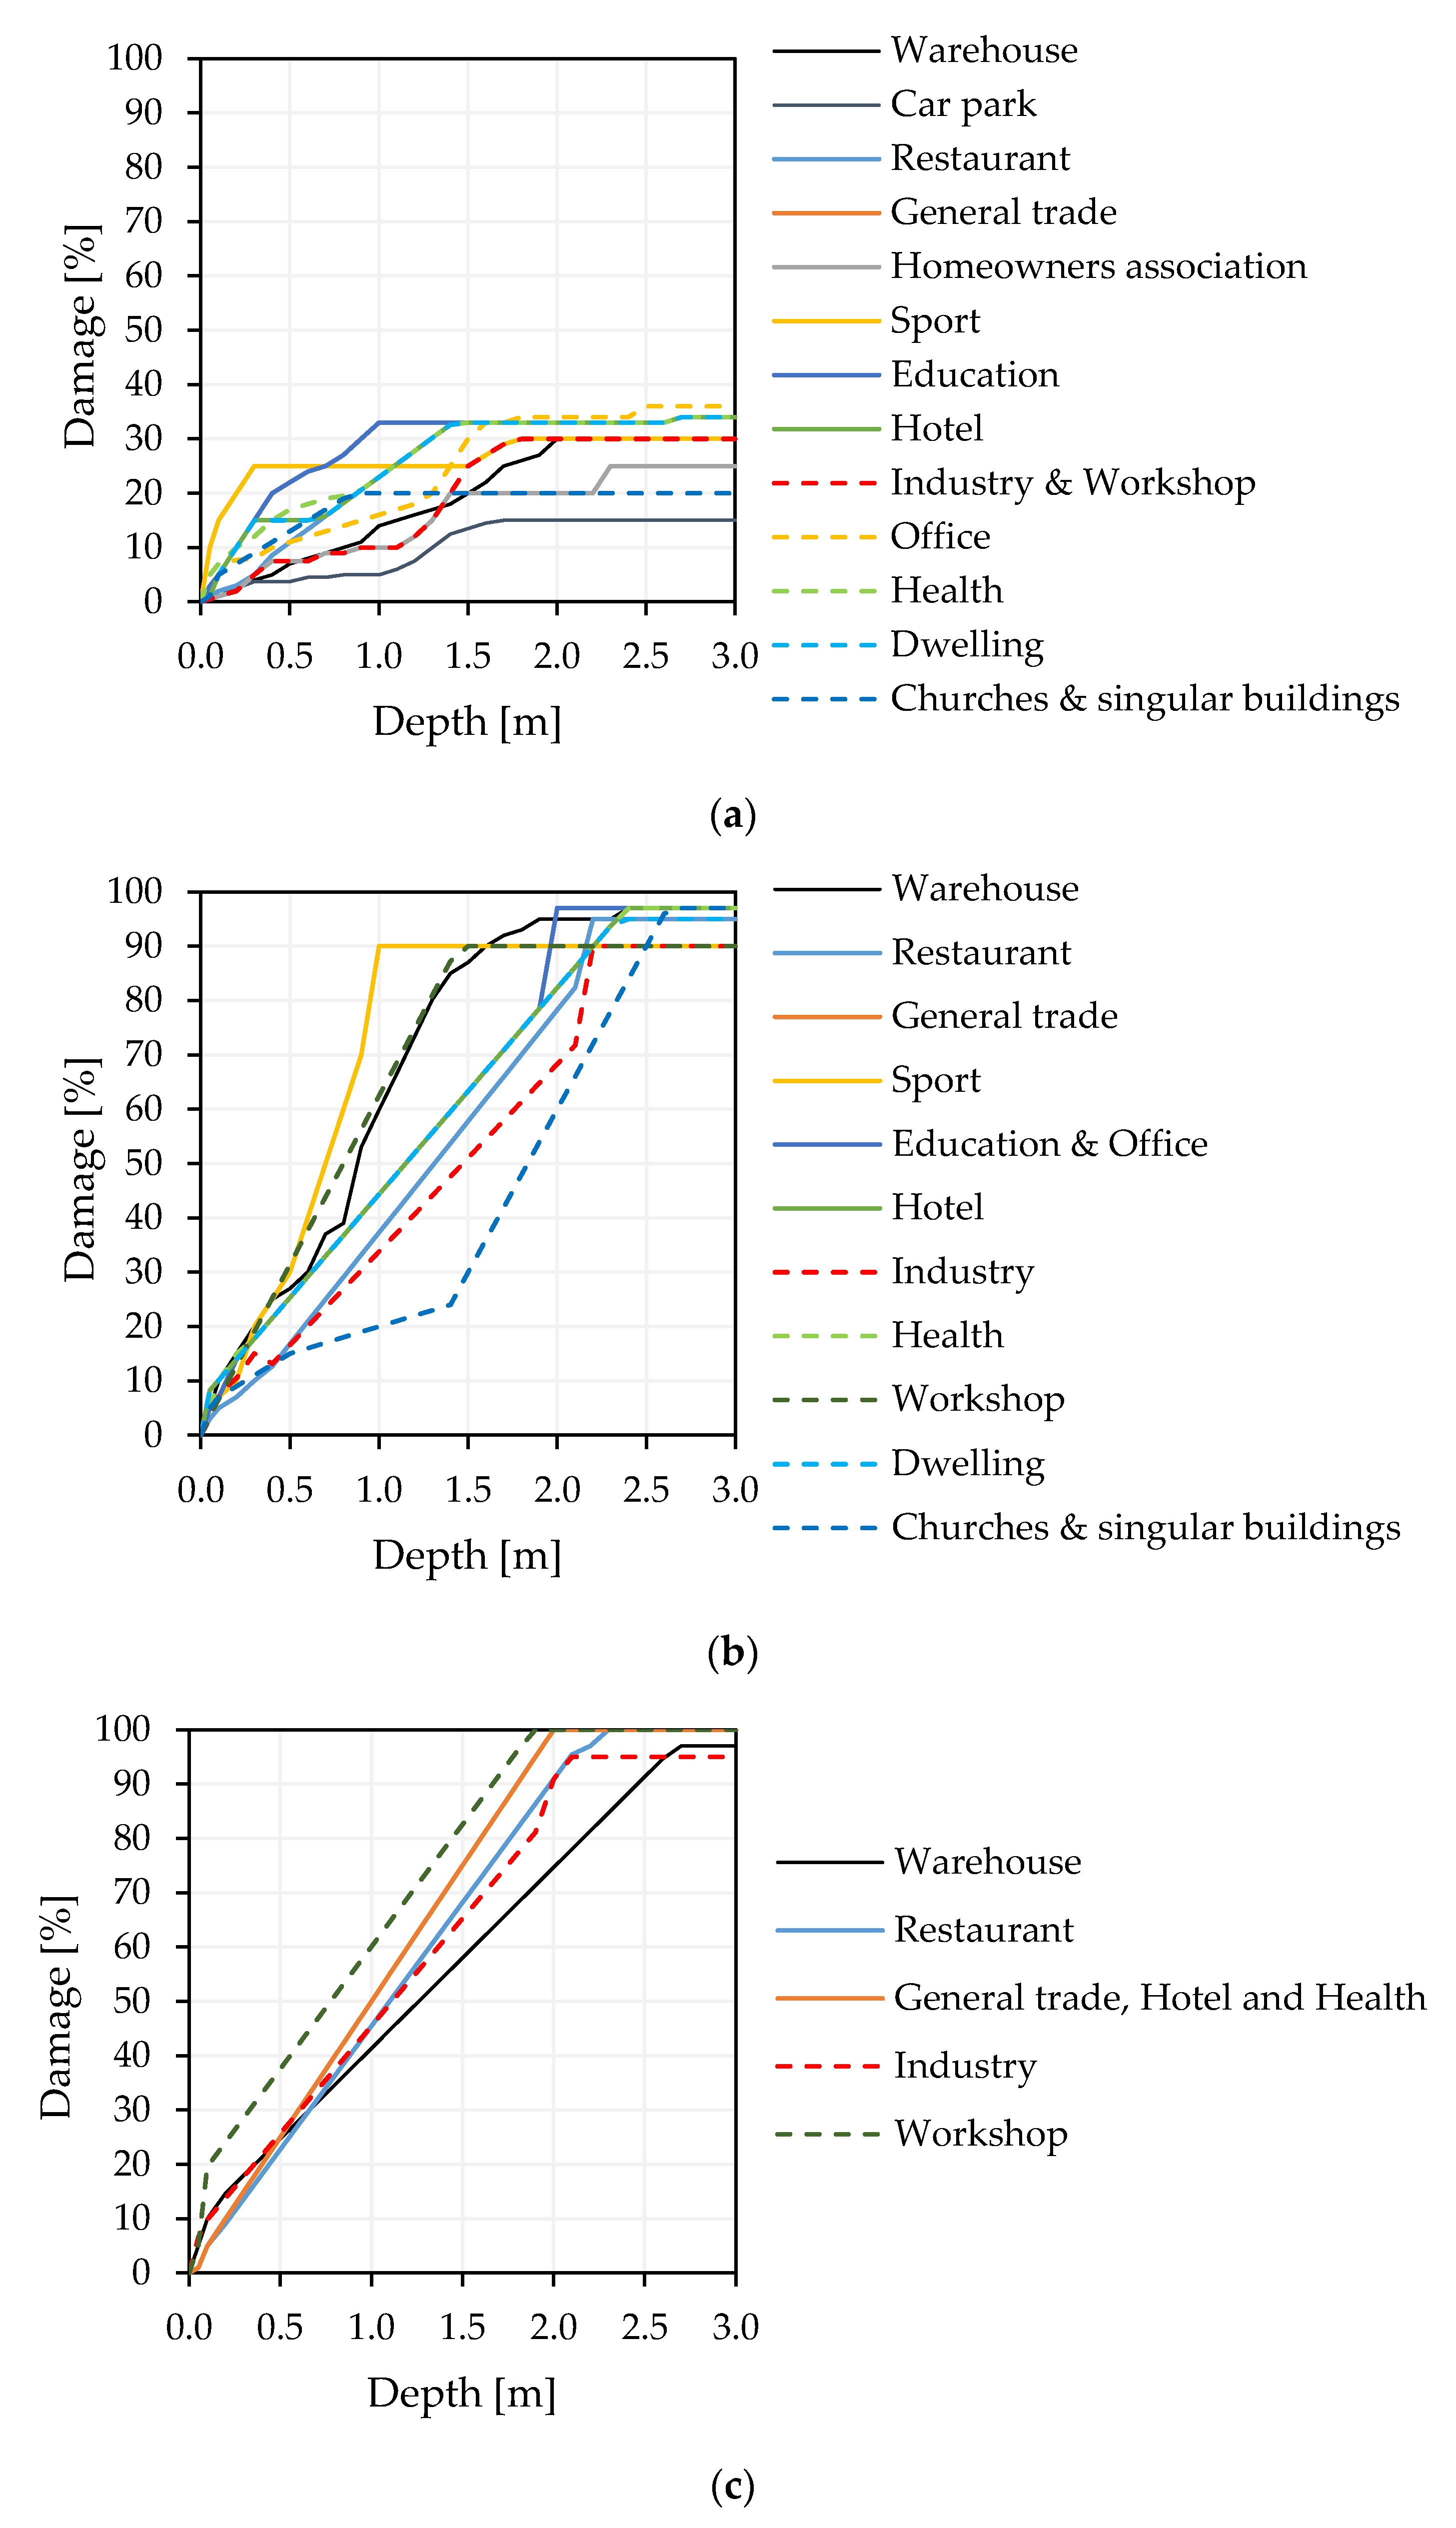
4.1. Relative Depth‒Damage Curves Development
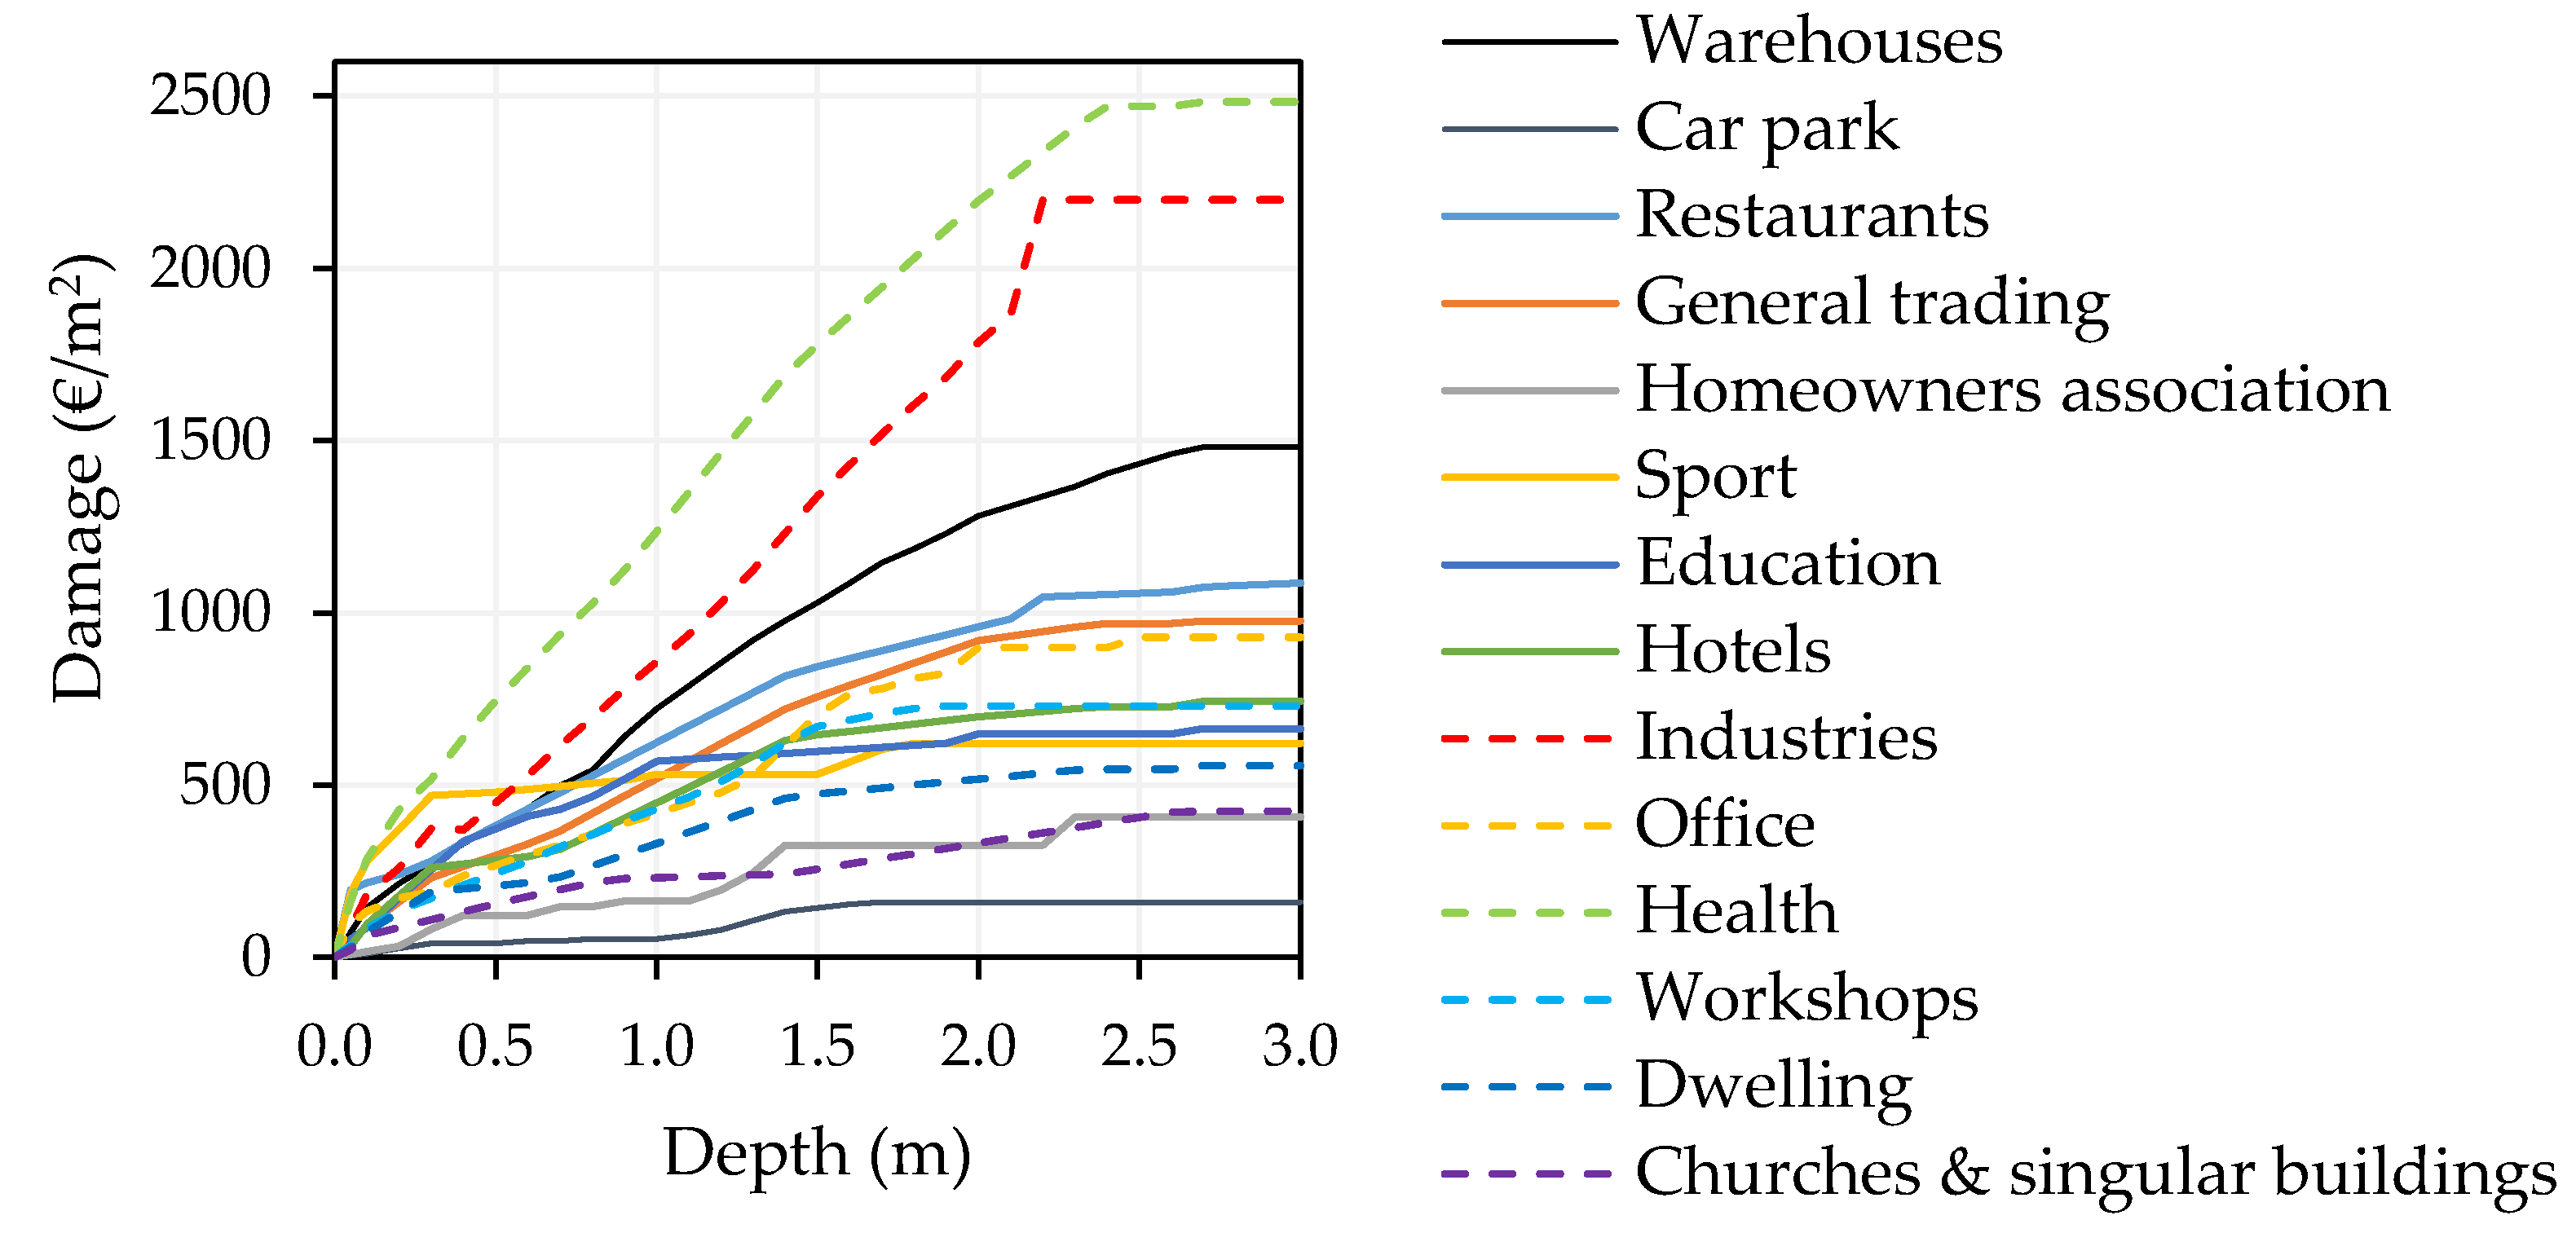
4.2. Monetization of Relative Damage for Barcelona
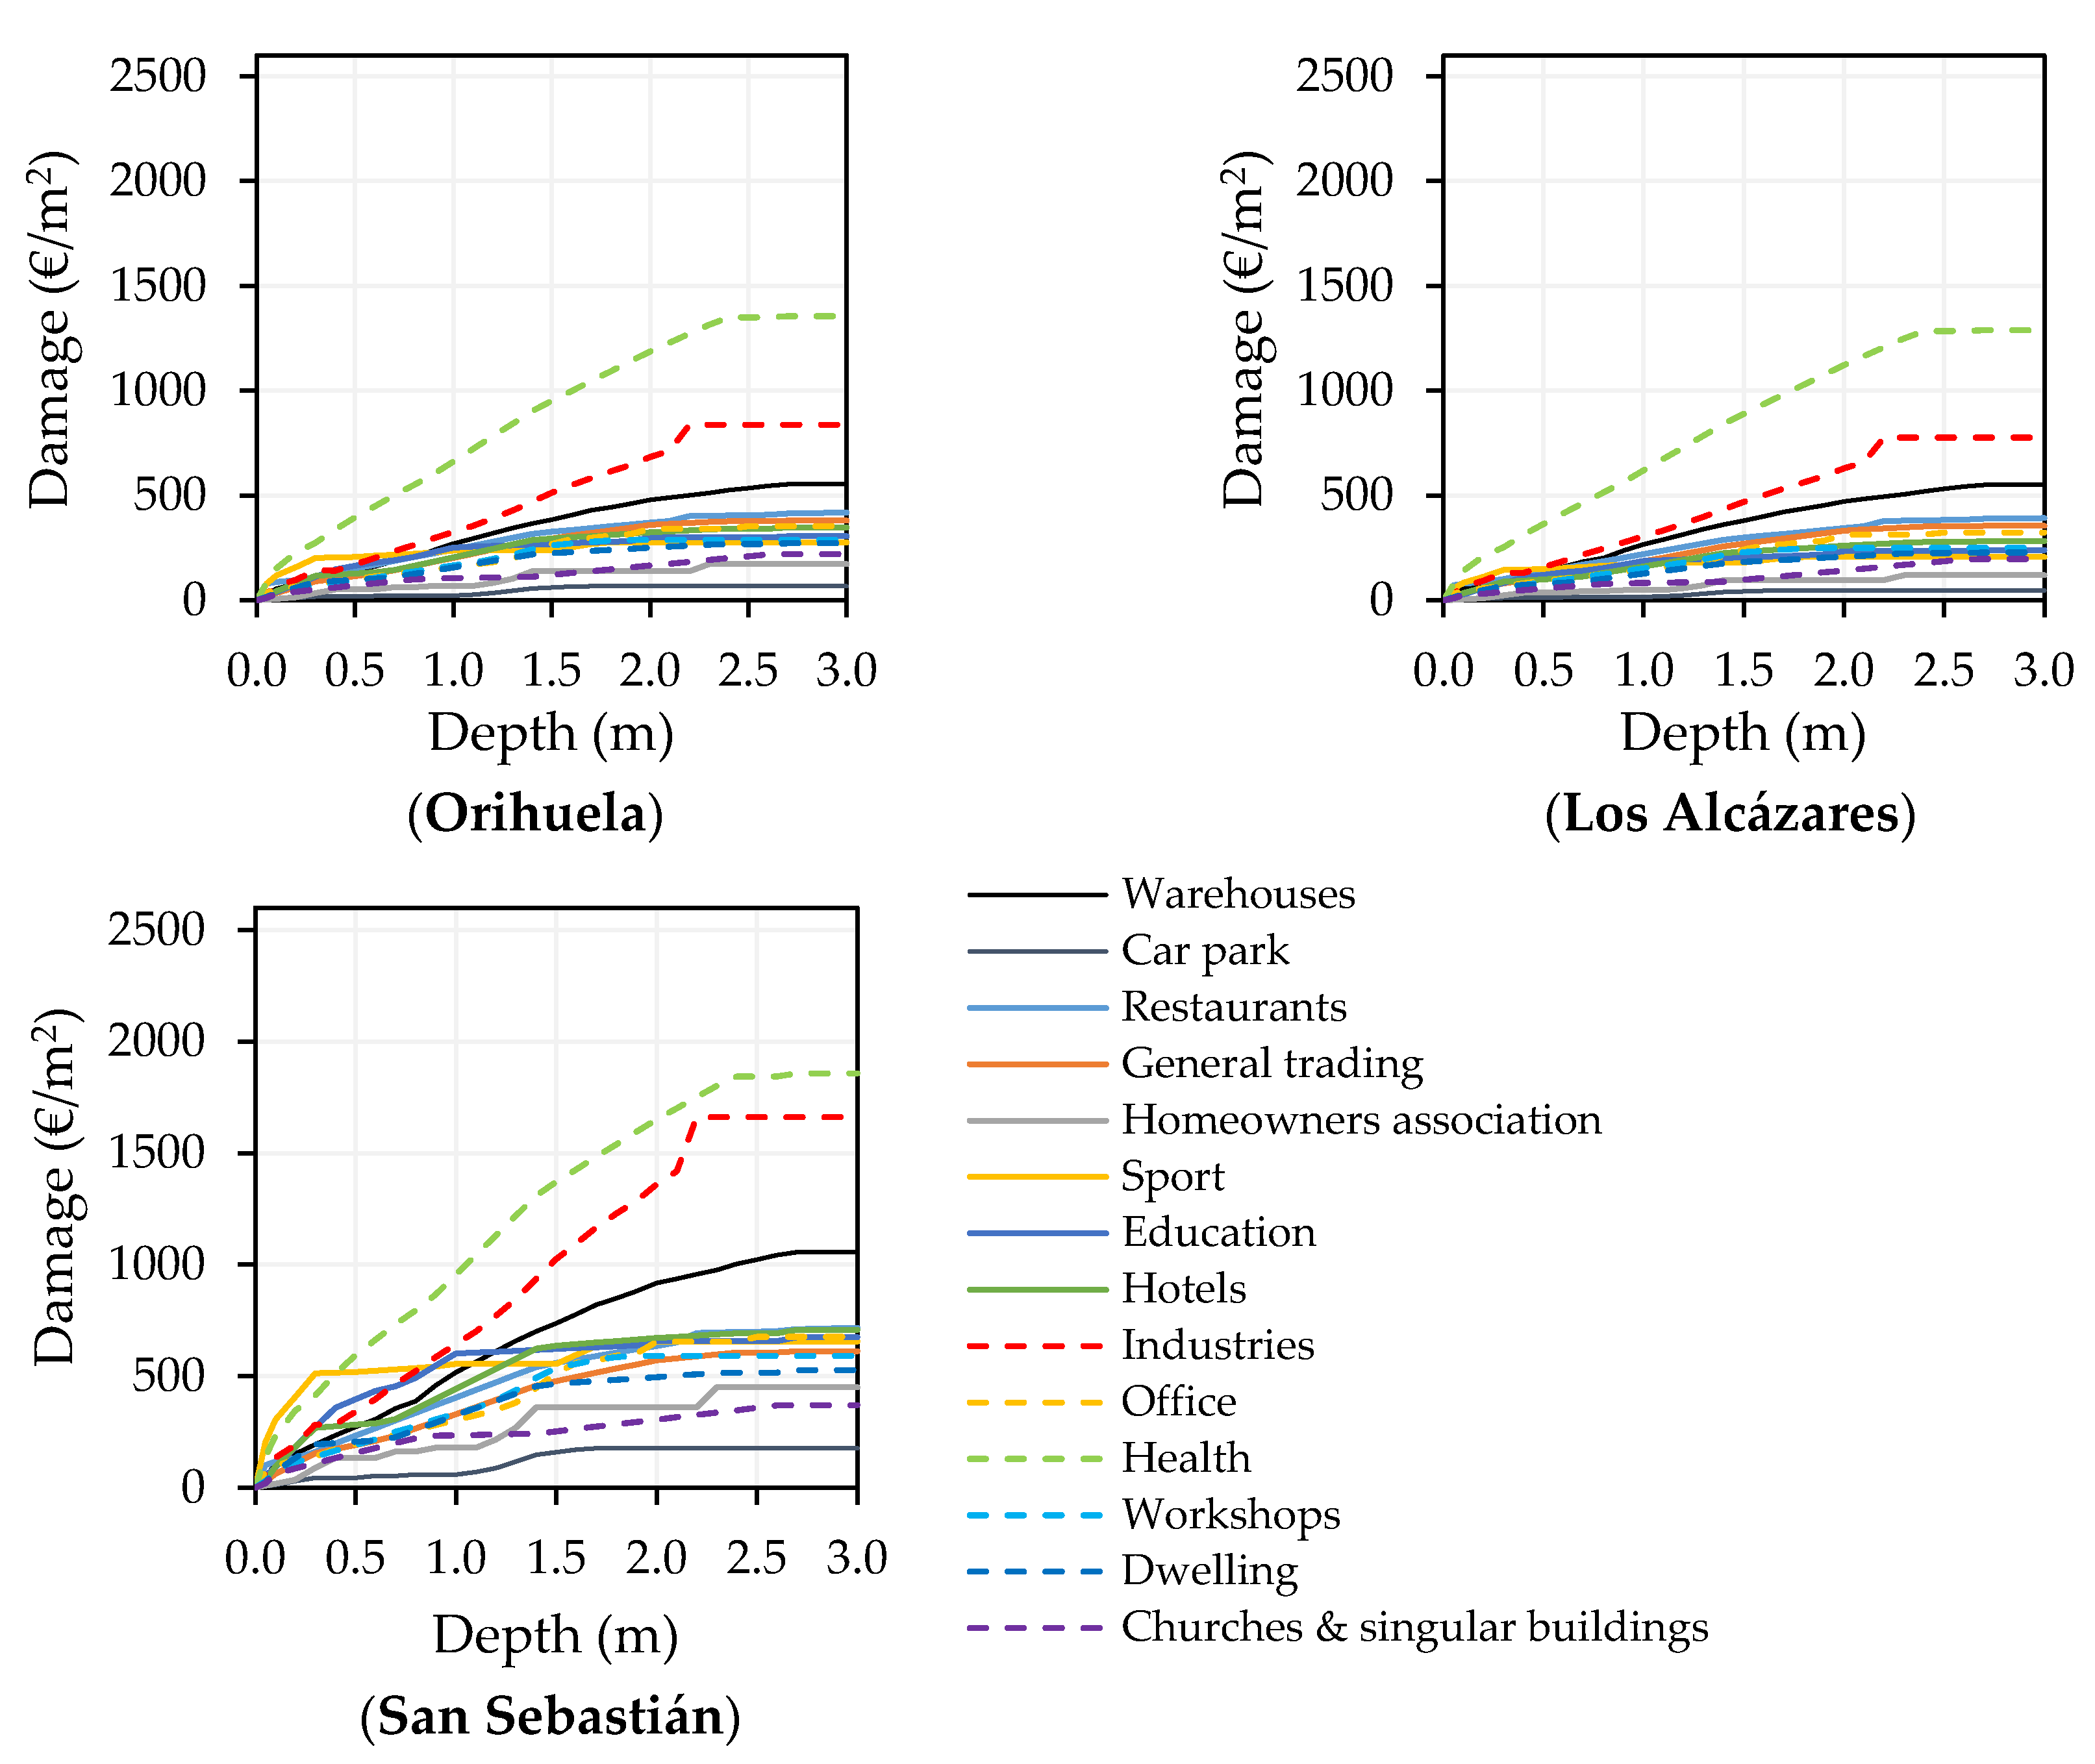
4.3. Depth‒Damage Curves for Other Spanish Municipalities
5. Conclusions
Author Contributions
Funding
Acknowledgments
Conflicts of Interest
Appendix A

References
- European Environment Agency. Economic Losses from Climate-Related Extremes in Europe; Copenhagen, Denmark, 2019; p. 28. Available online: https://www.eea.europa.eu/data-and-maps/indicators/direct-losses-from-weather-disasters-3/assessment-2 (accessed on 20 January 2020).
- Improving Damage Assessments to Enhance Cost-Benefit Analyses (IDEA) Project Earthquake of Lorca in 2011. Available online: http://www.ideaproject.polimi.it/?portfolio=floods-in-vall-daran-and-pyrenees (accessed on 22 February 2020).
- United Nations, Department of Economic and Social Affairs, Population Division. World Urbanization Prospects: The 2018 Revision (ST/ESA/SER.A/420); New York, NY, USA, 2018; p. 126. Available online: https://population.un.org/wup/Publications/Files/WUP2018-Report.pdf (accessed on 20 January 2020).
- European Environmental Agency (EEA). Flood Risk in Europe: the Long-Term Outlook; European Environmental Agency (EEA): Copenhague, Denmark, 2016. [Google Scholar]
- Velasco, M.; Cabello, À.; Russo, B. Flood damage assessment in urban areas. Application to the Raval district of Barcelona using synthetic depth damage curves. Urban Water J. 2016, 13, 426–440. [Google Scholar] [CrossRef]
- White, G.F. Human Adjustment to Floods: A Geographical Approach to the Flood Problem in the United States. Ph.D. Dissertation, University of Chicago, Chicago, MA, USA, 1945. [Google Scholar]
- Manrique, A.; Nájera, A.; Escartín, C.; Moreno, C.; Martínez, E.; Espejo, F.; Sánchez, F.J.; Aparicio, M.; Cordero, S.; González, S. Guía Para la Reducción de la Vulnerabilidad de Los Edificios Frente a Las Inundaciones. Consorcio de Compensación de Seguros (CCS); Madrid, Spain, 2017; p. 106. Available online: https://www.consorseguros.es/web/documents/10184/48069/guia_inundaciones_completa_22jun.pdf (accessed on 14 March 2018).
- The European Parliament and the Council of the European Union Directive 2007/60/EC of the European Parliament and of the Council of 23 October 2007 on the Assessment and Management of Flood Risks (Text with EEA Relevance). 2007, p. 8. Available online: https://eur-lex.europa.eu/legal-content/EN/TXT/PDF/?uri=CELEX:32007L0060&from=EN (accessed on 11 February 2020).
- Ministerio de la Presidencia Real Decreto 903/2010, de 9 de julio, de evaluación y gestión de riesgos de inundación. 2010, p. 14. Available online: https://www.boe.es/buscar/doc.php?id=BOE-A-2010-11184. (accessed on 11 February 2020).
- Arnbjerg-Nielsen, K.; Willems, P.; Olsson, J.; Beecham, S.; Pathirana, A.; Bülow Gregersen, I.; Madsen, H.; Nguyen, V.-T.-V. Impacts of climate change on rainfall extremes and urban drainage systems: A review. Water Sci. Technol. 2013, 68, 16–28. [Google Scholar] [CrossRef] [PubMed]
- Nafari, R.H.; Ngo, T. Predictive applications of australian flood loss models after a temporal and spatial transfer. Geomat. Nat. Hazards Risk 2018, 9, 416–430. [Google Scholar] [CrossRef]
- Amadio, M.; Rita Scorzini, A.; Carisi, F.; Essenfelder, H.A.; Domeneghetti, A.; Mysiak, J.; Castellarin, A. Testing empirical and synthetic flood damage models: The case of Italy. Nat. Hazards Earth Syst. Sci. 2019, 19, 661–678. [Google Scholar] [CrossRef]
- Federal Emergency Management Agency (FEMA). Department of Homeland Security. Mitigation Division Multi-hazard Loss Estimation Methodology. Flood Model. Hazus-HM MR5 Technical Manual; Federal Emergency Management Agency (FEMA): Washington, DC, USA, 2015; Volume 499. [Google Scholar]
- U.S. Army Corps of Engineers (USACE). HEC-FDA User’s Manual. Flood Damage Reduction Analysis; U.S. Army Corps of Engineers (USACE): Washington, DC, USA, 2016; p. 392.
- Jongman, B.; Kreibich, H.; Apel, H.; Barredo, J.I.; Bates, P.D.; Feyen, L.; Gericke, A.; Neal, J.; Aerts, J.C.J.H.; Ward, P.J. Comparative flood damage model assessment: Towards a European approach. Nat. Hazards Earth Syst. Sci. 2012, 12, 3733–3752. [Google Scholar] [CrossRef]
- IBI Group. Provincial Flood Damage Assessment Study. Prepared for Government of Alberta; IBI Group: Calgary, AB, Canada, 2015. [Google Scholar]
- Carisi, F.; Schröter, K.; Domeneghetti, A.; Kreibich, H.; Castellarin, A. Development and assessment of uni- and multivariable flood loss models for Emilia-Romagna (Italy). Nat. Hazards Earth Syst. Sci. 2018, 18, 2057–2079. [Google Scholar] [CrossRef]
- U.S. Army Corps of Engineers (USACE). Economic Guidance Memorandum (EGM) 04-01, Generic Depth-Damage Relationships for Residential Structures with Basements; U.S. Army Corps of Engineers (USACE): Washington, DC, USA, 2003.
- Jan, H.; Hans, D.M.; Wojciech, S. Global Flood Depth-Damage Functions: Methodology and the Database with Guidelines | EU Science Hub; Joint Research Centre: Ispra, Italy, 2017. [Google Scholar]
- Nafari, R.H.; Ngo, T.; Mendis, P. An assessment of the effectiveness of tree-based models for multi-variate flood damage assessment in Australia. Water 2016, 8, 282. [Google Scholar] [CrossRef]
- Hasanzadeh Nafari, R.; Ngo, T.; Lehman, W. Development and evaluation of FLFAcs—A new Flood Loss Function for Australian commercial structures. Int. J. Disaster Risk Reduct. 2016, 17, 13–23. [Google Scholar] [CrossRef]
- Hasanzadeh Nafari, R.; Ngo, T.; Lehman, W. Calibration and validation of FLFArs-A new flood loss function for Australian residential structures. Nat. Hazards Earth Syst. Sci. 2016, 16, 15–27. [Google Scholar] [CrossRef]
- Olesen, L.; Löwe, R.; Arnbjerg-Nielsen, K. Flood Damage Assessment Literature Review and Recommended Procedure; Cooperative Research Centre for Water Sensitive Cities: Melbourne, Australia, 2017; Volume 4, ISBN 9781921912399. [Google Scholar]
- Vanneuville, W.; Maddens, R.; Collard, C.; Bogaert, P.; De Maeyer, P.; Antrop, M. Impact op mens en economie t.g.v. overstromingen bekeken in het licht van wijzigende hydraulische condities, omgevingsfactoren en klimatologische omstandigheden 2006, 2.
- McGrath, H.; Abo El Ezz, A.; Nastev, M. Probabilistic depth–damage curves for assessment of flood-induced building losses. Nat. Hazards 2019, 97, 1–14. [Google Scholar] [CrossRef]
- Cammerer, H.; Thieken, A.H.; Lammel, J. Adaptability and transferability of flood loss functions in residential areas. Nat. Hazards Earth Syst. Sci. 2013, 13, 3063–3081. [Google Scholar] [CrossRef]
- Hasanzadeh Nafari, R.; Amadio, M.; Ngo, T.; Mysiak, J.; Nafari, R.H.; Amadio, M.; Ngo, T.; Mysiak, J. Flood loss modelling with FLF-IT: A new flood loss function for Italian residential structures. Nat. Hazards Earth Syst. Sci. 2017, 17, 1047–1059. [Google Scholar] [CrossRef]
- Reese, S.; Ramsay, D. RiskScape: Flood fragility methodology. Technical Report: WLG2010-45; New Zealand Climate Change Research Institute, Victoria University of Wellington: Kilbirnie, New Zealand; Wellington, New Zealand, 2010. [Google Scholar]
- Huizinga, H.J.; Dijkman, M.; Barendregt, A.; Waterman, R. HIS - Schade en Slachtoffer Module Versie 2.1; Ministry of Transport and Water Management: The Hague, The Netherlands, 2005. [Google Scholar]
- Milieu- en Natuurplanbureau (MNP). Delft Hydraulics Overstromingsrisico’s in Nederland in een Veranderend Klimaat; Milieu- en Natuurplanbureau (MNP): Delft, The Netherlands, 2007. [Google Scholar]
- Penning-Rowsell, E.; Viavattene, C.; Parode, J.; Chatterton, J.; Parker, D.; Morris, J. The Benefits of Flood and Coastal Risk Management: A Handbook of Assessment Techniques-2010 (Multi-Coloured Manual); book+ CD-ROM with damage data; FHRC: London, UK, 2010. [Google Scholar]
- Federal Emergency Management Agency (FEMA). Hazus Flood Model User Guidance; Federal Emergency Management Agency (FEMA): Washington, DC, USA, 2018.
- Karamouz, M.; Fereshtehpour, M.; Ahmadvand, F.; Zahmatkesh, Z. Coastal flood damage estimator: An alternative to FEMA’s HAZUS platform. J. Irrig. Drain. Eng. 2016, 142, 1–12. [Google Scholar] [CrossRef]
- Cutrell, A.K.; Rozelle, J.; Hines, S.H. FEMA Standard Operating Procedure for Hazus Flood Level 2 Analysis Hazus Flood Model; Federal Emergency Management Agency (FEMA): Washington, DC, USA, 2018.
- Huizinga, J.; De Moel, H.; Szewczyk, W. Global Flood Depth-Damage Functions: Methodology and the Database with Guidelines; Joint Research Centre: Sevilla, Spain, 2017. [Google Scholar]
- Luino, F.; Cirio, C.G.; Biddoccu, M.; Agangi, A.; Giulietto, W.; Godone, F.; Nigrelli, G. Application of a model to the evaluation of flood damage. Geoinformatica 2009, 13, 339–353. [Google Scholar] [CrossRef]
- Freni, G.; La Loggia, G.; Notaro, V. Uncertainty in urban flood damage assessment due to urban drainage modelling and depth-damage curve estimation. Water Sci. Technol. 2010, 61, 2979–2993. [Google Scholar] [CrossRef]
- Pistrika, A.; Tsakiris, G.; Nalbantis, I. Flood depth-damage functions for built environment. Environ. Process. 2014, 1, 553–572. [Google Scholar] [CrossRef]
- Tariq, M.A.U.R.; Hoes, O.A.C.; Van de Giesen, N.C. Development of a risk-based framework to integrate flood insurance. J. Flood Risk Manag. 2014, 7, 291–307. [Google Scholar] [CrossRef]
- Budiyono, Y.; Aerts, J.; Brinkman, J.J.; Marfai, M.A.; Ward, P. Flood risk assessment for delta mega-cities: A case study of Jakarta. Nat. Hazards 2015, 75, 389–413. [Google Scholar] [CrossRef]
- Central Intelligence Agency The World Factbook. Available online: https://www.cia.gov/library/publications/resources/the-world-factbook/index.html (accessed on 11 February 2020).
- Aerts, J.C.J.H.; Botzen, W.J.W. Climate adaptation cost for flood risk management in the Netherlands. In Proceedings of the conference Storm Surge Barriers to Protect New York City Against The Deluge, Brooklyn, NY, USA, 30–31 March 2009; pp. 99–113. [Google Scholar]
- Bussi, G.; Ortiz, E.; Francés, F.; Pujol, L.; De Ingeniería, I.; De València, U.P.; De Vera, C.; Hidrográfica, C.; Ibañez, A.B.; Bellver, P.; et al. Modelación hidráulica y análisis del riesgo de inundación según las líneas guía de la Directiva Marco del Agua. El caso de la Marina Alta y la Marina Baja (Alicante). II Jornadas sobre Ing. del Agua. 2007, 10. Available online: http://lluvia.dihma.upv.es/es/publi/congres/050_JIA2011_PRESENTACION_GB_articulo.pdf (accessed on 10 January 2020).
- Ministry of Agriculture, Fisheries and Food (MAGRAMA). Propuesta de Mínimos Para la Metodología de Realización de los Mapas de Riesgo de Inundación; Ministry of Agriculture, Fisheries and Food (MAGRAMA): Madrid, Spain, 2013. [Google Scholar]
- Valenciana, C. Plan de Acción Sobre Prevención del Riesgo de Inundación en la Comunitat Valenciana (PATRICOVA); Generalitat Valenciana: Valencia, Spain, 2015. [Google Scholar]
- Demarcación Hidrográfica del Cantábrico Oriental. Plan de Gestión del Riesgo de Inundación 2015-2021; Demarcación Hidrográfica del Cantábrico Oriental: San Sebastián, Spain, 2016. [Google Scholar]
- Ritter, J.; Berenguer, M.; Corral, C.; Park, S.; Sempere-Torres, D. ReAFFIRM: Real-time Assessment of Flash Flood Impacts – a Regional high-resolution Method. Environ. Int. 2020, 136, 105375. [Google Scholar] [CrossRef]
- Van Ootegem, L.; Van Herck, K.; Creten, T.; Verhofstadt, E.; Foresti, L.; Goudenhoofdt, E.; Reyniers, M.; Delobbe, L.; Murla Tuyls, D.; Willems, P. Exploring the potential of multivariate depth-damage and rainfall-damage models. J. Flood Risk Manag. 2018, 11, S916–S929. [Google Scholar] [CrossRef]
- Wagenaar, D.; Lüdtke, S.; Schröter, K.; Bouwer, L.M.; Kreibich, H. Regional and temporal transferability of multivariable flood damage models. Water Resour. Res. 2018, 54, 3688–3703. [Google Scholar] [CrossRef]
- Jamali, B.; Löwe, R.; Bach, P.M.; Urich, C.; Arnbjerg-Nielsen, K.; Deletic, A. A rapid urban flood inundation and damage assessment model. J. Hydrol. 2018, 564, 1085–1098. [Google Scholar] [CrossRef]
- Gulf Engineers & Consultants (GEC). Depth-Damage Relationships for Structures, Contents, and Vehicles and Content-to-Structure Value Ratios (CSVR) in Support of the Donaldsonville to the Gulf, Luisiana, Feasibility Study; Gulf Engineers & Consultants (GEC): New Orleans, LA, USA, 2006. [Google Scholar]
- Mitchell, A.; Dodge, B.; Kruzic, P.; Miller, D.; Schwartz, P. Handbook of Forecasting Techniques; National Technical Information Service U. S. Department of Commerce: Springfield, VA, USA, 1975.
- Mitchell, A.; Dodge, B.H. Handbook of Forecasting Techniques. Part 2. Description of 31 Techniques; National Technical Information Service U. S. Department of Commerce: Springfield, VA, USA, 1977.
- Boletín Económico de la Construcción (BEC) Revista de Información Económica (Precios Unitarios y Descompuestos) Dirigida a Profesionales del Sector de la Construcción. No 309. Available online: https://becsl.es (accessed on 1 July 2019).
- Van Vloten, S.O. Vulnerability and Flood Risk in Urban Areas. Bachelor’s Thesis, Universitat Politècnica de Catalunya, Barcelona, Spain, 2014. [Google Scholar]
- Scawthorn, C.; Flores, P.; Blais, N.; Seligson, H.; Tate, E.; Chang, S.; Mifflin, E.; Thomas, W.; Murphy, J.; Jones, C.; et al. HAZUS-MH flood loss estimation methodology. II. Damage and loss assessment. Nat. Hazards Rev. 2006, 7, 72–81. [Google Scholar] [CrossRef]
- Bedford, T.; van Gelder, P.; Guedes Soares, C.; van Manen, S.E.; Brinkhuis, M. Quantitative flood risk assessment for Polders. Reliab. Eng. Syst. Saf. 2005, 90, 229–237. [Google Scholar]
- Statistical Office of the European Communities. Export and Import Price Index Manual: Theory and Practice; International Monetary Fund: Washington, DC, USA, 2009; ISBN 9264085416. [Google Scholar]
- OECD “Long-term baseline projections, No. 103”, OECD. Econ. Outlook Stat. Proj. 2020. Available online: https://doi:10.1787/68465614-en (accessed on 18 February 2020).
- D’Amico, S.; Orphanides, A. Uncertainty and Disagreement in Economic Forecasting; Finance and Economics Discussion Series; Divisions of Research & Statistics and Monetary Affairs, Federal Reserve Board: Washington, DC, USA, 2008. [Google Scholar]
- OECD Real GDP Long-Term Forecast (Indicator). Available online: https://doi.org/10.1787/d927bc18-en (accessed on 18 February 2020).


| Region | Year | Property Types | Classification (Development) | Source |
|---|---|---|---|---|
| Australia | 2016 | Residential | Empirical | [20,21,22] |
| 2017 | Residential, Industrial, Roads | Synthetic | [23] | |
| Belgium | 2006 | Residential, Industrial, Vehicles, Recreation, Agriculture, Railways, Wind turbines | Analytical‒Synthetic | [24] |
| 2018 | Residential, Commerce, Industrial, Roads, Agriculture | Synthetic | [17] | |
| Canada | 2019 | Residential | Synthetic | [25] |
| Czech Republic | 2018 | Residential, Commerce, Industrial, Roads, Agriculture | Synthetic | [17] |
| Germany | 2013 | Residential | Empirical | [26] |
| 2017 | Residential and Commerce | Empirical | [23] | |
| 2018 | Residential, Commerce, Industrial, Roads, Agriculture | Synthetic | [17] | |
| Italy | 2017 | Residential | Empirical | [27] |
| New Zealand | 2010 | Residential, Commerce, Industrial | Empirical‒Synthetic | [28] |
| The Netherlands | 2005 | Residential, Industrial, Vehicles, Recreation, Agriculture, Railways | Synthetic | [29] |
| 2007 | Residential, Industrial, Vehicles, Recreation, Agriculture, Nature | Analytical - Synthetic | [30] | |
| 2018 | Residential, Commerce, Industrial, Roads, Agriculture | Synthetic | [17] | |
| United Kingdom | 2010 – Updated on 2013 | Residential, Non-residential | Empirical‒Synthetic | [31] |
| 2018 | Residential, Commerce, Industrial, Roads, Agriculture | Synthetic | [17] | |
| United States of America | 2019 | Residential, Essential Facilities, Transportation systems, Commerce, Industrial, Vehicles, Agriculture | Analytical‒Empirical | [32,33,34] |
| Switzerland | 2018 | Residential, Commerce, Industrial, Roads, Agriculture | Synthetic | [17] |
| A variety of countries from Europe, Africa, Asia, and South America | 2017 | Residential, Commerce, Industrial, Roads, Agriculture | Analytical‒Empirical | [35] |
| Region | Year | Property Types | Classification (Development) | Source |
|---|---|---|---|---|
| Lombardy (Italy) | 2009 | Residential | Analytical | [36] |
| Palermo (Italy) | 2010, 2014 | Residential | Analytical | [37,38] |
| Chenab River (Pakistan) | 2014 | Residential, Commerce, Industrial, Roads, Agriculture, Nature | Analytical | [39] |
| Jakarta (Indonesia) | 2015 | Residential, Commerce, Industrial | Empirical‒Synthetic | [40] |
| Manila (Philippines) | Synthetic | |||
| Ho Chi Minh (Vietnam) | Empirical‒Synthetic | |||
| Bangkok (Thailand) | Empirical‒Synthetic |
| Building | Furniture and Household Furnishings | Inventory | |||||||
|---|---|---|---|---|---|---|---|---|---|
| Type of Property | N of Records | N of Different Depths | Average Relative Damage | N of Records | N of Different Depths | Average Relative Damage | N of Records | N of Different Depths | Average Relative Damage |
| Dwelling | 100 | 22 | 4.15% | 97 | 20 | 20.38% | |||
| Workshop | 15 | 11 | 13.84% | 15 | 11 | 27.10% | 16 | 8 | 40.33% |
| Health | 8 | 5 | 4.45% | 8 | 5 | 2.75% | |||
| Office | 14 | 10 | 7.42% | 5 | 3 | 39.21% | |||
| Industry | 12 | 10 | 2.74% | 11 | 9 | 9.03% | 12 | 10 | 17.09% |
| Hotel | 2 | 2 | 16.24% | 1 | 1 | 100.00% | |||
| Education | 14 | 8 | 3.32% | 8 | 5 | 2.75% | |||
| Sport | 6 | 4 | 5.96% | ||||||
| Homeowners association | 44 | 14 | 0.56% | ||||||
| General trade | 67 | 23 | 5.07% | 67 | 23 | 19.81% | 52 | 16 | 26.45% |
| Restaurant | 15 | 10 | 11.14% | 14 | 9 | 18.77% | 0 | 3 | 41.41% |
| Car park | 39 | 11 | 0.38% | ||||||
| Warehouse | 18 | 11 | 1.60% | 16 | 10 | 14.70% | 18 | 11 | 23.85% |
| Churches and singular buildings | A single record was available for this type of property. Its corresponding depth‒damage curve has been developed under the criterion of the flood expert surveyor. | ||||||||
| Total | 354 | 141 | 242 | 96 | 98 | 48 | |||
| Depth (cm) | N of Records | Average Value (€/m2) | Average Damage (€/m2) | Relative Average Damage (%) |
|---|---|---|---|---|
| 1 | 1 | 1052.63 | 95.00 | 9.02 |
| 2 | 8 | 434.33 | 8.56 | 2.25 |
| 3 | 11 | 502.28 | 16.33 | 24.85 |
| 4 | 2 | 416.94 | 29.36 | 7.04 |
| 5 | 6 | 411.15 | 12.98 | 2.28 |
| 6 | 2 | 367.71 | 5.33 | 1.45 |
| 7 | 1 | 735.46 | 15.45 | 2.10 |
| 10 | 8 | 415.81 | 4.38 | 1.22 |
| 12 | 1 | 742.41 | 1.14 | 0.15 |
| 15 | 3 | 494.94 | 2.07 | 0.42 |
| 18 | 2 | 741.07 | 4.65 | 0.46 |
| 20 | 8 | 753.99 | 22.61 | 12.32 |
| 30 | 1 | 753.41 | 7.73 | 1.03 |
| 32 | 1 | 493.75 | 18.11 | 3.67 |
| 35 | 1 | 539.77 | 15.64 | 2.90 |
| 40 | 3 | 370.84 | 5.84 | 1.60 |
| 45 | 1 | 453.72 | 6.61 | 1.46 |
| 48 | 2 | 520.17 | 18.92 | 3.70 |
| 60 | 1 | 598.09 | 6.89 | 1.15 |
| 74 | 1 | 842.39 | 4.95 | 0.59 |
| 82 | 1 | 467.29 | 36.78 | 7.87 |
| 85 | 1 | 200.07 | 21.28 | 10.63 |
| 100 | 1 | 750.00 | 137.63 | 18.35 |
| TOTAL | 67 | 567.75 | 21.66 | 5.07 |

| Building (€/m2) | Decile (Di) | Furniture and Household Furnishings (€/m2) | Decile (Di) | Inventory (€/m2) | Decile (Di) | |
|---|---|---|---|---|---|---|
| Dwelling | 999.89 | D9 | 227.51 | D9 | - | - |
| Workshop | 539.00 | D8 | 419.03 | D8 | 190.88 | D8 |
| Health | 1227.75 | D9 | 1871.91 | D8 | 250.00 | Direct estimation |
| Office | 1500.00 | D9 | 401.05 | D9 | - | - |
| Industry | 568.16 | D9 | 1827.36 | D8 | 404.14 | D8 |
| Hotel | 1443.00 | D8 | 208.25 | D8 | 50.00 | Direct estimation |
| Education | 1521.23 | D6 | 151.14 | D8 | - | - |
| Sport | 1811.85 | 90% D9 | 86.68 | D6 | - | - |
| Homeowners association | 1629.62 | D8 | - | - | - | - |
| General trade | 743.93 | D8 | 338.85 | D8 | 394.84 | D8 |
| Restaurant | 1050.74 | D9 | 470.78 | D9 | 60.93 | D9 |
| Car park | 1064.59 | 90% D6 | - | - | - | - |
| Warehouse | 733.43 | D8 | 446.07 | D8 | 853.86 | Average D6 to D9 |
| Churches and singular buildings | 906.00 | Average D6 to D9 | 250.00 | Direct estimation | - | - |
| General sector | Asset | Barcelona | Orihuela | Los Alcázares | Vera | Murcia | San Sebastian | Málaga | Valencia | San Javier | Zaragoza | Lorca |
|---|---|---|---|---|---|---|---|---|---|---|---|---|
| Residential & Others | Build. | 1.00 | 0.42 | 0.30 | 0.29 | 0.26 | 1.11 | 0.50 | 0.44 | 0.30 | 0.39 | 0.23 |
| Furnit. | 1.00 | 0.59 | 0.59 | 0.61 | 0.75 | 0.70 | 0.73 | 0.82 | 0.67 | 0.78 | 0.59 | |
| Commercial | Build. | 1.00 | 0.39 | 0.31 | 0.30 | 0.28 | 0.75 | 0.51 | 0.40 | 0.31 | 0.34 | 0.25 |
| Furnit. | 1.00 | 0.37 | 0.40 | 0.32 | 0.55 | 0.69 | 0.44 | 0.55 | 0.40 | 0.74 | 0.43 | |
| Invent. | 1.00 | 0.41 | 0.37 | 0.33 | 0.45 | 0.49 | 0.44 | 0.57 | 0.37 | 0.49 | 0.38 | |
| Industrial | Build. | 1.00 | 0.47 | 0.25 | 0.31 | 0.22 | 1.13 | 0.53 | 0.48 | 0.25 | 0.31 | 0.20 |
| Furnit. | 1.00 | 0.37 | 0.35 | 0.27 | 0.51 | 0.73 | 0.39 | 0.55 | 0.36 | 0.81 | 0.39 | |
| Invent. | 1.00 | 0.37 | 0.40 | 0.32 | 0.55 | 0.69 | 0.44 | 0.55 | 0.40 | 0.74 | 0.43 |
© 2020 by the authors. Licensee MDPI, Basel, Switzerland. This article is an open access article distributed under the terms and conditions of the Creative Commons Attribution (CC BY) license (http://creativecommons.org/licenses/by/4.0/).
Share and Cite
Martínez-Gomariz, E.; Forero-Ortiz, E.; Guerrero-Hidalga, M.; Castán, S.; Gómez, M. Flood Depth‒Damage Curves for Spanish Urban Areas. Sustainability 2020, 12, 2666. https://doi.org/10.3390/su12072666
Martínez-Gomariz E, Forero-Ortiz E, Guerrero-Hidalga M, Castán S, Gómez M. Flood Depth‒Damage Curves for Spanish Urban Areas. Sustainability. 2020; 12(7):2666. https://doi.org/10.3390/su12072666
Chicago/Turabian StyleMartínez-Gomariz, Eduardo, Edwar Forero-Ortiz, María Guerrero-Hidalga, Salvador Castán, and Manuel Gómez. 2020. "Flood Depth‒Damage Curves for Spanish Urban Areas" Sustainability 12, no. 7: 2666. https://doi.org/10.3390/su12072666
APA StyleMartínez-Gomariz, E., Forero-Ortiz, E., Guerrero-Hidalga, M., Castán, S., & Gómez, M. (2020). Flood Depth‒Damage Curves for Spanish Urban Areas. Sustainability, 12(7), 2666. https://doi.org/10.3390/su12072666