1. Introduction
In recent decades, with rapid urbanization and climate change, urban floods have caused large losses. According to the statistics of the Ministry of Water Resources of the People’s Republic of China, 104 cities in China were affected by urban floods in 2017, which led to 316 people dead, 39 people missing, temporary closure of 243 airports and ports, and a direct economic loss of 241.35 billion yuan, which accounted for 0.26% of the GDP in 2017 [
1]. Countries all over the world pay attention to urban flood early warning and mitigation due to the potentially huge economic losses and casualties caused by urban flood disasters [
2,
3]. Therefore, obtaining timely and highly accurate waterlogging depth information with wide coverage is urgently needed for emergency response and risk mitigation, especially using an affordable, accurate, and widespread approach [
4].
Currently, three main methods are available for waterlogging depth measurement: obtaining the graduated scale data from images with the water level line, using water level sensors to monitor water level, and simulating runoff process using a meteorological hydrological model. Among these methods, the first requires special images with the water level line, but only a few places near rivers, reservoirs, or water conservancy facilities have a marked water level line [
5,
6]. As a result, this approach cannot be widely used. Water level sensors are useful devices that can monitor water level accurately. However, a water level sensor is too expensive to be deployed to a whole city [
7,
8,
9,
10]. The meteorological hydrological model is also commonly used to measure waterlogging depth by simulating the waterlogging depth ahead of time, but it is easily confined by data. Additionally, the model is too complex to quickly simulate the waterlogging process in detail [
11,
12,
13].
With the development of Internet technology, increasing numbers of objects and devices are connected to the Internet, gathering various data from the real world and finally forming big data. In hydrology, the data obtained from conventional sources no longer meet the requirements of rapid urbanization and global climate change. Big data provide a new data source to solve this problem [
14,
15]. Much research has showed that big data provide a new opportunity for effective waterlogging information detection. For example, Jiang et al. used the transfer learning method to extract waterlogging depth from video images [
16]. Zhang et al. used the copious amounts of information from social media and satellite data to improve urban waterlogging analysis, and used a multi-view discriminant transfer learning method to transfer knowledge to small cities [
17]. Xiao et al. presented a real-time identification method for urban-storm disasters using Sina Weibo data and used the June 2016 heavy rainstorm in Nanjing as an example [
18].
Artificial intelligence is the best choice of technology for extracting knowledge from big data. Deep learning, one artificial intelligence method, is a state-of-the-art image object detection model. In 2012, AlexNet was proposed and was considered to be a watershed in image processing. AlexNet shifted the focus of image processing research from manual feature extraction to neural-network-based extraction within a deep learning framework [
19]. Afterwards, deep learning technology developed rapidly in the field of image processing. Several types of object detection models based on deep learning have been proposed, including a region-based convolutional neural network (R-CNN) [
20], single shot detector (SSD) [
21], you only look once (YOLO) [
22], a deconvolution network [
23], and DeepLab [
24]. Based on R-CNN, the region-based fully convolutional network (R-FCN) [
25], fast region-based convolutional neural network (Fast R-CNN) [
26], faster region-based convolutional neural network (Faster R-CNN) [
27], and mask region-based convolutional neural network (Mask R-CNN) [
28] were proposed. Several common reference objects can be used as “rulers”, such as pavement fences, trash bins, and traffic buckets [
29]. However, in highly urbanized areas, vehicles are the most ubiquitous reference objects. Vehicle tires with fixed and known heights can be used to measure waterlogging depths as rulers.
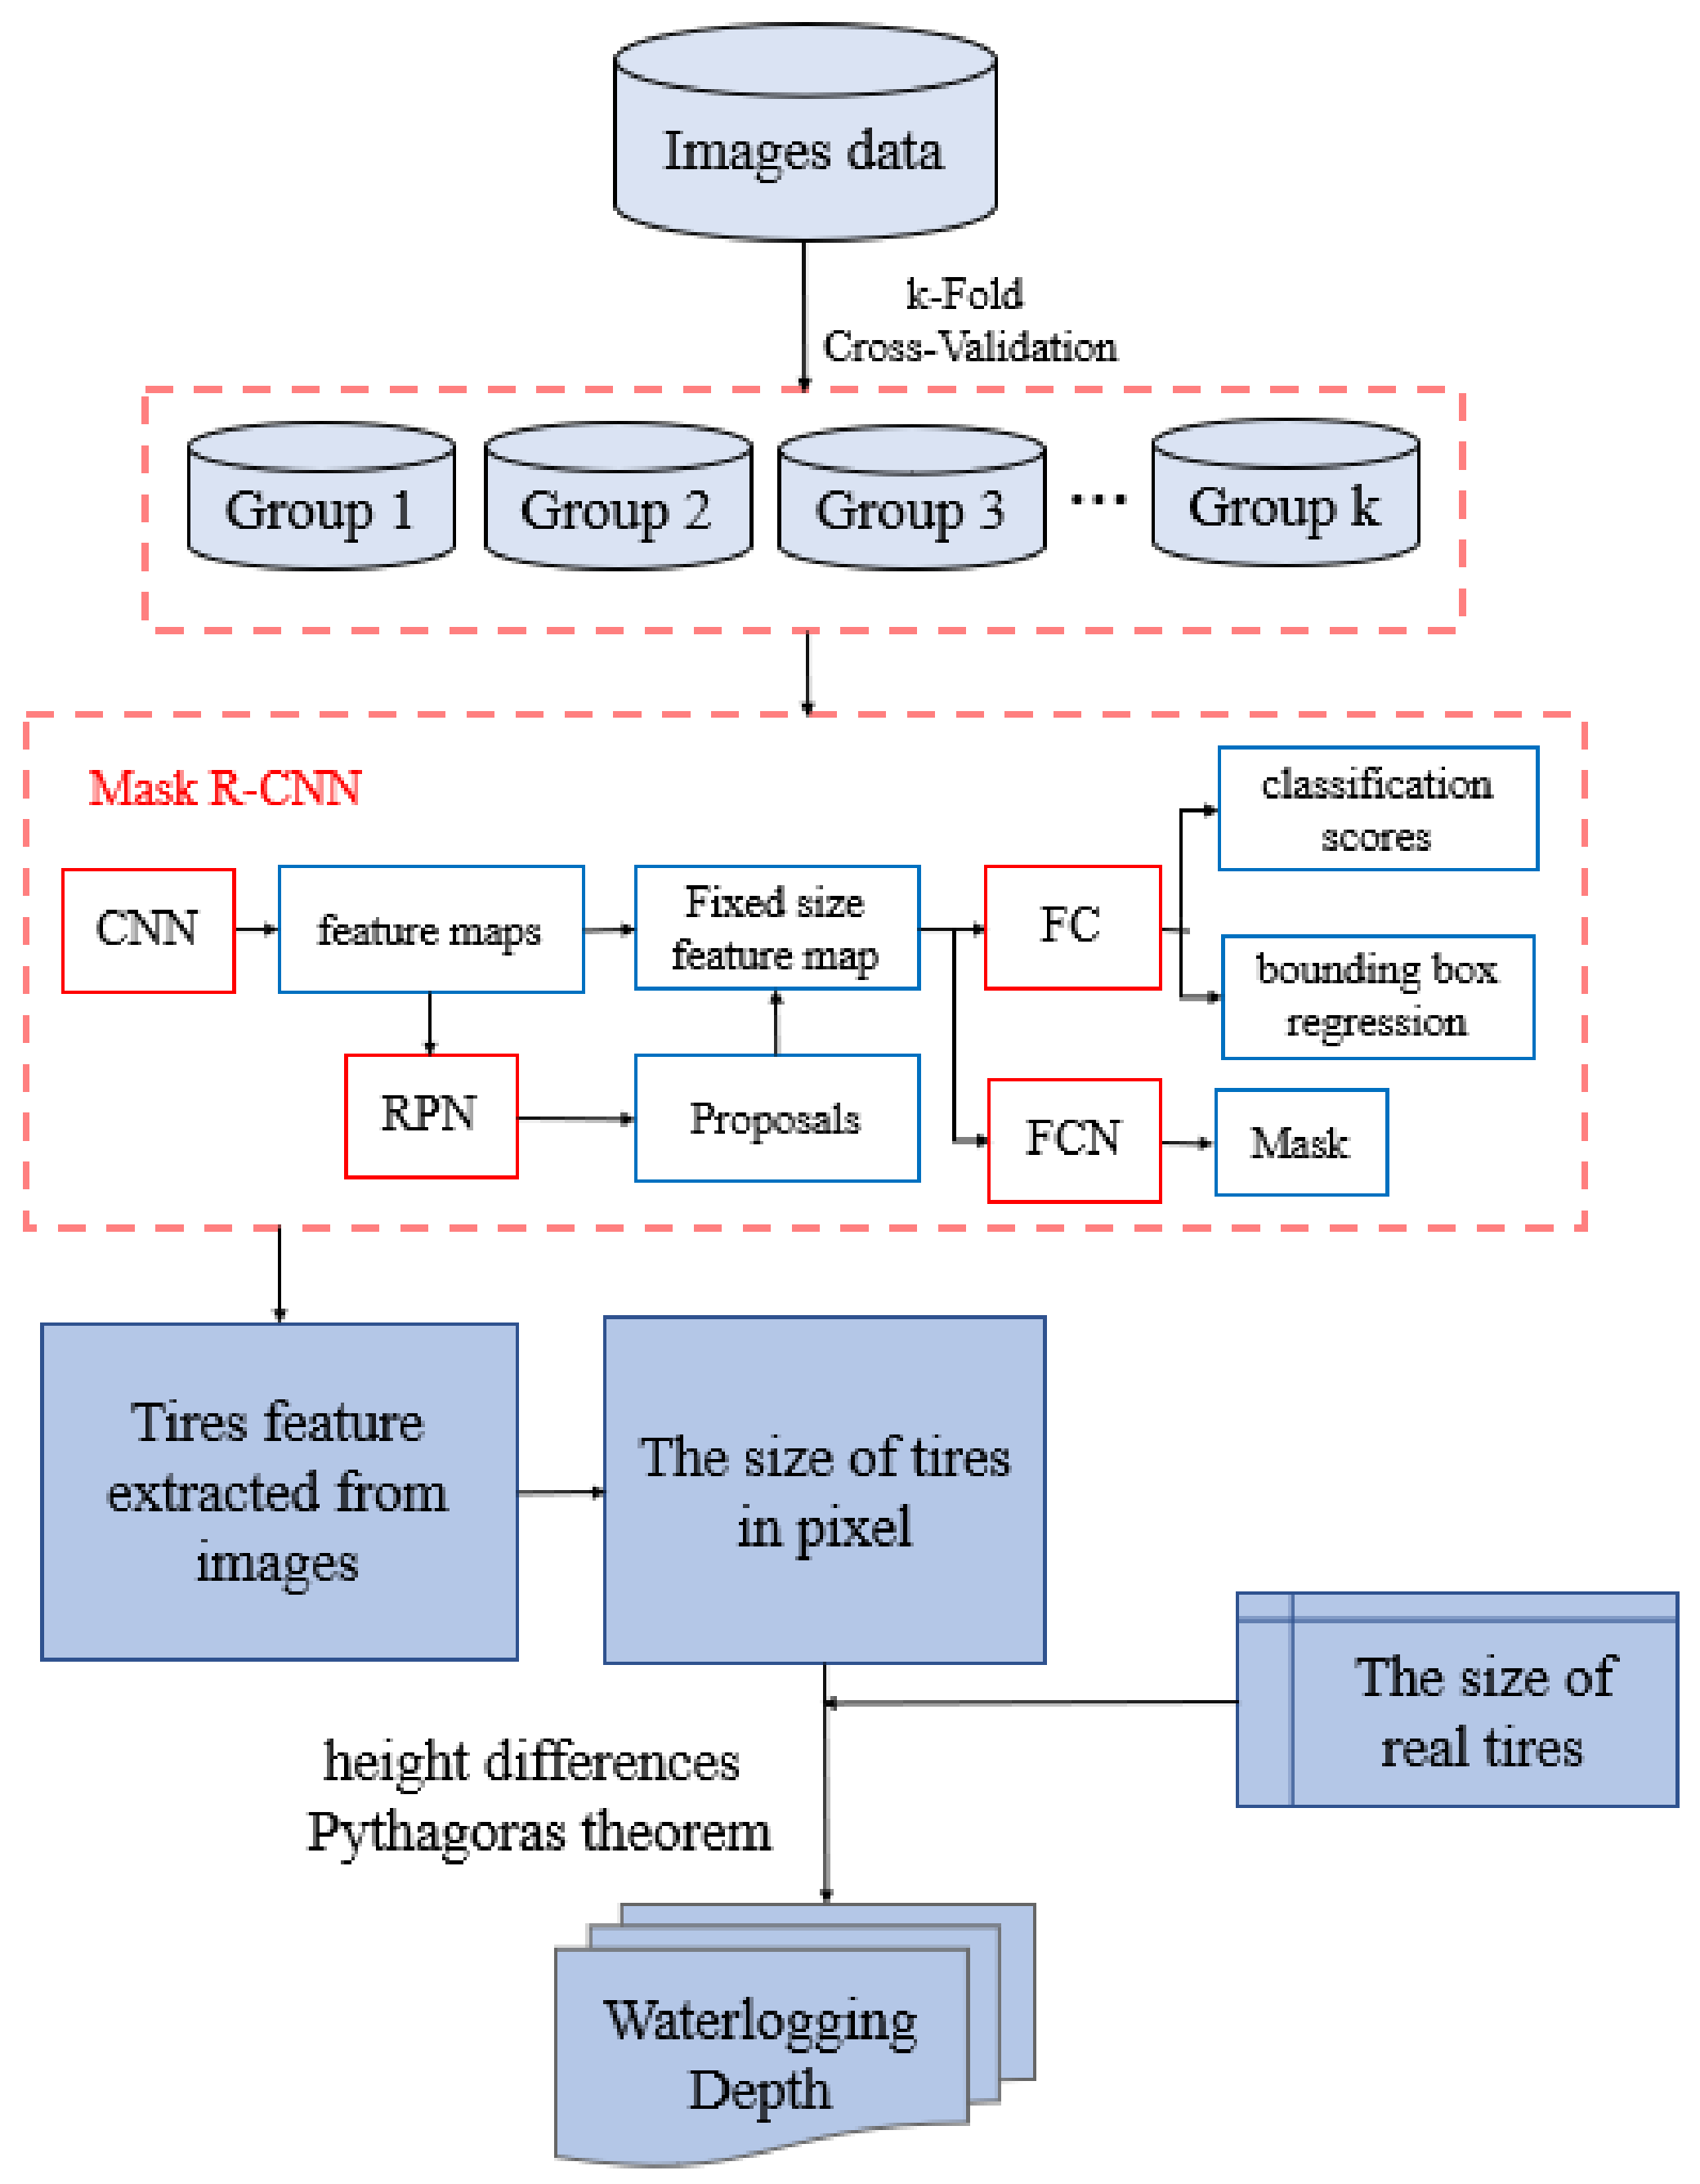
In this study, a novel approach for waterlogging depth measurement was developed based on the Mask R-CNN model, and the images with tires were collected from social network platforms and traffic surveillance video systems. As shown in
Figure 1, vision-based waterlogging depth measuring involves two tasks: detecting the feature of the tires in waterlogging from images based on the Mask R-CNN model, and then calculating waterlogging depth by using the height difference or Pythagorean theorem. In flooding periods, when the vehicle passes through waterlogging areas, the upper part of its tires above the water level can be observed. The waterlogging depth is the height of the part of the tire that is submerged. So, the waterlogging depth can be calculated by the height difference or Pythagorean theorem using the feature size of the tires in the images. Finally, many experiments were conducted to validate the proposed approach using test images. Eventually, an enforceable and effective vision-based approach was constructed that enhances the ability to use big data for urban waterlogging depth measurement.
2. Methodology and Materials
2.1. Detection of Vehicle Tires Using Mask R-CNN Model
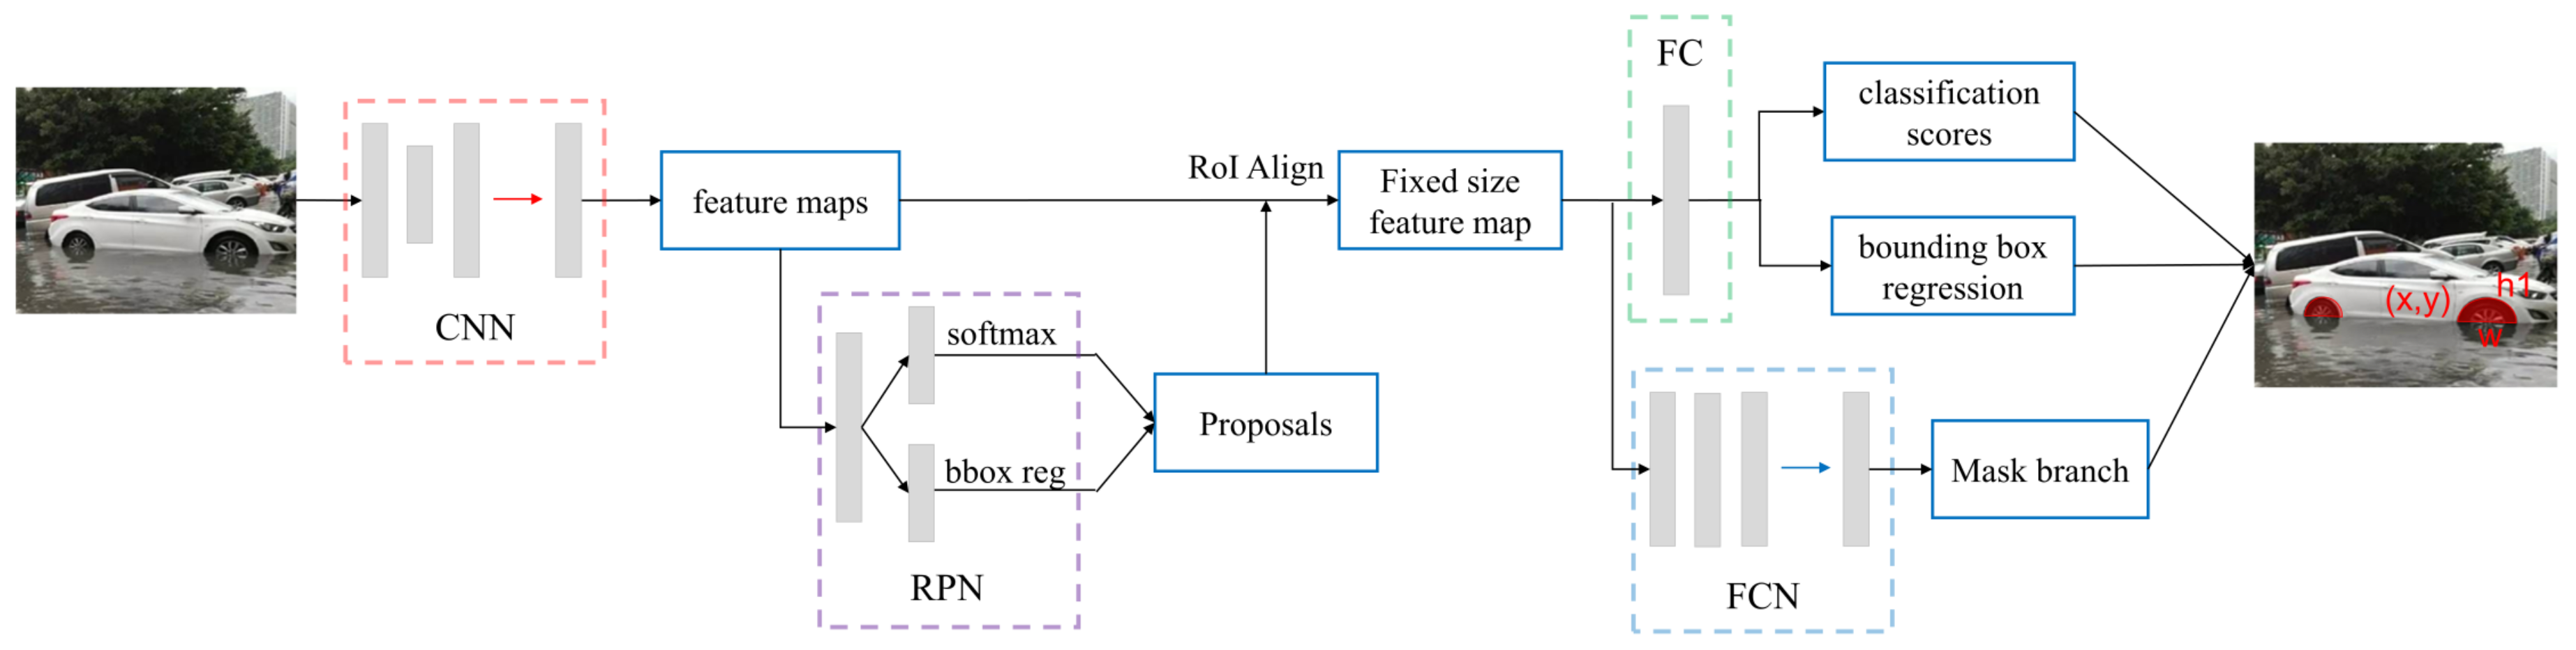
Mask R-CNN, which is part of the R-CNN family, can be used to achieve pixel level image segmentation. Mask R-CNN replaces Region of Interest (RoI) pooling with RoIAlign, which can detect more small objects in the image. In Mask R-CNN, an additional mask layer is added, which has a FCN structure. Mask R-CNN works as follows (
Figure 2):
- (1)
Take a preprocessed image as input, which includes target objects, and pass it to a pre-trained convolutional neural network, which returns the feature map for that image.
- (2)
Pass the feature maps through a region proposal network (RPN) to obtain a series of object proposals along with their object score.
- (3)
A RoIAlign layer is applied on these proposals to refine the proposals and generate segments.
- (4)
Finally, the proposals are passed to a fully connected (FC) layer to predict the class label, bounding box (bbox), and object mask.
The multi-task loss function of Mask R-CNN combines the loss of classification, localization, and segmentation mask, which is described in Equation (1):
where
is classification loss,
is candidate box regression loss, and
is a mask layer loss.
The mask branch generates a mask of dimension
for each RoI and each class. There are
K classes in total. Thus, the total output is of size
.
is defined as the average binary cross-entropy loss, only including the
kth mask if the region is associated with the ground truth class k. It is defined as in Equation (2):
where
is the label of cell (
i,
j) in the true mask for the region of size
, and
is the predicted value of the same cell in the mask learned for the ground truth class
k.
2.2. Validation of the Tire Detection
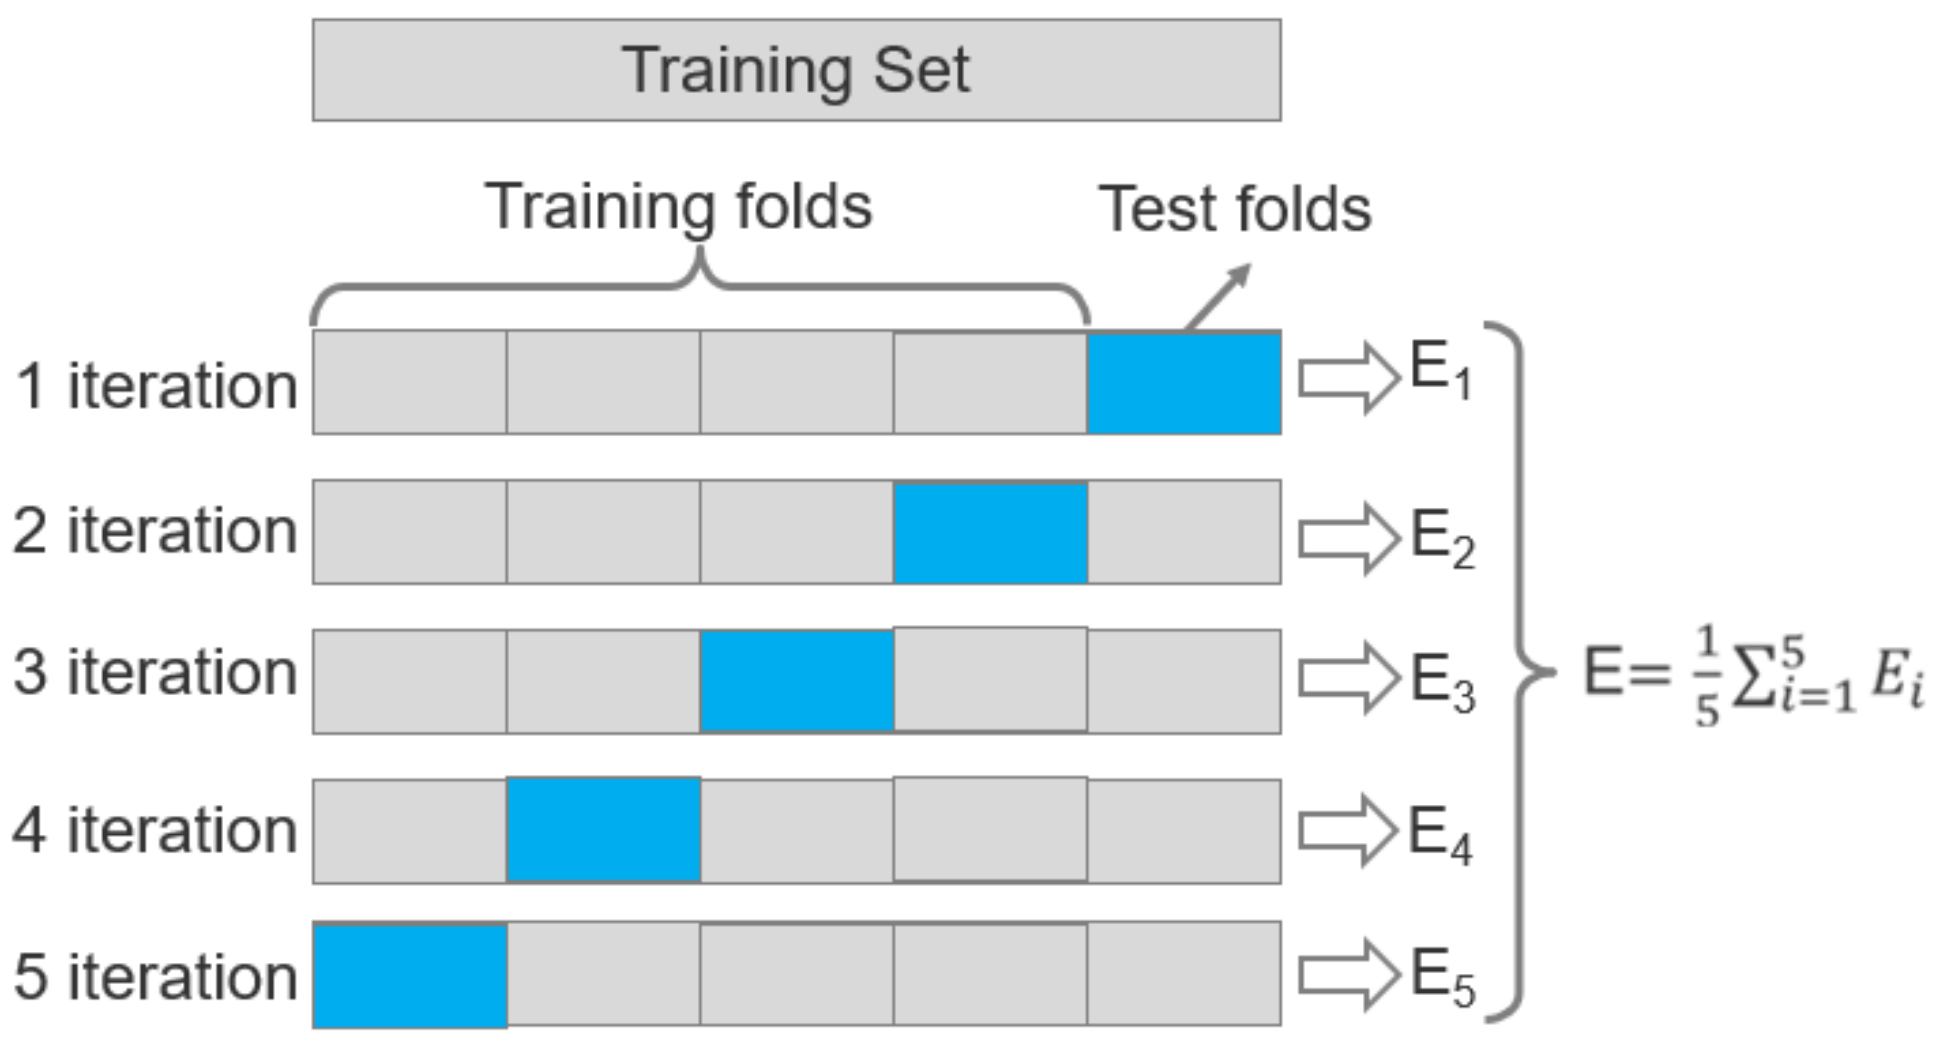
Mask R-CNN model structures are determined using
k-Fold Cross-Validation. There is a single parameter called k in the
k-Fold Cross-Validation procedure, which represents the number of groups into which a given data sample is split. A bias-variance trade-off is associated with the choice of
k in
k-fold cross-validation. Empirically, 5 is the best value of
k, as has been shown in test error rate estimates that suffer neither from excessively high bias nor from very high variance [
30].
The procedure is as follows (
Figure 3). Firstly, shuffle the images randomly. Second, split the images into five groups. Every group is disjointed and of the same size. Then, for each training process, one group is selected as the validation set, and the other four groups are integrated as the training set. So, for the tire detection model, five iterations of the training and validation are performed. Finally, after five iterations, the average of five validation results indicates the performance evaluation index of the model, which is described in Equation (3):
where
represents the cross-validation error of the
ith group.
2.3. Calculation of Waterlogging Depth
We used two methods to calculate the waterlogging depth. In the first, we used the height differences between the entire height of tires and the height of the observed upper part of the tires. For the second, we used the Pythagorean theorem to calculate the waterlogging depth.
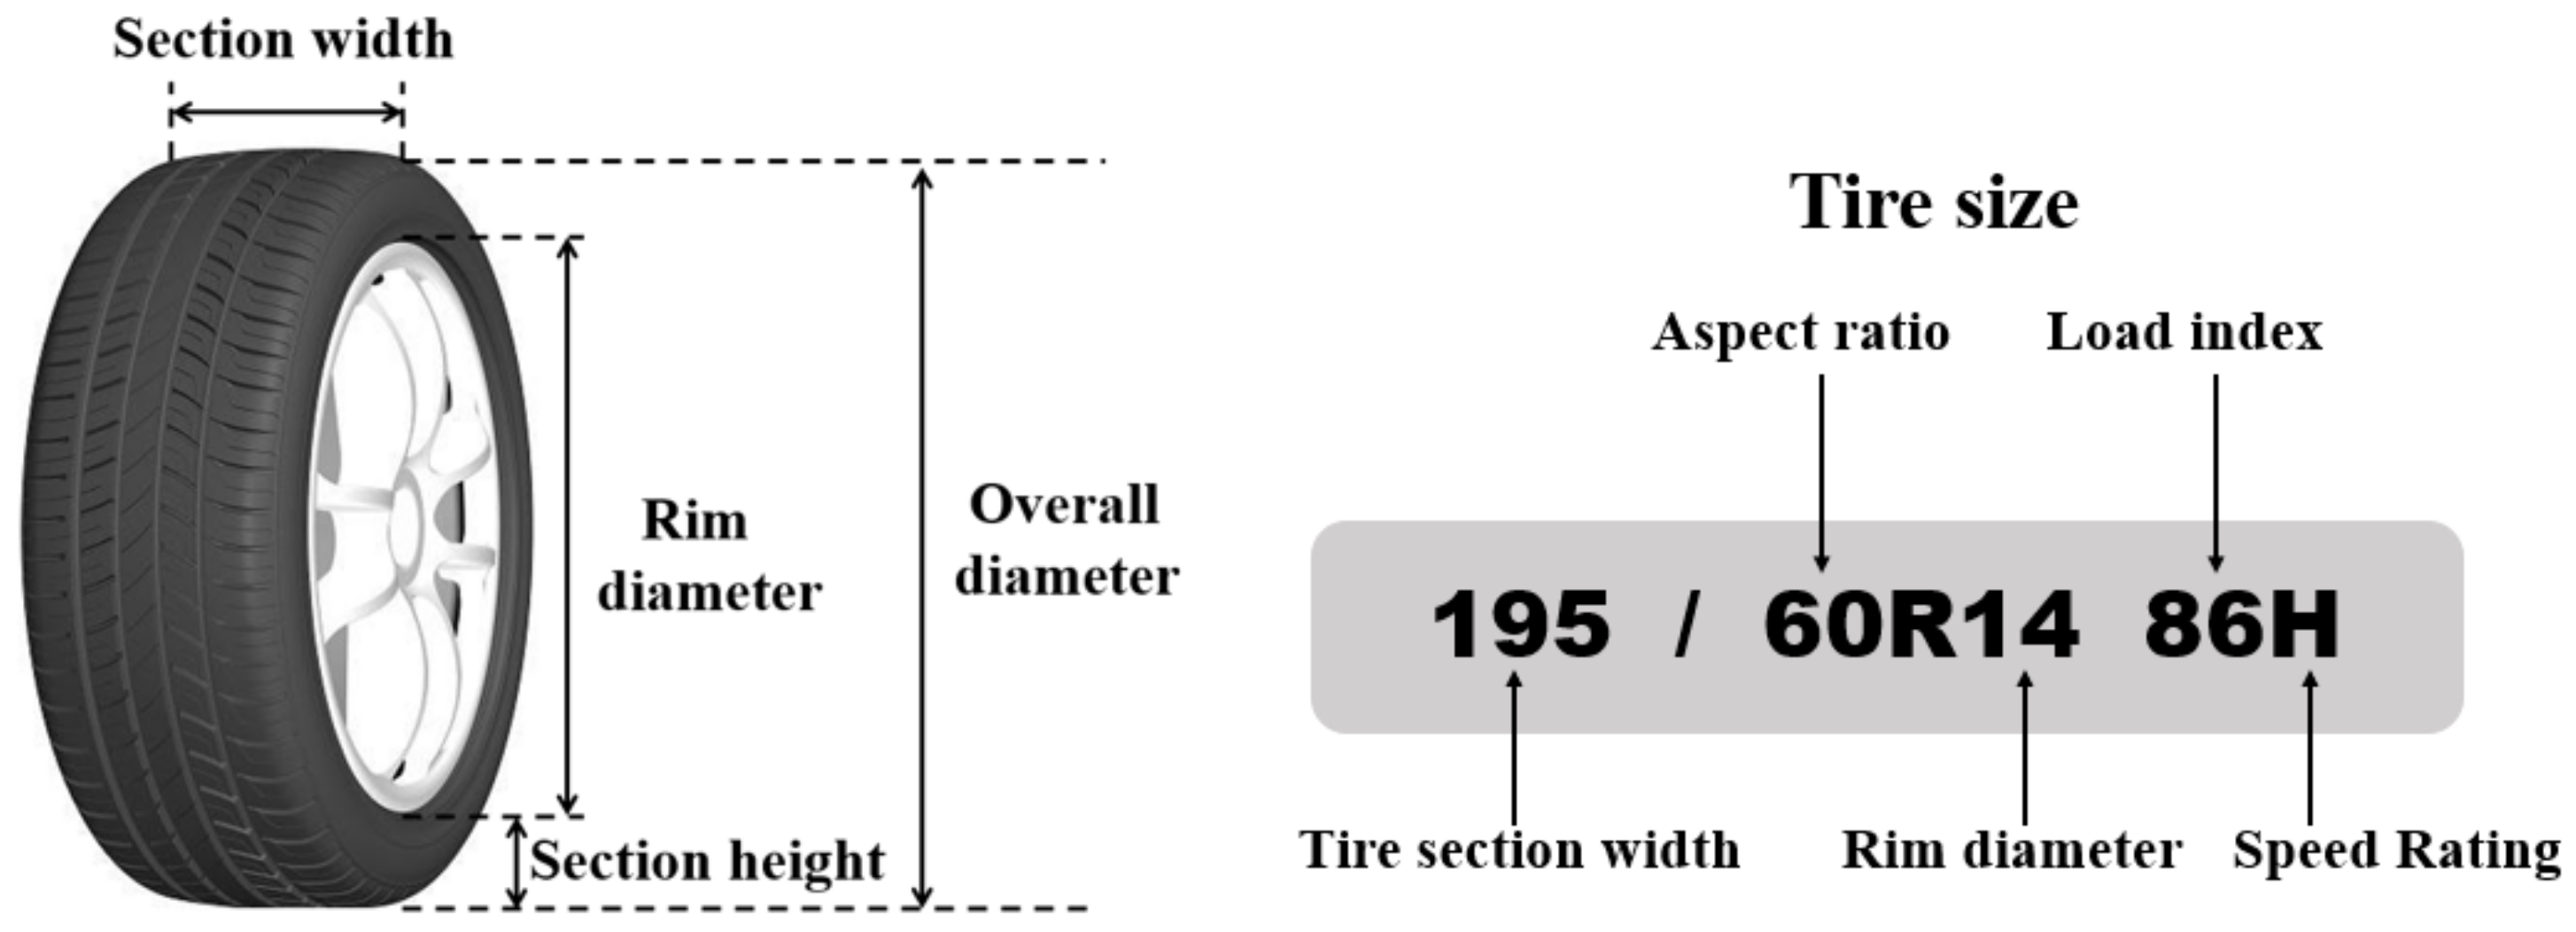
In
Figure 4, the entire height of tires can be calculated using Equations (4) and (5).
where
is the overall diameter,
is the rim diameter,
is the aspect ratio,
is the section width, and
is the section height.
The overall diameter can be estimated by using Equation (6):
2.3.1. The Method of Height Differences
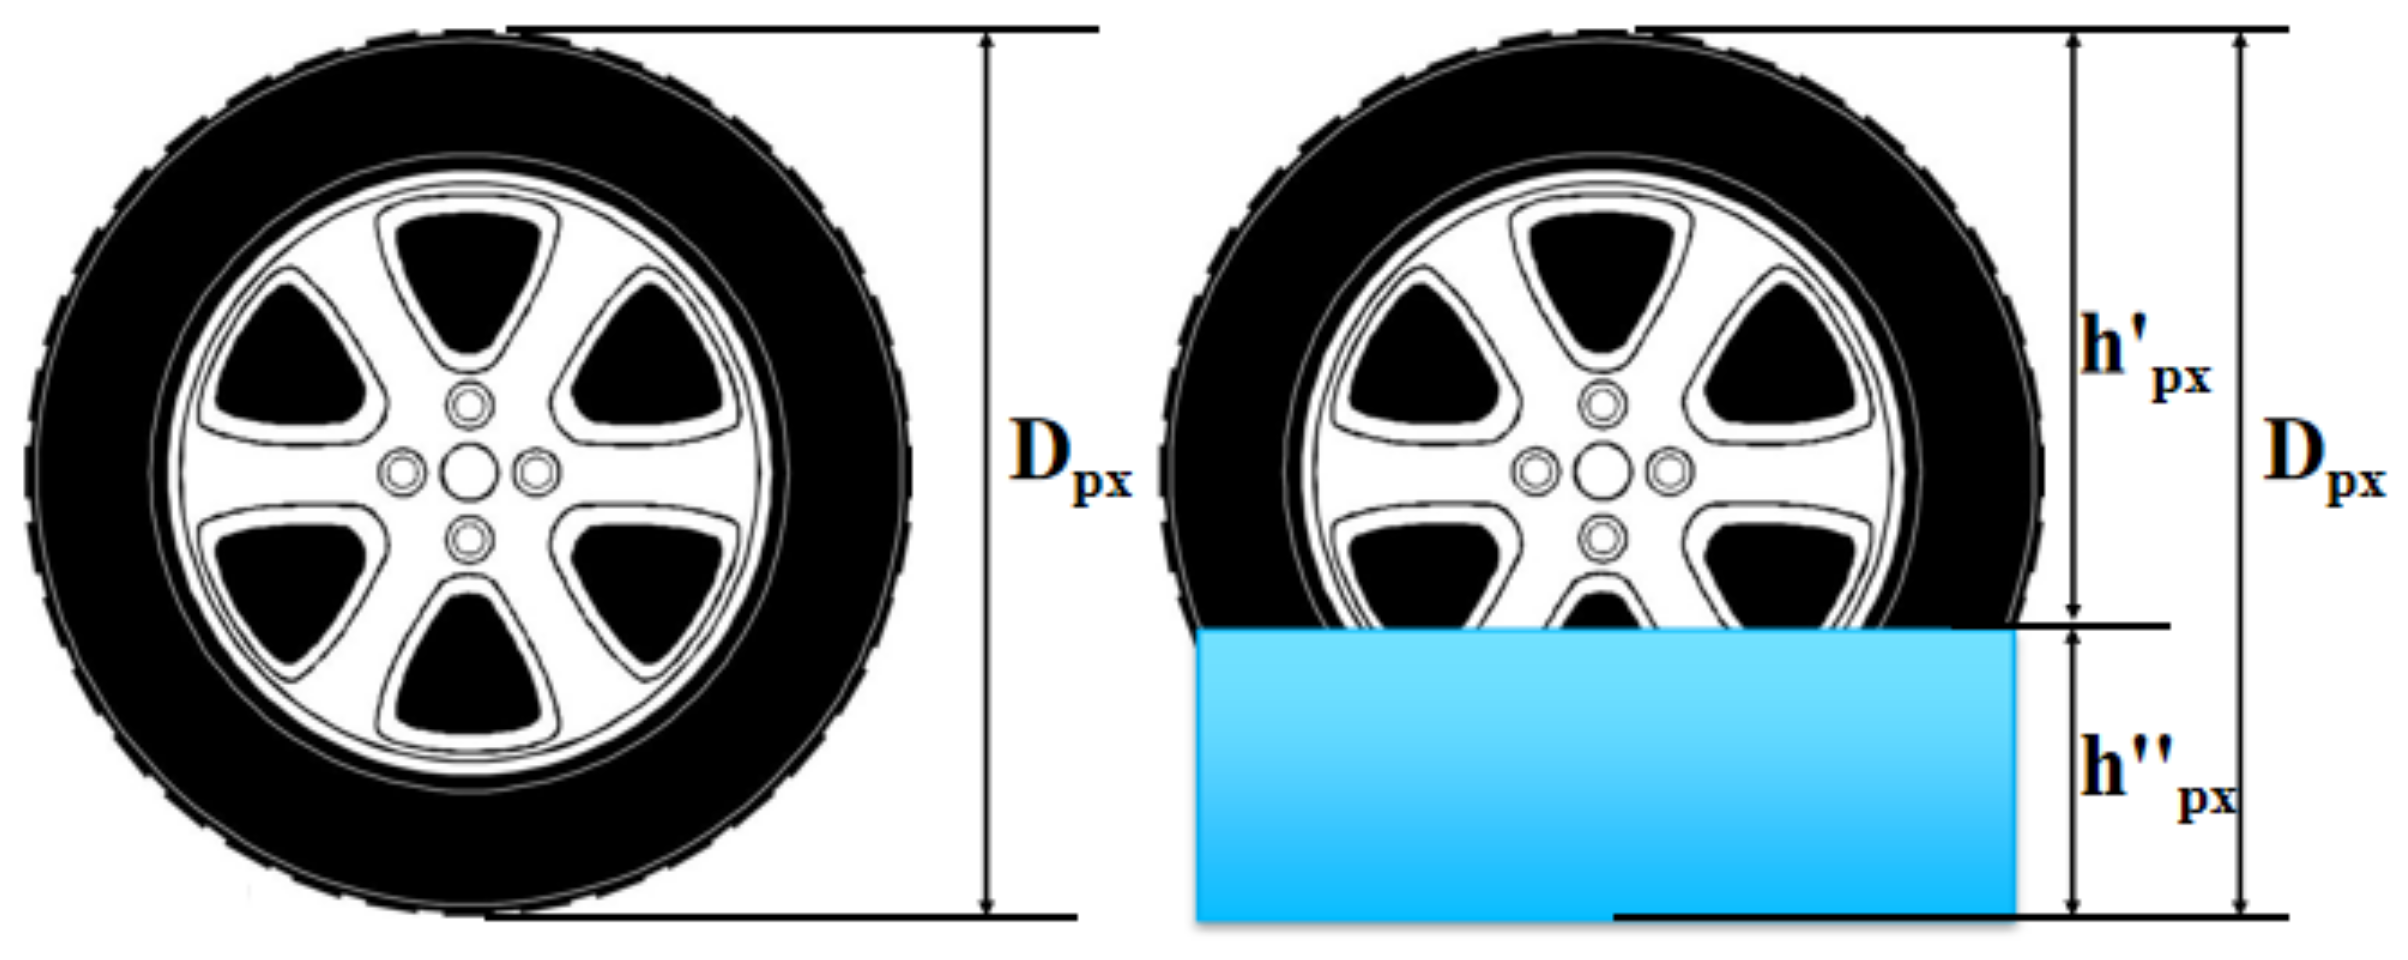
The waterlogging depth can be estimated by using the height differences between the entire height of the tire and the height of the observed upper part of the tire, as shown in
Figure 5.
The height of a detected reference object can be calculated based on its bounding boxes by using Equation (7):
where
is the depth of waterlogging in pixel units,
is the entire height of tires in pixel units, and
is the height of the observed upper part of the tires in pixel units. According to the same ratio between the actual height and the height in pixel units of the entire height of tires and the height of the observed upper part of the tires, the actual depth of waterlogging
is described by Equation (8):
2.3.2. Pythagorean Theorem Method
The waterlogging depth can be also estimated by using the Pythagorean theorem as shown in
Figure 6 and
Figure 7.
Firstly, judge whether the depth of waterlogging is higher than a half of the tire height or not.
- (1)
If the depth of waterlogging is higher than a half of the tire height, then the depth of waterlogging in pixel units is calculated as shown in
Figure 6.
The depth of waterlogging is calculated as follows:
where
is the radius of the tire in pixel units, and
is the width of the observed upper part of the tires in pixel units. The depth of waterlogging in pixel units
(Equation (11)) can be estimated by using Equations (9) and (10):
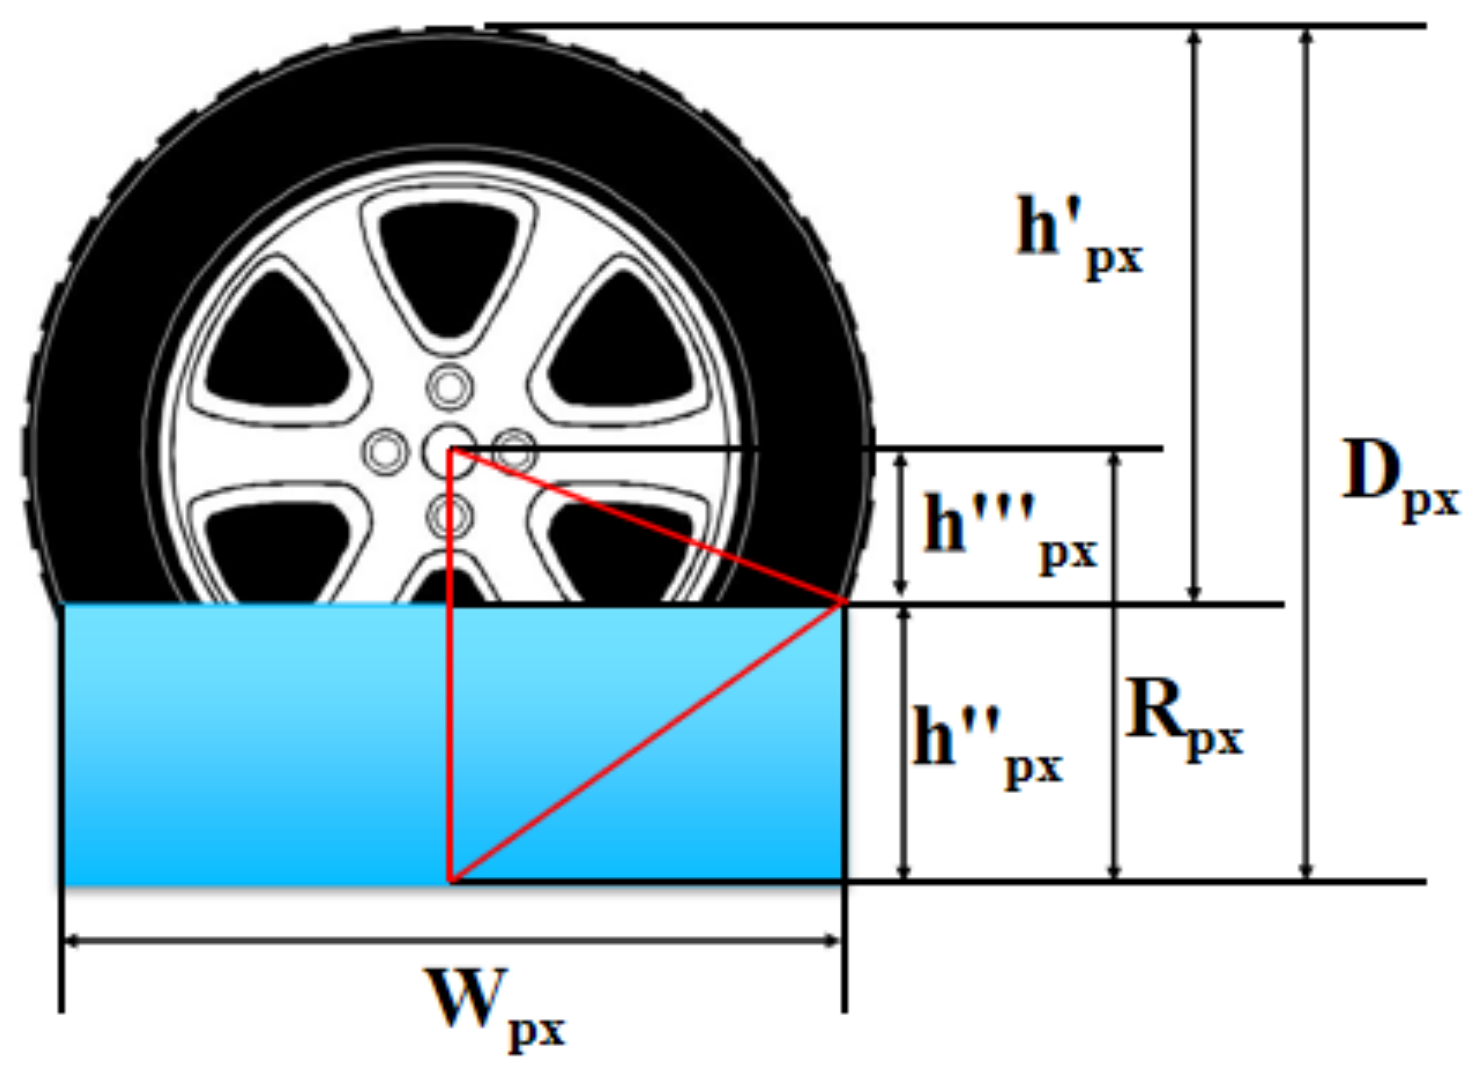
- (2)
When the depth of waterlogging is lower than half of the tire height, the depth of waterlogging in pixel units is calculated as shown in
Figure 7.
The depth of waterlogging is calculated as follows:
The depth of waterlogging in pixel units
can be estimated using Equations (10) and (12):
So, the actual depth of waterlogging
(Equation (14)) can be estimated by using Equations (11) and (13):
2.4. Study Area and Materials
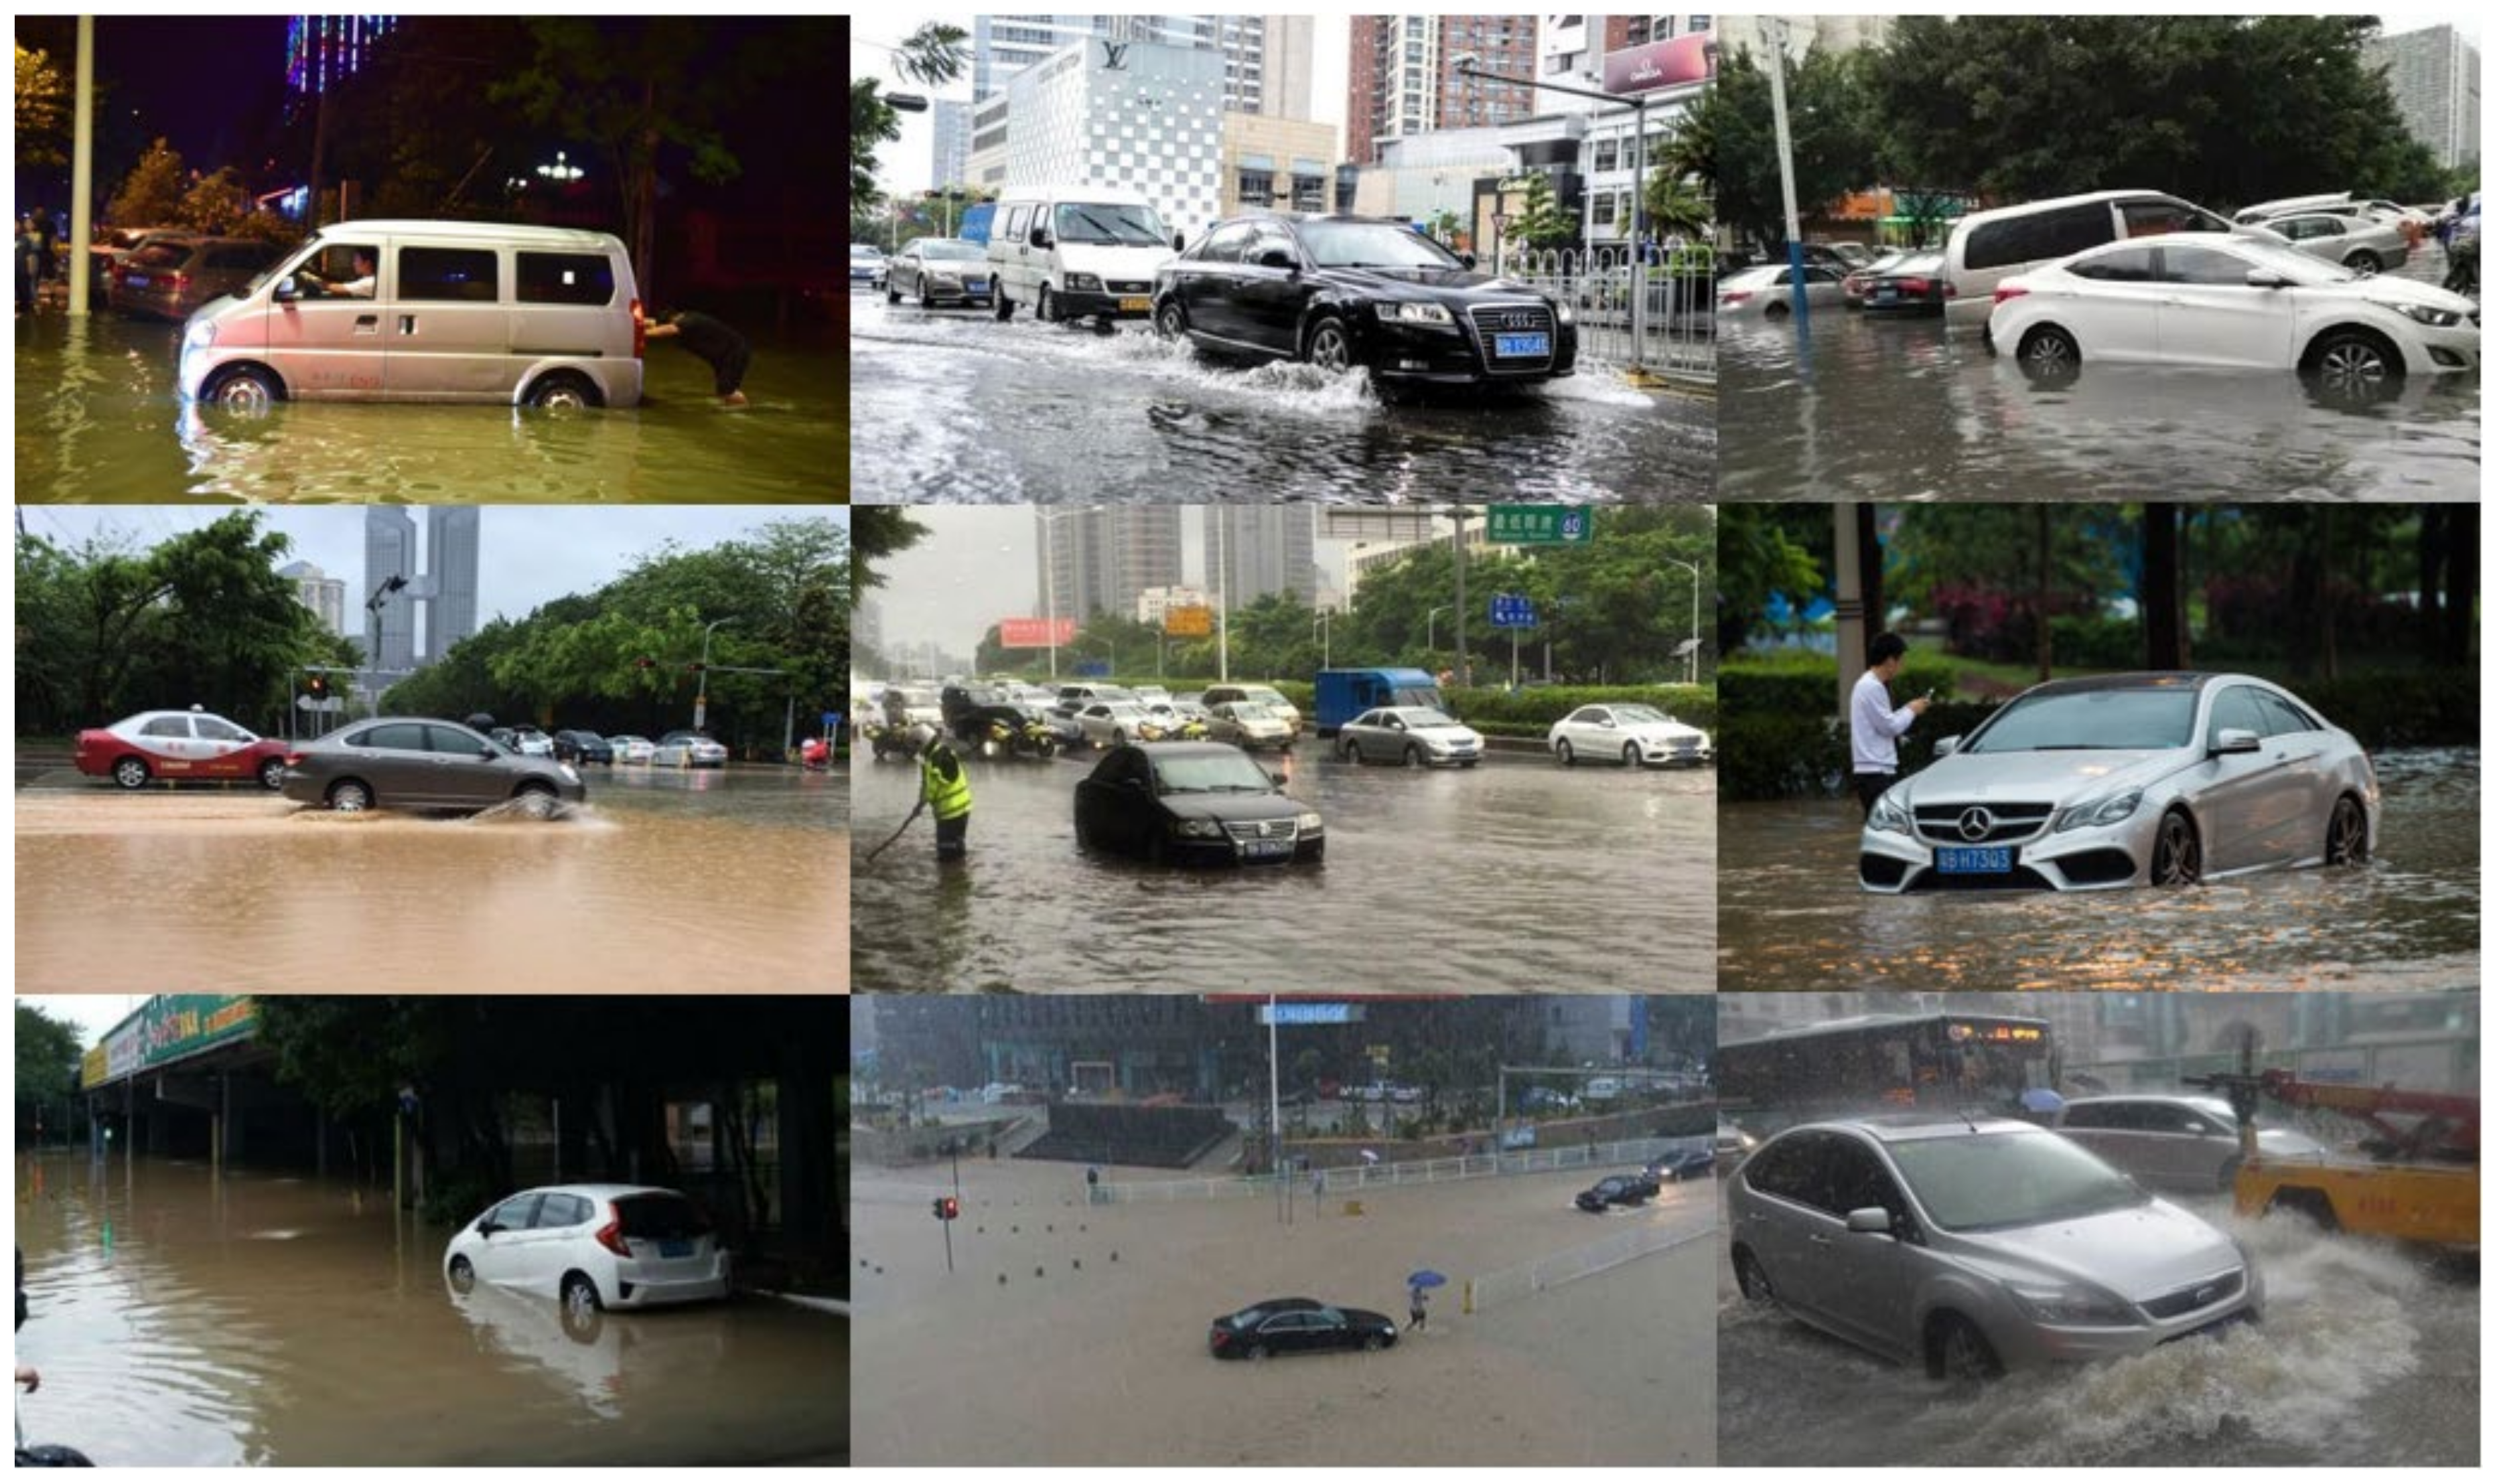
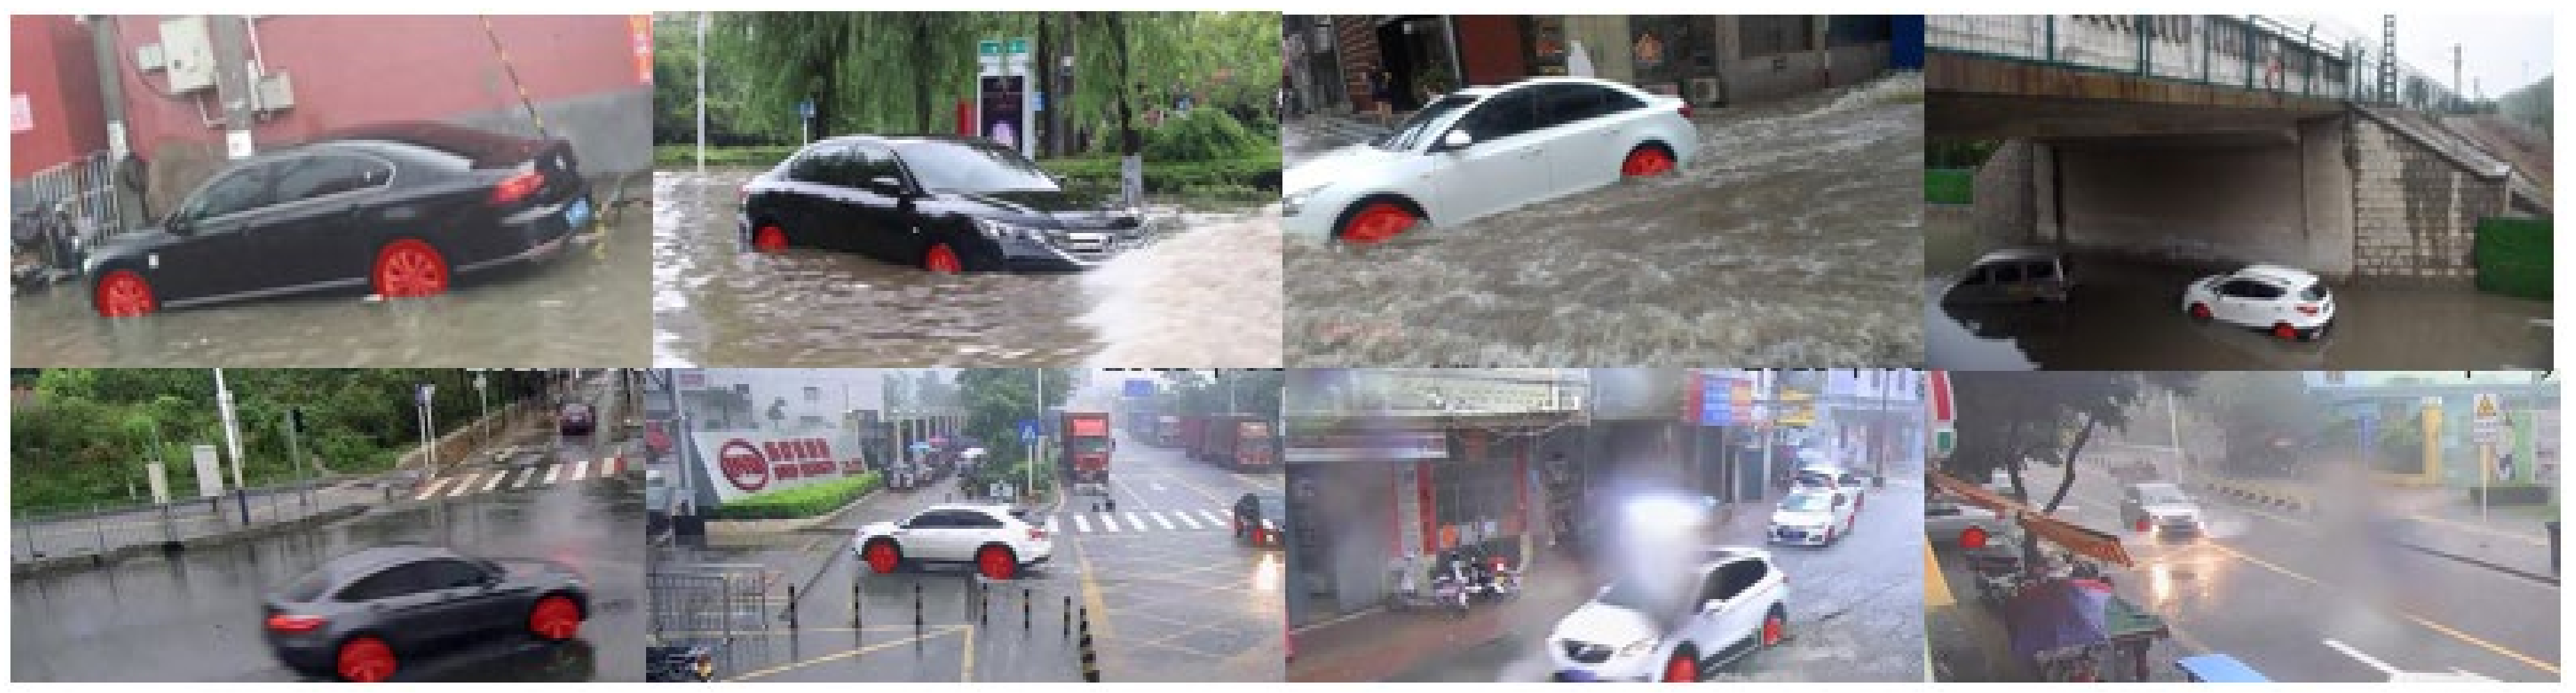
With the development of the Internet and perfected traffic surveillance video systems, many images and videos are collected. Most of the images from social network platforms are used to communicate and share news with friends, or make comments about some notable social issues. The videos from traffic surveillance video systems are used to monitor and recording traffic violations or other offences. These image data provide excellent materials for opportunistic waterlogging monitoring sensing. In this study, two data sets were collected to evaluate the effectiveness of the proposed approach. One data set was collected from social network platforms (
Figure 8) in Futian district in Shenzhen, China, and the others were collected from a traffic surveillance video system (
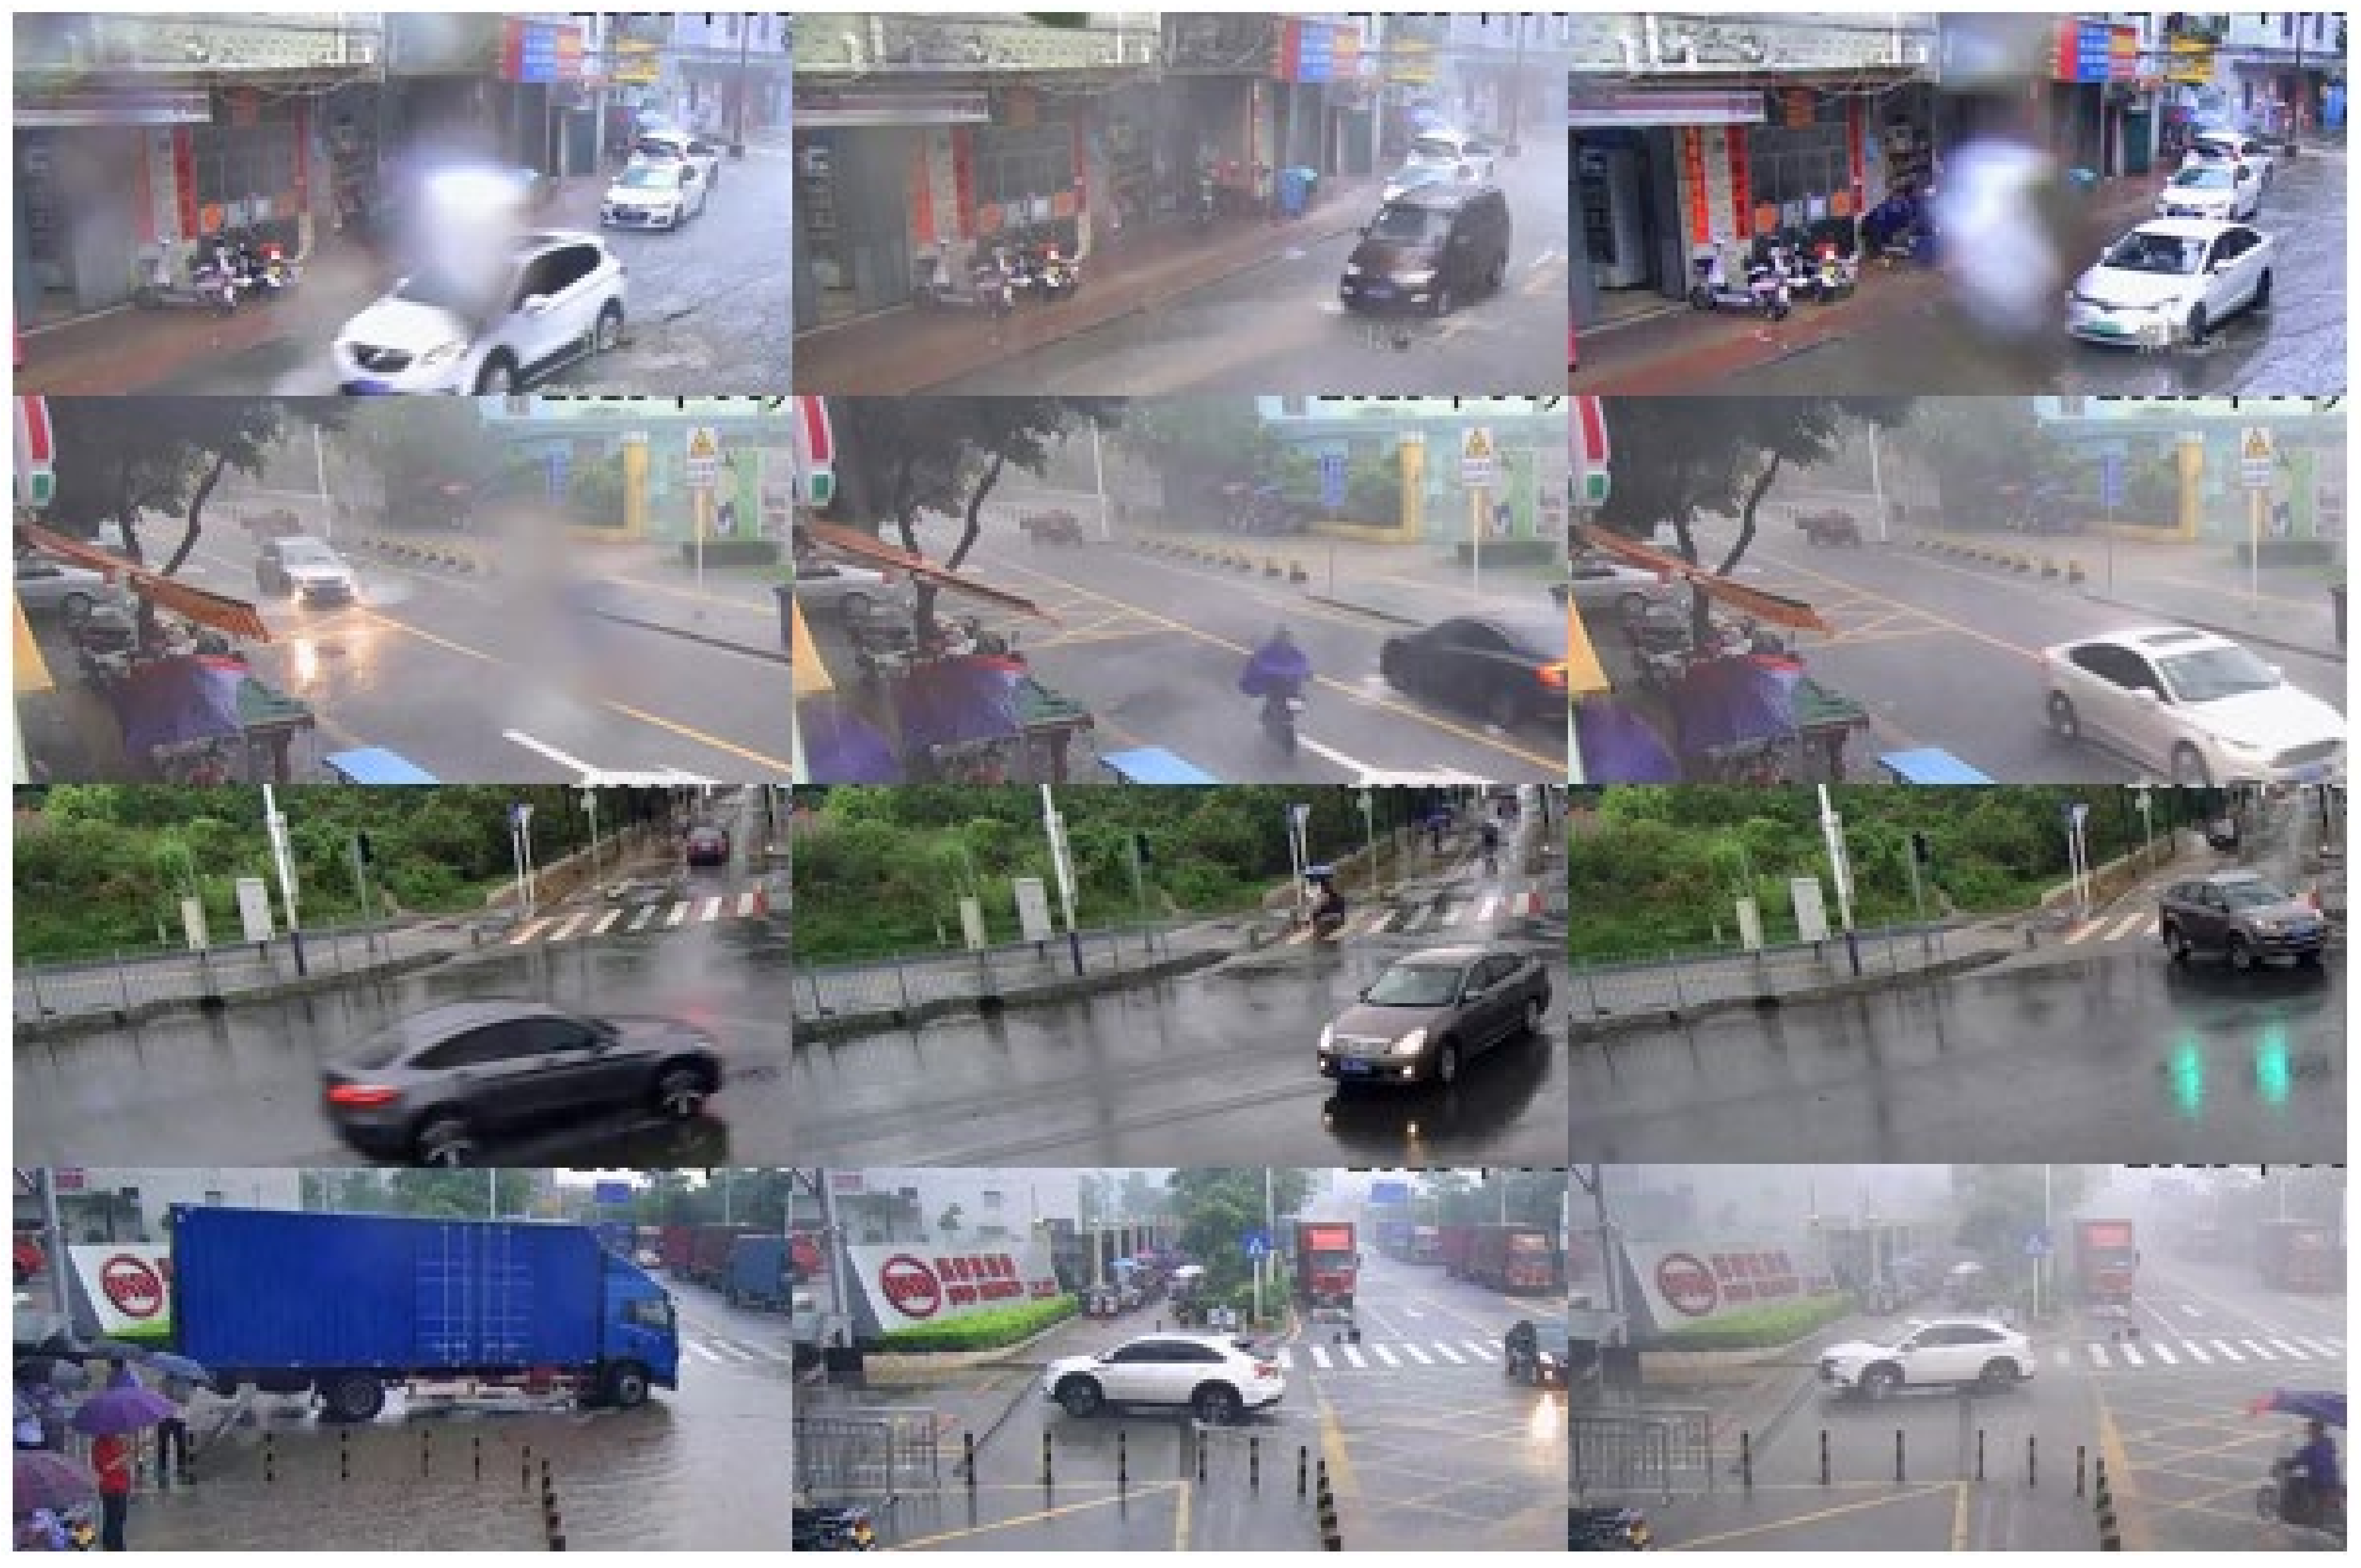
Figure 9) in Pingshan district in Shenzhen, China.
The images data set collected from the Sina micro-blog in Futian included 200 JPG images with different sizes. These images were resized to 400 × 400 pixels to meet the input requirements of Mask R-CNN. The images from the Sina micro-blog were manually annotated for the model of tires detection. Each image was associated with an observed tire shape annotation.
The video data set contained four videos from four different positions in Pingshan traffic surveillance video system. The videos, which contained tires in waterlogging, totaled one hour with 25 frames per second (fps), and each frame captured an image. As such, the total number of all the images was 360,000. However, the images with short time intervals were almost the same and not all the images showed tires in waterlogging. An image containing tires in waterlogging was selected every 30 s. Finally, after removing sensitive information, 397 images were selected to evaluate the effectiveness of the proposed approach. The uniform standard size of the images is 1440 × 900 pixels. As the same as the previous step, these images are resized to 400 × 400 pixels to meet the input requirements of Mask R-CNN. For model training and validation, the images were also manually annotated for the tire detection model. Each image was associated with an observed tire shape annotation.
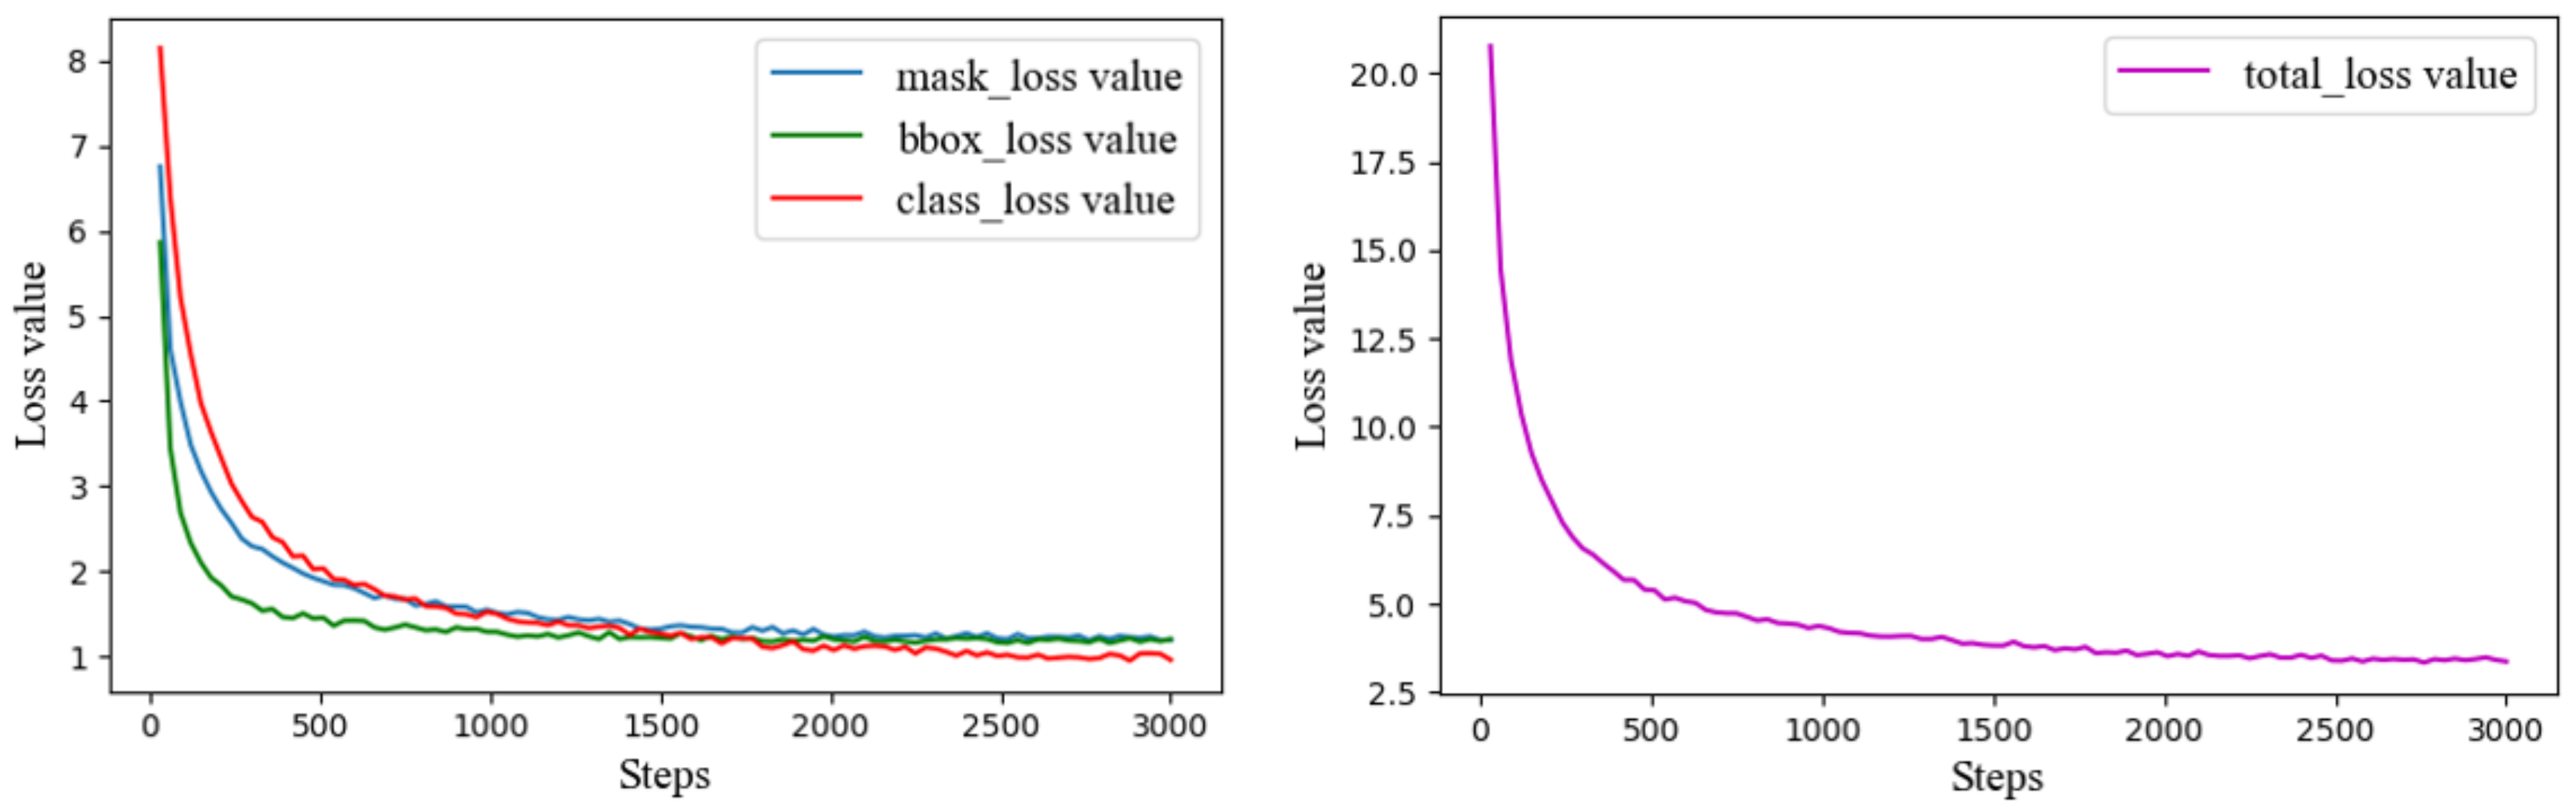
The hyperparameters used to train this model were: the epoch was 100 and each epoch had 30 steps for a total of 3000 steps; the RPN anchor scales were used (8 × 6, 16 × 6, 32 × 6, 64 × 6, 128 × 6); the learning rate was 0.02; and the batch size was 8. After every 50 steps, the loss value was recorded once. For the two data sets, five-Fold Cross-Validation was used to train the Mask R-CNN model using a NVIDIA GeForce GTX 1070 and NVIDIA UNIX x86_64 Kernel Module 418 (NVIDIA Corporation, Santa Clara, CA, USA) on a Linux system (Ubuntu18.04.3) (Canonical Group Limited, London, U.K.) with an Intel® Core™ i7-8700 CPU @ 3.20 GH (Intel Corporation, Santa Clara, CA, USA).
4. Discussion
4.1. Comparison with Existing Approaches
Vision-based waterlogging depth measurement is still in the exploratory phase. To the best of our knowledge, only Chaudhary et al. and Jiang et al. have reported similar approaches [
16,
29,
33]. These approaches are different to those used in traditional studies, which fetch the graduated scale data from images with a water level line, use water level sensors to monitor waterlogging depth, or use a meteorological hydrological model to simulate runoff process with remote sensing and rainfall data.
Jiang et al. [
16,
29] proposed a measurement approach to extract urban waterlogging depths from video images based on transfer learning and lasso regression. Although the approach could be used to estimate the waterlogging depth, the accuracy of the results was not high because the video images usually shoot from a fixed angle. Moreover, the data sources for this approach were still insufficient, so the application could not cover an entire city. Chaudhary et al. [
33] proposed a method locating selected classes of objects whose sizes were approximately known, and then leveraged this property to estimate the water level. The result was classified into one level, which ranged from 1 to 21.25 cm. So, the prediction result was not an exact value but belonged to a range. The data were obtained from social media, which would considerably affect the real-time prediction.
Currently, water level sensors are used to monitor the depth of the waterlogging in Shenzhen. When the depth of the waterlogging reaches a certain height, video monitoring is automatically turned on, and the monitoring video is transmitted to the server through the 4G network. However, widely installing such professional devices for monitoring waterlogging depth is economically prohibitive. Only 184 waterlogging sensors exist in Shenzhen, which are far from enough to monitor Shenzhen’s 1996.85 km2 area. The proposed approach takes advantage of big data to overcome the disadvantages of these approaches, using more data sources that are acquired easily to produce timely and more accurate results covering a wider area.
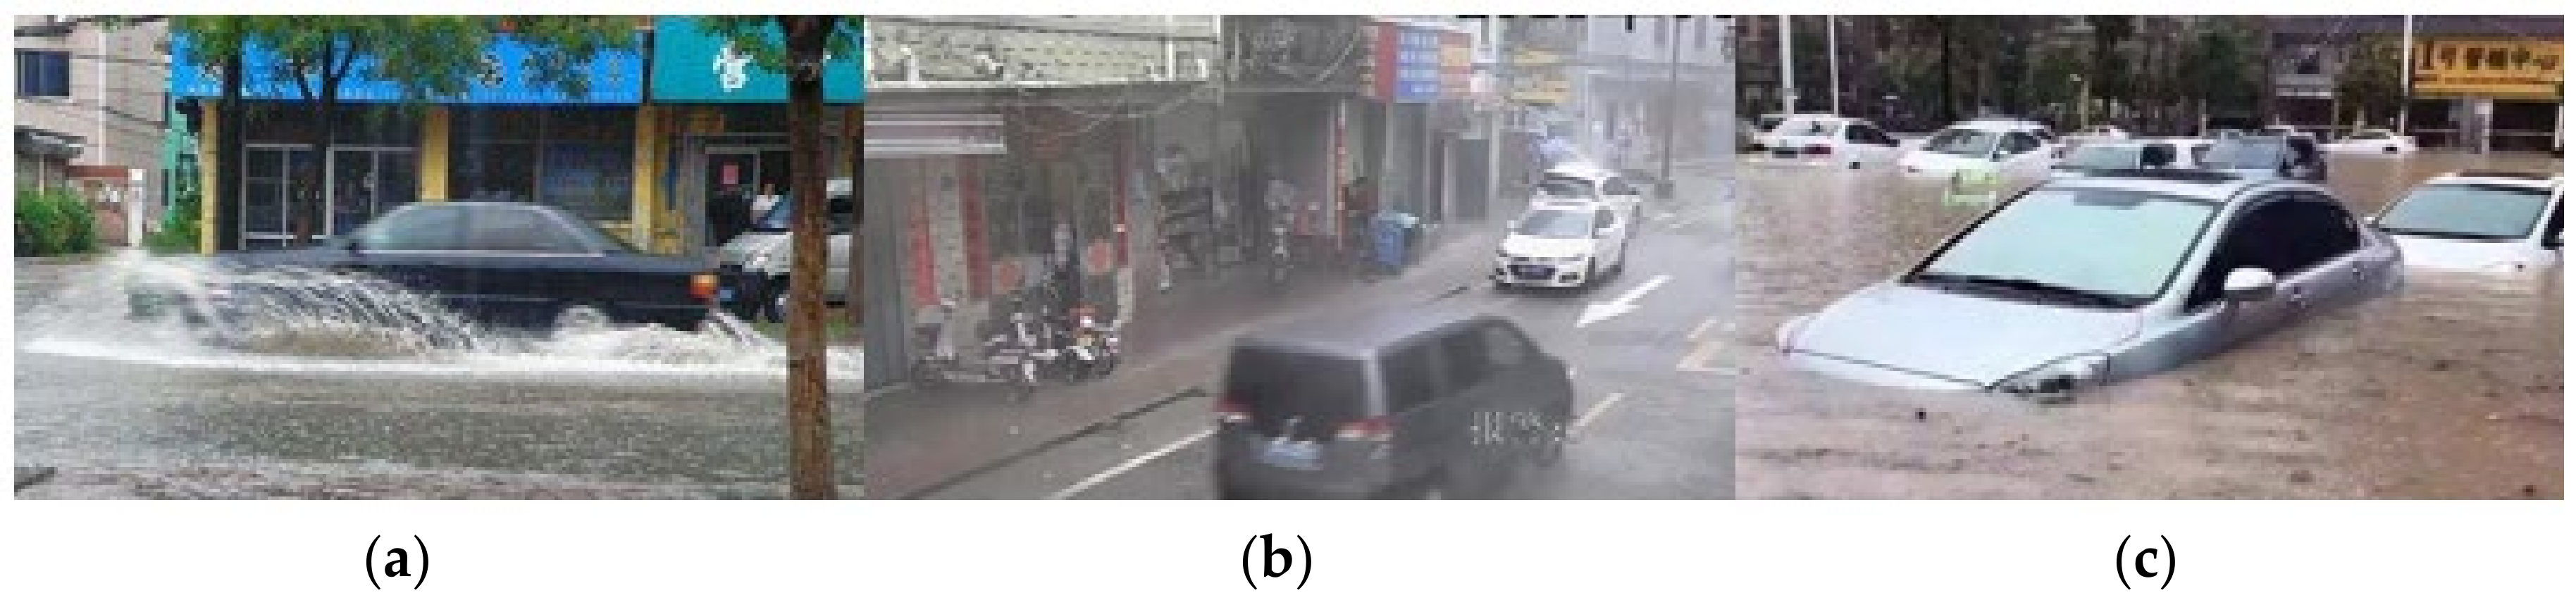
4.2. Uncertainty Associated with Images Quality
The approach developed in this study significantly enhances the opportunity for determining the depth of the waterlogging using existing traffic surveillance video systems and images on social network platforms. However, image quality is an extremely important factor influencing the measurement result of waterlogging depth. Many images inevitably introduce uncertainty in the measurement process, especially in the case of low definition. Firstly, uncertainty may also originate from the visibility of tires in the images. When a vehicle passes through waterlogging at a relatively fast speed, some waves block out part of the tires (
Figure 12a). Some traffic monitoring cameras cannot clearly capture the tires of a high-speed vehicle. Due to the shooting angle, many pictures are oblique rather than obverse (
Figure 12b). In such cases, the borders of the observed upper part of the tires lose detail and become unclear, resulting in some errors in the height extraction. When the depth of the waterlogging is higher than the entire height of tires (
Figure 12c), the tires cannot be extracted, so the depth of the waterlogging cannot be measured. Most tires are over half a meter in height, so if the depth of the waterlogging is over half a meter, then the water depth is no longer suitable for most ordinary vehicles and is dangerous for pedestrians.
For the first cause of uncertainty, future development of advanced high-definition and variable-angle traffic surveillance technology may solve the problem. For the second cause of uncertainty, other taller reference objects, such as traffic buckets, can be used for this approach to measure the depth of the waterlogging. Although these may cause errors in the measurement results, the effect on monitoring and warning would be minimal. A timely early warning has more practical significance for pedestrian and vehicle safety.
4.3. Toward Real-Time Monitoring and Warning
As discussed above, we used two new image data sources for opportunistic waterlogging sensing, social networks and traffic surveillance video systems, which can be used to measure the waterlogging depth. They both have their own advantages and disadvantages. Because the images can be captured and uploaded to the social network platform by every user, the images can be distributed in random positions. Combining the position information in the micro-blog or in the text information, the images can be located over a larger area. This will help to provide safety warning information for more people. Users can take pictures with better conditions, so most of the images uploaded to the social network platform have better clarity, which provide a basis for more accurate measurement of waterlogging depth. However, the sizes of the images collected from the social network platforms vary depending on the different image supervision equipment (e.g., mobile phones, cameras, unmanned aerial vehicles) of users. So, every image must be converted to a standard size to be used in this approach. After the user takes the picture, they may not upload it to the social network platform immediately or they may upload it without position information. This will cause errors in time and space in the measurement results.
Most traffic surveillance equipment is usually deployed at busy intersections or other important positions that may affect social safety. The positions are usually fixed. These images can be used to measure the waterlogging depth only at some fixed positions, and the results of the proposed approach using the video images are worse than the results using images from social network platforms. However, given the importance of the positions and real time videos, measurement results have significance for safety warning. Due to the uniform standard of the images from traffic surveillance video systems, they can be directly used in this approach. However, the traffic surveillance equipment has a fixed height and shooting angle, so it may not catch a better image with tires or the tires on different vehicles may overlap. This would considerably impact the measurement results. The combination of these two data sources can take full advantage of both and compensate for each other’s disadvantages.
Compared with water level sensors in Shenzhen, although the measurement results in this study are not perfect for various reasons, the proposed approach provides relatively accurate, wider, and timely monitoring and warning information in an affordable way. Notably, due to the developed social networks and excellent traffic surveillance video systems, this approach can be used for real-time monitoring and warning in most cities.
Artificial intelligence (AI) techniques (e.g., deep learning, reinforcement learning, which will improve the performance of image processing in terms of efficiency and accuracy) could also be used for waterlogging depth measurement. Although deep learning has shown potential in measuring waterlogging depth from images, the potential of its vision-based waterlogging depth measurement has not been explored. It is an interesting topic to establish non-linear mapping between image and waterlogging depth by using advanced deep learning technology.
5. Conclusions
Urban waterlogging is difficult to monitor due to various complexities in data collection and wide and accurate processing. Opportunistic sensing means that social network platforms and traffic surveillance video systems can be used as new data sources for opportunistic waterlogging sensing. In this study, a novel approach was constructed to measure waterlogging depth based on these new data sources. The approach adopts the Mask R-CNN model, a state-of-the-art image segmentation model, to detect the tires from images, then calculates waterlogging depth using the height differences method and Pythagorean theorem method. Finally, the effectiveness, robustness, and flexibility of this method were studied using many experiments. The results showed that the Pythagorean theorem method can take advantage of fewer parameters and the circular shape of the tires, and performs better on images from social network platforms. The height differences method has no strict requirement for shooting angle of images, so it is suitable for images from both social network platforms and traffic surveillance video systems. The proposed approach provides both measurement accuracy and reliability. Compared with the existing approaches, the proposed approach not only achieves the optimal solution for accuracy and cost, but also has satisfactory practicability and a wider application scope. Even though the method is not perfect, compared with the existing approaches, it can provide relatively accurate and wide motoring and warning information. This proposed approach can be further applied to forecast urban flooding and emergency decision making in most cities.
Overall, an affordable, accurate, and widely available approach to vision-based waterlogging depth measurement was proposed that significantly enhances the possibility of using existing images from social network platforms and traffic surveillance video systems for opportunistic waterlogging sensing. In future works, other types of data will be collected to improve the accuracy of this approach. For instance, the text information from social network platforms can be used to extract information related to waterlogging using other artificial intelligence techniques, such as Natural Language Processing (NLP). With this approach, an online flood risk map that marks waterlogging position, scope, and depth can be developed to guide pedestrians away from waterlogging and towards a safe place.


