Article

Managing the Risk of Food Waste in Foodservice Establishments

by
Beata Bilska
*,
Marzena Tomaszewska
and
Danuta Kołożyn-Krajewska
Institute of Human Nutrition Sciences, Department of Food Gastronomy and Food Hygiene, Warsaw University of Life Sciences–SGGW, Nowoursynowska 159C St., 02-776 Warsaw, Poland
*
Author to whom correspondence should be addressed.
Sustainability 2020, 12(5), 2050; https://doi.org/10.3390/su12052050
Submission received: 23 February 2020 / Revised: 4 March 2020 / Accepted: 5 March 2020 / Published: 6 March 2020

Abstract

:
Although it is difficult to clearly identify the extent to which the foodservice industry contributes to food waste, its share is undoubtedly significant. As the hospitality and foodservice industry develops, more and more food waste is produced. The reduction of food waste is a key challenge for the sustainable development of the foodservice industry as it has negative economic and environmental impacts and is ethically reprehensible. The objectives of the study were to develop a risk management model of food waste based on the ISO 31000 standard for foodservice establishments, to learn the causes of food waste, and, on this basis, to estimate the risk of food waste in foodservice establishments. The survey was conducted in 130 foodservice establishments located in Poland using a specially designed questionnaire. The risk of food waste was identified in the studied foodservice establishments, manifested by throwing away of semi-finished products, hot and cold served dishes, bread, vegetables and fruit, expired products, products with signs of spoilage, and products with no visible signs of spoilage. Two risk levels were identified: medium risk for fruits and vegetables, and bread, and high (not acceptable) for the other six foodstuffs. Two risk treatment options were identified: prevention and tolerance.

1. Introduction

According to the definition proposed by the United Nations Food and Agriculture Organization (FAO), “food loss” is the reduction in the total weight of food intended for human consumption. It includes the amount of food that was originally produced for consumption but eventually was naturally lost due to a reduction in weight (e.g., dried), became spoiled, or was used for other purposes (e.g., for biofuel, compost, feed, etc.). Food loss does not include non-edible parts (e.g., bones, peelings, etc.) and raw materials and products originally produced for non-consumption purposes (e.g., feed, bio-components, bioenergy, etc.). Another concept in addition to food loss is food waste, which is defined as the loss of food managed at the level of the foodservice industry and households [1].
The FAO estimated food loss and food waste at one-third of the total food produced, i.e., 1.3 billion tonnes [1]. The European Commission estimates that between one-third and one-half of all food produced in the world is lost or wasted (i.e., up to 2 billion tonnes of food). Eurostat estimates, based on data provided by the EU-27, that in 2006 approximately 89 million tonnes of food waste were generated, of which 42% came from households, 39% from production facilities, and the remaining 19% from other sources including distribution, shops, and the foodservice industry [2].
The foodservice industry has been identified by Beretta et al. [3] as the third-largest source of food waste. The estimates carried out as a part of the FUSIONS project [4] prove that the foodservice produces about 12% of total food waste (53% households, 19% food industry). It has been estimated that Italian restaurants are the source of about 21% of total food waste [5]. According to [6], in Western Australia, hotels generate 4377 tonnes of food waste per day.
Bohdanowicz [7] estimated that about 1 kg of waste is produced daily by each consumer using food services. According to Goh and Jie [8], although it is difficult to clearly identify the extent to which the foodservice industry contributes to food waste, its significant share is undeniable.
In Poland,“other sectors” in the structure of food loss and food waste accounted for only 4% according to EUROSTAT estimates from 2006 (processing held the first place with 73.2%, followed by households with 22.8%) [2]. It should be emphasized, however, that in Poland, dynamic growth of the foodservice industry has been observed in recent years. The value of sales revenues generated by restaurants is systematically increasing, which is influenced by the level of services provided, which translates into a higher frequency of use of food service. The development of foodservice is influenced by many factors, such as the general economic situation in the country, which results in positive consumer sentiment, increased professional activity of Poles, changes in time management, domestic and foreign tourist traffic [9,10].
As the hospitality and foodservice industry develops, more and more waste, including food waste, is produced [11]. Food waste in foodservice establishments is generated during storage and processing in the cooking facilities, in the dispatch section (buffet), and in the consumer room in the form of so-called leftovers.
The foodservice sector is subject to increasing controls related to food management and, in particular, food waste, due to the disposal of large quantities of food during preparation and storage, and the impossibility to reuse prepared but unsold food [12,13,14].
According to Martin-Rios et al. [15], the reduction of food waste is a key challenge for the sustainable development of the foodservice industry as it has negative economic and environmental impacts and is ethically reprehensible.
According to Tonini et al. [16], food preparation in households and in the foodservice industry has a significant impact on the environment, including global warming. Kummu et al. [17] concluded that food waste corresponds to about 23%–24% of the total use of arable land, freshwater resources, and fertilizers used for food production.
As Beretta et al. [18] pointed out, the environmental significance of food loss depends not only on the quantity but also on the type of food, the place in the food chain where it is lost, and the way it is recycled or disposed of. Therefore, food loss should not only be measured but also evaluated by life cycle assessment. It is estimated that the products with the highest consumption of natural resources and potentially the highest possible negative impact on the environment are beef and dairy products [19]. Products of animal origin have a particularly high demand for water per unit of nutritional energy compared to food of plant origin. For example, the total water footprint (WF) of pork (expressed in liters per kcal) is twice as high as the WF of pulses and four times as high as WF of grains [20].
In conclusion, food waste in the foodservice industry is significant in terms of its scale, its financial losses [21], and its negative impact on the global ecosystem alike [22]. Undoubtedly, a reduction of this phenomenon is necessary, but also extremely difficult.
Currently, according to Filimonau and Coteau [23], there are few academic studies available on food waste in the hospitality sector. Therefore, there is a need to conduct research in this sector to learn about the causes of food waste, to identify barriers to the effective reduction of this problem, and to take actions to eliminate these barriers.
The objectives of the study were (1) to develop a risk management model of food waste based on the ISO 31000 [24] standard for foodservice establishments in foodservice establishments, (2) to learn the causes of food waste, and (3) to estimate the risk of food waste in foodservice establishments.

2. Materials and Methods

2.1. Data Collection

The study was carried out in 2019. In the selection of samples for the study, the non-random sampling technique, i.e., targeted selection, was used. The study included establishments located in 11 provinces of Poland. The selected 130 foodservice enterprises are not a representative ’sample’ for Poland, and all establishments types were represented. A pilot study was conducted on five foodservice establishments in Warsaw. The establishments that underwent the pilot test were not the sources of the data collected for this study.
A revised version of the questionnaire consisted of three sections: characteristics of the foodservice establishments, procurement, storage, and preparation procedures, in the context of food waste. One hundred and thirty completed questionnaires were collected. The surveys were delivered to foodservice establishments by the authors of the study personally. If an establishment owner, manager, or another person agreed to participate in the study, instructions were given on how to complete the survey, and the questionnaire was then left in the establishment. One week after the survey was left in the establishment, it was collected by the person who delivered it. All subjects were guaranteed anonymity in their participation in the study. The survey also included closed-ended questions with suggested multiple-choice answers. The characteristics of the establishments are presented in Table 1.

2.2. Data Analysis

In the discussion of the results, elements of descriptive statistics, such as mean, median, mode, kurtosis, and standard deviation (SD), were used. The percentage share of the correct answers was calculated. All tests were performed using Statistica 12.1. PL (StatSoft, Cracow, Poland).

2.3. The Risk Management Model

The developed risk management model of food waste is based on the ISO 31000 [24] standard for foodservice establishments. The specific stages of the risk management process and the methods used are shown below:

2.3.1. Risk Identification

The starting point was a detailed analysis of the available publications and the data collected by the foodservice establishments that were investigated.

2.3.2. Risk Analysis

Subsequently, the identified risks of food waste were analyzed to understand them in detail. For this purpose, Ishikawa’s diagram was used to present the causes of food waste. To determine the incidence of the causes of food waste, four questions included in the questionnaire were used. A grading scale was used for assessment: always, usually, sometimes, occasionally, never. In case of a question concerning the frequency of performance of individual activities in the storerooms, a 5-point scale was used (more than twice a day, 1-2 times a day, 2-3 times a week, 1-2 times a month, never).
In monitoring the risk, a matrix of the probability of food waste (Table 2) and its consequences (Table 3) was developed. The starting point for the development of the probability and consequence matrix was a detailed analysis of the available literature [24,25,26]. To calculate the probability of food waste risk, one of the questions in the survey was used, in which a 5-point scale was applied. A specific number of points was awarded for the different answers: 5—every day, 4—almost daily, 3—sometimes, 2—occasionally, and 1—never. A five-point scale was adopted for the risk occurrence probability.
A five-point scale was adopted for the assessment of consequences (Table 3). The consequences taken into account are related to the type of product waste, the financial losses, and the impact on the environment. The following factors were taken into account when estimating the environmental impact: CO2 emissions [27] and water footprint [20,28,29].
The financial losses result from: purchase of ingredients and their storage, processing of purchased ingredients into semi-finished products, production of food that was not sold with the expected profit. From an economic point of view, the most significant are the financial losses resulting from the production of semi-finished products and finished meals, because, in addition to the purchase of raw materials, the company incurred the cost of the utilities (electricity and water) and the wages of its employees.
Determination of the probability of occurrence of an unfavorable event provides baseline information to determine the level of risk, which depends on the probability and the consequences, and these parameters depend on the accuracy of the information input. The values for the probability (P) and the consequences (C) were transferred to the consequence/probability matrix (R) (Table 4). The values for R were calculated with the formula P × C.

2.2.3. Risk Evaluation

To evaluate the risk, which has a significant impact on the decision-making process, the risk matrix was used to determine whether the expected risk is within the acceptable limits or whether it is outside these limits. The risk matrix defined the risk depending on the obtained value of PC. The risk levels were divided into: “very low”, “low”, “medium”, “high”, and “very high.” For each of these risk levels, adequate decisions were indicated. If the risk is not acceptable, further treatment is required (Table 5).

2.2.4. Risk Treatment

The results of the risk analysis formed the basis for the decision on what the identified risks are and to what extent they require that the organization implement proper risk treatment algorithms and prioritize their application. For this purpose, a risk treatment matrix was developed based on [24,25,26]. According to ISO 31000:2018 Risk management – Guidelines [24], options for treating risk may involve, e.g., avoiding the risk, eliminating the source of the risk, changing the consequences, and preventing the risk by informed decision. The following risk treatment options were adopted: tolerance, prevention, and avoidance (Table 5).

3. Results

3.1. Risk Identification

The risk of food waste identified in the studied foodservice establishments was manifested by throwing away semi-finished products, hot and cold served dishes, bread, vegetables and fruits, expired products, products with signs of spoilage, and products with no visible signs of spoilage.

3.2. Risk Analysis

3.2.1. Causes of Food Waste

Nearly half of the establishments surveyed wasted food occasionally due to overlooked expiry dates and excessive purchases (Figure 1). On the other hand, one-third of the respondents declared that they occasionally threw away food due to ill-considered purchases and inappropriate storage conditions. Preparation of too much food was one of the most common reasons for wasting food, as almost half of the studied establishments threw food away for this reason “usually” or “sometimes.” Nearly three-quarters of the respondents declared that they did not throw away their food due to a lack of ideas on how to use the products for other dishes. In half of the studied establishments, food was sometimes or occasionally thrown away due to inadequate staff qualifications, and in more than one-third, due to the purchase of poor-quality products.
Results of descriptive statistics concerning causes of discarding food in catering establishments are shown in Table 6.
The next stage consisted of checking how the respondents prepared for shopping and how they acted during shopping (Table 7). A vast majority of the respondents checked the amount of food they had in store and prepared a list of the products they needed before shopping. More than half of the respondents occasionally or sometimes bought food products that they had not planned to buy and made purchases to stock up on food. Almost half of the respondents “never” bought products with a short expiry date, and almost the same number of respondents did so “occasionally” or “sometimes.”
An important issue is an assessment of the quality of food products received at the establishment. More than two-thirds of the respondents “always” checked the expiry dates and the condition of the packaging and assessed the appearance and smell of unpackaged products (Table 8. Rarely performed activities include checking the hygiene of the supplier and checking the cleanliness of the means of transport; only one-third of the respondents “always” performed these activities. Only half of the respondents “always” checked the temperature of the means of transport and/or the refrigeration products, and almost one fifth “never” did so.
The products must be stored in suitable conditions, which should be monitored regularly. The results indicate that in most of the examined establishment, temperature control in cold storage rooms and freezer storage rooms and quality control of unpackaged products is carried out at least once a day (Table 9).
The causes of food waste were assigned to four categories and are shown in the Ishikawa diagram (Figure 2).
  • Checking: the temperature of the means of transport and/or refrigeration products 3.6 *; the hygiene of the supplier 3.2 *; the cleanliness of the means of transport 3.1 *; the expiry date 4.5 *; the packaging condition 4.5 * and evaluating the appearance and smell of unpackaged products 4.4 *
  • Buying food products that have not been planned 2.4 *
  • Preparing a list of products needed 2.7 *
  • Checking the stock of food products before shopping 4.8 *
  • Checking: the temperature in cold storage compartments/cabinets 3.8 *; the temperature in refrigerated compartments/cabinets 3.8 *; the surface cleanliness of cold storage cabinets, storage racks 3.8 *; the expiry dates 3.7 *; the packaging condition 3.6 *; the appearance and smell of unpackaged products 3.8 *
  • Buying food products with a very short expiry date 1.7 *.

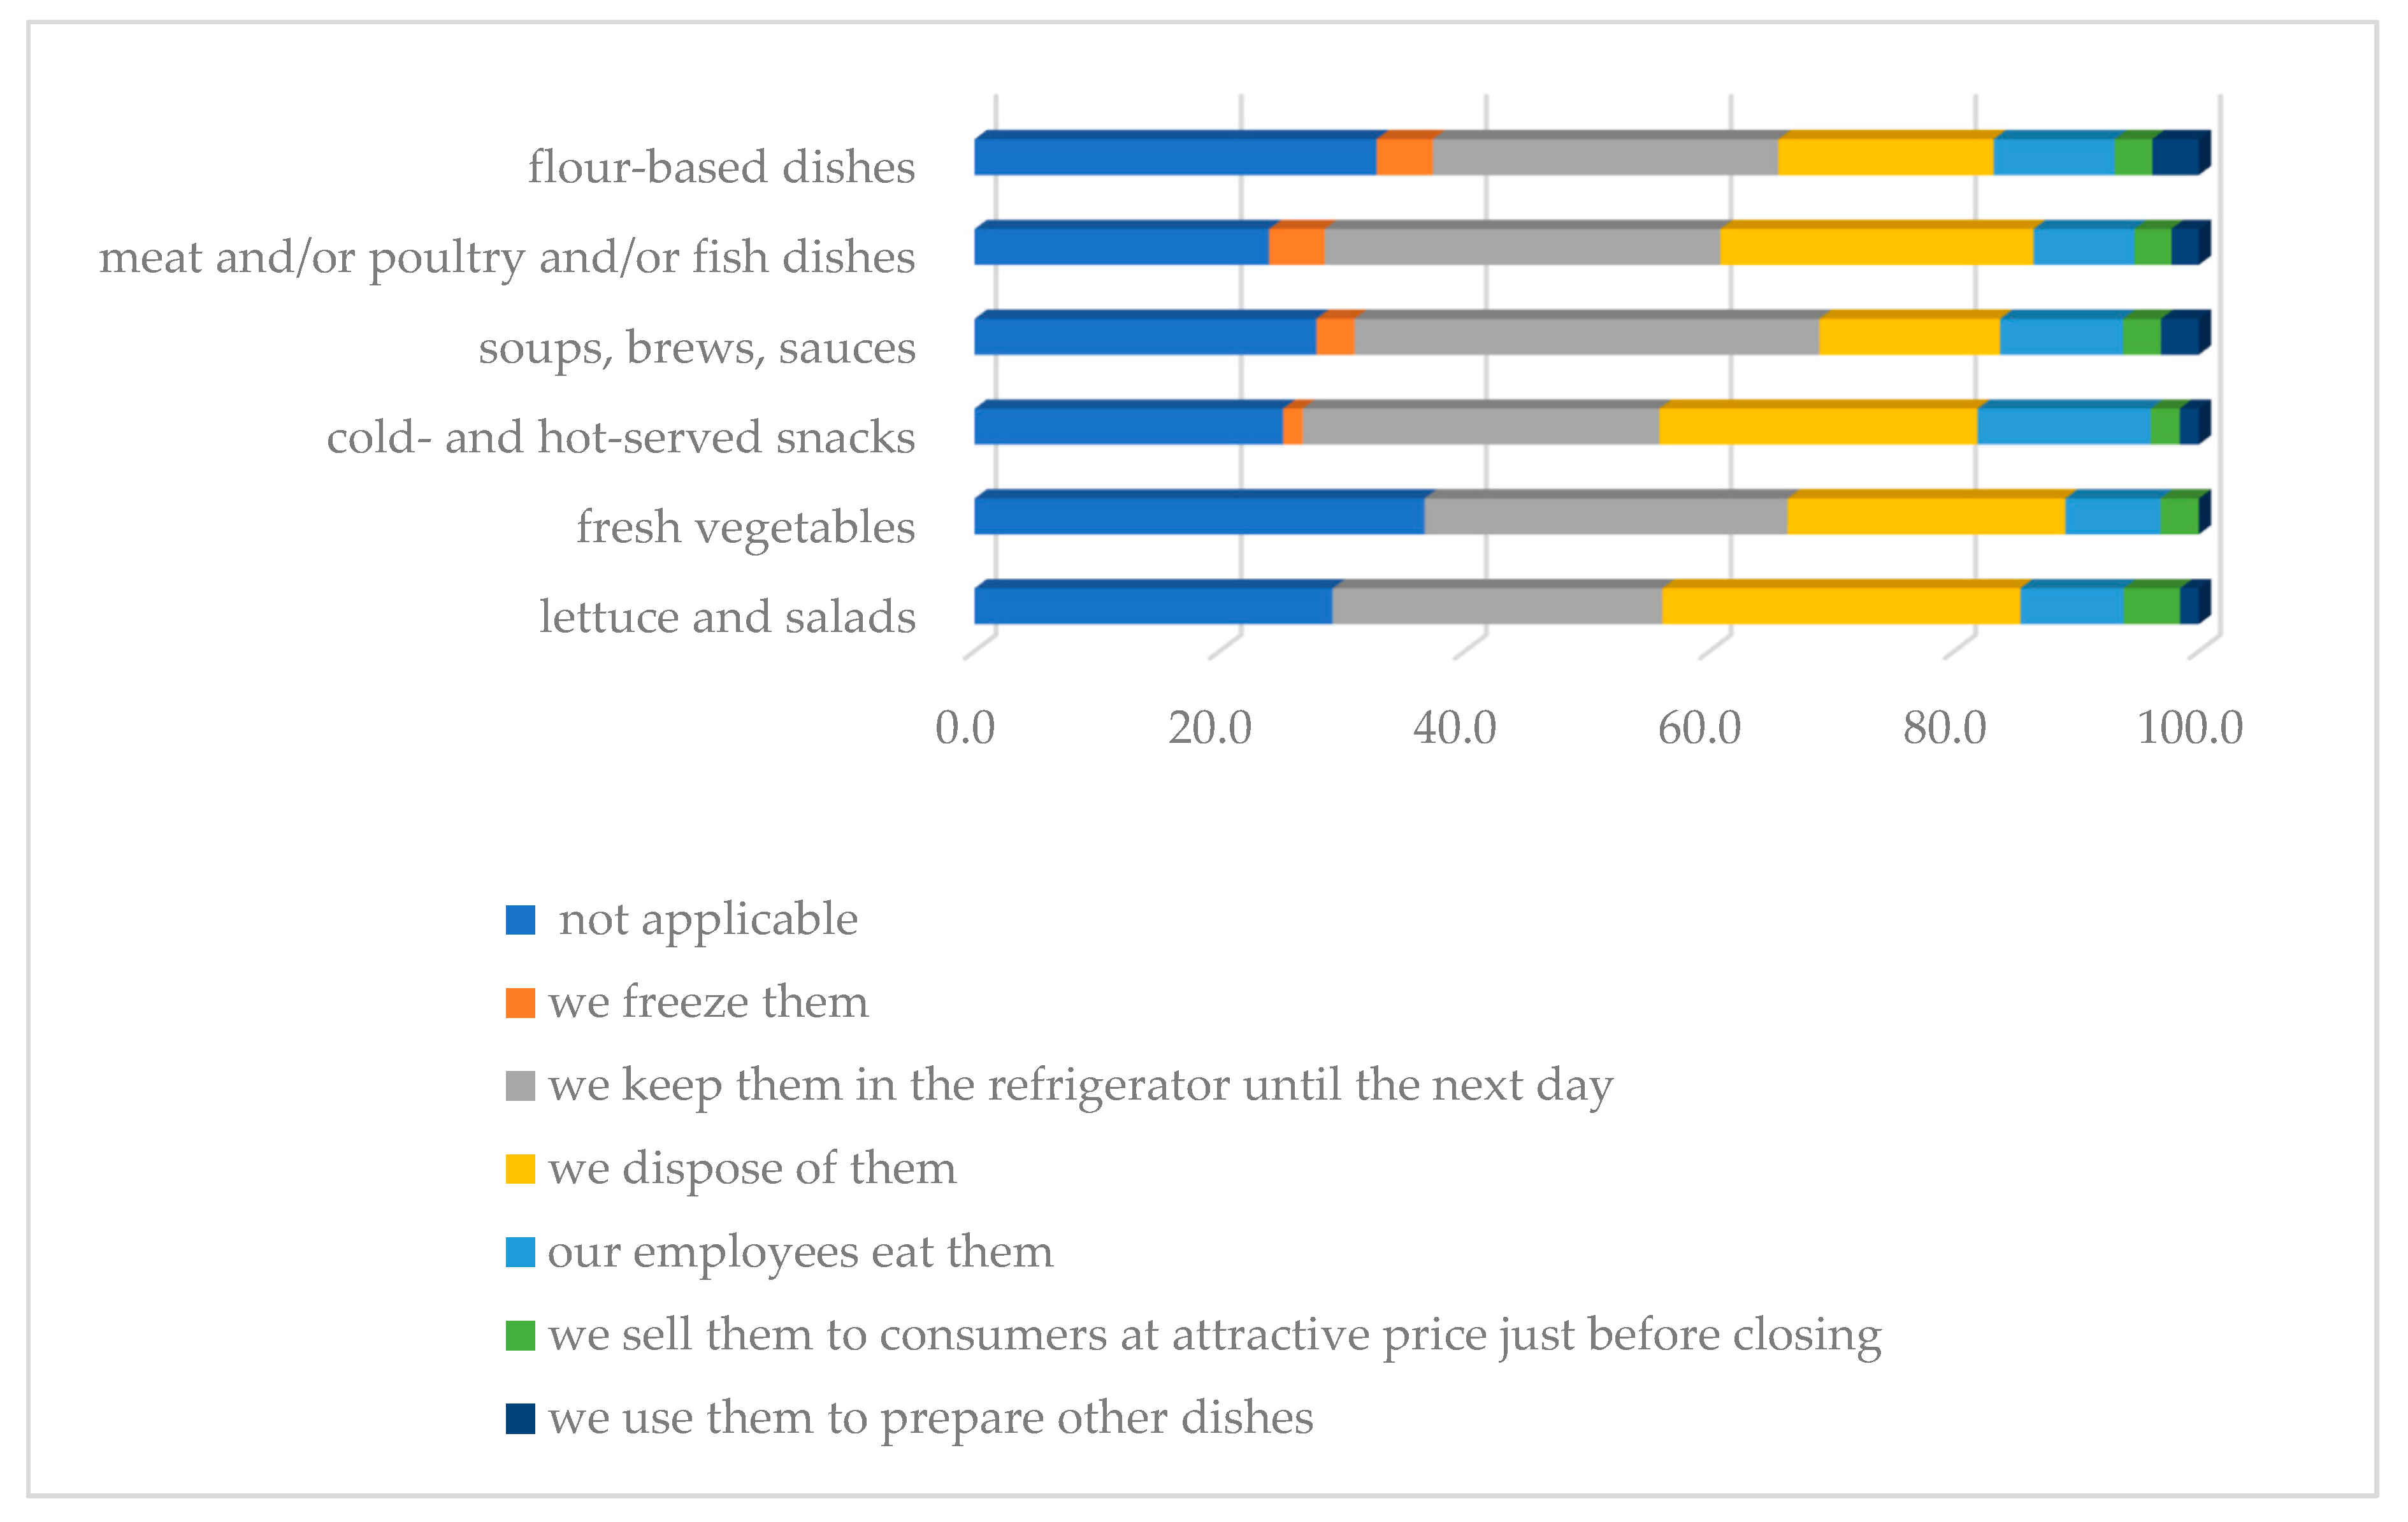
3.2.2. Methods of Management of Unsold Food and Food Waste in the Studied Foodservice Establishments

The most popular way to manage unsold meals in the studied foodservice establishments was to store them in refrigerated conditions until the next day (Figure 3). The next item was disposal into a waste bin. Only one in ten establishments allows employees to eat such food, and only 3% of the studied foodservice establishments sell them to consumers at reduced prices.
In almost half of the studied establishments, it was found that food waste management methods were inappropriate (Table 10). Over 40% of the studied establishments disposed of plant and animal waste and expired food into a public waste container. Half of the studied establishments handled the used cooking/frying oil properly.

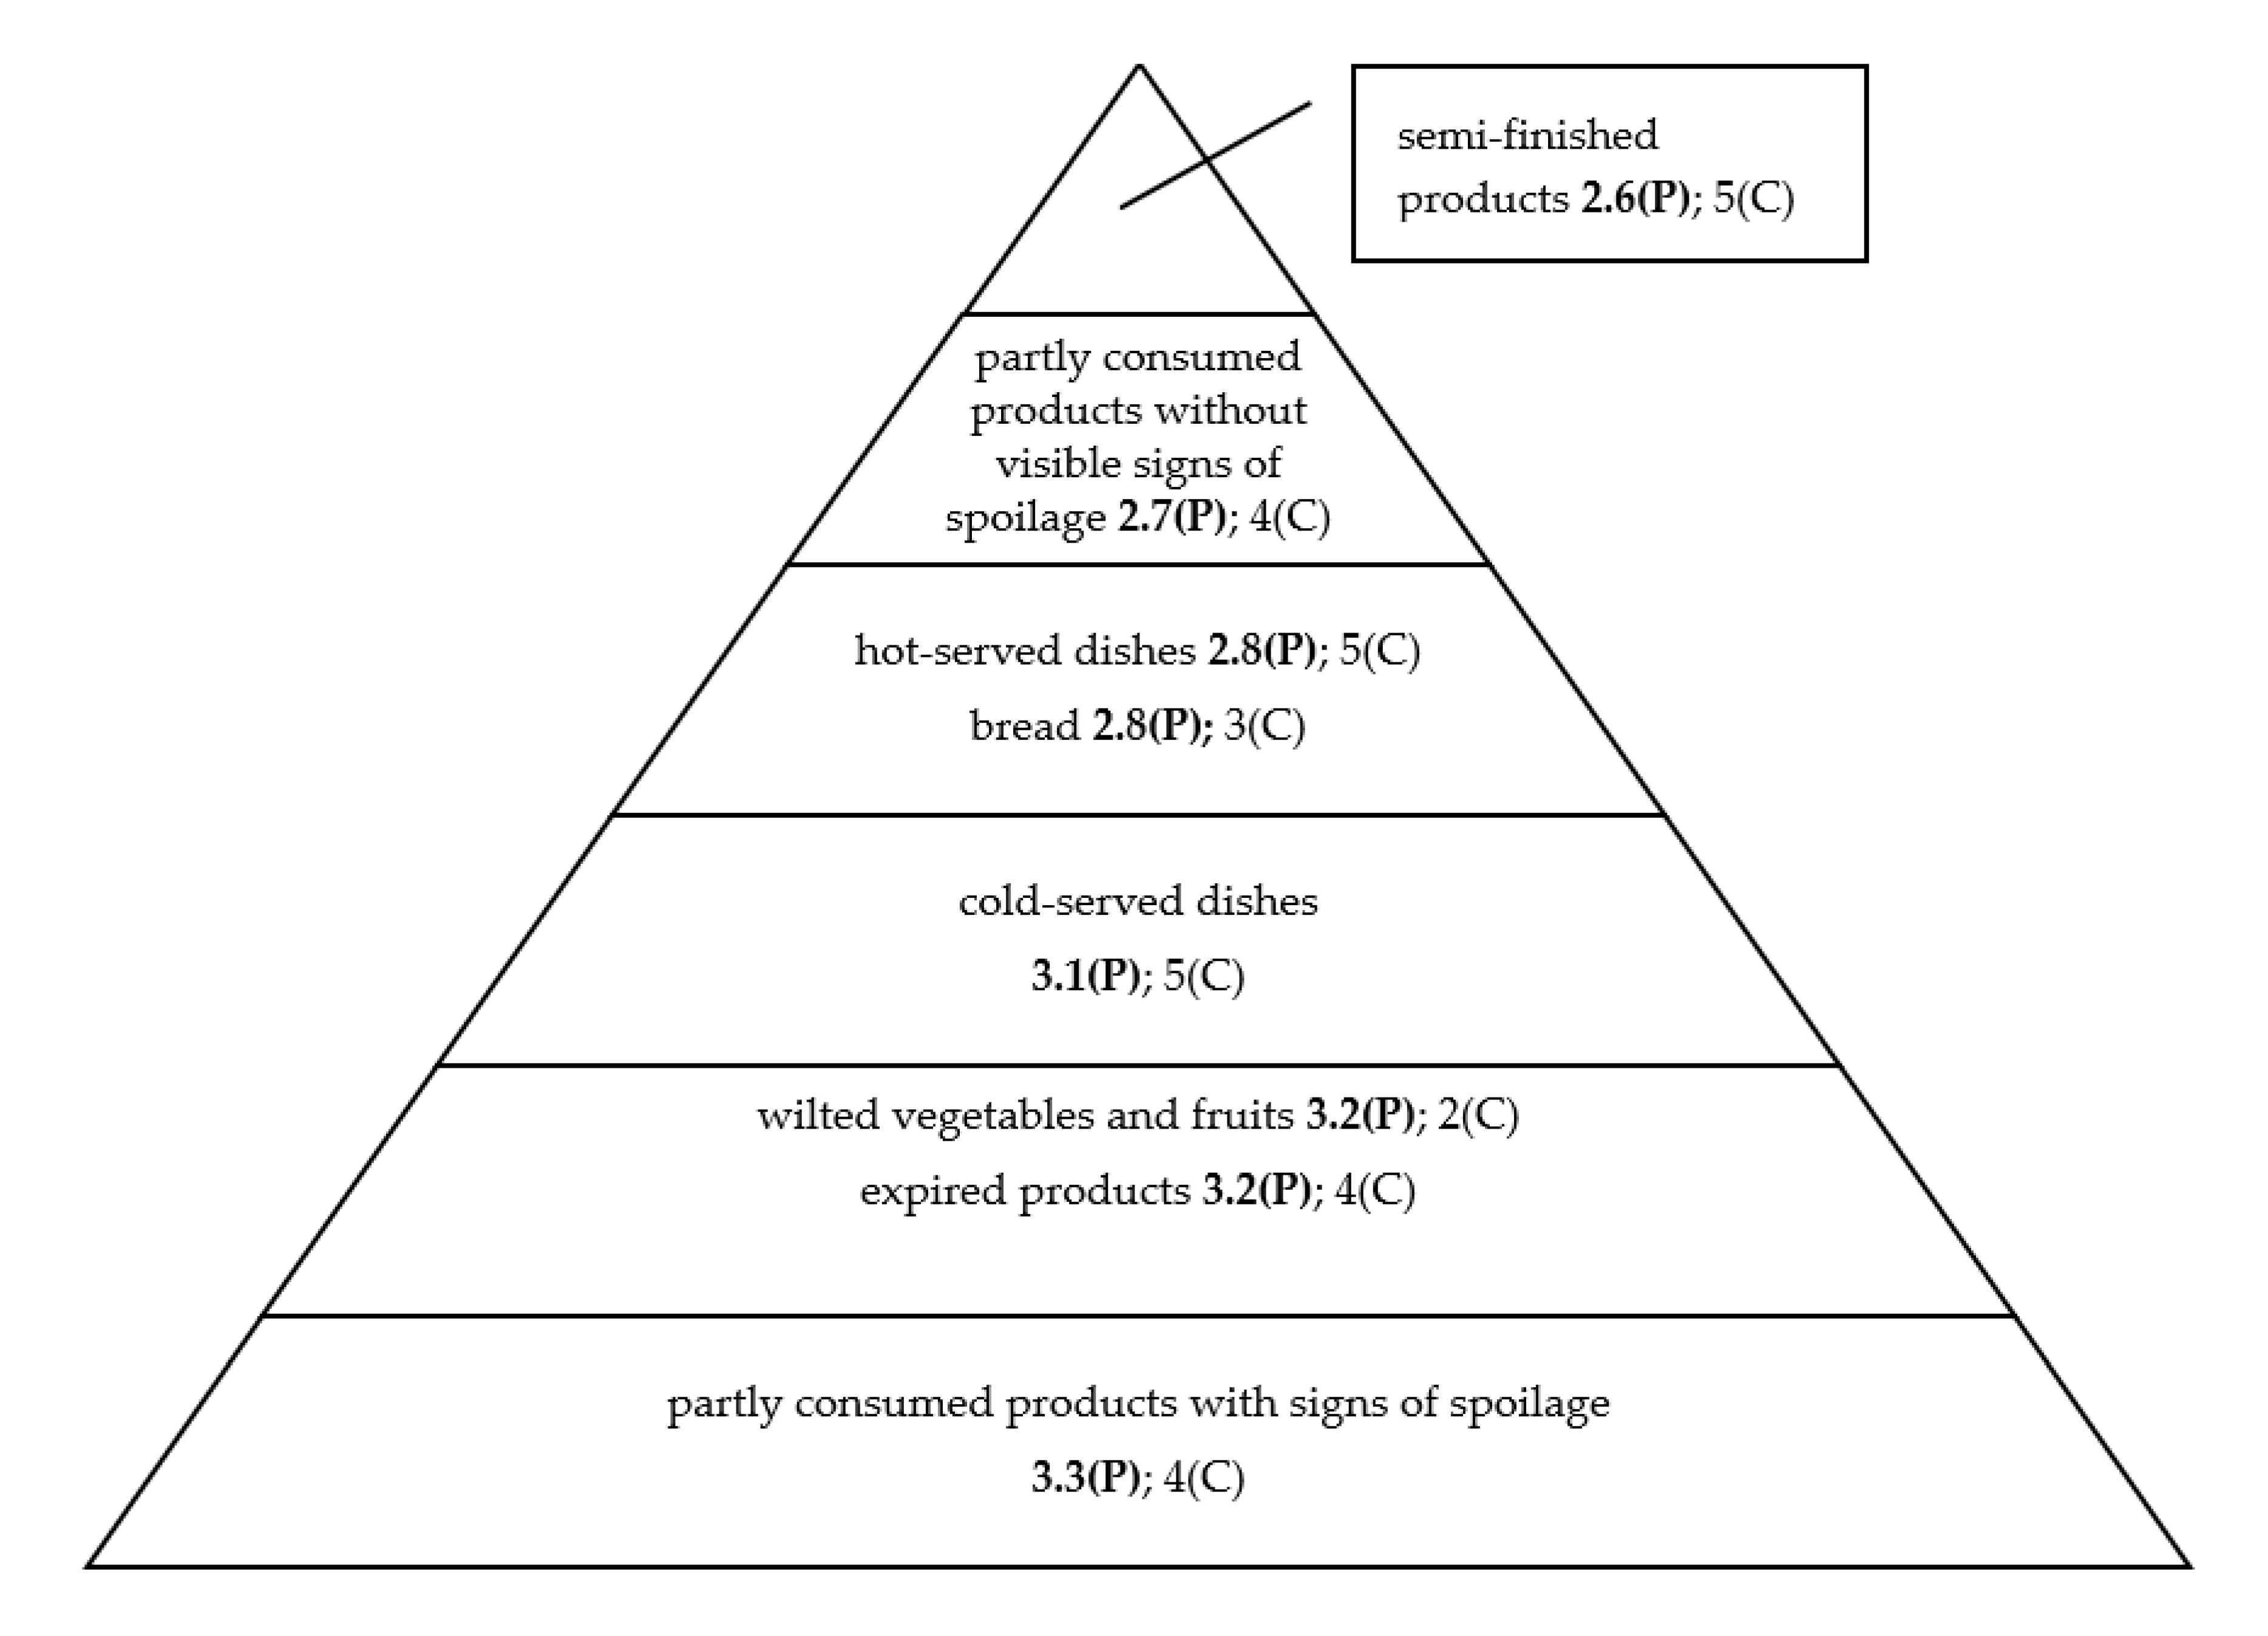
3.2.3. Risk Level Estimation

Food disposed of most often (daily and almost daily) by more than one-third of the respondents was products with signs of spoilage, expired products, and wilted vegetables and fruits (Table 11). Every day, in one-quarter of the studied establishments, hot dishes and in one in five plants, cold-served dishes and bread were disposed of. Disposal of semi-finished products was declared the least frequently.
Results of descriptive statistics concerning the frequency of discarding food in catering establishments are shown in Table 12.
Based on the frequency of disposal of food products in foodservice establishments on a 5-point scale (where: 5—every day, 4—almost daily, 3—sometimes, 2—occasionally, and 1—never) and the percentage of answers, the probability was calculated (see Table 2). In the next stage, a specific number of points (see Table 3) was awarded for the different food products: 2—wilted vegetables and fruits; 3—bread; 4—expired products, partly consumed products with signs of spoilage, partly consumed products without visible signs of spoilage; 5—semi-finished products, hot-served dishes, cold-served dishes. The values for the probability (P) of the disposal of food in foodservice establishments and the values for the consequences (C) shown in Figure 4.
The values for the probability and the consequences (R) were transferred— for each of the eight food products—to the consequence /probability matrix (see Table 4). The obtained values ranged from 6.4 (fruits and vegetables) to 15.5 (cold-served dishes).

3.3. Risk Evaluation and Risk Treatment

In the next stage, the obtained values were compared to the risk matrix and the risk treatment (Table 5), and two risk levels were identified: medium for fruits and vegetables, and for bread (acceptable, requiring management decisions), and high (not acceptable) for the six food products. Two risk treatment options were identified: prevention and tolerance.

4. Discussion

According to Parfitt et al. [30], the focus should be on avoidable hospitality food waste as food becomes waste due to improper transport, storage, or preparation techniques [31]. According to the WRAP Report [21], avoidable food waste at the preparation stage is 45%, at the consumption (so-called plate waste) stage is 34%, and due to spoilage, including expired food, is 21%. Estimates of the Sustainable Restaurant Association (SRA) [32] indicate that at the stage of food preparation, avoidable food waste is 65%, and waste due to spoilage is 5%. As our research indicates, almost half of the studied establishments wasted food occasionally due to overlooking the expiration date, and the most frequently disposed of foods were partly consumed products with signs of spoilage, wilted vegetables and fruits, expired products, and cold-served dishes. It should be noted that one of the reasons for food waste may be too much stock due to unplanned purchases, which is declared by more than half of the respondents with different frequencies. It can be stated that persons responsible for catering supplies are susceptible to promotional campaigns, just like consumers.
According to Papargyropoulou et al. [33], in hotel foodservice, the main fraction of wasted food that can be avoided are fruits and vegetables, followed by cereal products, fish and seafood, and meat. Identification of the groups of food that are most often disposed of is important to reduce this undesirable practice. This is because it makes it possible to indicate which operating processes should be modified to minimize the amount of food disposed of at a given establishment [23]. For example, to reduce the risk of disposal of wilted fruits and vegetables, thought should be given to the way in which they are stored and/or to better organization of production (order planning, menus). Pirani and Arafat [34] wrote about the appropriate way of storing fruits and vegetables as a strategy to minimize food waste. They pointed out that in many hotels operating in the United Arab Emirates, fruits and vegetables are stored in wire boxes to ensure air circulation and thus reduce microbial growth and spoilage processes.
The most common reason for wasting food in the studied Polish foodservice establishments was the preparation of too much food. In their research, similar conclusions were reached by Silvennoinen et al. [35], who stated that most of the food wasted in Finnish foodservice establishments was generated by preparing too many meals that could not later be stored or served as another dish. A problem with estimating the necessary number of servings exists, especially in the case of self-service establishments [33,34]. Goh and Jie [8] also pointed out that it is necessary to implement measurements that will make it possible to prepare the right number of meals based on accurate forecasting.
According to Filimonau and de Coteau [23], reducing food waste in foodservice should focus on three main stages: pre-kitchen, kitchen, and post-kitchen. At the pre-kitchen stage, it is necessary to forecast the demand and to order the ingredients and the products necessary for food preparation optimally according to the needs.
Despite the fact that a vast majority of the Polish respondents declared that they checked the condition of their stocks of food products and prepared lists of the products needed before shopping, more than half of them admitted that sometimes their shopping was ill-considered and excessive. However, it should be emphasized that in the studied establishments, expiry dates were checked with high frequency. Betz et al. [12] emphasized that optimization of stock management, minimization of stock, and training of employees are an important part of food waste reduction. According to Dergui [36], at the storage phase, the critical areas include proper stock management through the use of a FIFO (First-In, First-Out) system and checking the expiration dates.
As Pirani and Arafat [34] pointed out, many hotels providing food services have procedures in place to minimize food waste associated with spoilage/expiry of food products, e.g., the FIFO principle, and planning of dishes to be prepared with products with short best before dates. Sometimes it may be suboptimal to use a FIFO policy and might be preferable to issue items in a FEFO (First Expiration, First Out) manner to minimize wastage [37]. According to Jedermann et al. [38], the FEFO method was first introduced at the end of the 1980s. The basic idea is to use stock rotation in such a way that use products with the shortest expiry date as a priority [38]. This method is particularly important in catering, where many raw materials are used, and there are many different food suppliers.
It can be assumed that the implemented food safety management systems in almost all examined foodservice establishments reduce the risk of food waste by minimizing the probability of obtaining an unsafe product.
Another important aspect is the handling of unsold food in foodservice establishments. Based on the model that was developed, we found a high and therefore, unacceptable level of risk for the following food products: semi-finished products, hot- and cold-served dishes, expired products, partly consumed products with signs of spoilage, and partly consumed products with no visible signs of spoilage. One of the necessary measures to be taken is “prevention.” The Food Waste Hierarchy, which supports food waste management in this sector [39], also recommends “prevention.” In every company, people are the key factor responsible for errors. The level of knowledge and qualifications of employees should be appropriate to the type of work they do. Lack of experience and appropriate qualifications may result in errors leading to food losses. That is why it is so important to improve employee skills through mandatory training, which should be carried out periodically to update and consolidate their knowledge [40]. In addition, Lipińska et al. [41] noted that employee training, together with investments in logistics, can favorably reduce the scale of food losses and food waste at the transport stage.
Although we found in our research that throwing food away due to inadequate qualifications of workers was rare, the education of staff can certainly bring measurable benefits.
It seems that it is also important to strengthen the employees’ responsibility for food management at all stages of the production process. One can assume that if a dedicated person had a given responsibility to reduce the amount of food wasted, that this would have a positive effect towards reducing food waste.
Another recommendation related to the food waste hierarchy concerns the use of food for consumption, e.g., by redistributing it to non-profit organizations. Redistributing food for social purposes can be one of the key and desirable ways to reduce food losses. This solution offers many-sided benefits; among them, the most important one is improved access to food for low-income people [42,43]. Many authors emphasize the possibility of giving surplus food from the foodservice industry to people in need [4,39]. Such practice is used by many foodservice companies, e. g., the TFE Hotel Group gives food to the Ozharvest food charity company that helps homeless persons [44]. Circa 100 KFC restaurants in the UK donate meals to charities [45]. However, it should be emphasized that such activities pose numerous challenges due to food safety standards and sanitary laws. Donors may fear the consequences of the beneficiary contesting the quality of the products supplied. One of the possible ways to help and reduce food loss and waste is to support the activities of businesses by developing procedures that allow for rational use of food for socially useful purposes, within the framework of existing legal rules on the preservation of food health safety [46]. As Filimanou and Coteau [23] pointed out, thanks to the growing popularity of food donations from the foodservice industry, it is possible to reduce food waste in this sector, to reduce the operating costs, and to alleviate poverty, but other important points must be borne in mind. Specifically, food banks and non-profit organizations must have the necessary equipment, labor, and time to safely store and redistribute unsold hospitality food [23]. According to Halloran et al. [47], there are several restrictions related to the donation of food for charity purposes, e.g., donated food must remain unopened and must not exceed the last selling day.
Other possible options are to give unsold food to employees or to sell it at a reduced price. Based on our research, we found that these are not common practices among Polish foodservice companies.
Nearly half of the studied foodservice establishments declared that unsold food was disposed of in a container for municipal waste. This way of handling waste makes impossible its composting, for example. Hu et al. [22] pinpointed the importance of recycling and composting to handle food waste whose occurrence was in the hospitality sector. According to the WRAP Report [21], recycling and composting food waste is preferable to landfill disposal. Despite the environmental and economic benefits, composting is not popular in Europe [48]. As Singh et al. [49] pointed out, composting can reform the composition of food waste. When composting is not feasible, on-site anaerobic digestion of food waste can be adopted [23]. As Filimonau and de Coteau [23] noted, a number of programs have been developed across the world to mitigate food waste in the hospitality sector.
In conclusion, it must be stated that the reduction of food waste in the foodservice industry is a major challenge related to, among others, a complicated and long production process and difficulties in estimating the demand. For this reason, further research is needed that focuses on this issue to implement food waste reduction programs.

Limitation

The key limitation is the relatively small sample size. One limitation of this study is that behavior was self-reported by respondents, meaning that it could be biased. In particular, the self-estimated measure of the frequency of food waste used for this study can under-estimate the overall amount of food waste. In the future, other measurement methods should be used, e.g., the diary method, in which respondents would record the amount of food thrown away along with the reason on a running basis. From a methodological point of view, the proposed approach can be used for risk management of food waste. However, additional research and data are necessary to develop the model.

5. Conclusions

Based on the study conducted in foodservice establishments in Poland, an Ishikawa diagram was developed showing the causes of food waste divided into 4 categories: materials, management, methods, and people. The risk of food waste identified in the studied foodservice establishments was manifested by throwing away semi-finished products, hot and cold served dishes, bread, vegetables and fruits, expired products, products with signs of spoilage, and products with no visible signs of spoilage. Two risk levels were identified: medium risk for fruits and vegetables, and bread, and high (not acceptable) for the other six foodstuffs. Two risk treatment options were identified: prevention and tolerance. The risks must be prevented by eliminating any errors that may result in food waste. To some extent, the risks must be tolerated, and products that are unsuitable for human consumption should be disposed of.
The risk management model for food waste that was proposed in this study is based on ISO 31000:2018 [24] and can be used in companies in different segments of the foodservice industry. We recommend that companies use a risk management model in their operations so that the generation of food waste can be included in their operational processes. In our opinion, such actions can contribute to a reduction in food waste.

Author Contributions

Conceptualization, B.B.; methodology, B.B.; validation, B.B., M.T., and D.K.-K.; formal analysis, B.B.; investigation, B.B. and M.T.; data curation, B.B. and M.T.; writing—original draft preparation, B.B.; writing—review and editing, B.B., M.T., and D.K.-K; visualization, B.B.; supervision, D.K.-K..; project administration, B.B. All authors have read and agreed to the published version of the manuscript.

Funding

This publication has been developed under the contract with the National Center for Research and Development No Gospostrateg1/385753/1/NCBR/2018 for carrying out and funding of a project implemented as part of the “The social and economic development of Poland in the conditions of globalizing markets—GOSPOSTRATEG” program called “Developing a system for monitoring wasted food and an effective program to rationalize losses and reduce food wastage” (acronym PROM).

Conflicts of Interest

The authors declared that they have no conflict of interest.

References

  1. Gustavsson, J.; Cederberg, C.; Sonesson, U.; Van Otterdijk, R.; Meybeck, A. Global Food Losses and Food Waste. Extent, Causes and Prevention; Swedish Institute for Food and Biotechnology (SIK): Gothenburg, Sweden; FAO: Rome, Italy, 2011. [Google Scholar]
  2. Commission Staff Working Document, Impact Assessment on Measures Addressing Food Waste to Complete Swd. 207 Regarding the Review of EU Waste Management Targets; European Commission: Brussels, Belgium, 2014.
  3. Beretta, C.; Stoessel, F.; Baier, U.; Hellweg, S. Quantifying food losses and the potential for reduction in Switzerland. Waste Manag. 2013, 33, 764–773. [Google Scholar] [CrossRef] [Green Version]
  4. Stenmarck, A.; Jensen, C.; Quested, T.; Moates, G. Estimates of European Food Waste Levels; Swedish Environmental Research Institute: Stockholm, Sweden, 2016. [Google Scholar]
  5. Consumi. Coldiretti, 6 Italiani Su 10 Tagliano Sprechi Nel. 2016. Available online: https://www.coldiretti.it/economia/consumi-coldiretti-6-italiani-su-10-tagliano-sprechi-nel-2016 (accessed on 25 January 2020).
  6. Waste Generation in the WA Hospitality Industry. Western Australia Department of Environment and Conservation. 2008. Available online: https://slidex.tips/download/waste-generation-in-the-wa-hospitality-industry (accessed on 30 January 2020).
  7. Bohdanowicz, P.; Zientara, P.; Novotna, E. International hotel chains and environmental protection: An analysis of hilton’s we care! Programme (Europe 2006–2008). J. Sustain. Tour. 2011, 19, 797–816. [Google Scholar] [CrossRef]
  8. Goh, E.; Jie, F. To waste or not to waste: Exploring motivational factors of Generation Z hospitality employees towards food wastage in the hospitality industry. Int. J. Hosp. Manag. 2019, 80, 126–135. [Google Scholar] [CrossRef]
  9. Maciąg, A.; Bobola, A.; Górska-Warsewicz, H.; Gębski, J. Ocena i prognoza sytuacji finansowej sektora gastronomicznego w ocenie polskich przedsiębiorców oraz perspektywie rozwoju rynku. Handel Wewnętrzny 2018, 1, 87–98. [Google Scholar]
  10. Gheribi, E. Perspektywy rozwoju przedsiębiorstw gastronomicznych na polskim rynku, Studia Ekonomiczne. Zesz. Nauk. Uniw. Ekon. W Katowicach 2016, 255, 102–112. [Google Scholar]
  11. Massow, M.V.; McAdams, B. Table scraps: An evaluation of plate waste in restaurants. J. Foodserv. Bus. Res. 2015, 18, 437–453. [Google Scholar] [CrossRef]
  12. Betz, A.; Buchli, J.; Göbelb, C.; Müllera, C. Food waste in the Swiss food service industry—Magnitude and potential for reduction. Waste Manag. 2015, 35, 218–226. [Google Scholar] [CrossRef]
  13. Hall, C.M.; Gössling, S. Sustainable Culinary Systems: Local Foods, Innovation, and Tourism & Hospitality; Routledge: London, UK, 2013. [Google Scholar]
  14. Silvennoinen, K.; Heikkilä, L.; Katajajuuri, J.M.; Reinikainen, A. Food waste volume and origin: Case studies in the Finnish food service sector. Waste Manag. 2015, 46, 140–145. [Google Scholar] [CrossRef]
  15. Martin-Rios, C.; Demen-Meier, C.; Gössling, S.; Cornuz, C. Food waste management innovations in the foodservice industry. Waste Manag. 2018, 79, 196–206. [Google Scholar] [CrossRef] [Green Version]
  16. Tonini, D.; Albizzati, P.F.; Astrup, T.F. Environmental impacts of food waste: Learnings and challenges from a case study on UK. Waste Manag. 2018, 76, 744–766. [Google Scholar] [CrossRef]
  17. Kummu, M.; De Moel, H.; Porkka, M.; Siebert, S.; Varis, O.; Ward, P.J. Lost food, wasted resources: Global food supply chain losses and their impacts on freshwater, cropland, and fertiliser use. Sci. Total Environ. 2012, 438, 477–489. [Google Scholar] [CrossRef] [PubMed]
  18. Beretta, C.; Stucki, M.; Hellweg, S. Environmental Impacts and Hotspots of Food Losses: Value Chain Analysis of Swiss Food Consumption. Environ. Sci. Technol. 2017, 51, 11165–11173. [Google Scholar] [CrossRef] [PubMed]
  19. Tukker, A.; Jansen, B. Environmental impact of products: A detailed review of studies. J. Ind. Ecol. 2006, 10, 159–182. [Google Scholar] [CrossRef]
  20. Mekonnen, M.M.; Hoekstra, A.Y. A global assessment of the water footprint of farm animal products. Ecosystems 2012, 15, 401–415. [Google Scholar] [CrossRef] [Green Version]
  21. WRAP 2013. Overview of Waste in the UK Hospitality and Food Service Sector; WRAP: Oxon, UK, 2013; HFS001-006. [Google Scholar]
  22. Hu, M.-L.; Horng, J.-S.; Teng, C.-C.; Chou, S.-F. A criteria model of restaurant energy conservation and carbon reduction in Taiwan. J. Sustain. Tour. 2016, 21, 765–779. [Google Scholar] [CrossRef]
  23. Filimonau, V.; Coteau, D.A. De Food waste management in hospitality operations: A critical review. Tour. Manag. 2019, 71, 234–245. [Google Scholar] [CrossRef]
  24. ISO 31000:2018 Risk Management–Guidelines; ISO: Geneva, Switzerland, 2018.
  25. Wróblewski, D. Zarzadzanie Ryzykiem—Przegląd Wybranych Metodyk; CNBOP-PIB: Józefów, Poland, 2015; pp. 77–78, 86–90. [Google Scholar]
  26. National Emergency Risk Assessment Guidelines. Available online: https://knowledge.aidr.org.au/media/2030/handbook-10-national-emergency-risk-assessment-guidelines.pdf (accessed on 24 September 2019).
  27. Eat Less Meat: CO2 Emission of Our Food. Available online: https://timeforchange.org/eat-less-meat-co2-emission-of-our-food/ (accessed on 26 January 2020).
  28. Water Footprint of Crop and Animal Products: A Comparison. Available online: waterfootprint.org/en/water-footprint/product-water-footprint/water-footprint-crop-and-animal-products/ (accessed on 26 January 2020).
  29. Hoekstra, A.Y. Water for animal products: A blind spot in water policy. Environ. Res. Lett. 2014, 9, 091003. [Google Scholar] [CrossRef] [Green Version]
  30. Parfitt, J.; Barthel, M.; Macnaughton, S. Food waste within food supply chains: Quantification and potential for change to 2050. Philos. Trans. R. Soc. B Biol. Sci. 2010, 365, 3065–3081. [Google Scholar] [CrossRef] [Green Version]
  31. Heikkilä, L.; Reinikainen, A.; Katajajuuri, J.-M.; Silvennoinen, K.; Hartikainen, H. Elements affecting food waste in the food service sector. Waste Manag. 2016, 56, 446–453. [Google Scholar] [CrossRef]
  32. Sustainable Restaurant Association (SRA). Too Good to Waste: Restaurant Food Waste Survey Report; SRA: London, UK, 2010. [Google Scholar]
  33. Papargyropoulou, E.; Wright, N.; Lozano, R.; Steinberger, J.; Padfield, R.; Ujang, Z. Conceptual framework for the study of food waste generation and prevention in the hospitality sector. Waste Manag. 2016, 49, 326–336. [Google Scholar] [CrossRef]
  34. Pirani, S.I.; Arafat, H.A. Reduction of food waste generation in the hospitality industry. J. Clean. Prod. 2016, 132, 129–145. [Google Scholar] [CrossRef]
  35. Silvennoinen, J.; Katajajuuri, J.M.; Hartikainen, H.; Heikkilä, L.; Reinikainen, A. Food waste volume and composition in Finnish households. Brit. Food J. 2014, 116, 1058–1068. [Google Scholar] [CrossRef]
  36. Derqui, B.; Fayos, T.; Vicenc, F. Towards a More Sustainable Food Supply Chain: Opening up Invisible Waste in Food Service. Sustainability 2016, 8, 693. [Google Scholar] [CrossRef] [Green Version]
  37. Önala, M.H.; Romeijnb, H.E.; Saprac, A.; van den Heuveld, W. The economic lot-sizing problem with perishable items and consumption order preference. Eur. J. Oper. Res. 2015, 244, 881–891. [Google Scholar] [CrossRef]
  38. Jedermann, R.; Nicometo, M.; Uysal, I.; Lang, W. Reducing food losses by intelligent food logistics. Philos. Trans. R. Soc. A 2014, 372, 20130302. [Google Scholar] [CrossRef]
  39. Papargyropoulou, E.; Lozano, R.; Steinberger, J.K.; Wright, N.; bin Ujang, Z. The food waste hierarchy as a framework for the management of food surplus and food waste. J. Clean. Prod. 2014, 76, 106–115. [Google Scholar] [CrossRef]
  40. Da Cunha, D.T.; Stedefeldt, E.; de Rosso, V.V. The role of theoretical food safety training on Brazilian food handlers’ knowledge, attitude and practice. Food Control 2014, 43, 167–174. [Google Scholar] [CrossRef]
  41. Lipińska, M.; Tomaszewska, M.; Kołożyn-Krajewska, D. Identifying Factors Associated with Food Losses during Transportation: Potentials for Social Purposes. Sustainability 2019, 11, 2046. [Google Scholar] [CrossRef] [Green Version]
  42. Wrzosek, M.; Bilska, B.; Kołożyn-Krajewska, D.; Krajewski, K. Zastosowanie analizy ryzyka do opracowania innowacyjnego systemu ograniczania strat i marnowania żywności w handlu detalicznym (system MOST). Żywność. Nauka Technol. Jakość 2017, 24, 140–155. [Google Scholar]
  43. Bilska, B.; Wrzosek, M.; Kołożyn-Krajewska, D.; Krajewski, K. Risk of food losses and potential of food recovery for social purposes. Waste Manag. 2016, 52, 269–277. [Google Scholar] [CrossRef]
  44. Ehler, S. People Power: Rachel Argaman. CEO Of TFE Hotels Is Always Looking for Ways to Give Back to Her Staff and Donate to Local Charities; The CEO Magazine: Brookvale, Australia, April 2016; p. 27. Available online: https://aicc.imiscloud.com/images/3downloads/2-rachel-argaman-tfe-hotels-aicc-april-edition-2016.pdf (accessed on 26 January 2020).
  45. WRAP 2017. The Hospitality and Food Service Agreement: Taking Action on Waste; WRAP: Oxon, UK, 2017. [Google Scholar]
  46. Kołożyn-Krajewska, D.; Bilska, B.; Krajewski, K.; Wrzosek, M. Ograniczenie strat i marnotrawstwa żywności—Kontekst prawny i prace w Polsce nad modelem MOST. Food Lex 2017, 3, 45–50. [Google Scholar]
  47. Halloran, A.; Clement, J.; Kornum, N.; Bucatariu, C.; Magid, J. Addressing food waste reduction in Denmark. Food Policy 2014, 49, 294–301. [Google Scholar] [CrossRef]
  48. GOV.UK. Supplying and Using Animal by-Products as Farm Animal Feed; Department for Environment, Food and Rural Affairs: London, UK, 2014; p. 27. Available online: https://www.gov.uk/guidance/supplying-and-using-animal-by-products-as-farm-animal-feed (accessed on 26 January 2020).
  49. Singh, N.; Cranage, D.; Lee, S. Green strategies for hotels: Estimation of recycling benefits. Int. J. Hosp. Manag. 2014, 43, 13–22. [Google Scholar] [CrossRef]
Figure 1. Causes of food waste in the studied foodservice establishments [%]. 1—ill-considered purchases, 2—excessive purchases, 3—purchases of low-quality products, 4—inadequate storage conditions, 5—preparing too much food, 6—overlooking the expiry date, 7—lack of ides for other use of products for preparation of other dishes, 8—inappropriate staff qualifications.
Sustainability 12 02050 g001
Figure 2. The causes of food waste and their frequency in 5 *—point scale.
Sustainability 12 02050 g002
Figure 3. Method of management of unsold meals in the studied foodservice establishments [%].
Sustainability 12 02050 g003
Figure 4. The values for the probability (P) of disposal of food products in foodservice establishments on a 5-point scale, (where: 5—daily, and 1—never) and the values for the consequences (C) (where: 5—extreme, and 1—insignificant).
Sustainability 12 02050 g004
Table 1. Characteristics of the foodservice establishments participating in the study [%].
CharacteristicsCategories%
Business location:Cities with population of over 500,001 60.8
Cities with population over 100,001 and up to 500,000 10
Cities with population over 50,001 and up to 100,000 12.3
Cities with population up to 50,000 9.2
Villages7.7
Type of establishment:Bar9.2
Restaurant50.8
Hotel foodservice9.2
Canteen2.3
Foodservice point3.8
Café15.4
Other9.3
Time in business:<1 year6.2
1–2 years13.8
3–5 years23.8
6–5 years13.8
>9 years42.4
Number of employees:up to 1031.5
11–2025.4
21–5023.8
51–706.9
More than 7012.3
Number of consumers served:up to 10035.4
101–20021.5
201–40013.1
More than 40030
Position of the person filling the questionnaire:Manager40
Chef17.7
Owner16.2
Supervisor6.9
Other19.2
Food safety management systems in place:GMP/GHP58.5
HACCP91.5
ISO 22 000 6.9
Table 2. Food waste probability matrix (P).
AssessmentPointsDescription
There Are Reasonable Grounds to Believe That:
impossible1food waste will not occur
possible2food waste will occur occasionally
very possible 3food waste will occur sometimes
almost certain4food waste will occur almost daily
certain5food waste will occur every day
Source: Own study based on [24,25,26].
Table 3. Consequences matrix (C).
AssessmentPointsDescription
insignificant1results in insignificant financial losses
does not adversely affect the environment
minor2results in minor financial losses
virtually does not adversely affect the environment
moderate3results in moderate financial losses
moderate negative impact on the environment
major4results in major financial losses
negative impact on the environment
extreme5causes serious financial losses
very negative impact on the environment
Source: Own study based on [24,25,26].
Table 4. Consequence/probability matrix (R).
Consequence (C)InsignificantMinorModerateMajorExtreme
Probability (P)
Impossible 12345
Possible 246810
Very possible 3691215
Almost certain 48121620
Certain 510152025
Table 5. Risk matrix and risk treatment.
RISK MATRIXRISK TREATMENT
CriteriaEvaluationRisk Treatment Options
LevelRisk
1–5lowacceptable1. tolerance
6–9mediumacceptable, requiring management decisions1. tolerance
2. prevention
10–16highunacceptable1. prevention
2. tolerance
16–25.very highunacceptable1. avoidance
2. prevention
3. tolerance
Source: Own study based on [24,25,26].
Table 6. Results of descriptive statistics concerning causes of discarding food in catering establishments.
CausesMeanMedianModeKurtosisSD
ill-considered shopping2.02.01.00.1430.948
too many products bought2.12.02.00.4510.913
buying low-quality products1.61.01.01.7110.948
inappropriate storage conditions1.82.01.00.5090.825
preparing too much food2.42.02.0–0.7150.966
overlooking the expiry date 2.12.02.0–0.7040.854
lack of ideas for other use of products 1.51.01.03.4480.941
inappropriate staff qualifications1.82.01.00.7820.969
5—always, 4—usually, 3—sometimes, 2—occasionally, 1—never.
Table 7. Frequency of performance of the listed activities [%].
FrequencyChecking the Stock of Food Products before ShoppingPreparing a List of Products NeededBuying Food Products that Have not been PlannedShopping to Stock Up on FoodBuying Products with a Short Expiry Date
always80.080.83.86.93.2
usually19.213.88.515.43.2
sometimes0.83.130.035.415.1
occasionally0.00.038.526.230.2
never0.01.519.216.248.4
Table 8. Frequency of performance of the listed activities at the time of receipt of goods [%].
FrequencyChecking the Temperature of the Means of Transport and/or Refrigeration ProductsChecking the Hygiene of the SupplierChecking the Cleanliness of the Means of TransportChecking the Expiry DateChecking the Packaging ConditionEvaluating the Appearance and Smell of Unpackaged Products
always47.232.032.075.072.677.4
usually12.217.214.812.920.29.7
sometimes8.918.913.93.20.80.8
occasionally14.65.711.53.20.84.0
never17.126.227.95.65.68.1
Table 9. Frequency of particular activities in storerooms.
FrequencyChecking the Temperature in Cold Storage RoomsChecking the Temperature in Freezer Storage RoomsChecking the CleanlinessChecking the Expiry DatesChecking the Packaging ConditionChecking the Appearance and Smell of Unpackaged Products
more than 2 times a day10.311.39.78.910.57.3
1–2 times
a day
72.271.068.555.646.071.0
2–3 times
a week
8.78.910.525.026.612.1
1–2 times
a month
7.17.311.39.713.77.3
never 1.61.60.00.83.22.4
Table 10. Method of management of food waste in the studied foodservice establishments.
FrequencyDisposed of into a Public Garbage ContainerDisposed of in a Food Waste ContainerHanded over to be Fed to Farm Animals Drained into the Sewer System Thanks to the Installed Food Waste GrindersNot Applicable
waste of plant origin44.429.010.51.614.5
used cooking/frying oil9.750.04.82.433.1
expired food48.436.98.20.06.5
waste of animal origin41.843.45.70.09.1
Table 11. Frequency of disposal of food products in foodservice establishments [%].
FrequencySemi-Finished Products, Cold-Served Dishes Warm Served DishesBreadWilted Fruits and VegetablesExpired ProductsPartly Consumed Products with Signs of SpoilagePartly Consumed Products without Visible Signs of Spoilage
every day18.621.725.620.922.524.024.816.3
almost daily7.814.06.210.110.911.615.511.6
sometimes17.827.919.421.735.728.726.418.6
occasionally28.725.623.324.822.530.227.931.8
never27.111.626.423.39.36.26.222.5
Table 12. Results of descriptive statistics concerning the frequency of discarding food in catering establishments.
Disposal of Food ProductsMeanMedianModeKurtosisSD
semi-finished products2.62.0repeated–1.081.46
cold-served dishes3.13.03.0–1.101.31
warm-served dishes2.83.01.0–1.361.52
bread2.83.02.0–1.221.44
wilted fruits and vegetables3.23.03.0–0.941.25
expired products3.23.02.0 –1.111.26
partly consumed products with signs of spoilage3.33.02.0–1.161.27
partly consumed products without visible signs of spoilage2.72.02.0–1.011.37

