Article

The Relation between Knowledge Acquisition and Environmental Values within the Scope of a Biodiversity Learning Module

by
Jennifer Schneiderhan-Opel
* and
Franz X. Bogner
Centre for Mathematics and Science Education (Z-MNU), Department of Biology Education, University of Bayreuth, NW1, 95447 Bayreuth, Germany
*
Author to whom correspondence should be addressed.
Sustainability 2020, 12(5), 2036; https://doi.org/10.3390/su12052036
Submission received: 15 January 2020 / Revised: 2 March 2020 / Accepted: 4 March 2020 / Published: 6 March 2020
(This article belongs to the Special Issue Monitoring and Intervening with Adolescent Green Attitudes and Values)

Abstract

:
Global biodiversity declines at unprecedented rates, mainly due to human-induced environmental change. Biodiversity conservation is, thus, highly dependent on responsible and sustainable citizenship. Educational efforts are regarded as an important means to foster awareness and pro-environmental behavior. The present study monitors two factors considered to be particularly relevant for promoting sustainable behavior: cognitive knowledge and environmental values. 205 students (Mage = 15.3) participated in a biodiversity education module including a citizen science (CS) activity on DNA barcoding. With a pre-post-retention design, we measured cognitive achievement and environmental values, which are expressed by environmental utilization (UTL) and preservation (PRE) as well as the appreciation for nature (APR). Overall, we found positive relations between knowledge and PRE as well as APR, whereas UTL was negatively related to knowledge. In the whole module and the sub-modules, cognitive achievement followed the usual pattern, with a substantial short-term knowledge increase from pre-test (T0) to post-test (T1) following a moderate decrease in the retention test (T2). Unexpectedly, a considerable sub-sample (n = 103) deviated from the assumed knowledge drop at T2 and showed an additional knowledge gain in a sub-module directly focusing on the CS activity. Students in this sub-sample revealed significantly higher PRE and APR scores compared to the rest of the students. We discuss these findings in relation to the implications for educational CS.

1. Introduction

Conservation scientists repeatedly emphasize that the earth is facing a sixth mass extinction [1]. The only recently released global assessment report on biodiversity and ecosystem services concluded that nearly one million flora and fauna species are seriously endangered [2]. Major ecosystems, such as wetlands, forests and coral reefs are changing rapidly. Human activities are considered the driving forces of environmental change and of the rising biodiversity loss. Not least because of this, the current epoch is often referred to as the Anthropocene or Homogenocene [3,4]. The Intergovernmental Science-Policy Platform on Biodiversity and Ecosystem Services (IPBES) [2] identifies direct causes of global biodiversity loss which are determined by underlying indirect drivers of environmental change. Indirect causes, including among other factors, overpopulation, consumer behavior, international trade, industrial and technological changes, expansion of forestry and agriculture, have led to the degradation of natural environments. Five consequences of these indirect drivers are considered mainly accountable for directly inducing habitat and species loss: overexploitation of natural resources and species, land-and sea-use change, pollution, climate change and the introduction of invasive species. Well-known examples of human-induced alterations of biodiversity are the impacts of overfishing on oceanic environments or the reduction of forest ecosystems due to monoculture cultivation. A generally accepted measure for the human impact on the environment is the ecological footprint, which tracks human demand on biologically productive areas. According to data of the Global Footprint Network’s National Footprint and Biocapacity Accounts, the global ecological footprint exceeds biocapacity, resulting in an ecological overshoot, which is steadily growing every year at an average of two percent [5]. The global human footprint is overriding biocapacity because humanity demands 1.7 earths worldwide [6]. The human impact on the environment varies geographically: the footprint of Germany, for example, exceeds the biocapacity by 199% [7]. Among the most affected biomes in the world are Western Europe’s temperate deciduous forests, India’s tropical dry forests and the tropical moist forests of Southeast Asia [6].
Human activities cause tremendous biodiversity loss causing irrevocable damage to the natural world and, from an anthropocentric point of view, to human welfare. A biodiversity decrease can lead to a loss in ecosystem functioning, which lessens the ability of nature to provide certain ecosystem services, i.e., goods and benefits for human wellbeing [8]. According to the above-mentioned IPBES report, most of these services are on a decline. This includes, for example, pollination, regulation of climate or air quality, as well as soil formation and protection. Ultimately, by destroying biodiversity, we are degrading our own basis of life. Ehrlich and Pringle [9] cut right to the chase of the matter by stating:
In short, although there are many uncertainties about the trajectories of individual populations and species, we know where biodiversity will go from here in the absence of a rapid, transformative intervention: up in smoke; toward the poles and under water; into crops and livestock; onto the table and into yet more human biomass; into fuel tanks; into furniture, pet stores, and home remedies for impotence; out of the way of more cities and suburbs; into distant memory and history books.
[9] (p. 11580)

1.1. Biodiversity Education

Halting the biodiversity decline is one of the most critical challenges of our time. Approaching this goal requires action, commitment and involvement not only of the scientific community or policymakers but also of the general public. A decrease in the above-mentioned human-induced threats to biodiversity cannot solely be accomplished by political means such as imposing taxes, fees or penalties [9]. Instead, multi-faceted approaches are needed for the implementation of conservation strategies, and their success strongly relies on the readiness of the public. Individual actions such as conscious and sustainable consumer behavior play a key role in reducing the human impact on the environment. Besides the urgency of the issue, studies point towards a rather limited biodiversity awareness among laypersons [10,11,12]. It has been repeatedly shown that biodiversity is often reduced to species diversity [13,14]. There is a broad consensus on the importance of educational measures to foster understanding and appreciation of biodiversity [9,15]. Developing knowledge and raising awareness of biodiversity through education is regarded as a crucial driver for enhancing engagement and an important measurement for sustainability development. Environmental knowledge and competencies are required for making informed decisions or for taking part in discussions about socio-scientific issues [16,17]. Education is also one of the key measures proposed by the Convention on Biological Diversity (CBD) ever since its ratification in 1992 [18]. It is embedded in Article 13 and in the Aichi Biodiversity Targets. These targets are part of the Strategic Plan for Biodiversity 2011–2020, which was adopted after conservation aims set for 2010 were not achieved.
Biodiversity has repeatedly been identified as a complex, interdisciplinary and elusive concept [19]. The most obvious difficulty of biodiversity education lies in the definition of the concept. It includes not only the diversity of species but also of genes and ecosystems [20]. More updated definitions additionally include, among others, concepts such as relative frequency, composition, spatial distribution and interaction of species, genotypes and functional groups within ecosystems [16]. Several studies have shown that students and lay persons have a species-centered view on biodiversity, e.g., [14,16,20]. Students need to gain a more comprehensive understanding of biodiversity in order to grasp the complex drivers and consequences of biodiversity loss mentioned above, which affect the natural world as well as human wellbeing [9]. For example, ecosystem functioning and the provision of ecosystem services can never be fully understood if the biodiversity concept is reduced to species richness. Furthermore, biodiversity is defined as a socio-scientific issue because the underlying interrelations of biodiversity loss and conservation attempts do not only require a scientific and ecological understanding but include consideration of social, economic, political and cultural aspects [21]. Thus, the topic has a normative and value-laden character because varying perspectives need to be included in decision-making processes [22]. Based on the multi-dimensionality of the topic, environmental education (EE) or education for sustainable development (ESD) are highly suitable approaches for biodiversity education [19,23]. Both approaches “acknowledge the relations and interdependencies between environmental and socio-economic issues and both recognize biodiversity as an important cross-cutting educational theme, and as a concept that can portray such complexities” [24] (p. 18). In the sense of EE and ESD, biodiversity can be understood as an interdisciplinary educational task that must be comprehensively realized in all school types and subjects.

1.2. FutureForest—Engaging Students in Biodiversity Conservation

For the present study, a biodiversity education module called FutureForest [25] was designed to raise awareness for biodiversity loss among students and to engage them in biodiversity conservation. Focusing on biodiversity conservation with the example of the forest ecosystem, the module involves students in a collaborative citizen science activity on DNA barcoding supplemented with educational materials and activities in the regular biology classroom.
Within the last decade, citizen science (CS) has attracted increasing attention in science and conservation research [26,27,28]. CS involves members of the public in authentic scientific research [29,30]. In literature reviews by Follett & Strezov [27] and Kullenberg & Kasperowski [31], conservation biology was identified as a major thematic framework of CS publications available in the Web of Science and Scopus. Biodiversity research is in particular benefiting from CS [32]. Engaging volunteers in biodiversity monitoring enables the generation of large amounts of data and has already considerably contributed to the global biodiversity assessment [33,34]. Having reviewed 388 biodiversity-related CS projects, Theobald et al. [35] point out that the considerable potential of CS for biodiversity monitoring is still largely untapped.
In addition to its increasing popularity in scientific research, CS has gained consideration in science and environmental education research [36,37]. Peter et al. [38] reviewed publications on the educational impacts of biodiversity-related CS projects. They conclude that CS is a suitable approach for biodiversity education. Most of the studies reviewed reported positive effects of CS on participants’ knowledge, attitudes and reported behavior. Outcomes that were found less frequently were changes in participants’ skills, self-efficacy and interest. For example, Jordan et al. [39] investigated knowledge acquisition in a CS project on invasive plant species. They could show that participants increased their species knowledge significantly by taking part in the project.
In summary, CS has gained ground in scientific research, and its positive impact on informal learning is very promising. Most studies on the learning outcomes of CS projects evaluate the informal learning experiences of volunteer participants, while only a few studies are available which have investigated CS as part of formal education approaches [40,41]. Our intention to integrate a citizen science activity in our biodiversity education module was justified by two clear benefits that we ascribe to citizen science. First, citizen science provides an otherwise rather rarely perceived opportunity in formal science education: to expose students to authentic scientific inquiry. Second, citizen science, in our case biodiversity citizen science, makes it possible to directly involve students in biodiversity conservation because DNA barcoding plays a significant role in biodiversity assessment and environmental monitoring, which in turn constitutes an essential requirement for preservation activities. To our knowledge, only a few studies so far have evaluated approaches where citizen science was integrated into formal educational interventions [40,42].

1.3. Knowledge Acquisition and Environmental Values

Biodiversity conservation lies in the responsibility of each one of us and requires responsible citizenship as well as environmental stewardship. Environmental knowledge plays an important role regarding active participation because knowledge and competences determine the development of pro-environmental attitudes and behavior [43]. For example, in a study on behavioral intentions towards global climate change, Bord et al. [44] identified an in-depth understanding of the causes of climate change as a major trigger for supporting pro-environmental action. Furthermore, knowledge and competences are needed to enable decision-making processes regarding socio-scientific issues [45]. Besides knowledge, environmental behavior is assumed to be predicted by a person’s environmental values [46]. The relation between environmental values and knowledge acquisition as well as their influence on pro-environmental behavior is of high consideration for ESD and environmental education research.
A widely used instrument to measure adolescents’ environmental values is the two major environmental values (2-MEV) model by [47,48]. Over the last two decades, the two-dimensional structure of the 2-MEV model has been repeatedly confirmed by bi-national studies and independent research groups [49,50,51,52,53]. The initial 69 item-set was refined and reduced to 14 items that sufficiently measure two higher-order factors: Preservation (PRE) and Utilization (UTL). Preservation refers to an altruistic, ecocentric perspective on the environment, including preferences to protect and conserve nature. Utilization, on the other hand, reflects an anthropocentric view on the environment, focused on exploitative, egocentric use of natural resources. Following the definition by Rokeach [54], the term “attitudes” refers to first-order factors, and the term “values” describes higher-order factors. Thus, we will use the expression “environmental values” hereafter. In a recent study, PRE and UTL were associated with a third concept: appreciation of nature (APR) [55]. It forms the opposite pole to an exploitative utilization of natural assets and is reflected in the sustainable and conscious use of nature, e.g., for recreational reasons, without overexploiting the natural resources [56,57]. Understanding the interactions between knowledge and environmental attitudes is of high relevance to education sciences. Thus far, several studies have repeatedly linked knowledge acquisition to the environmental values of preservation and utilization. However, studies vary in their results, and the relationship between knowledge and the 2-MEV values do not seem to be completely clarified yet. Boeve-de Pauw & Van Petegem [58] investigated the environmental knowledge and attitudes of 10 to 12-year-old students, revealing a positive relation between utilization and students’ knowledge. Fremerey and Bogner [59] examined the cognitive achievement of 12-year-old students within an educational outreach-module on the topic of drinking water and reported a positive correlation between the pro-environmental value preservation and students’ knowledge scores, while utilization showed no relation to knowledge acquisition. Additionally, Thorn and Bogner [60] reported a positive relation of preservation and a negative relation of utilization with the cognitive achievement of 13-year-old students within an environmental learning module on forest conservation.

2. Research Goals

The present study aims to (i) analyze the cognitive achievement of the participating students in the whole module and the sub-modules, and (ii) examine the effect of the students’ environmental values on their cognitive achievement in the learning module. The following research questions are applied:
RQ 1:
To what extent does participation in the learning module affect the students’ short-and long-term knowledge acquisition?
RQ 2:
To what extent are the students’ environmental values preservation, utilization and appreciation related to the expected knowledge acquisition?
We expect our module to have a short-term as well as a long-term effect on students’ content knowledge. Furthermore, we anticipate utilization to negatively affect students’ learning, while we assume preservation and appreciation to be positively connected to the participants’ cognitive achievement.

3. Materials and Methods

3.1. Sample

The sample consisted of 276 German 10th-grade students from the secondary, university preparatory school (“Gymnasium”). Overall, 12 classes from seven schools participated in our project. The schools were located more in rural areas and smaller towns in northern parts of Bavaria, Southern Germany. 205 full data sets were available for the evaluation (46.8% female, age: M ± SD = 15.3 ± 0.64). A test-retest group consisting of 35 students from two further classes from two schools completed the questionnaires without participating in the project (77.1% female; age: M ± SD = 15.5 ± 0.61). Teachers enrolled their classes for the project, and students’ as well as parents’ permission was required for participation.

3.2. Project Content and Design

The overall aim of our educational effort was to increase knowledge on biodiversity and to raise awareness for its conservation. Students participated in a 4-lesson learning module (180 min) on biodiversity using the example of the forest ecosystem. The example of the forest was used because it was directly linked to the students’ environment and experience. The module consisted of four sub-modules covering different aspects of biodiversity and its conservation and included a collaborative citizen science activity.
Students collected forest soil samples for a national DNA barcoding project. DNA barcoding is a method used to genetically identify species by using species-specific genetic markers, so-called DNA barcodes [61]. To determine a species via DNA barcoding, its amplified DNA barcode must be compared to already morphologically and genetically determined reference species in a barcode database. The method, thus, relies on the establishment of an international database that contains all recently known species. With the soil organisms contained in their soil samples, students contributed to the expansion of this database. Beyond this goal, the participating scientists aim to find new, previously unknown species of soil organisms. Students were trained by their teachers for correct data collection and were provided with a sampling protocol. The protocol, on the one hand, contained tasks to be filled in by the students, and on the other hand summarized information on the collection of the sample and the GPS location data, as well as on the correct handling of the soil to prevent it from drying out. The students were asked to provide details on the sample location (e.g., plant and tree composition of the respective forest). Together with the protocol data, the soil samples were sent to the scientists for a barcoding analysis. A few months later, students were informed about the species determination results with a letter containing the German and Latin species names, a phylogenetic tree and a picture of all the species that were found.
The content and tasks of the four sub-modules focused on different aspects of the overall topic:
(1)
forests as providers of wellbeing: ecosystem services, including supporting, provisioning, regulating and cultural services.
(2)
DNA barcoding: the use of the method for species identification and its direct relation to biodiversity conservation through environmental monitoring.
(3)
species knowledge: the determination of forest soil organisms using a simple identification key combined with a task on the importance of a diverse composition of soil organism species for ecosystem functioning.
(4)
human-induced threats on biodiversity: the impact of the cultivation of spruce monocultures on local biodiversity (consequences of bark beetle calamities, climate change, etc.), including the perspectives of different stakeholders in a future scenario role play.
Following a self-determination approach [62], students worked collaboratively and autonomously in small groups of three to four students, guided by a workbook containing all the necessary information and task descriptions. The groups were self-responsible for completing the whole module within the given time frame. Materials for each sub-module were provided at workstations that were offered twice in the classroom to ensure a continuous workflow. Having completed a workstation, students were asked to independently compare their results to a solution booklet provided at the teacher’s desk. A final teacher-guided wrap-up phase at the end of the module ensured the verification and, where applicable, improvement of students’ results.

3.3. Instruments and Procedure

A paper-and-pencil questionnaire was used to monitor the knowledge and environmental values. The ad-hoc knowledge scale consisted of 25 program-specific multiple-choice questions. One item was on the definition of biodiversity, while the remaining 24 items covered four knowledge fields referring to the content of the sub-modules of the intervention: (i) ecosystem services and their relation to biodiversity; (ii) the method of DNA barcoding and its use for biodiversity preservation; (iii) identification of soil organisms and their role in the forest ecosystem; and (iv) threats to biodiversity using the example of the forest ecosystem (in figures and tables abbreviated as (i) “ecoservice”, (ii) “barcoding”, (iii) “ident” and (iv) “threats”). We ordered the items randomly and differently at each test time. Each item had four response options, only one of which was correct (item examples are shown in Table 1).
To measure the environmental values, we used the 2-MEV and appreciation for nature items as displayed in [55]. To measure the individual participant outcomes, our study followed a quasi-experimental design [63], including a pre-, post- and follow-up test as well as a test-retest group. Students completed the questionnaire one or two weeks before (T0), directly after (T1) and six weeks after (T2) participation. We measured the content knowledge at all three test times, while we included the 2-MEV scale at T0 only. Each test took the students approximately 20 min. The biodiversity module, as well as the evaluation, took place during regular school hours.

3.4. Statistical Analysis

We used IBM SPSS statistics version 24 for the statistical analysis. Following the central limit theorem, we conducted parametric tests [64]. We recoded responses of the knowledge test to “1” for correct answers and “0” for false answers. All tests were computed using the sum scores of the overall 25 knowledge items or the 6 items relating to each sub-module. Consequently, high scores indicate a good comprehension with 25 and 6 respectively presenting the maximum attainable scores. Cronbach’s alpha reliability scores of the knowledge questionnaire were acceptable, except for T0: αT0 = 0.654, αT1 = 0.745, αT2 = 0.796. We used the knowledge items of the test time T0 to determine the item difficulty levels (Figure 1). Ranging between 0.15 and 0.96, the items showed a suitable range from easy to difficult. A Shapiro-Wilk-Test showed a normal distribution of the item difficulties (p = 0.31).
Repeated measure analyses of variance (ANOVAs) was used to determine knowledge differences between the test times T0, T1 and T2. In cases of a significant Mauchly’s test showing a violation of sphericity, we used a Huynh-Feldt adjustment for correction. Post-hoc analyses were Bonferroni-corrected.
A two-tailed Pearson correlation with Bonferroni-corrected p-values was used to examine relations between knowledge and 2-MEV at T0, T1 and T2. Based on the mean scores of the environmental value variables, we conducted a quartile split to compare the bottom and upper 25% of the sample concerning their cognitive achievement. Upper quartile participants (high scorers) were referred to as students with high utilization, preservation or appreciation preferences, while lower quartile participants (low scorers) were referred to as students with low preferences in the respective environmental value.
For all group differences that were reported, we used unpaired t-tests for intergroup comparisons and repeated measure ANOVAs for intragroup comparisons. Due to multiple testing, a Bonferroni correction was applied. To examine whether learning effects within a sub-sample were dependent or independent from membership in one of the 12 school classes, we calculated a corrected contingency coefficient Ccorr for the association between the two nominal variables of group affiliation.

4. Results

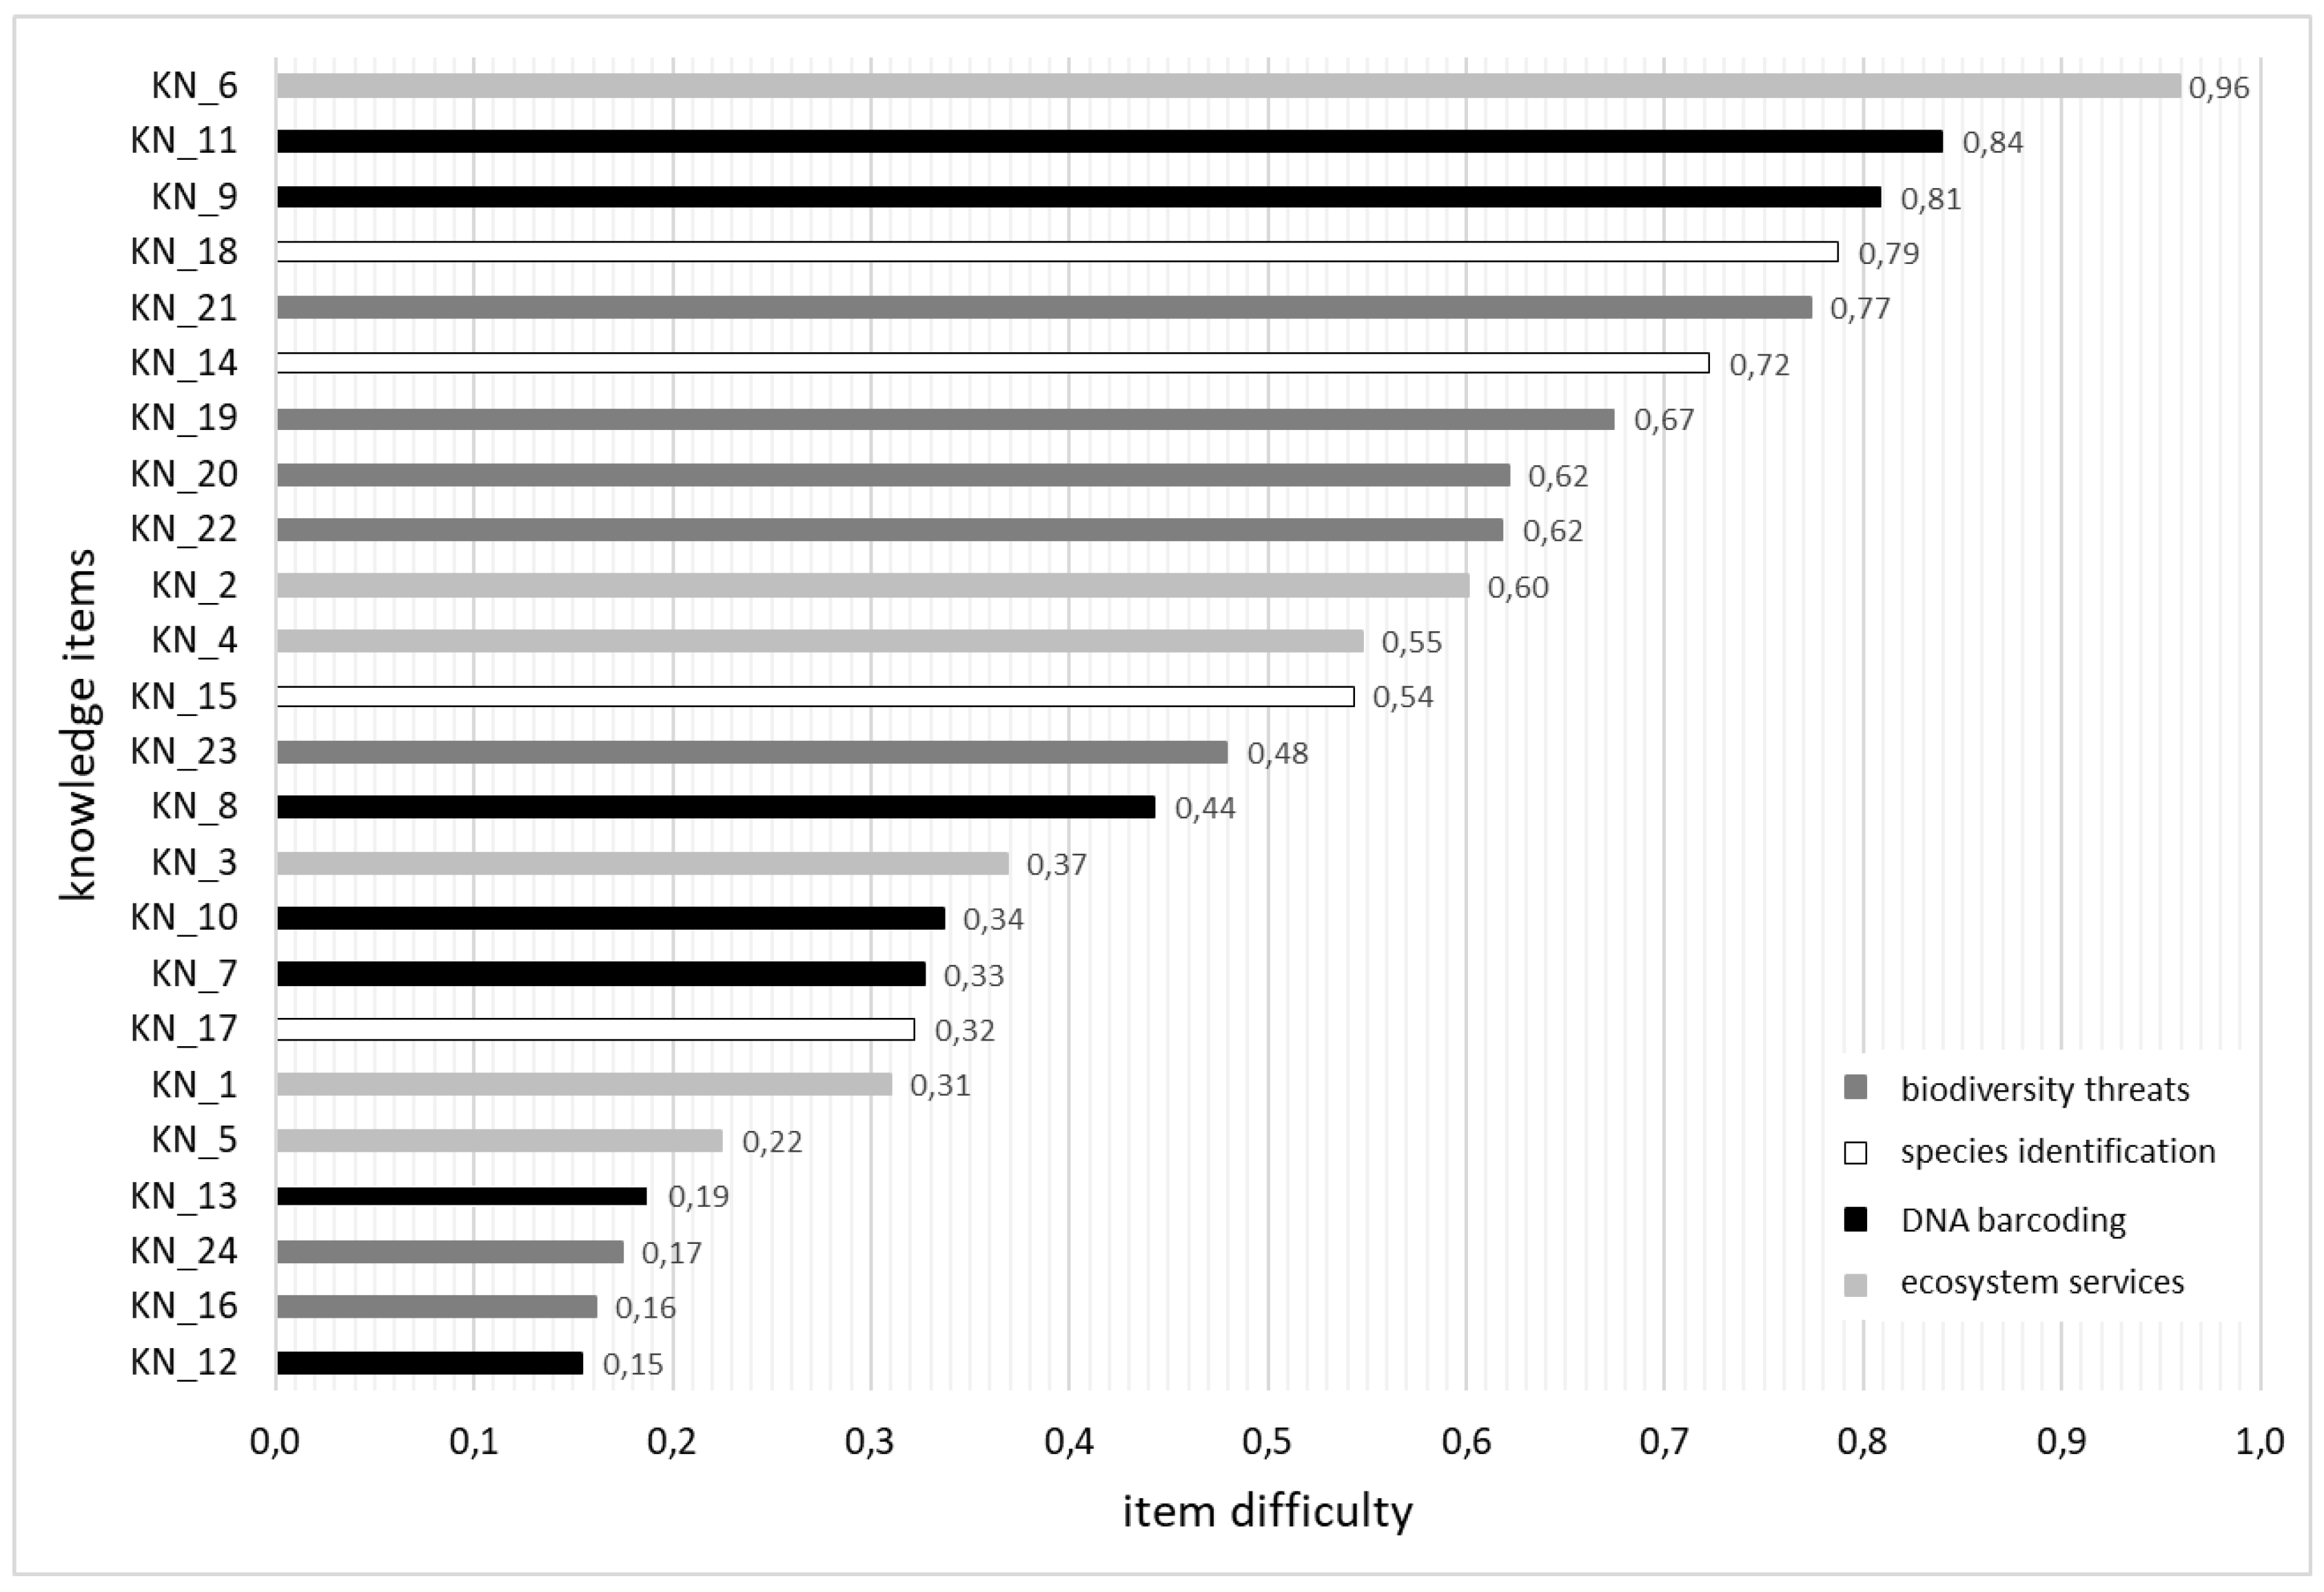
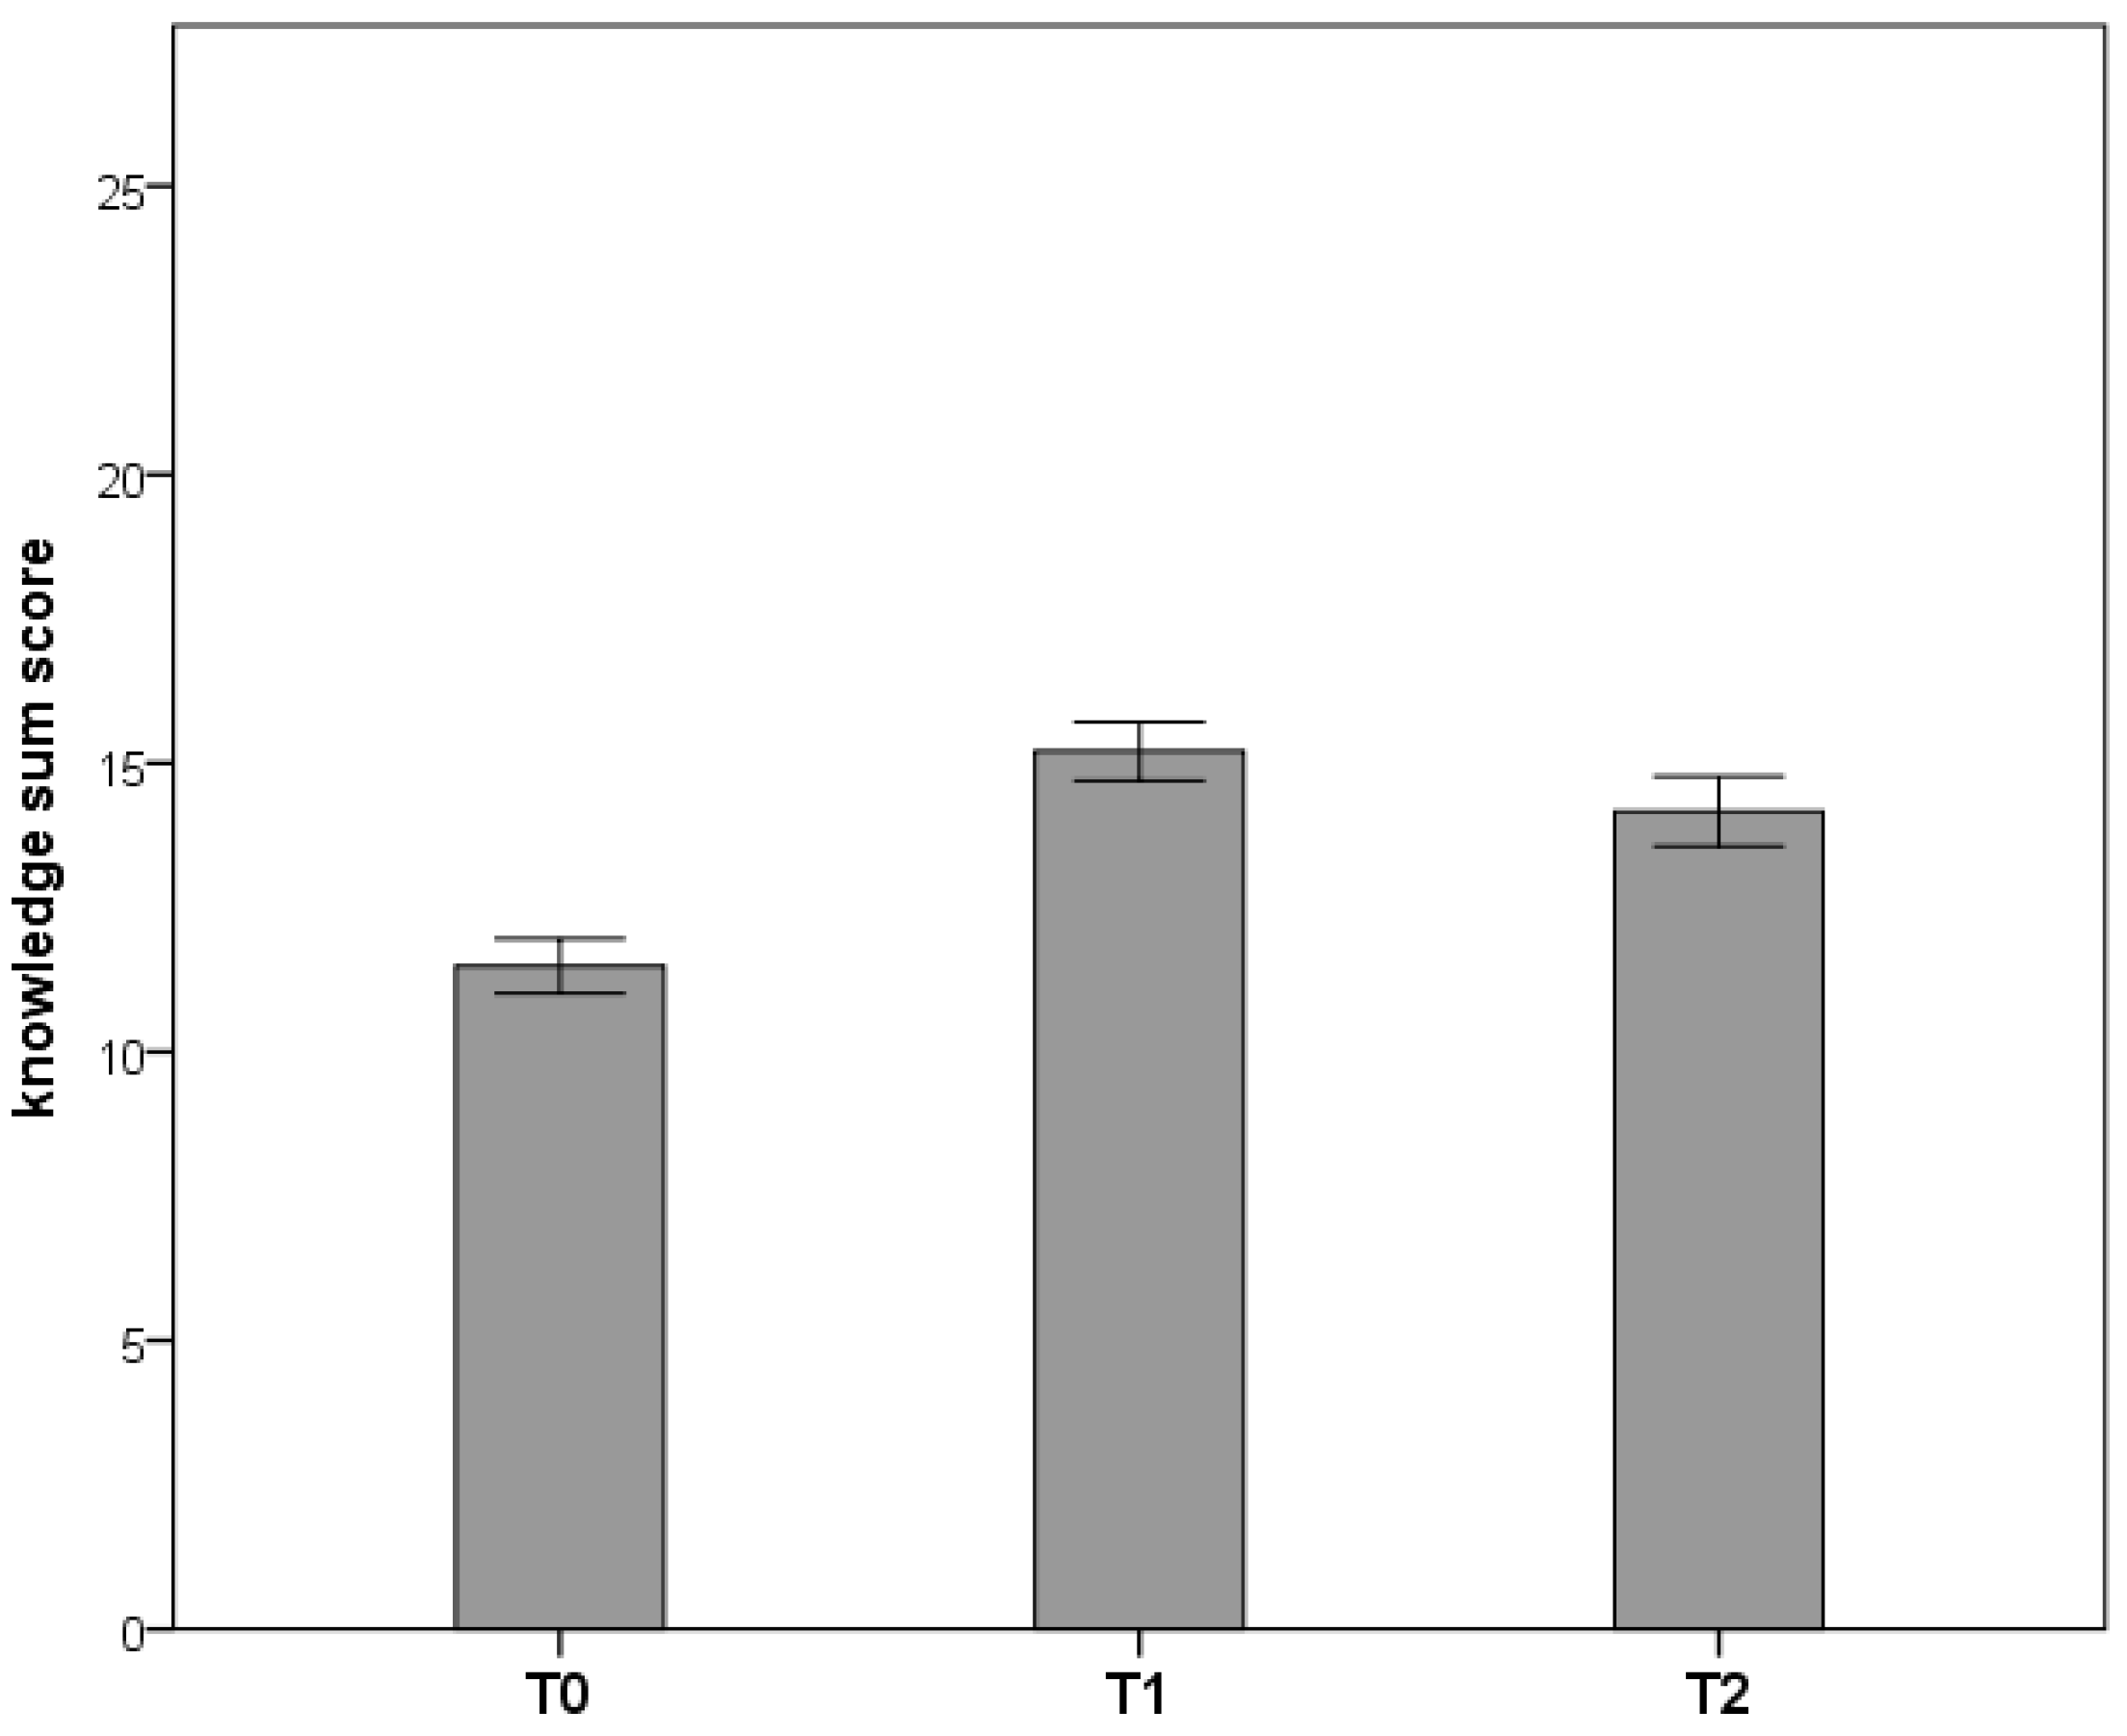
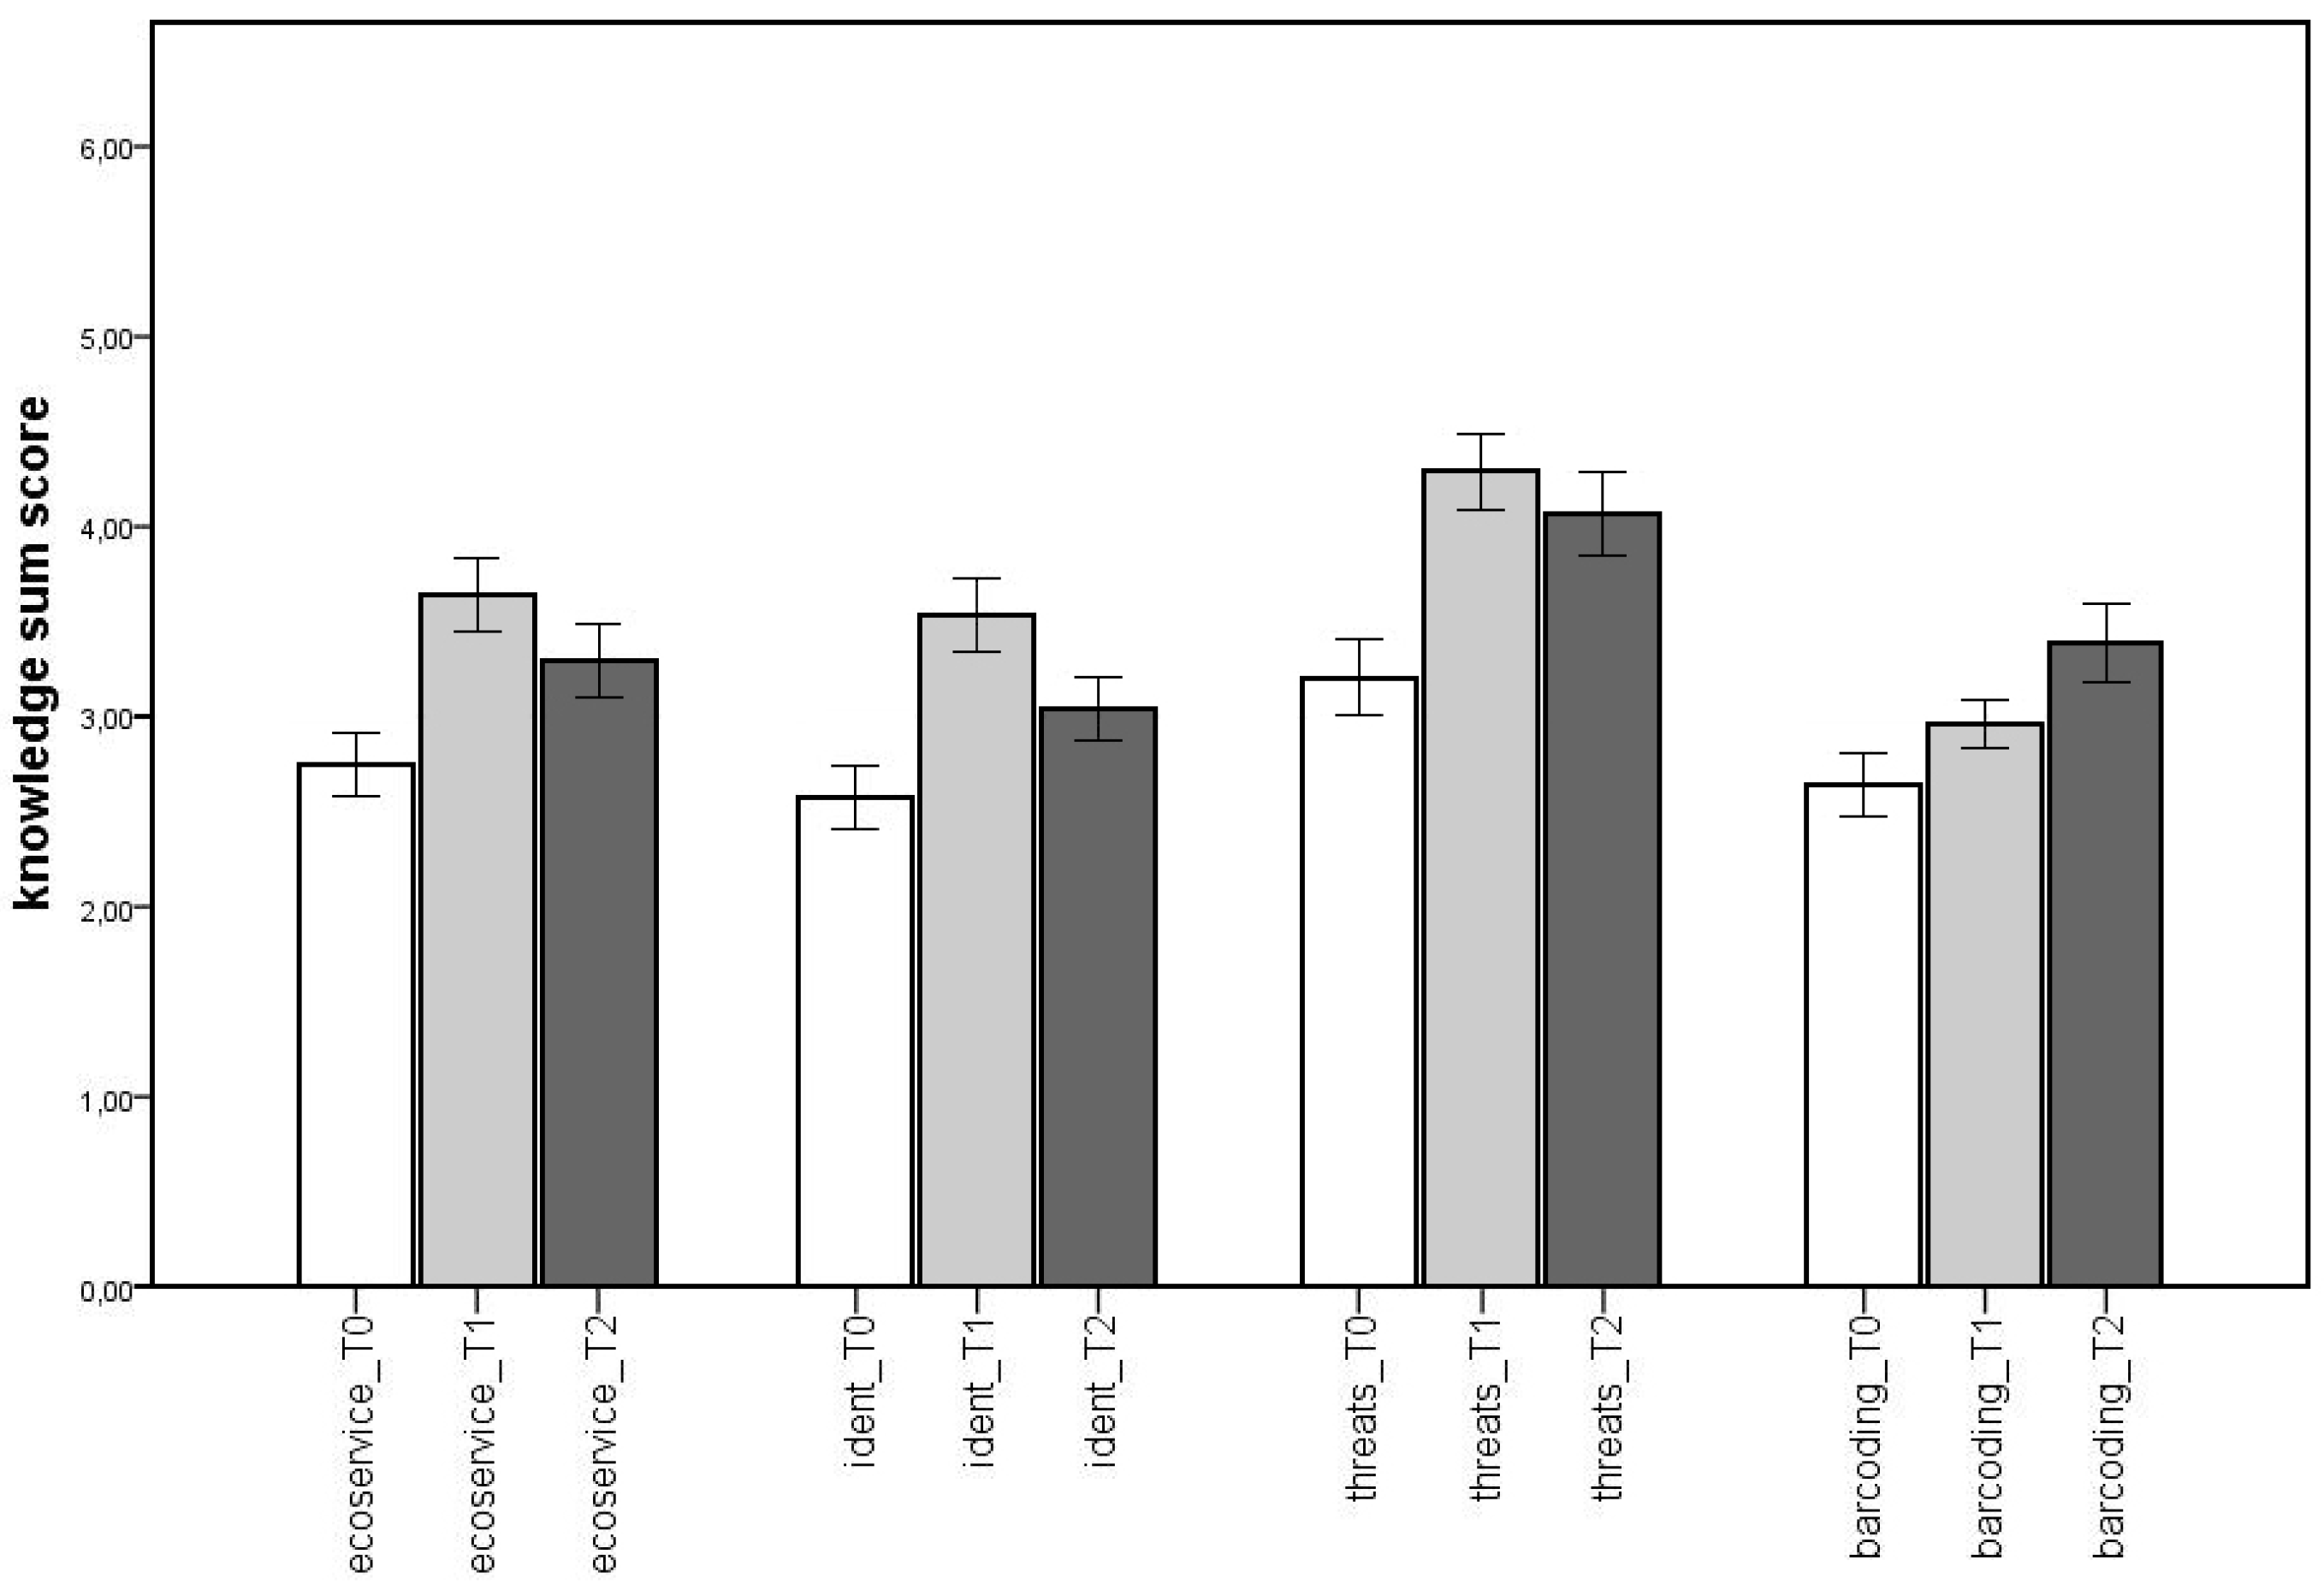
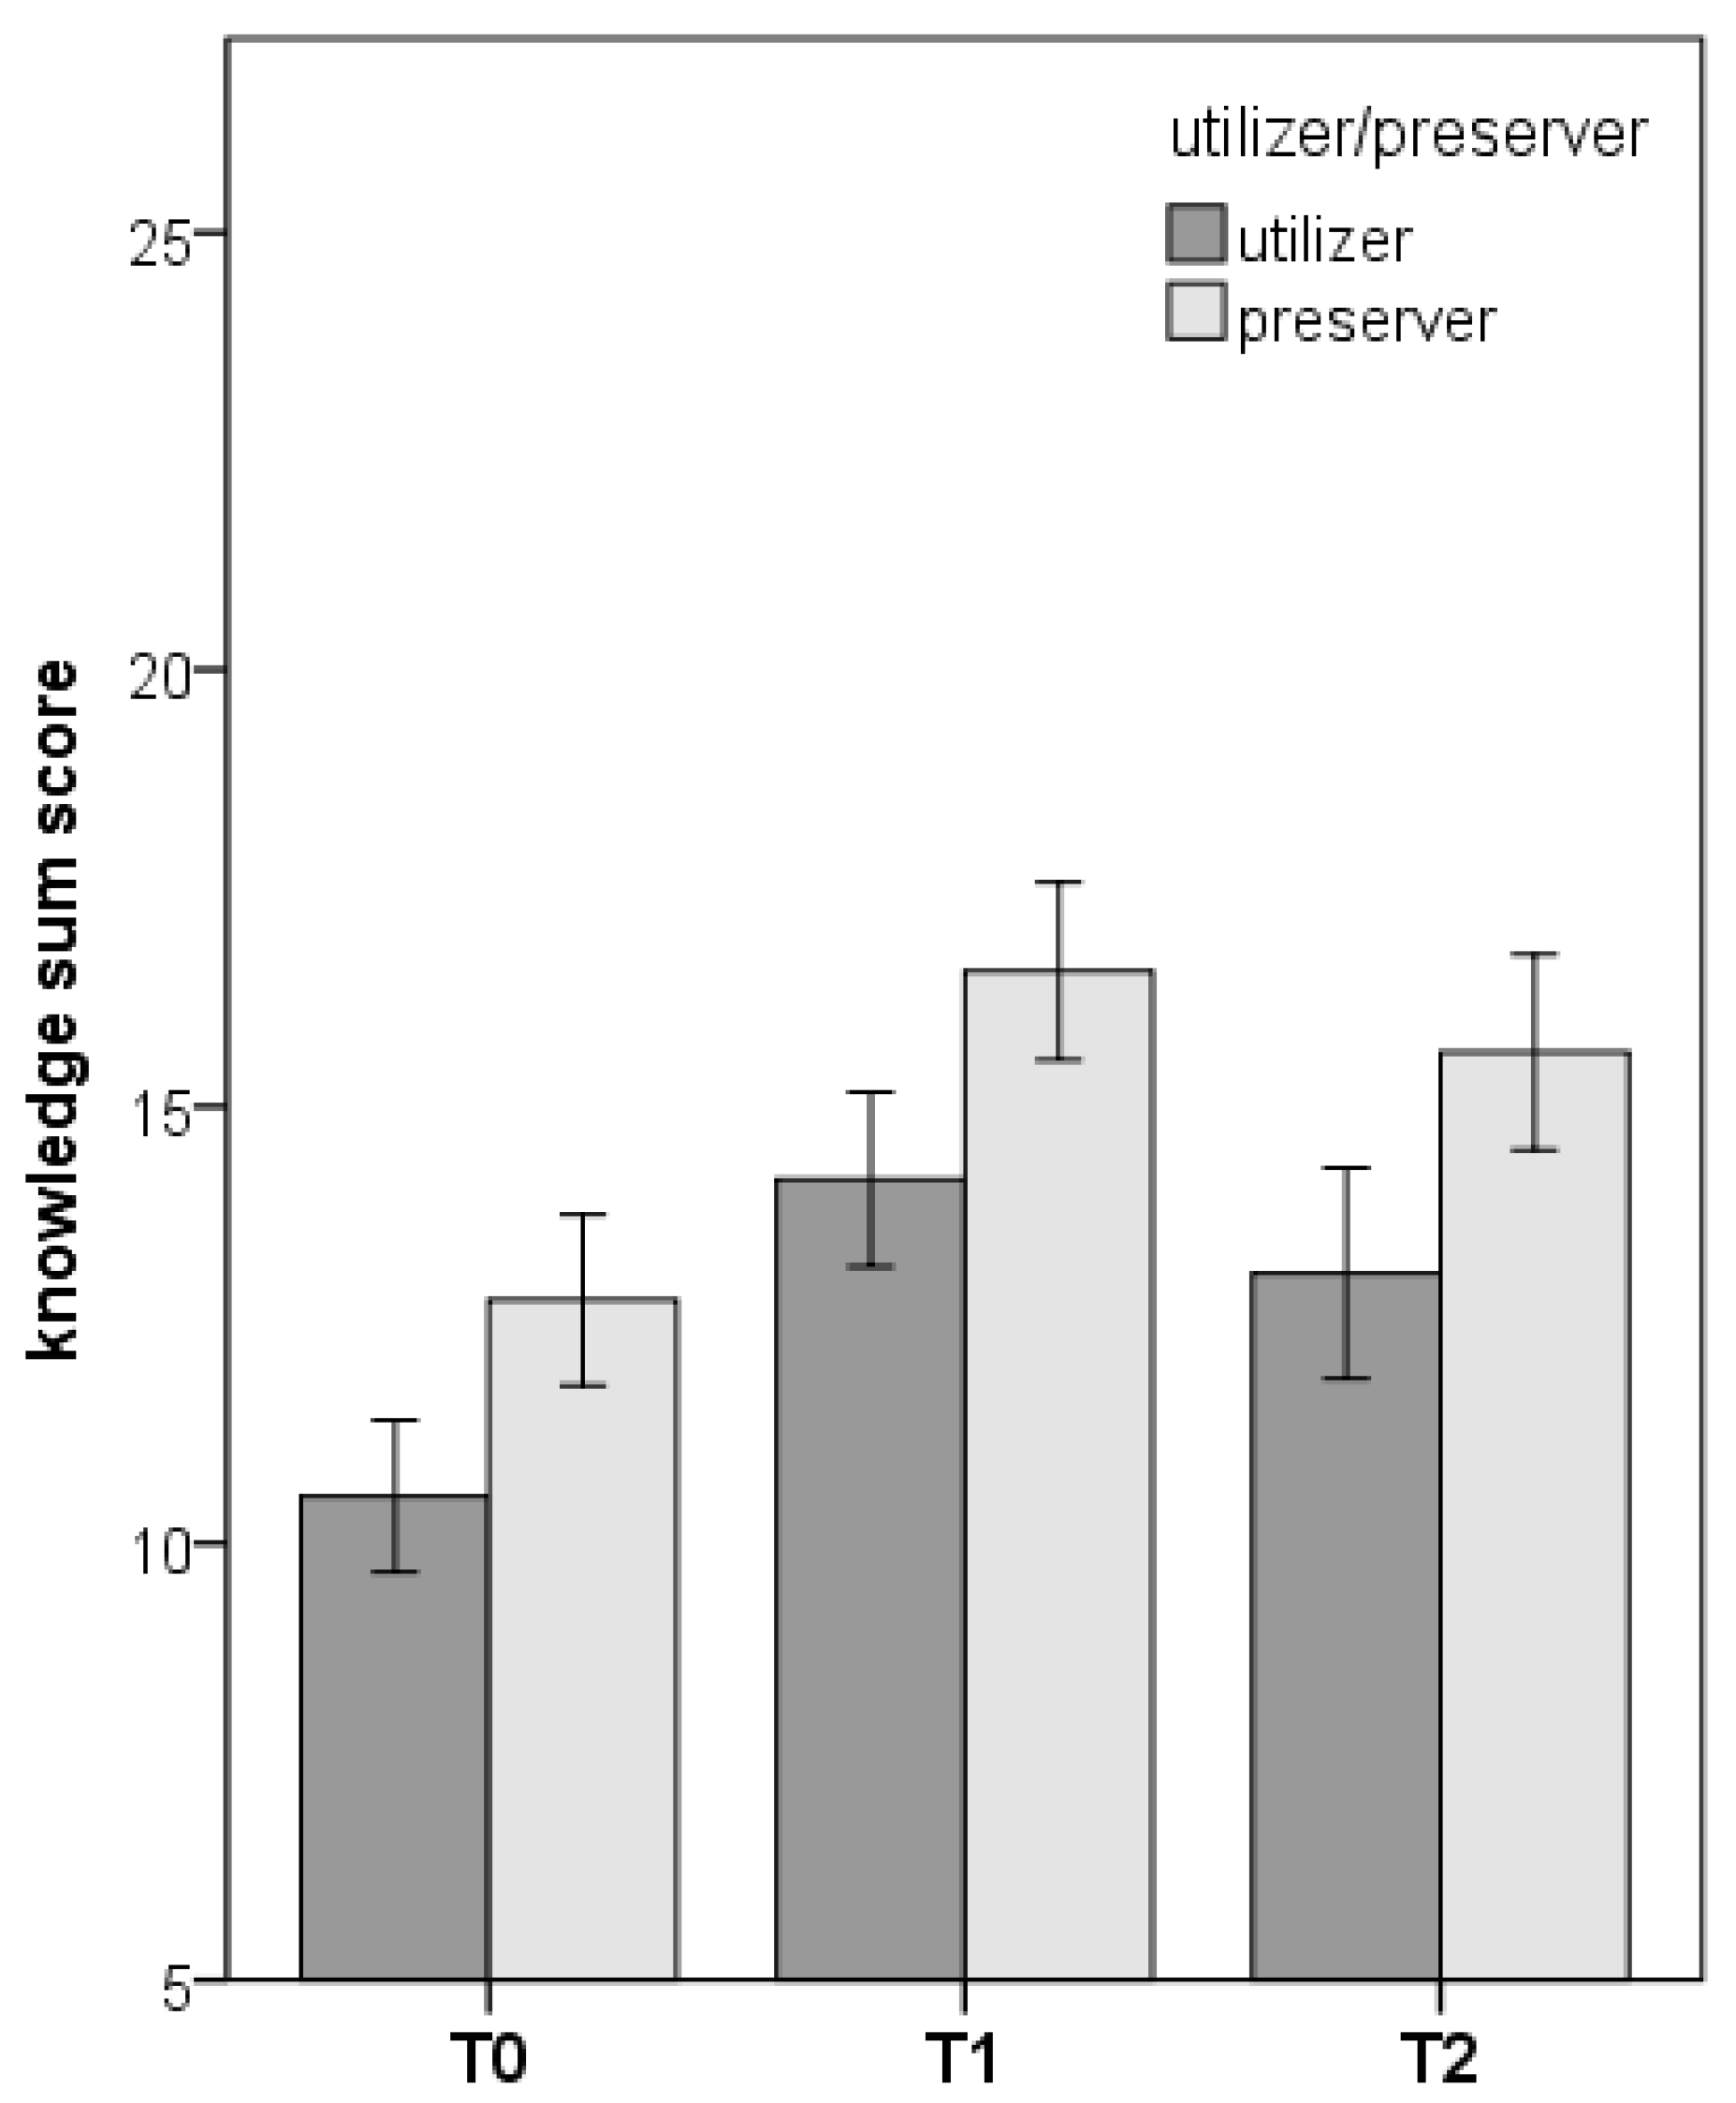
4.1. Cognitive Achievement within the Learning Module (RQ1)

First, we examined the knowledge score change for the entire knowledge test (Figure 2). The repeated-measures ANOVA with a Huynh-Feldt correction revealed a significant difference between the three test times, F (1.91,388.63) = 108.20, p < 0.001, partial η2 = 0.35. On average, students answered 11.48 (SD = 3.45) questions correctly in the pre-test, 15.21 (SD = 3.66) in the post-test and 14.13 (SD = 4.41) in the retention test. The maximum score achieved was 21 at T0, 22 at T1 and 23 at T2. A Bonferroni-adjusted post-hoc analysis revealed a significant increase of the mean knowledge scores from T0 to T1 (MD = 3.72, p < 0.001) and a decrease from T1 to T2 (MD = −1.04, p = 0.001). Knowledge scores at T2 remained higher than pre-knowledge scores (MD = 2.69, p < 0.001). An analysis of the test-retest group mean knowledge scores for all test times revealed no significant results, F(2,6) = 3.65, p = 0.09. Thus, we assume that the learning effects caused by the repeated application of the knowledge questionnaire can be precluded. Additionally, unpaired t-tests with a Bonferroni correction revealed no statistically significant difference between the treatment group and the test-retest group at T0, t (238) = 0.55, p = 0.585. At T1 and T2 there was a significant difference between the groups, T1: t (40.86) = 5.51, p < 0.001; T2: t (238) = 3.36, p = 0.003.
Second, we analyzed the knowledge change for all sub-modules separately (Figure 3). Repeated measure ANOVAs for all knowledge fields revealed significant knowledge sum score differences between the measurements (ecosystem services: F (2,408) = 42.51, p < 0.001, partial η2 = 0.17; DNA barcoding: F (1.95, 397.63) = 25.05, p < 0.001, partial η2 = 0.09; species identification: F (2,406) = 44.68, p < 0.001, partial η2 = 0.18; biodiversity threats: F (2,408) = 53.15, p < 0.001, partial η2 = 0.21). We observed a knowledge decrease between T0 and T1 for all knowledge fields and a moderate knowledge decrease between T1 and T2 for the knowledge fields “ecosystem services” and “species identification” (Table 2). The decrease within the field “biodiversity threats” was not significant. Moreover, we found a further knowledge increase from T1 to T2 within the knowledge field “DNA barcoding”. We investigated this effect for the test-retest group, who did not participate in the intervention. The repeated measure ANOVA determined no significant differences between the measurements, F (2,68) = 1.81, p = 0.172.

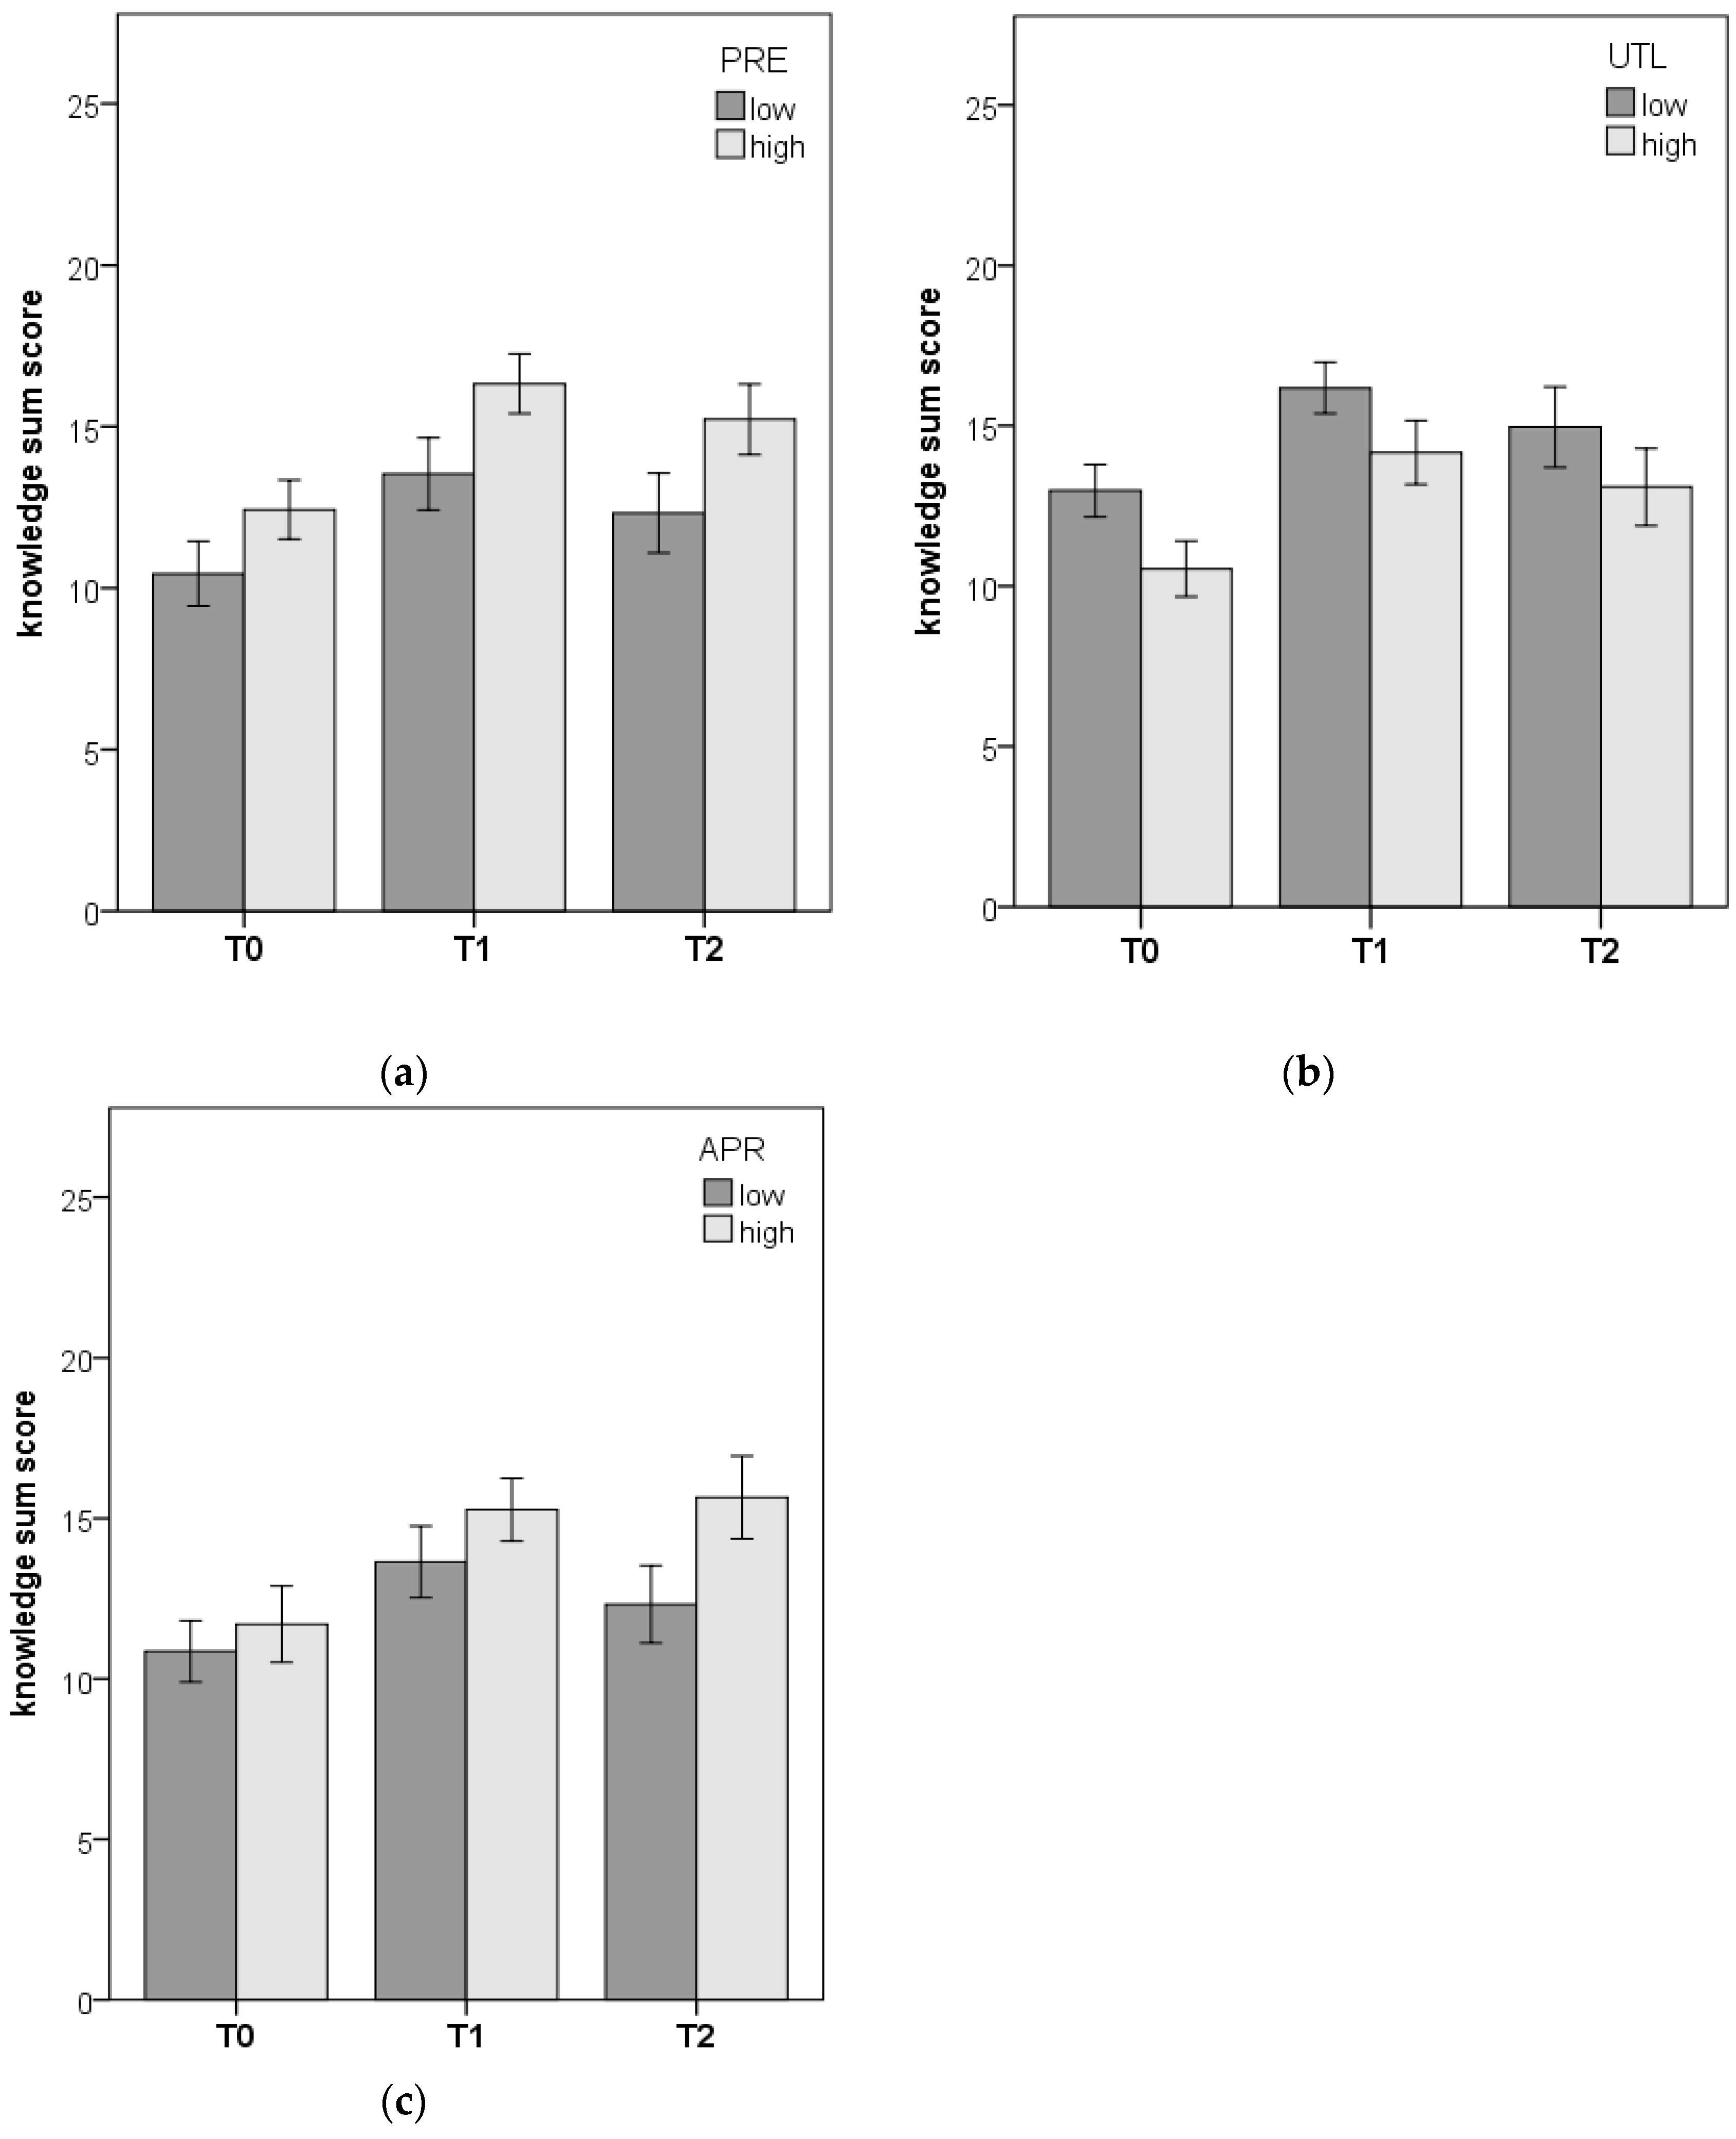
4.2. Relation between Knowledge and Environmental Values (RQ2)

The initial step in evaluating the relationship between the participants’ knowledge acquisition and the environmental values was a correlation analysis. With the Bonferroni correction applied, preservation correlated positively with the knowledge scores of all test times, whereas utilization showed negative correlations with knowledge. The appreciation scores were positively correlated with the knowledge scores of the retention test (Table 3).
In a second step, we compared the cognitive achievement of students with low or high environmental values (Figure 4a–c). At T0 and T1, students with high utilization preferences (n = 67) showed significantly lower knowledge scores than students with low utilization values (n = 45); T0: MD = 2.44, 95%-CI [1.20, 3.68], t (110) = 3.90, p < 0.001; T1: MD = 2.01, 95%-CI [0.75,3.30], t (109.92) = 3.15, p = 0.006; T2: t (110) = 2.10, p = 0.12. At all test times, students scoring high on preservation (n = 49) showed significantly higher knowledge scores than students with low preservation preferences (n = 56); T0: MD = 1.98, 95%-CI [0.63,3.34], t (103) = 2.90, p = 0.015, T1: MD = 2.79, 95%-CI [1.33,4.30], t (103) = 3.80, p < 0.001; t (102.70) = 3.53, p = 0.003, T2: MD = 2.90, 95%-CI [1.27,4.54], t (102.70) = 3.53, p = 0.003. Only at T2, participants with high (n = 44) appreciation preferences scored significantly higher than students from the lower quartile group (n = 56); T0: t (98) = 1.13, p = 0.786; T1: t (98) = 1.13, p = 0.786; T2: MD = 3.34, 95%-CI [1.58,5.10], t (89) = 3.80, p < 0.001.
In a final step, we compared the upper quartile groups of the variables utilization and preservation, which we refer to as “utilizers” and “preservers” (Figure 5). With the Bonferroni correction applied, “Preservers” showed significantly higher knowledge scores at T0 (MD = 2.21, t (100) = 3.19, p = 0.006), T1 (MD = 2.48, t (100) = 3.19, p = 0.006) and T2 (MD = 2.50, t (99,94) = 2.93, p = 0.012).

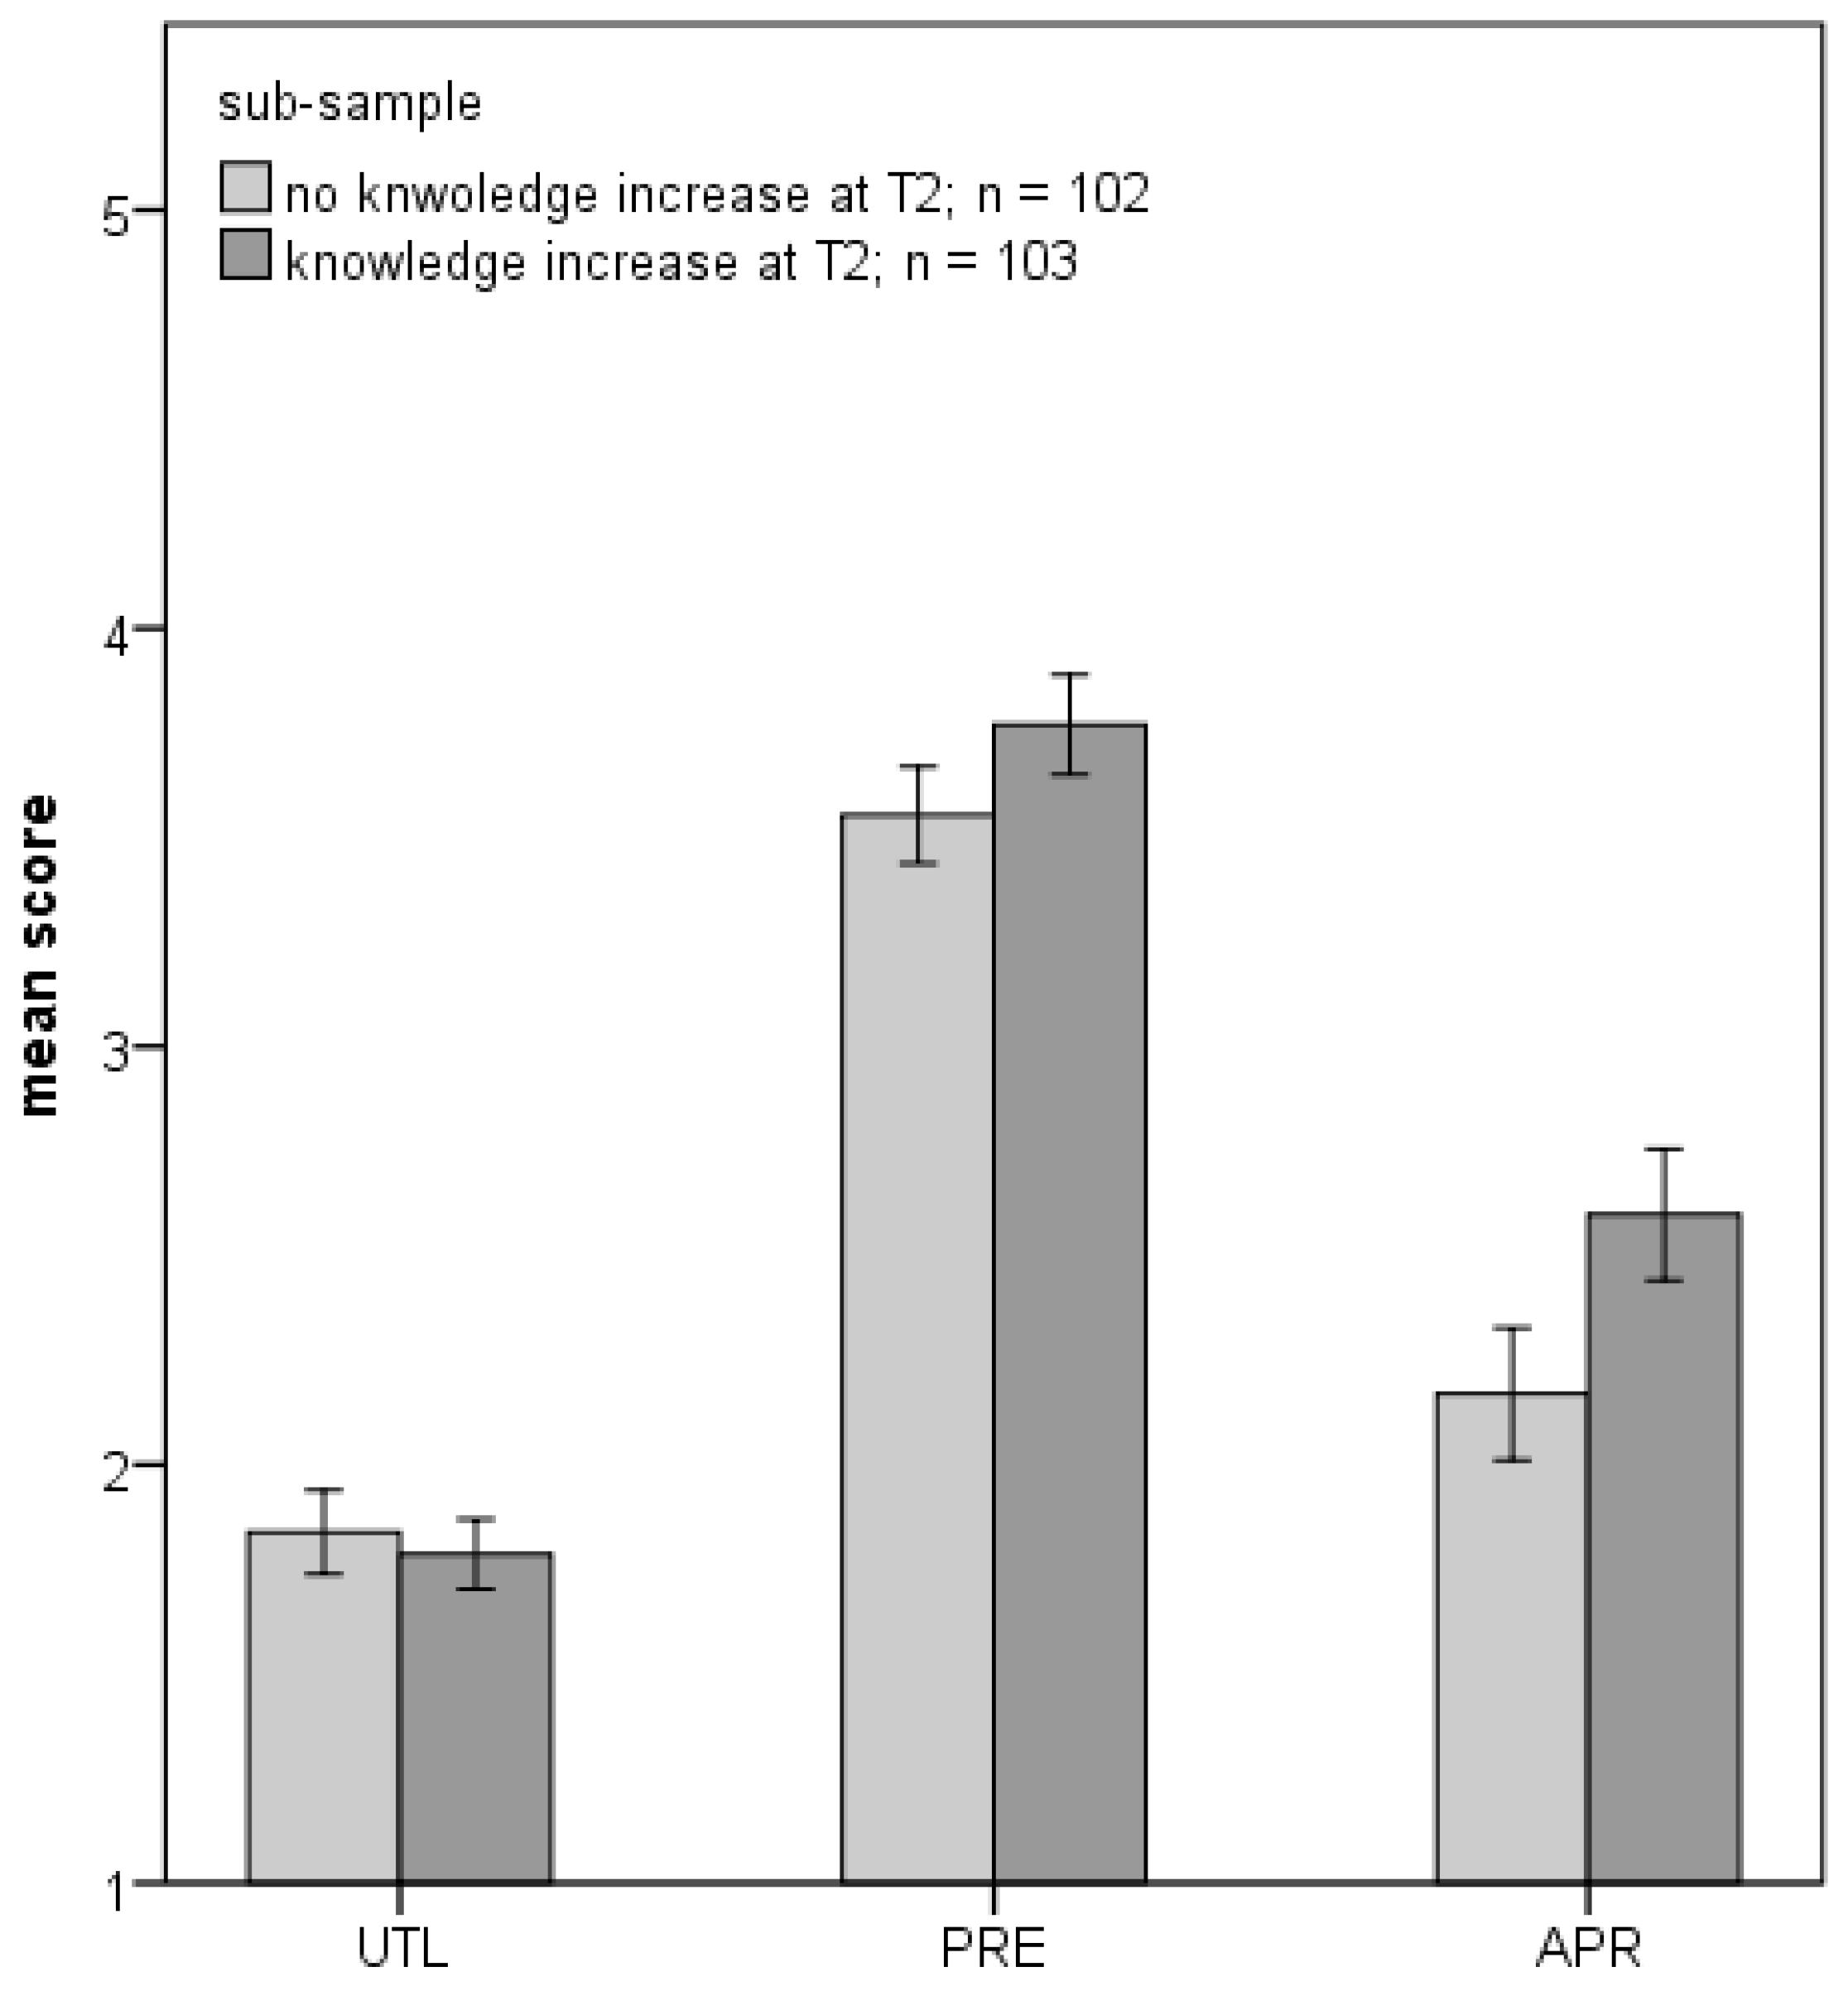
4.3. Characteristics and Results of the Sub-Sample with Knowledge Increase at T2

As stated above, when analyzing the knowledge scores for all sub-modules separately, we found a significant knowledge increase from T1 (post-test) to T2 (retention test) within the sub-module DNA barcoding. Further analysis of this unexpected result revealed that a sub-group of n = 103 students showed higher knowledge scores at T2 compared to T1. This sub-sample is almost equally composed of girls and boys (49.5% female). For reasons of simplicity, we will refer to this sub-group as “students with knowledge increase at T2”, although this knowledge increase only applies to the sub-module DNA barcoding. To examine a potential relation between membership in one of the 12 school classes involved and belonging to the sub-samples of students with knowledge increase at T2, a contingency analysis showed no significant relation between the nominal variables “school class” and “sub-sample”, Ccorr = 0.199, p = 0.895.
To further characterize the sub-sample, we compared the 2-MEV and APR mean scores between the two sub-samples: the student group who increased their knowledge on DNA Barcoding at T2 (n = 103) and the students who did not show this effect (n = 102). Students with a knowledge increase at T2, APR with a medium size effect, APR: 95%-CI [0.14,0.58], t (185) = 3.20, p = 0.006, d = 0.47. With the Bonferroni correction applied, we found no significant differences between the sub-samples for the environmental values PRE and UTL, PRE: 95%-CI [0.01,0.32], t (193) = 2.09, p = 0.114, UTL: 95%-CI [−0.16,0.09], t (195) = 0.58, p = 1 (Figure 6).

5. Discussion

Our educational approach significantly improved students’ environmental knowledge on biodiversity. Regarding biodiversity loss, our results are promising: even short-term education modules may effectively increase short-term as well as long-term knowledge on biodiversity and sensitize students to biodiversity conservation. As expected, knowledge scores dropped moderately after six weeks but remained well above the pre-knowledge level. This pattern is consistent with earlier studies assessing environmental knowledge acquisition using different instructional approaches and within various learning environments. For instance, Schumm and Bogner [65] evaluated a three-lesson classroom module, which engaged students in eight learning stations on the topic of renewable energies. Following a similar testing schedule with three test times, they found a short-term knowledge gain directly after module participation and a moderate knowledge drop after six weeks. Similar results were reported by Schönfelder and Bogner [66], who compared the effects of a computer-mediated and an outreach learning approach on environmental knowledge acquisition concerning bees. Fančovičová and Prokop [67] reported persistent knowledge gain on plants even three months after participation in an outdoor intervention. Furthermore, knowledge levels measured six weeks after participation in student-centered educational programs may be interpreted as long-term knowledge because they have shown to be persistent. Schmid and Bogner [68], for instance, observed students’ cognitive performance in a short-term educational intervention on the topic “the sense of hearing” at four test times: two weeks before, directly after, six weeks after, twelve weeks after participation. The knowledge levels followed the above-mentioned pattern constant at the six-week level. Additionally, Marth and Bogner [69] evaluated cognitive achievement within an educational module on bionics using the same time frame but adding another test time after one year. Even after one year, the knowledge scores remained at the six-week level.
Furthermore, our findings confirm previous studies showing an association between environmental values and knowledge acquisition. Consistent with Dieser and Bogner [70], we found a positive linear relation between overall knowledge scores and PRE as well as APR and negative correlations with UTL at all test times. The negative correlation between UTL and knowledge suggests that higher utilization scores lead to a lower cognitive achievement. This assumption has already been made by Liefländer and Bogner [71]. They assume a measurement bias, for example a ceiling effect, to be responsible for the missing linear relation between knowledge acquisition and PRE. Roczen et al. [46] already postulated positive relations between appreciation towards nature and environmental knowledge in a pro-environmental competence model.
Additionally, the comparison between the knowledge levels of the extreme groups (upper and lower quartile students of the environmental value variables) further support our assumptions. Students with high utilization preferences showed lower pre- and post-knowledge levels than participants with low utilization values. The effect was not significant in the retention test. In the long term, students holding high utilization scores were able to catch up on the advantage of the lower quartile students. In comparison, high preservation preferences determined higher knowledge scores at all test times. Students already holding higher pre-knowledge scores maintained their lead over students with low preservation scores throughout the intervention. An effect of high appreciation scores only became significant in the retention test. Students with lower appreciation scores retained significantly less knowledge than the participants holding higher appreciation values. The comparison between the two extreme groups “preservers” and “utilizers” also revealed lower learning outcomes for students with high utilization preferences. “Preservers” did already show higher pre-knowledge scores, and the differences in cognitive achievement increased throughout the test times. We cannot draw causal relationships from our analysis, but the results indicate that students with high PRE and APR preferences may perform better on environmental learning topics than students with high utilization preferences. This assumed performance gap will especially become observable in the long-term view. Nevertheless, all participating students have shown knowledge gain through the participation in our learning module, and the effect of utilization preferences on cognitive achievement decreased slightly from T0 to T2. We assume that the focus on both the preservation and the sustainable use of the forest ecosystem was appealing to students with preservation as well as utilization preferences. We can only assume from the decreasing effect of utilization on the post-and retention-knowledge and the effect of appreciation on the knowledge retention, that our learning module fostered an appreciative use of the ecosystem services provided by forests. However, it is a limitation of our study that we did not measure the environmental values throughout all test times.
One unanticipated and somewhat surprising result was that a sub-sample of n = 103 out of N = 205 students increased their knowledge scores on DNA barcoding from T1 (post-test) to T2 (retention test). As stated above, knowledge scores in intervention studies with a pre-post-retention design usually follow a pattern characterized by an increase in knowledge scores at T1 which drops moderately at T2. In a study by Sturm and Bogner [72] comparing student-centered with teacher-centered learning approaches, two of three treatment groups showed no statistical knowledge decrease at T2. The scores remained at the T1 level. Scharfenberg et al. [73] reported a knowledge increase within a control group which did not participate in an intervention and discussed potential reasons for this finding. Based on the assumptions by Scharfenberg et al., we can rule out some potential explanations of our findings and possible bias of the data.
First, we suspected a bias caused by the questionnaire. We found no significant knowledge score increase between the test times in the test-retest group. They completed all the three questionnaires within the same time frame as the study group but did not participate in the module. We can, therefore, exclude, that knowledge increase at T2 was caused by learning effects due to repeated confrontation with the questionnaire.
Second, an external influence caused by media reports may have led to the observed effect. In their study on students’ attitudes towards gene technology, Schweiger and Brosius [74] assumed media coverage on cloning trials to have affected control group results. To our knowledge, there was no specific incident that was related to the topic and that was reported by the media when the study took place. There were two months between the retention test of the first and that of the last participating school class. An event influencing students within all classes should have been explosive news of high media coverage over a long period of time. We also think that such an event would have affected more than half of the participating students as well as the test-retest group. Even if it seems very unlikely, we cannot completely rule out this potential influence, and a statistical verification is not feasible.
A third plausible explanation for the improved cognitive achievement at T2 would be that teachers consciously or unconsciously biased the results. Though they were asked not to further deal with the topic until the completion of the study, it seems quite likely that the teachers prepared the content of the questions with their individual classes for the upcoming retention test or for an internal exam. Teachers might have done follow-up work after the intervention, either to close the topic or to improve their students’ performance in the study. A contingency analysis revealed no significant association between the sub-groups and the membership in a school class. Students who increased their knowledge on DNA barcoding from T1 to T2 are spread among the twelve participating school classes. We think it is not very likely that all teachers prepared their classes and that only some students in every class profited from the preparation. In addition, if teachers had done a follow-up of the intervention, they would have covered all sub-modules. We could only find the learning effect at T2 for the contents of the DNA barcoding sub-module. In summary, we can quite certainly exclude a learning effect biased by the teachers.
Taking the above-mentioned possibilities into account, we assume that the knowledge increase of one sub-group of our sample can be quite likely attributed to the students themselves. It seems possible that the respective students dealt voluntarily with the contents after project participation. Since performance improved on the topic of DNA barcoding only, it might be related to the citizen science activity. The activity may have influenced students’ interest and curiosity for the topic. DNA barcoding is not a curricular topic, and the participating students most probably never heard of it before participating in the intervention. An aspect that might have influenced students’ curiosity could be that they were still awaiting the DNA barcoding results of their samples when they completed the retention test. Hiller and Kitsantas [42] have already reported positive impacts of a one-day CS activity on students’ interest. The effects of CS projects on students’ interest development might be a promising aspect to be considered by further research in the field of CS in formal educational contexts.
Surprisingly, the sub-group with a knowledge increase at T2 differs from the rest of the sample in showing higher APR values. The effect for PRE was not considered significant due to the Bonferroni correction, but a tendency towards higher PRE scores was observable. As Schumm and Bogner [75] assumed, students with positive, biocentric attitudes towards the environment might be more willing and motivated to learn when lessons deal with environmental topics. The focus on biodiversity conservation and the citizen science activity might have been more appealing to those students already holding higher pro-environmental values, leading to an interest and higher engagement in learning even beyond the participation in our module.

6. Conclusions

As the general public still tends to show a rather low awareness for biodiversity, educational efforts to foster responsible citizenship and to engage more people in biodiversity conservation are needed. With our innovative short-term intervention, including a citizen science approach in an educational module, we could successfully achieve long-term knowledge gain on the topic of biodiversity conservation. Our study once again highlights the importance of considering the impact of environmental values on students’ cognitive achievement in EE and ESD approaches. Due to our study design, we cannot draw conclusions on the potential effect of the citizen science activity as such, since overall learning effects are presumably caused by the educational materials provided. However, our findings indicate that students with higher pro-environmental values benefit more from educational citizen science activities. Future studies need to investigate the potential benefits of citizen science in formal educational contexts in terms of knowledge acquisition and attitudinal change.

Author Contributions

Conceptualization, J.S.-O.; data curation, J.S.-O.; formal analysis, J.S.-O.; funding acquisition, F.X.B.; investigation, J.S.-O.; methodology, J.S.-O. and F.X.B.; project administration, F.X.B.; resources, F.X.B.; software, F.X.B.; supervision, F.X.B.; visualization, J.S.-O.; writing—original draft, J.S.-O.; writing—review and editing, F.X.B. All authors have read and agreed to the published version of the manuscript.

Funding

This research was funded by the ‘Qualitätsoffensive Lehrerbildung’ program of the German Federal Ministry of Education and Research (BMBF) under grant agreement no. 01JA160. The APC was funded by the German Research Foundation (DFG) and the University of Bayreuth in the funding program Open Access Publishing under grant agreement no. LA 2159/8-6. The funders had no role in the design of the study, in the collection, analyses, or interpretation of data, in the writing of the manuscript, or in the decision to publish the results. This article reflects only the authors’ views. The BMBF and the DFG are not liable for any use that might be made of the information contained herein.

Acknowledgments

The authors would like to thank all participating students and their teachers for their time and effort. We are grateful to G. Haszprunar, J. Spelda, J. Morinière and A. Hausmann at the Bavarian State Collection of Zoology (ZSM) for their collaboration within the citizen science project.

Conflicts of Interest

The authors declare no conflict of interest.

References

  1. Johnson, C.N.; Balmford, A.; Brook, B.W.; Buettel, J.C.; Galetti, M.; Guangchun, L.; Wilmshurst, J.M. Biodiversity losses and conservation responses in the Anthropocene. Science 2017, 356, 270–275. [Google Scholar] [CrossRef] [PubMed]
  2. Intergovernmental Science-Policy Platform on Biodiversity and Ecosystem Services, IPBES. Summary for Policymakers of the Global Assessment Report on Biodiversity and Ecosystem Services. 2019. Available online: https://zenodo.org/record/3553579/files/ipbes_global_assessment_report_summary_for_policymakers.pdf (accessed on 10 January 2020).
  3. Waters, C.N.; Zalasiewicz, J.; Summerhayes, C.; Barnosky, A.D.; Poirier, C.; Gałuszka, A.; Cearreta, A.; Edgeworth, M.; Ellis, E.C.; Ellis, M.; et al. The Anthropocene is functionally and stratigraphically distinct from the Holocene. Science 2016, 351, aad2622. [Google Scholar] [CrossRef] [PubMed]
  4. Samways, M.J. Translocating fauna to foreign lands: Here comes the Homogenocene. J. Insect Conserv. 1999, 3, 65–66. [Google Scholar]
  5. Lin, D.; Hanscom, L.; Murthy, A.; Galli, A.; Evans, M.; Neill, E.; Mancini, M.; Martindill, J.; Medouar, F.-Z.; Huang, S.; et al. Ecological Footprint Accounting for Countries: Updates and Results of the National Footprint Accounts, 2012–2018. Resources 2018, 7, 58. [Google Scholar] [CrossRef] [Green Version]
  6. Venter, O.; Sanderson, E.W.; Magrach, A.; Allan, J.R.; Beher, J.; Jones, K.R.; Possingham, H.P.; Laurance, W.F.; Wood, P.; Fekete, B.M.; et al. Sixteen years of change in the global terrestrial human footprint and implications for biodiversity conservation. Nat. Commun. 2016, 7, 12558. [Google Scholar] [CrossRef] [Green Version]
  7. Global Footprint Network. Open Data Platform. Available online: http://data.footprintnetwork.org/?_ga=2.76595989.1047388169.1578911331-1274720262.1578759986#/ (accessed on 13 January 2020).
  8. Cardinale, B.J.; Duffy, J.E.; Gonzalez, A.; Hooper, D.U.; Perrings, C.; Venail, P.; Narwani, A.; MacE, G.M.; Tilman, D.; Wardle, D.A.; et al. Biodiversity loss and its impact on humanity. Nature 2012, 486, 59–67. [Google Scholar] [CrossRef]
  9. Ehrlich, P.R.; Pringle, R.M. Where does biodiversity go from here? A grim business-as-usual forecast and a hopeful portfolio of partial solutions. Proc. Natl. Acad. Sci. USA 2008, 105, 11579–11586. [Google Scholar] [CrossRef] [Green Version]
  10. Buijs, A.E.; Fischer, A.; Rink, D.; Young, J.C. Looking beyond superficial knowledge gaps: Understanding public representations of biodiversity. Int. J. Biodivers. Sci. Manag. 2008, 4, 65–80. [Google Scholar] [CrossRef]
  11. European Comission. Special Eurobarometer 436—Attitudes of Europeans towards Biodiversity; European Comission: Brussels, Belgium, 2015. [Google Scholar]
  12. Hunter, L.M.; Brehm, J. Qualitative Insight into Public Knowledge of, and Concern with, Biodiversity. Hum. Ecol. 2003, 31, 309–320. [Google Scholar] [CrossRef]
  13. Lindemann-Matthies, P.; Bose, E. How Many Species Are There? Public Understanding and Awareness of Biodiversity in Switzerland. Hum. Ecol. 2008, 36, 731–742. [Google Scholar] [CrossRef] [Green Version]
  14. Schneiderhan-Opel, J.; Bogner, F.X. Between Environmental Utilization and Protection: Adolescent Conceptions of Biodiversity. Sustainability 2019, 11, 4517. [Google Scholar] [CrossRef] [Green Version]
  15. Gayford, C. Biodiversity Education: A teacher’s perspective. Environ. Educ. Res. 2000, 6, 347–361. [Google Scholar] [CrossRef]
  16. Bermudez, G.M.A.; Lindemann-Matthies, P. “What Matters Is Species Richness”—High School Students’ Understanding of the Components of Biodiversity. Available online: https://link.springer.com/article/10.1007/s11165-018-9767-y (accessed on 10 January 2020).
  17. Kassas, M. Environmental Education: Biodiversity. Environmentalist 2002, 22, 345–351. [Google Scholar] [CrossRef]
  18. Secretariat of the Convention on Biological Diversity. The Convention on Biological Diversity from Conception to Implementation. CBD News Special Edition; Secretariat of the Convention on Biological Diversity: Montreal, QC, Canada, 2004. [Google Scholar]
  19. van Weelie, D.; Wals, A. Making biodiversity meaningful through environmental education. Int. J. Sci. Educ. 2002, 24, 1143–1156. [Google Scholar] [CrossRef]
  20. Menzel, S.; Bögeholz, S. The Loss of Biodiversity as a Challenge for Sustainable Development: How Do Pupils in Chile and Germany Perceive Resource Dilemmas? Res. Sci. Educ. 2008, 39, 429–447. [Google Scholar] [CrossRef] [Green Version]
  21. Ratcliffe, M.; Grace, M. Science Education for Citizenship: Teaching Socio-Scientific Issues; Open University Press: Maidenhead, UK, 2003. [Google Scholar]
  22. Grace, M. Teaching citizenship through science: Socio-scientific issues as an important component of citizenship. Prospero 2006, 12, 42–53. [Google Scholar]
  23. Filho, W.L.; Castro, P.; Bacelar-Nicolau, P.; Azul, A.M.; Azeiteiro, U.M. Biodiversity and Education for Sustainable Development (ESD): Tendencies and Perspectives. In Biodiversity and Education for Sustainable Development; Castro, P., Azeiteiro, U.M., Bacelar-Nicolau, P., Leal Filho, W., Azul, A.M., Eds.; Springer: New York, NY, USA, 2016; pp. 1–10. ISBN 978-3-319-32317-6. [Google Scholar]
  24. Navarro-Perez, M.; Tidball, K.G. Challenges of Biodiversity Education: A Review of Education Strategies for Biodiversity Education. Int. Electron. J. Environ. Educ. 2012, 2, 13–30. [Google Scholar]
  25. Schneiderhan-Opel, J.; Bogner, F.X. FutureForest—Promoting Biodiversity Literacy by Implementing Citizen Science in the Classroom. Am. Biol. Teach. 2020, 82. in press. [Google Scholar]
  26. Dickinson, J.L.; Shirk, J.; Bonter, D.; Bonney, R.; Crain, R.L.; Martin, J.; Phillips, T.; Purcell, K. The current state of citizen science as a tool for ecological research and public engagement in a nutshell. Front. Ecol. 2012. [Google Scholar] [CrossRef] [Green Version]
  27. Follett, R.; Strezov, V. An Analysis of Citizen Science Based Research: Usage and Publication Patterns. PLoS ONE 2015, 10, e0143687. [Google Scholar] [CrossRef] [Green Version]
  28. McKinley, D.C.; Miller-Rushing, A.J.; Ballard, H.L.; Bonney, R.; Brown, H.; Cook-Patton, S.C.; Evans, D.M.; French, R.A.; Parrish, J.K.; Phillips, T.B.; et al. Citizen science can improve conservation science, natural resource management, and environmental protection. Biol. Conserv. 2017, 208, 15–28. [Google Scholar] [CrossRef] [Green Version]
  29. Shirk, J.L.; Ballard, H.L.; Wilderman, C.C.; Phillips, T.; Wiggins, A.; Jordan, R.; McCallie, E.; Minarchek, M.; Lewenstein, B.V.; Krasny, M.E.; et al. Public Participation in Scientific Research. Ecol. Soc. 2012, 17, 20. [Google Scholar] [CrossRef] [Green Version]
  30. Wiggins, A.; Crowston, K. From Conservation to Crowdsourcing: A Typology of Citizen Science. IEEE 2011, 1–10. [Google Scholar] [CrossRef] [Green Version]
  31. Kullenberg, C.; Kasperowski, D. What Is Citizen Science?—A Scientometric Meta-Analysis. PLoS ONE 2016, 11, e0147152. [Google Scholar] [CrossRef] [PubMed] [Green Version]
  32. Pocock, M.J.O.; Chandler, M.; Bonney, R.; Thornhill, I.; Albin, A.; August, T.; Bachman, S.; Brown, P.M.J.; Cunha, D.G.F.; Grez, A.; et al. Chapter Six—A Vision for Global Biodiversity Monitoring With Citizen Science. In Next Generation Biomonitoring: Part 2; Bohan, D., Dumbrell, A., Woodward, G., Jackson, M., Eds.; Academic Press: Cambridge, MA, USA, 2018; pp. 169–223. ISBN 0065-2504. [Google Scholar]
  33. Chandler, M.; See, L.; Copas, K.; Bonde, A.M.Z.; López, B.C.; Danielsen, F.; Legind, J.K.; Masinde, S.; Miller-Rushing, A.J.; Newman, G.; et al. Contribution of citizen science towards international biodiversity monitoring. Biol. Conserv. 2017, 213, 280–294. [Google Scholar] [CrossRef] [Green Version]
  34. Amano, T.; Lamming, J.D.L.; Sutherland, W.J. Spatial Gaps in Global Biodiversity Information and the Role of Citizen Science. BioScience 2016, 66, 393–400. [Google Scholar] [CrossRef] [Green Version]
  35. Theobald, E.J.; Ettinger, A.K.; Burgess, H.K.; DeBey, L.B.; Schmidt, N.R.; Froehlich, H.E.; Wagner, C.; HilleRisLambers, J.; Tewksbury, J.; Harsch, M.A.; et al. Global change and local solutions: Tapping the unrealized potential of citizen science for biodiversity research. Biol. Conserv. 2015, 181, 236–244. [Google Scholar] [CrossRef] [Green Version]
  36. Bonney, R.; Cooper, C.B.; Dickinson, J.; Kelling, S.; Phillips, T.; Rosenberg, K.V.; Shirk, J. Citizen Science: A Developing Tool for Expanding Science Knowledge and Scientific Literacy. BioScience 2017, 59, 977–984. [Google Scholar] [CrossRef]
  37. Wals, A.E.J.; Brody, M.; Dillon, J.; Stevenson, R.B. Convergence between Science and Environmental Education. Science 2014, 344, 583–584. [Google Scholar] [CrossRef]
  38. Peter, M.; Diekötter, T.; Kremer, K. Participant Outcomes of Biodiversity Citizen Science Projects: A Systematic Literature Review. Sustainability 2019, 11, 2780. [Google Scholar] [CrossRef] [Green Version]
  39. Jordan, R.C.; Gray, S.A.; Howe, D.V.; Brooks, W.R.; Ehrenfeld, J.G. Knowledge gain and behavioral change in citizen-science programs. Conserv. Biol. 2011, 25, 1148–1154. [Google Scholar] [CrossRef] [PubMed]
  40. Kelemen-Finan, J.; Scheuch, M.; Winter, S. Contributions from citizen science to science education: An examination of a biodiversity citizen science project with schools in Central Europe. Int. J. Sci. Educ. 2018, 40, 2078–2098. [Google Scholar] [CrossRef]
  41. Shah, H.R.; Martinez, L.R. Current Approaches in Implementing Citizen Science in the Classroom. J. Microbiol. Biol. Educ. 2016, 17, 17–22. [Google Scholar] [CrossRef] [PubMed]
  42. Hiller, S.E.; Kitsantas, A. The Effect of a Horseshoe Crab Citizen Science Program on Middle School Student Science Performance and STEM Career Motivation. Sch. Sci. Math. 2014, 114, 302–311. [Google Scholar] [CrossRef]
  43. Kaiser, F.G.; Roczen, N.; Bogner, F.X. Competence formation in environmental education: Advancing ecology-specific rather than general abilities. Umweltpsychologie 2008, 12, 56–70. [Google Scholar]
  44. Bord, R.J.; O’Connor, R.E.; Fisher, A. In what sense does the public need to understand global climate change? Public Underst. Sci. 2000, 9, 205–218. [Google Scholar] [CrossRef]
  45. Hogan, K. Small groups’ ecological reasoning while making an environmental management decision. J. Res. Sci. Teach. 2002, 39, 341–368. [Google Scholar] [CrossRef]
  46. Roczen, N.; Kaiser, F.G.; Bogner, F.X.; Wilson, M. A Competence Model for Environmental Education. Environ. Behav. 2014, 46, 972–992. [Google Scholar] [CrossRef] [Green Version]
  47. Bogner, F.X.; Wiseman, M. Toward Measuring Adolescent Environmental Perception. Eur. Psychol. 1999, 4, 139–151. [Google Scholar] [CrossRef]
  48. Wiseman, M.; Bogner, F.X. A higher-order model of ecological values and its relationship to personality. Personal. Individ. Differ. 2003, 34, 783–794. [Google Scholar] [CrossRef]
  49. Borchers, C.; Boesch, C.; Riedel, J.; Guilahoux, H.; Ouattara, D.; Randler, C. Environmental Education in Côte d’Ivoire/West Africa: Extra-Curricular Primary School Teaching Shows Positive Impact on Environmental Knowledge and Attitudes. Int. J. Sci. Educ. Part B 2014, 4, 240–259. [Google Scholar] [CrossRef]
  50. Johnson, B.; Manoli, C.C. The 2-MEV scale in the United States: A measure of children’s environmental attitudes based on the theory of ecological attitude. J. Environ. Educ. 2010, 42, 84–97. [Google Scholar] [CrossRef]
  51. Milfont, T.L.; Duckitt, J. The structure of environmental attitudes: A first- and second-order confirmatory factor analysis. J. Environ. Psychol. 2004, 24, 289–303. [Google Scholar] [CrossRef]
  52. Bogner, F.X.; Wiseman, M. Environmental Perspectives of Danish and Bavarian Pupils: Towards a methodological framework. Scand. J. Educ. Res. 1997, 41, 53–71. [Google Scholar] [CrossRef]
  53. Bogner, F.X.; Wiseman, M. Environmental perception of French and some Western European secondary school students. Eur. J. Psychol. Educ. 2002, 17, 3–18. [Google Scholar] [CrossRef]
  54. Rokeach, M. Beliefs, attitudes and values; a theory of organization and change; Jossey-Bass: Francisco, CA, USA, 1968. [Google Scholar]
  55. Bogner, F.X. Environmental Values (2-MEV) and Appreciation of Nature. Sustainability 2018, 10, 350. [Google Scholar] [CrossRef] [Green Version]
  56. Kibbe, A.; Bogner, F.X.; Kaiser, F.G. Exploitative vs. appreciative use of nature—Two interpretations of utilization and their relevance for environmental education. Stud. Educ. Eval. 2014, 41, 106–112. [Google Scholar] [CrossRef]
  57. Brügger, A.; Kaiser, F.G.; Roczen, N. One for All? Eur. Psychol. 2011, 16, 324–333. [Google Scholar] [CrossRef]
  58. Boeve-de Pauw, J.; van Petegem, P. The Effect of Flemish Eco-Schools on Student Environmental Knowledge, Attitudes, and Affect. Int. J. Sci. Educ. 2011, 33, 1513–1538. [Google Scholar] [CrossRef]
  59. Fremerey, C.; Bogner, F.X. Cognitive learning in authentic environments in relation to green attitude preferences. Stud. Educ. Eval. 2015, 44, 9–15. [Google Scholar] [CrossRef]
  60. Thorn, C.; Bogner, F. How Environmental Values Predict Acquisition of Different Cognitive Knowledge Types with Regard to Forest Conservation. Sustainability 2018, 10, 2188. [Google Scholar] [CrossRef] [Green Version]
  61. Hebert, P.D.N.; Cywinska, A.; Ball, S.L.; DeWaard, J.R. Biological identifications through DNA barcodes. Proc. Biol. Sci. 2003, 270, 313–321. [Google Scholar] [CrossRef] [PubMed] [Green Version]
  62. Deci, E.L.; Vallerand, R.J.; Pelletier, L.G.; Ryan, R.M. Motivation and Education: The Self-Determination Perspective. Educ. Psychol. 1991, 26, 325–346. [Google Scholar] [CrossRef]
  63. Cook, T.D.; Campbell, D.T.; Shadish, W. Experimental and Quasi-Experimental Designs for Generalized Causal Inference; Houghton Mifflin: Boston, MA, USA, 2002; ISBN 0395615569. [Google Scholar]
  64. Field, A. Discovering Statistics Using SPSS, 3rd ed.; SAGE Publications, Inc.: London, UK, 2009; ISBN 9781847879066. [Google Scholar]
  65. Schumm, M.F.; Bogner, F.X. The impact of science motivation on cognitive achievement within a 3-lesson unit about renewable energies. Stud. Educ. Eval. 2016, 50, 14–21. [Google Scholar] [CrossRef]
  66. Schönfelder, M.L.; Bogner, F.X. Two ways of acquiring environmental knowledge: By encountering living animals at a beehive and by observing bees via digital tools. Int. J. Sci. Educ. 2017, 39, 723–741. [Google Scholar] [CrossRef]
  67. Fančovičová, J.; Prokop, P. Plants have a chance: Outdoor educational programmes alter students’ knowledge and attitudes towards plants. Environ. Educ. Res. 2011, 17, 537–551. [Google Scholar] [CrossRef]
  68. Schmid, S. Does Inquiry-Learning Support Long-Term Retention of Knowledge? Int. J. Learn. Teach. Educ. Res. 2015, 10, 51–70. [Google Scholar]
  69. Marth, M.; Bogner, F.X. Does the issue of bionics within a student-centered module generate long-term knowledge? Stud. Educ. Eval. 2017, 55, 117–124. [Google Scholar] [CrossRef]
  70. Dieser, O.; Bogner, F.X. How individual environmental values influence knowledge acquisition of adolescents within a week-long outreach biodiversity module. J. Glob. Res. Educ. Soc. Sci. 2017, 9, 213–224. [Google Scholar]
  71. Liefländer, A.K.; Bogner, F.X. Educational impact on the relationship of environmental knowledge and attitudes. Environ. Educ. Res. 2016, 24, 611–624. [Google Scholar] [CrossRef]
  72. Sturm, H.; Bogner, F.X. Student-oriented versus Teacher-centred: The effect of learning at workstations about birds and bird flight on cognitive achievement and motivation. Int. J. Sci. Educ. 2008, 30, 941–959. [Google Scholar] [CrossRef] [Green Version]
  73. Scharfenberg, F.-J.; Bogner, F.X.; Klautke, S. The suitability of external control-groups for empirical control purposes: A cautionary story in science education research. Electron. J. Res. Sci. Math. Educ. 2006, 11, 22–36. [Google Scholar]
  74. Schweiger, W.; Brosius, H.-B. Von der ‘Gentomate’ zur Gentechnikakzeptanz. Eine Panelstudie zu Einstellungseffekten eines rollenden Genlabors an Gymnasien [From the ‘gene tomato’ to acceptance of gene technology. A panel study on effects of a mobile gene technology lab at secondary schools on attitudes]; Gesellschaft für Strahlenschutzforschung: Neuherberg, Germany, 1999. [Google Scholar]
  75. Schumm, M.F.; Bogner, F.X. How Environmental Attitudes Interact with Cognitive Learning in a Science Lesson Module. Educ. Res. Int. 2016, 2016, 6136527. [Google Scholar] [CrossRef] [Green Version]
Figure 1. Distribution of item difficulties of the 24 knowledge items of the four sub-modules. Lower scores indicate more difficult items.
Sustainability 12 02036 g001
Figure 2. The knowledge sum scores for the whole module at all test times; N = 205; error bars show 95% CI.
Sustainability 12 02036 g002
Figure 3. The knowledge sum scores of the knowledge fields of the four sub-modules at the three test times; T0: pre-test; T1: post-test; T2: retention test; ecoservice: knowledge on ecosystem services; ident: species knowledge about soil organisms; threats: knowledge on threats to biodiversity; barcoding: knowledge on DNA barcoding; N = 205; error bars show 95% CI.
Sustainability 12 02036 g003
Figure 4. (a) The knowledge sum scores for all test times classified after participants’ affiliation to the upper or lower quartile of the variable utilization (UTL). Low: mean score ≤ 1.57, high: mean score ≥ 2.0. Error bars show 95% CI. (b) The knowledge sum scores for all test times classified after participants’ affiliation to the upper or lower quartile of the variable preservation (PRE). Low: mean score ≤ 3.29, high: mean score ≥ 4.14. Error bars show 95% CI. (c) The knowledge sum scores for all test times classified after participants’ affiliation to the upper or lower quartile of the variable appreciation. Low: mean score ≤ 1.86, high: mean score ≥ 2.86. Error bars show 95% CI.
Sustainability 12 02036 g004
Figure 5. The knowledge sum scores for all test times classified after participants’ affiliation to the upper quartile of the variables preservation (preserver; mean score ≥ 4.14) and utilization (utilizer; mean score ≥ 2.0). Error bars show 95% CI.
Sustainability 12 02036 g005
Figure 6. The mean score differences in the environmental values of the two sub-samples formed; no increase at T2: students who did not show a knowledge increase between T1 and T2 in the sub-module DNA barcoding; increase at T2: students who showed a knowledge increase between T1 and T2 in the sub-module DNA barcoding. N = 205; error bars show 95% CI.
Sustainability 12 02036 g006
Table 1. Knowledge test item examples for each sub-module. Correct answers in bold.
Sub-ModuleItem ExampleItem Difficulty
ecosystem services Which protection cannot be provided by forests?
(a)
protection against avalanches.
(b)
flood protection.
(c)
protection against soil erosion.
(d)
earthquake protection.
0.55
DNA barcoding The overriding goal of DNA barcoding is...
(a)
...to capture global biodiversity.
(b)
...to replace taxonomists.
(c)
...to replace morphological species identification.
(d)
...to identify individual species, which are difficult to identify morphologically.
0.44
species identification A diverse community of soil biota provides for...
(a)
...storage of heat in the soil.
(b)
...decomposition of organic substances (dead remains of plants and animals).
(c)
...availability of water in the soil.
(d)
...the conversion of carbon into nutrients.
0.72
biodiversity threats You should advise a forester for the future to...
(a)
...always remove deadwood from the forest immediately.
(b)
...to bet on a single tree species only.
(c)
...to plant a variety of tree species.
(d)
...to plant non-native tree species from warmer regions.
0.62
Table 2. The results of the Bonferroni-adjusted post-hoc analysis of the repeated measure ANOVA for the knowledge scores within the four sub-modules; N = 205.
Sub-Module Knowledge Differences between Test Times
T1–T0T2–T1T2–T0
MDpMDpMDp
ecosystem services 0.89<0.001−0.350.0010.54<0.001
DNA barcoding 0.330.0050.410.0020.74<0.001
species identification 0.96<0.001−0.48<0.0010.47<0.001
biodiversity threats 1.06<0.001−0.21n.s.0.85<0.001
Table 3. Pearson correlation between the knowledge scores and 2-MEV and APR. UTL: utilization; PRE: preservation; APR: appreciation. Bonferroni corrected p values: * p ≤ 0.006; ** p ≤ 0.001; *** p ≤ 0.0001.
KnowledgeT0T1T2
UTL
r−0.272 ***−0.249 **−0.220 *
p<0.0001<0.00010.002
PRE
r0.214 *0.264 **0.280 ***
p0.003<0.0001<0.0001
APR
r0.0660.1800.287 ***
pn.s.n.s.<0.0001

