1. Introduction
An important consequence of transport sustainability will be improved traffic safety [
1]. Given the recent advancements in autonomous driving functions, one of the main challenges is the safe and efficient operation of complex traffic situations such as road intersections [
2]. Over the past few years, the automation of road vehicles has gained an increasing presence on the agendas of companies and public authorities, which have started to push for automated driving systems (ADS) to the forefront of research [
2,
3]. On spots in a road network where traffic conflicts are likely to occur, e.g., intersections, it must be ensured that automated vehicles can operate safely and efficiently, and, more importantly, that conventional vehicles driven by humans will have at least the same safety level as they have now [
2,
4].
With respect to technology and logistics, the most difficult time will be the transition period, with the inevitable co-existence of standard, semi-autonomous, and fully autonomous vehicles [
5]. This period will be complicated for vehicle constructors as well as for traffic engineers and engineers designing the technical infrastructure of roads. It will also be a challenge for analysts of traffic accidents [
6]. The analysts will have to systematically evaluate different traffic elements and their mutual interactions [
6,
7]. Our experience has shown that what is most difficult is regulating traffic flow at intersection crossings. Although there are already well-established control algorithms at use, the setup of each intersection crossing needs individual tuning as well as individual traffic accident reconstruction. The precise investigation of traffic accidents and near-miss incidents will help not only to better legally assess the case, but also to improve the control of intersection crossings [
8].
Analysts of traffic accidents must in many cases deal with accidents on intersections controlled by traffic lights. While relying on light signals, drivers rarely pay attention to possible risks and to the behavior of other people involved in the accident. At higher drive-through speeds, the collisions in question may be fatal [
9]. The right assessment of this kind of accident has a great influence on the trust of people in lawful procedures [
2]. Dealing with it requires specific technical and analytical attitudes. Besides standardly used reconstruction methods, such experts must apply traffic engineering knowledge here and combine methods in a suitable way. It often is the case that the right analysis of the accident reveals defects of the intersection control, and then the expert might help to increase the safety of such a place [
1,
10].
The following article describes the general methodology suitable for dealing with these types of traffic accidents using a simulation-based method. Except for the short theoretical introduction, the methodology is demonstrated in the case of a real traffic accident.
2. Literature Review and Theoretical Background
Traffic accident reconstructions at traffic signals are quite difficult to be carried out. They combine the accident process analysis, knowledge of the correct signal plan traffic lights functioning, and simulation in the simulation program. There were not many studies processed in the respective research area which would solve the three above mentioned fields in complexity.
According to the publication [
11], the time spent crunching numbers and performing analysis is more significant than the amount of time devoted to creating conclusions. The vast majority of time and energy expended during a reconstruction, however, is spent long before the expert ever receives the assignment. The bulk of the time is spent learning about and understanding how traffic signals function.
The main part of the methodology of accident reconstruction in reference [
12] considers traffic signal knowledge to be the most significant aspect. Traffic signals are either on or off, and if they are on, then they must be in either flashing mode or in one of the pre-programmed phases. Based on the driver’s and witness’s statements, the expert can usually eliminate the possibility of the signal being in flashing mode or being off. Determining which phase the signal was in, however, just before the crash and during the crash can be elusive. Knowing what phase the signal was in or was about to go into is often a defining point in the accident analysis. With knowledge of the phasing and timing parameters programmed in the signal controller, an expert can create a timeline by which events preceding the crash can be tied down to a specific point in time.
A summary of recent studies involving modeled vehicle collisions is included here, mainly focusing on the PC-Crash simulation system and studies involving crush damage from the collision [
13]. PC-Crash was the focus of this research as it is a continually updated software platform. It contains many features that enable the physical interactions of a collision to be included. Some detail into these features is given by the program’s author, Dr. H. Steffan [
14]. An explanation into how the software models the tire, suspension, and gravity forces into dynamics is given, with further detail into such advanced considerations such as wind forces. The momentum-based collision model at the heart of the program is based on the work of Kudlich and Slibar, the basic principles of which are the same as much of the other modeling [
15]. A more comprehensive study for illustrating how this software is applied to a typical traffic accident collision is given by [
16]. This demonstrates how the vehicle attributes and speeds are used in the overall application of the program to an accident scene. Velocity graphs are given for a few basic two-car collisions, along with some impact mechanics theory that serves as a good introduction to the principles of this research.
The research study [
17] describes that an expert typically proceeds through a three-step process:
Traditional collision reconstruction analysis using physical evidence, vehicle dynamics principles, and electronic data sources in order to determine the paths, distances, and times involved in the approach movements of each involved vehicle.
Gathering and analyzing the general traffic signal phasing and timing in place at the time of the incident.
Incorporation of the vehicle dynamics analysis with the traffic signal phasing and timing analysis, followed by a review of statements from involved operators and independent eyewitnesses, in comparison to the combination of the vehicle dynamics distance–time line and the known general signal phasing and timing. This analysis may involve excluding certain scenarios as inconsistent with the signalization, or may involve reaching certainty about the actual sequence of vehicle movements, depending on the available data and the facts of the incident.
The authors of literature reference [
18] declare that the experts are in general often asked to investigate and assess the traffic signal timing, right of way issues, and the signal indications displayed to involved drivers during the period of time leading up to and including the impact events. Until relatively recently, the experts were limited by the absence of any recording devices within the systems used for traffic signal phasing and timing. Accident reconstruction methods have long relied on the generalized signal phasing and timings programmed for that intersection by the responsible jurisdiction, combined with the vehicle dynamics calculated for the collision sequence in conjunction with witness testimony regarding signal indications and phase changes [
17,
18]. Recent technological advancements in signal timing data collection, recording, and logging can provide engineers and experts with a new, time-specific, incident-relatable, and more robust method of analyzing signalized intersection collisions (in case the intersection is equipped with the signal timing data loggers).
The authors in study [
19] compare the current traffic signal detection technologies such as loop detectors, video traffic detectors, long-range radar, or preemption devices. They also present new and perspective data logger technology. Traffic signal data loggers are event-based data recording devices that collect and digitally record high-resolution data from traffic signal hardware such as controllers, detectors, and preemption devices. Essentially, the data loggers record signal controller input and output events such as when a specific signal phase changes from red to green, when a pedestrian activates the pedestrian pushbutton detector, when a detector captures the presence of an approaching vehicle, and when certain components of the system register an error or malfunction.
While the sheer volume of signal data logger data over a 24-hour or longer period is largely irrelevant to a specific collision event, the time-stamped high-resolution data, and positional information related to vehicle detectors and signal phase changes within the seconds or minutes leading up to an incident can be a helpful resource for accident reconstruction and forensic analysis. The actual vehicle dynamics and the signal phase durations and change points can all be directly extracted from the recorded data [
18,
19].
Traffic signal information from the data logger is also available and potentially valuable to assist engineers and experts in reaching conclusions when conducting accident reconstructions for incidents at signalized intersections. This new technology is particularly applicable to answering the most common questions involving signalized intersection collisions, including which driver had a green signal when approaching from conflicting directions, or how the incident was affected by the driver and pedestrian responses to signal change intervals, protected/permissive phasing, and pedestrian signal operations [
18,
20].
The research studies presented by references [
2,
21] state that road intersections are locations, where the paths of multiple traffic participants are crossed, and that they are considered high-risk spots for traffic safety. For standard or automated vehicles, road intersections of whatever type constitute a major point of interest along their routes due to the increased likelihood of conflicts with other road users [
2].
Due to these reasons and deficiencies, we decided to focus on this field of research and propose a methodology with respect to forensic purposes and transport sustainability.
So far as analogous studies regarding this matter are concerned, we are aware of none containing such concise expert and complex methodology in handling these specific accidents at intersection crossings. Because such a specific approach is not available, we have decided to carry it out, explaining and demonstrating it on the real case that was reconstructed by means of a simulation program.
2.1. Intersection and its Basic Parameters
The literature [
22] states that an intersection is a point in the network of roads where traffic flows meet, merge, and detach with respect to all meeting roads.
According to the publication in [
23], an intersection is a place where roads intersect or meet in a plan projection in such a way that they are mutually interconnected.
An intersection, therefore, must have a sufficient capacity to let through all such flows. Otherwise, vehicles might remain still at an intersection or in front of it. While deciding about the kind, type, shape, location, and layout of an intersection, the safety and fluency of traffic flow on the main road must be taken as a priority.
The specific conditions of a given intersection are determined by the following [
4,
22]:
- -
The traffic importance of the intersecting roads;
- -
The expected intensity of transversal (passing through) and tangential (branching out) traffic flows;
- -
The categories of intersecting local roads and highways;
- -
The mutual distance of intersections;
- -
The shape of the area and the position of the intersection in the route.
2.2. Basic Types of Intersections and Their Characteristics
Intersections can be classified from various points of view [
22]:
According to the mutual levels of roads, we distinguish the following:
- -
Level communications (roads intersect or meet at one level);
- -
Fly-over (roads crossing one another on different levels);
- -
Partial fly-over.
According to their shape, we distinguish the following:
- -
Intersection

- -
Contact

- -
Forked

- -
Radial

- -
Staggered

- -
Roundabout

With regard to the construction type, we classify junctions as simple, directed, with light signaling, and partial fly-over.
2.3. Geometry of Vehicles’ Movement at Junction
In publication [
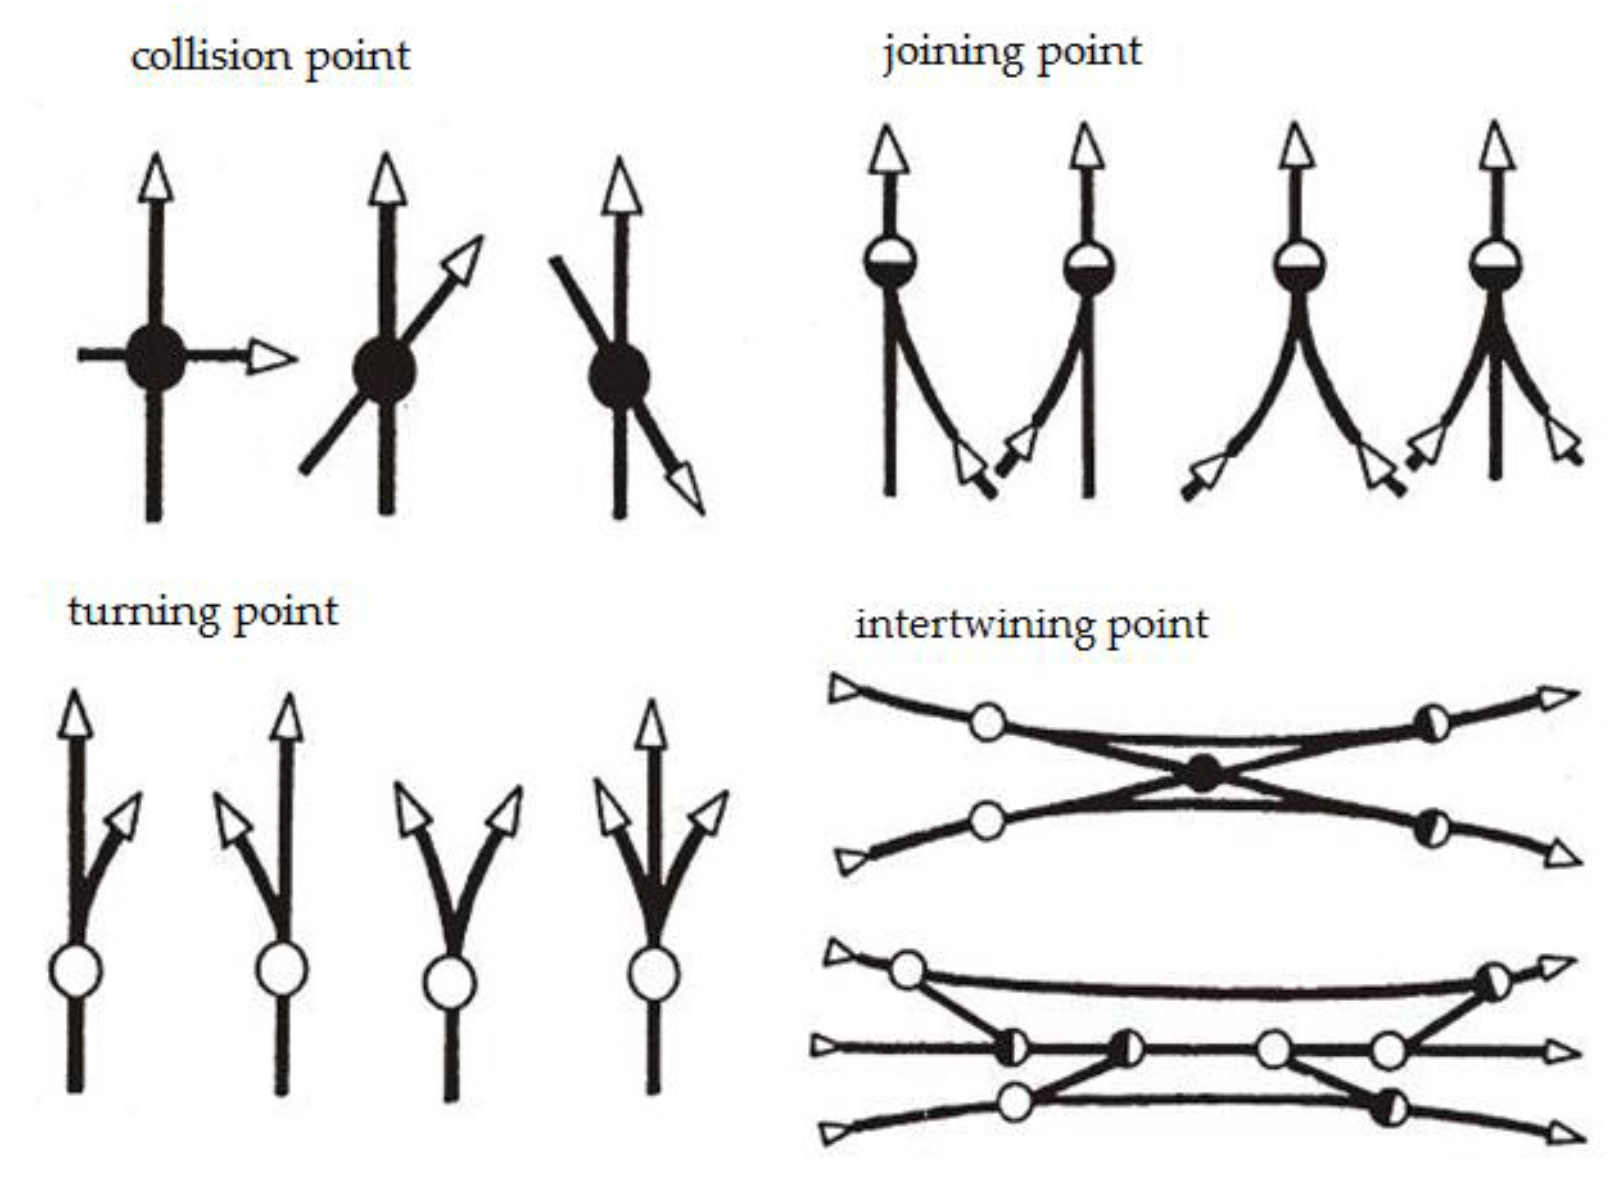
24], the authors declare that the movement of vehicles within the area of a junction is performed via the following maneuvers (
Figure 1):
- -
Turning right or left results in a situation when the driving direction is divided into two or more directions is known as divergent movement;
- -
Intersection, where driving directions intersect at a certain angle);
- -
Joining from the right and from the left, where two driving directions are joint in one convergent movement;
- -
Intertwining occurring upon changing lanes.
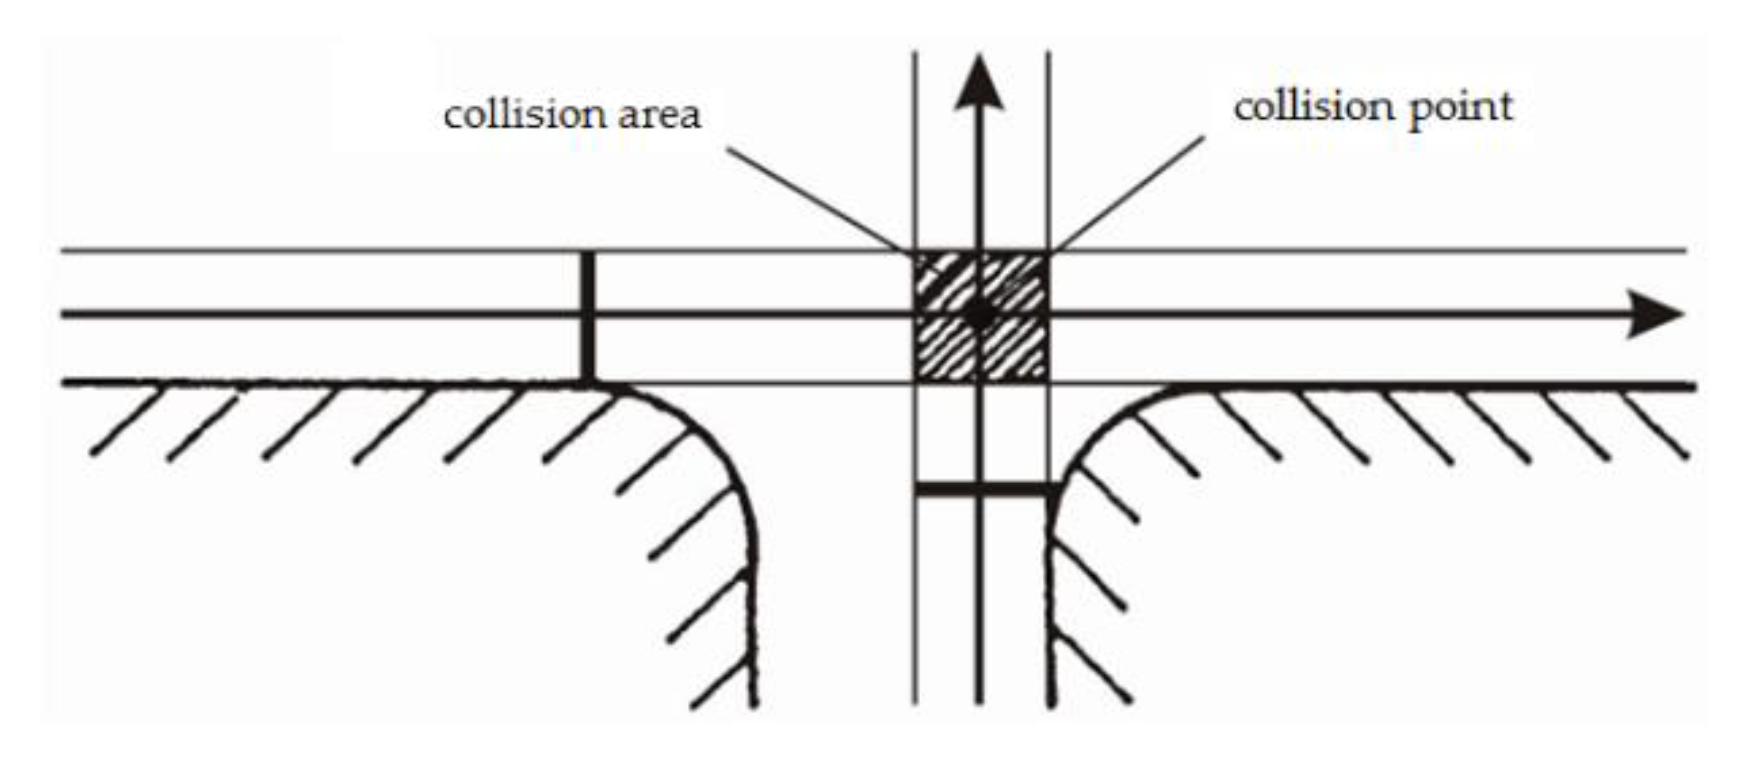
At a junction, there are areas restricted for non-collision movement, but also areas where there is a chance of collision (the collision area), and traffic screened areas which are non-drivable and are either limited by means of horizontal signs or modified as elevated traffic islands [
25]. A collision area at different types of junctions is defined according to
Figure 2.
Its size depends on the width of lanes, the number of overtaking lanes for each direction, and the way how vehicles join and disjoin.
2.4. Criteria of Accident Rate at Junctions
According to the publication in [
26], the accidents at junctions are considered accidents when they occur at a distance less than 125 m from the center of the junction, and they are regarded as locations of frequent accidents in the following cases:
- -
At least three accidents with special consequences per year;
- -
At least three accidents with special consequences of the same type in three years;
- -
At least five accidents of the same type per year.
For the evaluation of safety or non-safety, the relative accident rate indicator, R, is used, which indicates the probability of an accident at a certain place with regard to the driving performance [
27]. The indicator unit is the number of accidents per one million kilometers traveled by vehicles and it is calculated according to the following relation:
where N is the total number of accidents during the monitored period (it is possible to replace the absolute number of accidents with another parameter, such as the number of fatalities, severe injuries, etc., and, in this way, to define the derived parameters as well); I is the daily average traffic intensity (vehicles/day); L is the length of the section (km); and t is the monitored period (years) [
27].
The marker value is most frequently between 0.1 and 0.9; when exceeding the value of 1.6, the respective road section is considered as problematic. A disadvantage of the mentioned marker is that the calculation does not take into account the accident seriousness [
22,
27].
2.5. Junctions Controlled by Light Signaling Devices
The term junctions controlled by light signalization means the intentional creation of time gaps of a sufficient length, so that the alternating and safe passage of vehicles is ensured from every road in the shortest time possible. A light signaling device is implemented mainly in order to enable the passage of vehicles coming from side roads and to reduce their time losses compared to the uncontrolled junctions [
28]. This loss decrease should be greater than the resulting loss increase in the main direction. A junction controlled by light signal devices (herein referred to as LSDs) enables alternated giving way to individual traffic flows that are mutually colliding. In order to prevent traffic flows from crossing, the passage of vehicles through a junction from different slip roads is time separated.
The basic principle of road traffic control using a light signaling device is the time separated, alternating usage of a level junction by vehicles in the colliding traffic flows. As vehicles pass through a junction with minimum following distances, compared to the operation of a junction where the right of way is based on the system of main and slip roads, the efficiency of the junction and the safety of operation increase [
28,
29]. This applies only if LSD is used appropriately. The inappropriate use of an LSD might have a negative impact on the operation fluency.
The traffic control could be evaluated according to different criteria. Control could be subjective or automated, local or global, static or dynamic, dependent on time or traffic, and with or without coordination.
The most important aspect while deciding the necessity or suitability of implementing a light signal device is the traffic intensity on crossing roads. A set of limit values of main and side traffic flow intensities is used under different conditions and combinations of motorized and non-motorized transport and pedestrian flows. If the decrease of the traffic intensity is notable, the LSD features a traffic restriction with a negative impact on the fluency (i.e., driver criticism, attempts to break traffic rules, etc.) [
30].
The advantages of junctions controlled by an LSD are as follows:
Increased traffic safety;
Decreased occurrence of collision points while crossing traffic flows;
Decrease in average delay of vehicles;
Increased junction capacity;
Possible implementation of coordination;
Lower fuel consumption and consequently lower emissions and noise levels [
31].
Every way of control is defined as:
2.6. Criteria for Implementation of LSD at Junctions
The implementation of light control at a junction is usually assessed from the following aspects:
Minimum traffic intensity criterion. During the eight busiest hours of a regular workday, the intensity on the main and side road reaches values higher than those permissible for uncontrolled junctions.
Average hourly traffic and pedestrian intensity value criterion. If the average traffic and pedestrian intensity values during the eight busiest hours of a regular workday are not less than 500 vehicles/h (on roads with diversified directions of 850 vehicles/h) in both directions and that on the main road, or 150 pedestrians/h in one direction (the busier one).
Accident rate criterion. In the past three years, the relative accident rate was two accidents per 106 vehicles entering the junction (a time unit where during which the accidents are monitored as well as the number of the vehicles, and both must be unchanged during the three years).
Total of individual conditions. LSD installation might be justified with respect to the economy if none of the above-stated conditions are met, but at least two of them are met at an 80% level.
Other aspects. For example, coordinated control, traffic situations during recreational hours, ensuring public transport fluency, etc. [
22,
32].
2.7. Selected Definitions of LSD at Junctions
A junction phase is the time during which vehicles use the junction actively. In other words, it is a part of a cycle during which certain traffic movements have a right of way at the junction concurrently. In between phases, there must be a meantime which decreases the total active length of the green light [
33].
The total number of phases depends on the size and directions of individual motorized and pedestrian flows within the area of the junction in question. The decisive direction is turning left. As long as the intensity of the vehicles turning left does not reach 120 jv.h
−1 (unit vehicles per hour), it is not necessary to create separate phases for branching away, and the junction is controlled in a two-tact way. If the condition is not met, we consider multi-tact traffic control [
22,
33].
Phase schemes serve for the graphic presentation of collision points between cycles (see
Figure 3).
From the point of view of safety, it would be desirable to have a higher number of tacts, ensuring passage through a junction without any collisions. This solution is contradictory to the performance, as well as the economy, since time losses repeat several times during the cycle (time needed for drive away), idle time during the yellow light, and the whole time during the red light. Each tact requires its meantime which is at the expense of the active length of the green light [
33].
The meantime is the time period between the end of the green signal in one phase and the beginning of the green signal in another phase. This means that during the meantime, the last vehicle of the finishing phase must leave the collision area at the moment when the first vehicle of the starting phase enters the area [
34]. Meantimes are basically an unproductive time period in junction control.
The functions of the meantimes are described as follows:
- -
To allow for leaving the collision area for those vehicles that have entered the junction at the end of the green light period or during the yellow light period;
- -
To ensure a safe entry of vehicles at the green light of the new phase without the collision with the vehicles leaving the junction [
22,
34].
The control cycle length is a time period during which the complete set of signals on one signal device takes place. The cycle length is defined by constant meantimes, the traffic load, number of phases, and the junction disposition. When choosing the cycle length, we have to bear in mind that a cycle which is too short lowers the junction capacity and vice versa, where a cycle which is too long might lead to the situation where the green phases during which no vehicle is passing through the junction are not utilized. The long cycles also increase time losses and lead to a decrease in effective LSD-based junction control [
35]. The cycle length ranges from 40 to 120 s and depends on the number of vehicles entering the junction, the way of branching out and its intensity, the passage width and length, and junction construction work [
22].
Green signal length is considered to be a productive part of the cycle. It is calculated by dividing the effective cycle length. The calculated green signal lengths are rounded to the nearest whole number and cannot fall below the value of 8 s [
36].
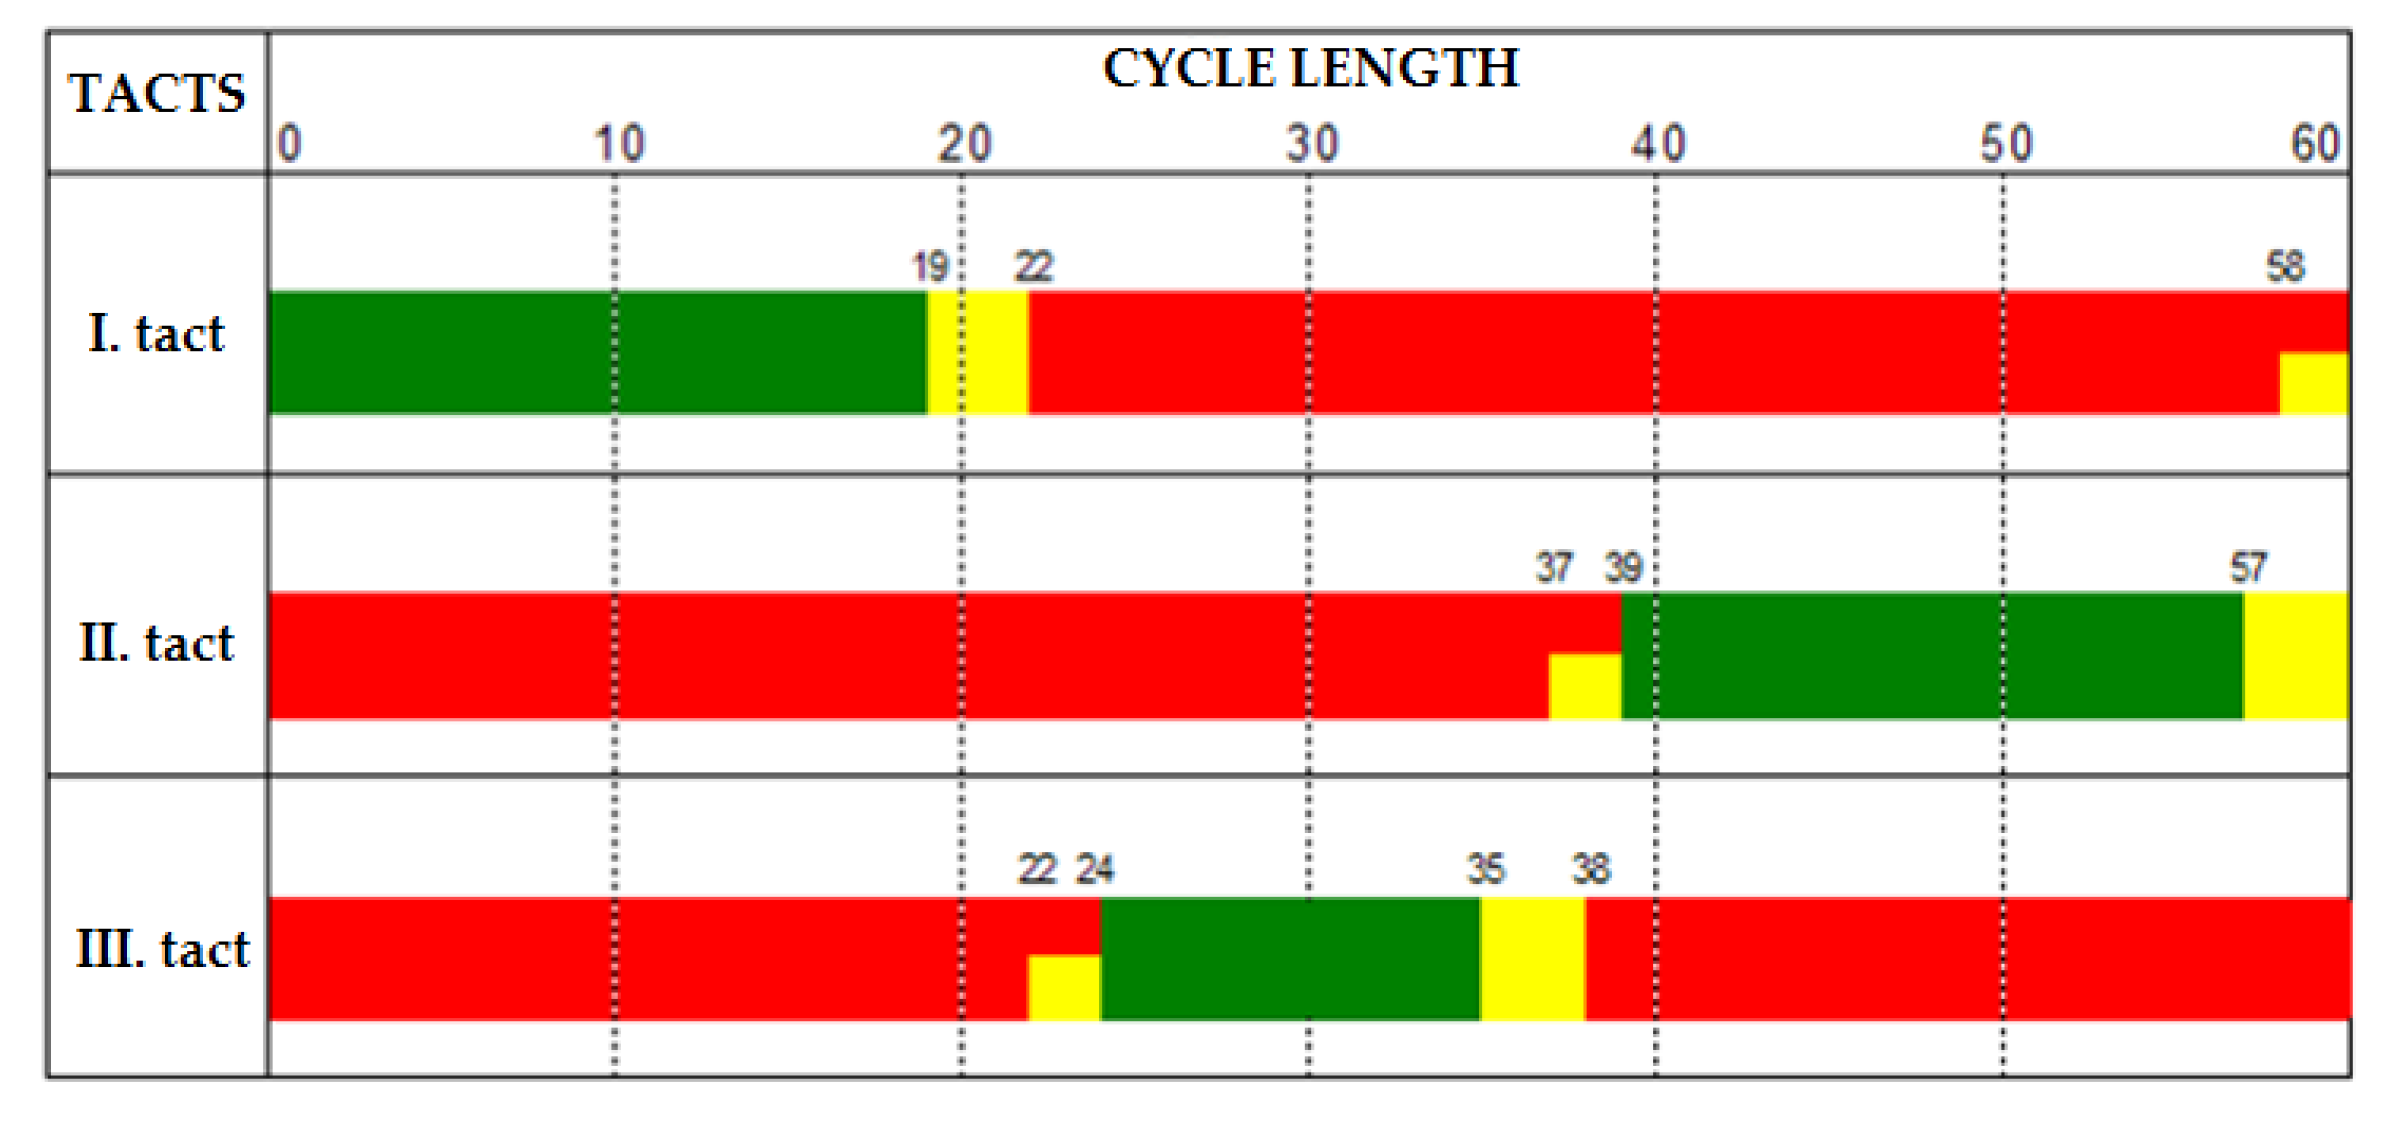
A signal plan is a graphic image of LSD control, determining the order and lengths of individual light phases [
37] (see
Figure 4).
A signal group is a group of signal devices in which in any control program and every time interval has the same signal image. The signal plan is compiled on the basis of the calculated and outlined control cycle length and individual green signals and it includes the following data:
- -
A control program number;
- -
A time period of its implementation during the day;
- -
A cycle length;
- -
A detailed layout of the light signal sequences for all road users in the following order:
- ⚬
Motor transport;
- ⚬
Rail transport;
- ⚬
Pedestrians;
- ⚬
Other means of transport (e.g., bicycles, etc.);
- -
A respective key;
- -
Other additional data [
36,
38].
3. Means and Methods
The said methodology is demonstrated via a real accident that was analyzed by the authors during their forensic practice.
The study uses the data of the real accident that happened at a four-legged light-controlled intersection. The analysis was carried out on the basis of the police protocol, containing the following information:
The accident record identified by the police;
Tracks and marks left at the accident;
The photo documentation of the place of the accident;
The photo documentation of the damaged vehicles;
Protocols containing a testimony of the participants and witnesses of the accident;
The accident place plan with localized end positions of the vehicles, movement tracks, and positions of the objects associated with the accident, along with the collision place designation, etc.;
The documentation concerning the light-controlled intersection (description of signal groups, signal plan, an intersection plan, phase schemes, meantime, control cycle length, etc.).
The place of the accident was localized and obtained. The signal plan of the intersection was further analyzed, as shown below.
The accident involved a Škoda Octavia and Opel Omega. The precise technical data of both have been obtained from the respective registration papers and from the database of the simulation program, as shown below.
The simulation of the accident was carried out by the program PC-Crash. The software is primarily assigned for the analysis of transport accidents [
39]. The PC-Crash program is used for the following purposes:
Simulated vehicle tracks, including their real dynamic parameters;
Projecting the real place of the accident, either by means of drawing or by optical loading;
Defining the impact and final position of the vehicles;
Examining the complex situation of the transport accident [
40,
41].
In this case, the analysis was carried out by means of retroactive action unwinding, i.e., by gradual completion advancing from the known facts toward the unknown. We proceed from the final position of the vehicle (a known fact) toward the unknown facts. The standard and proven reconstruction methods regarding the mechanics of the accident were used. The analysis of any accident is based on the concept that each accident contains its own logic. While preparing the analysis of the accident, the signal plan of the intersection was incorporated in the simulation program. This procedure, the principal part of this study, is shown and explained in detail below.
4. Results
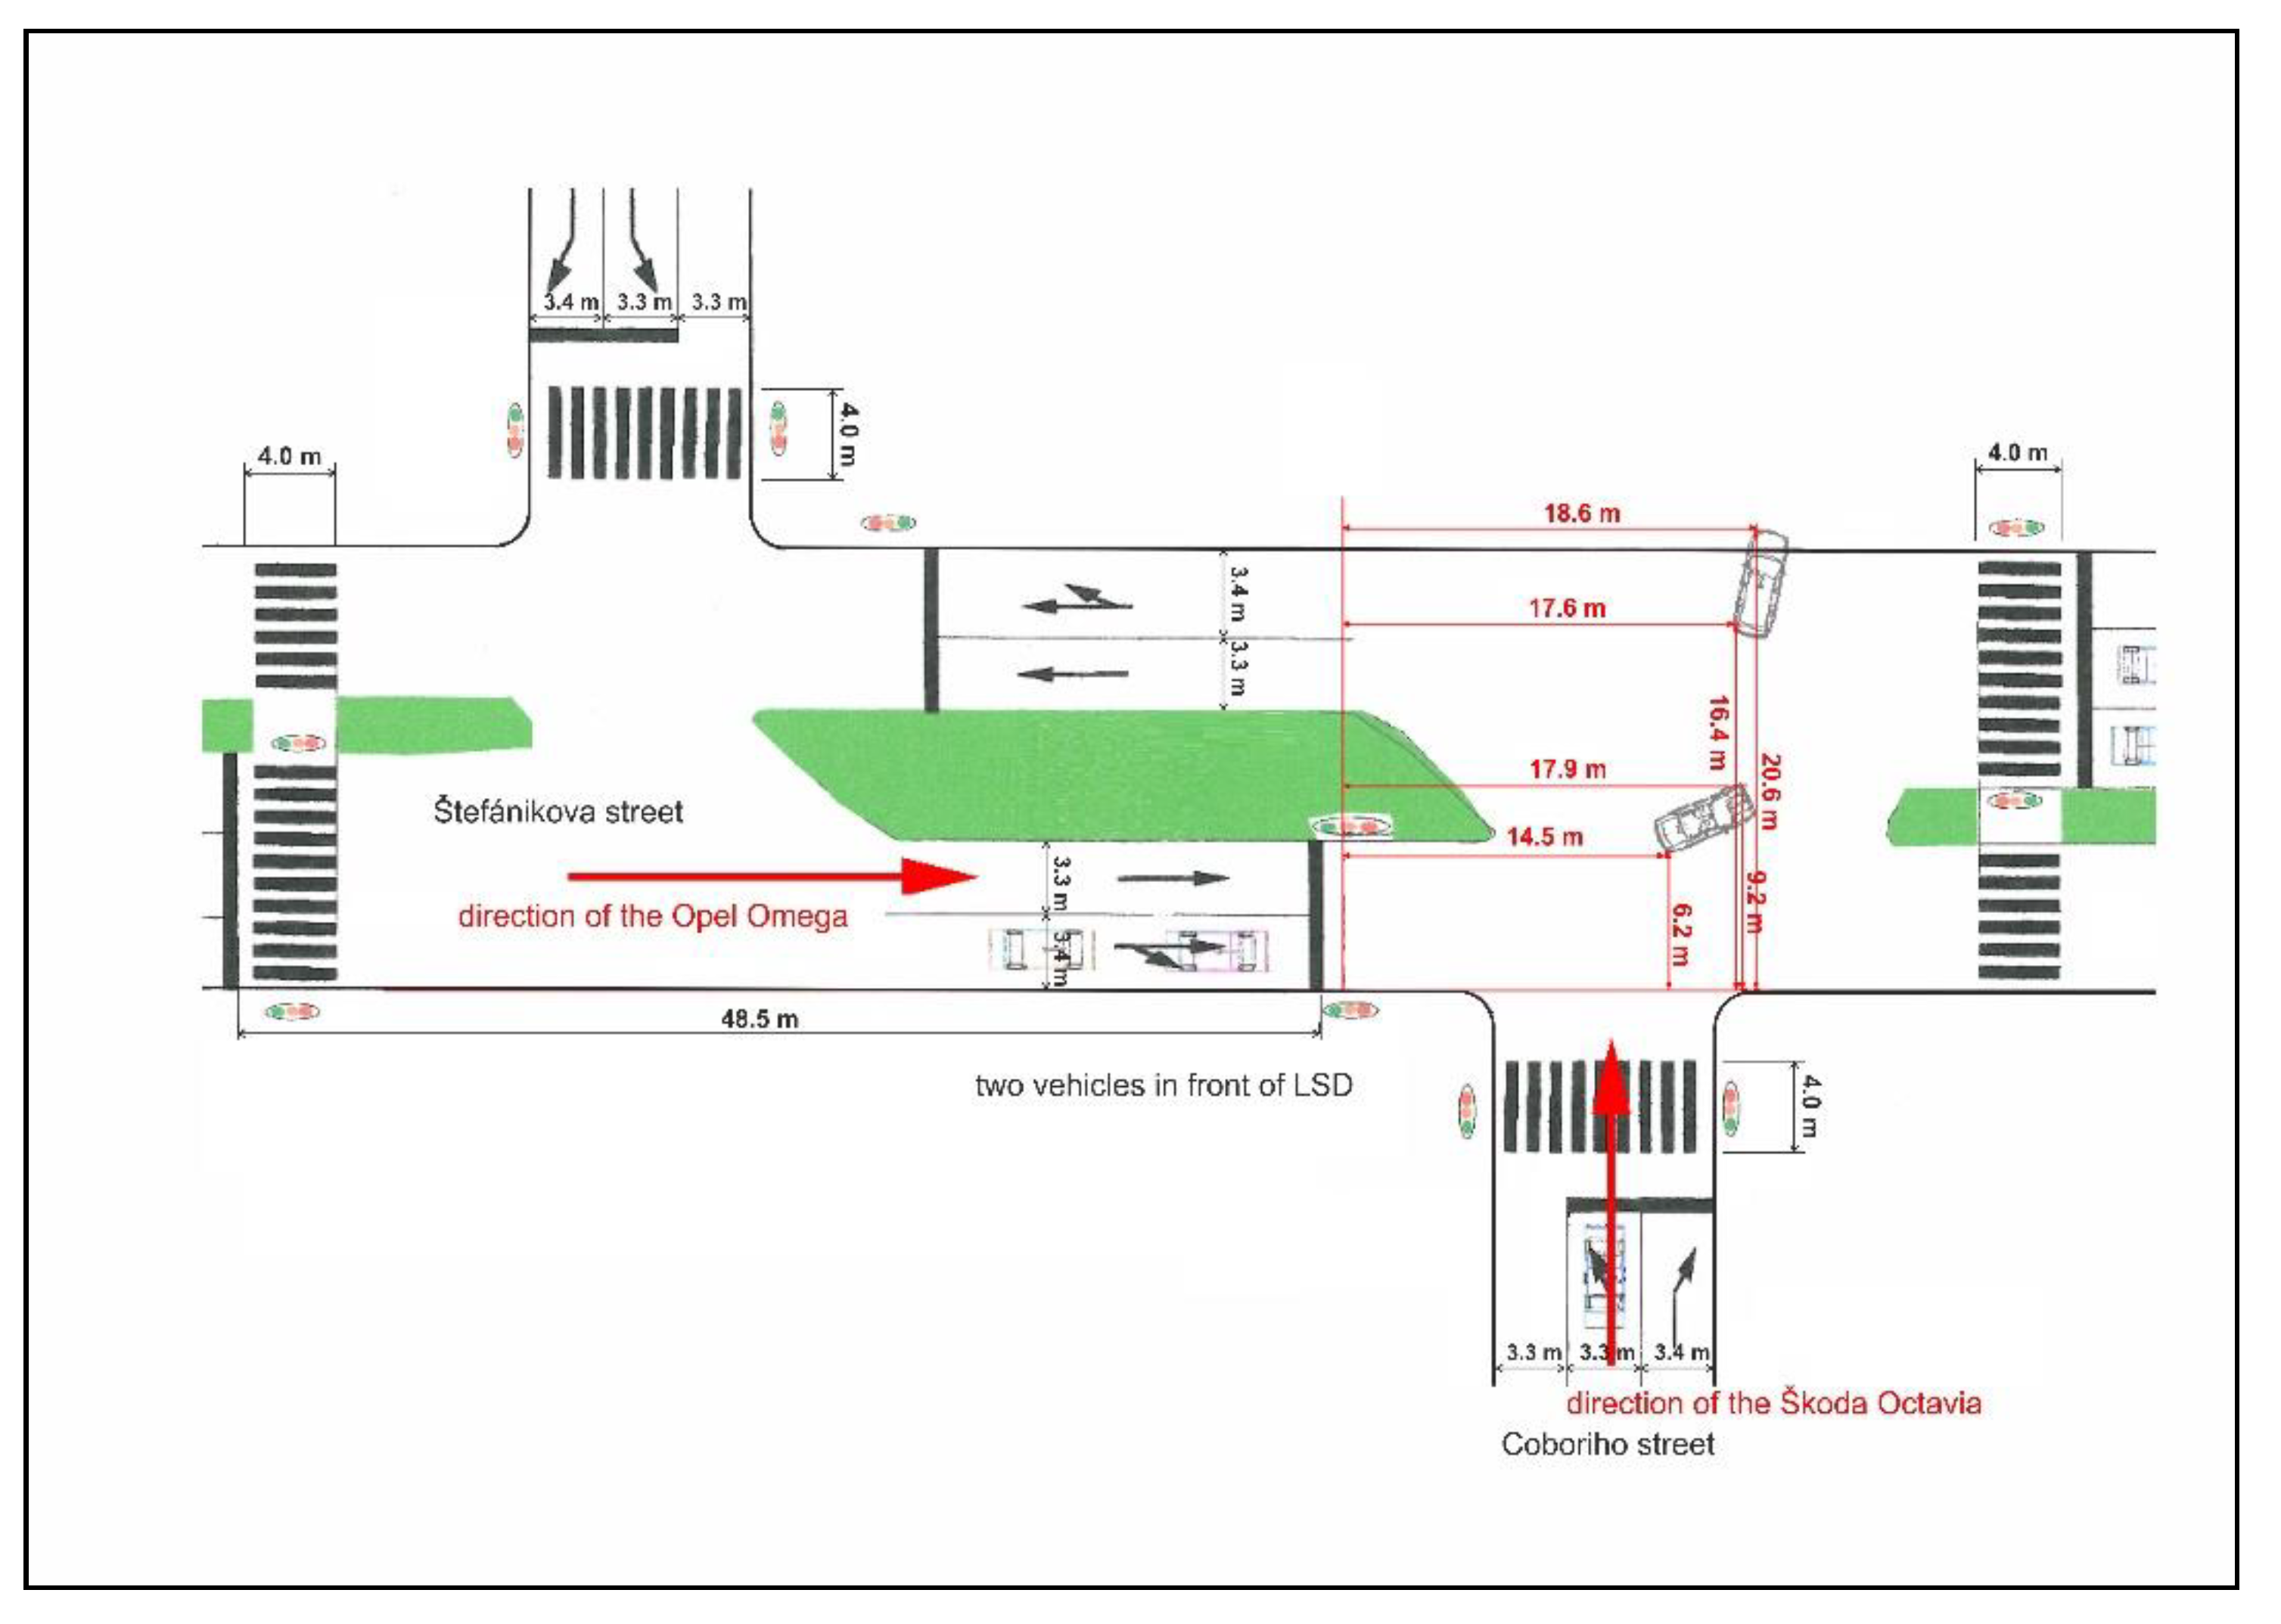
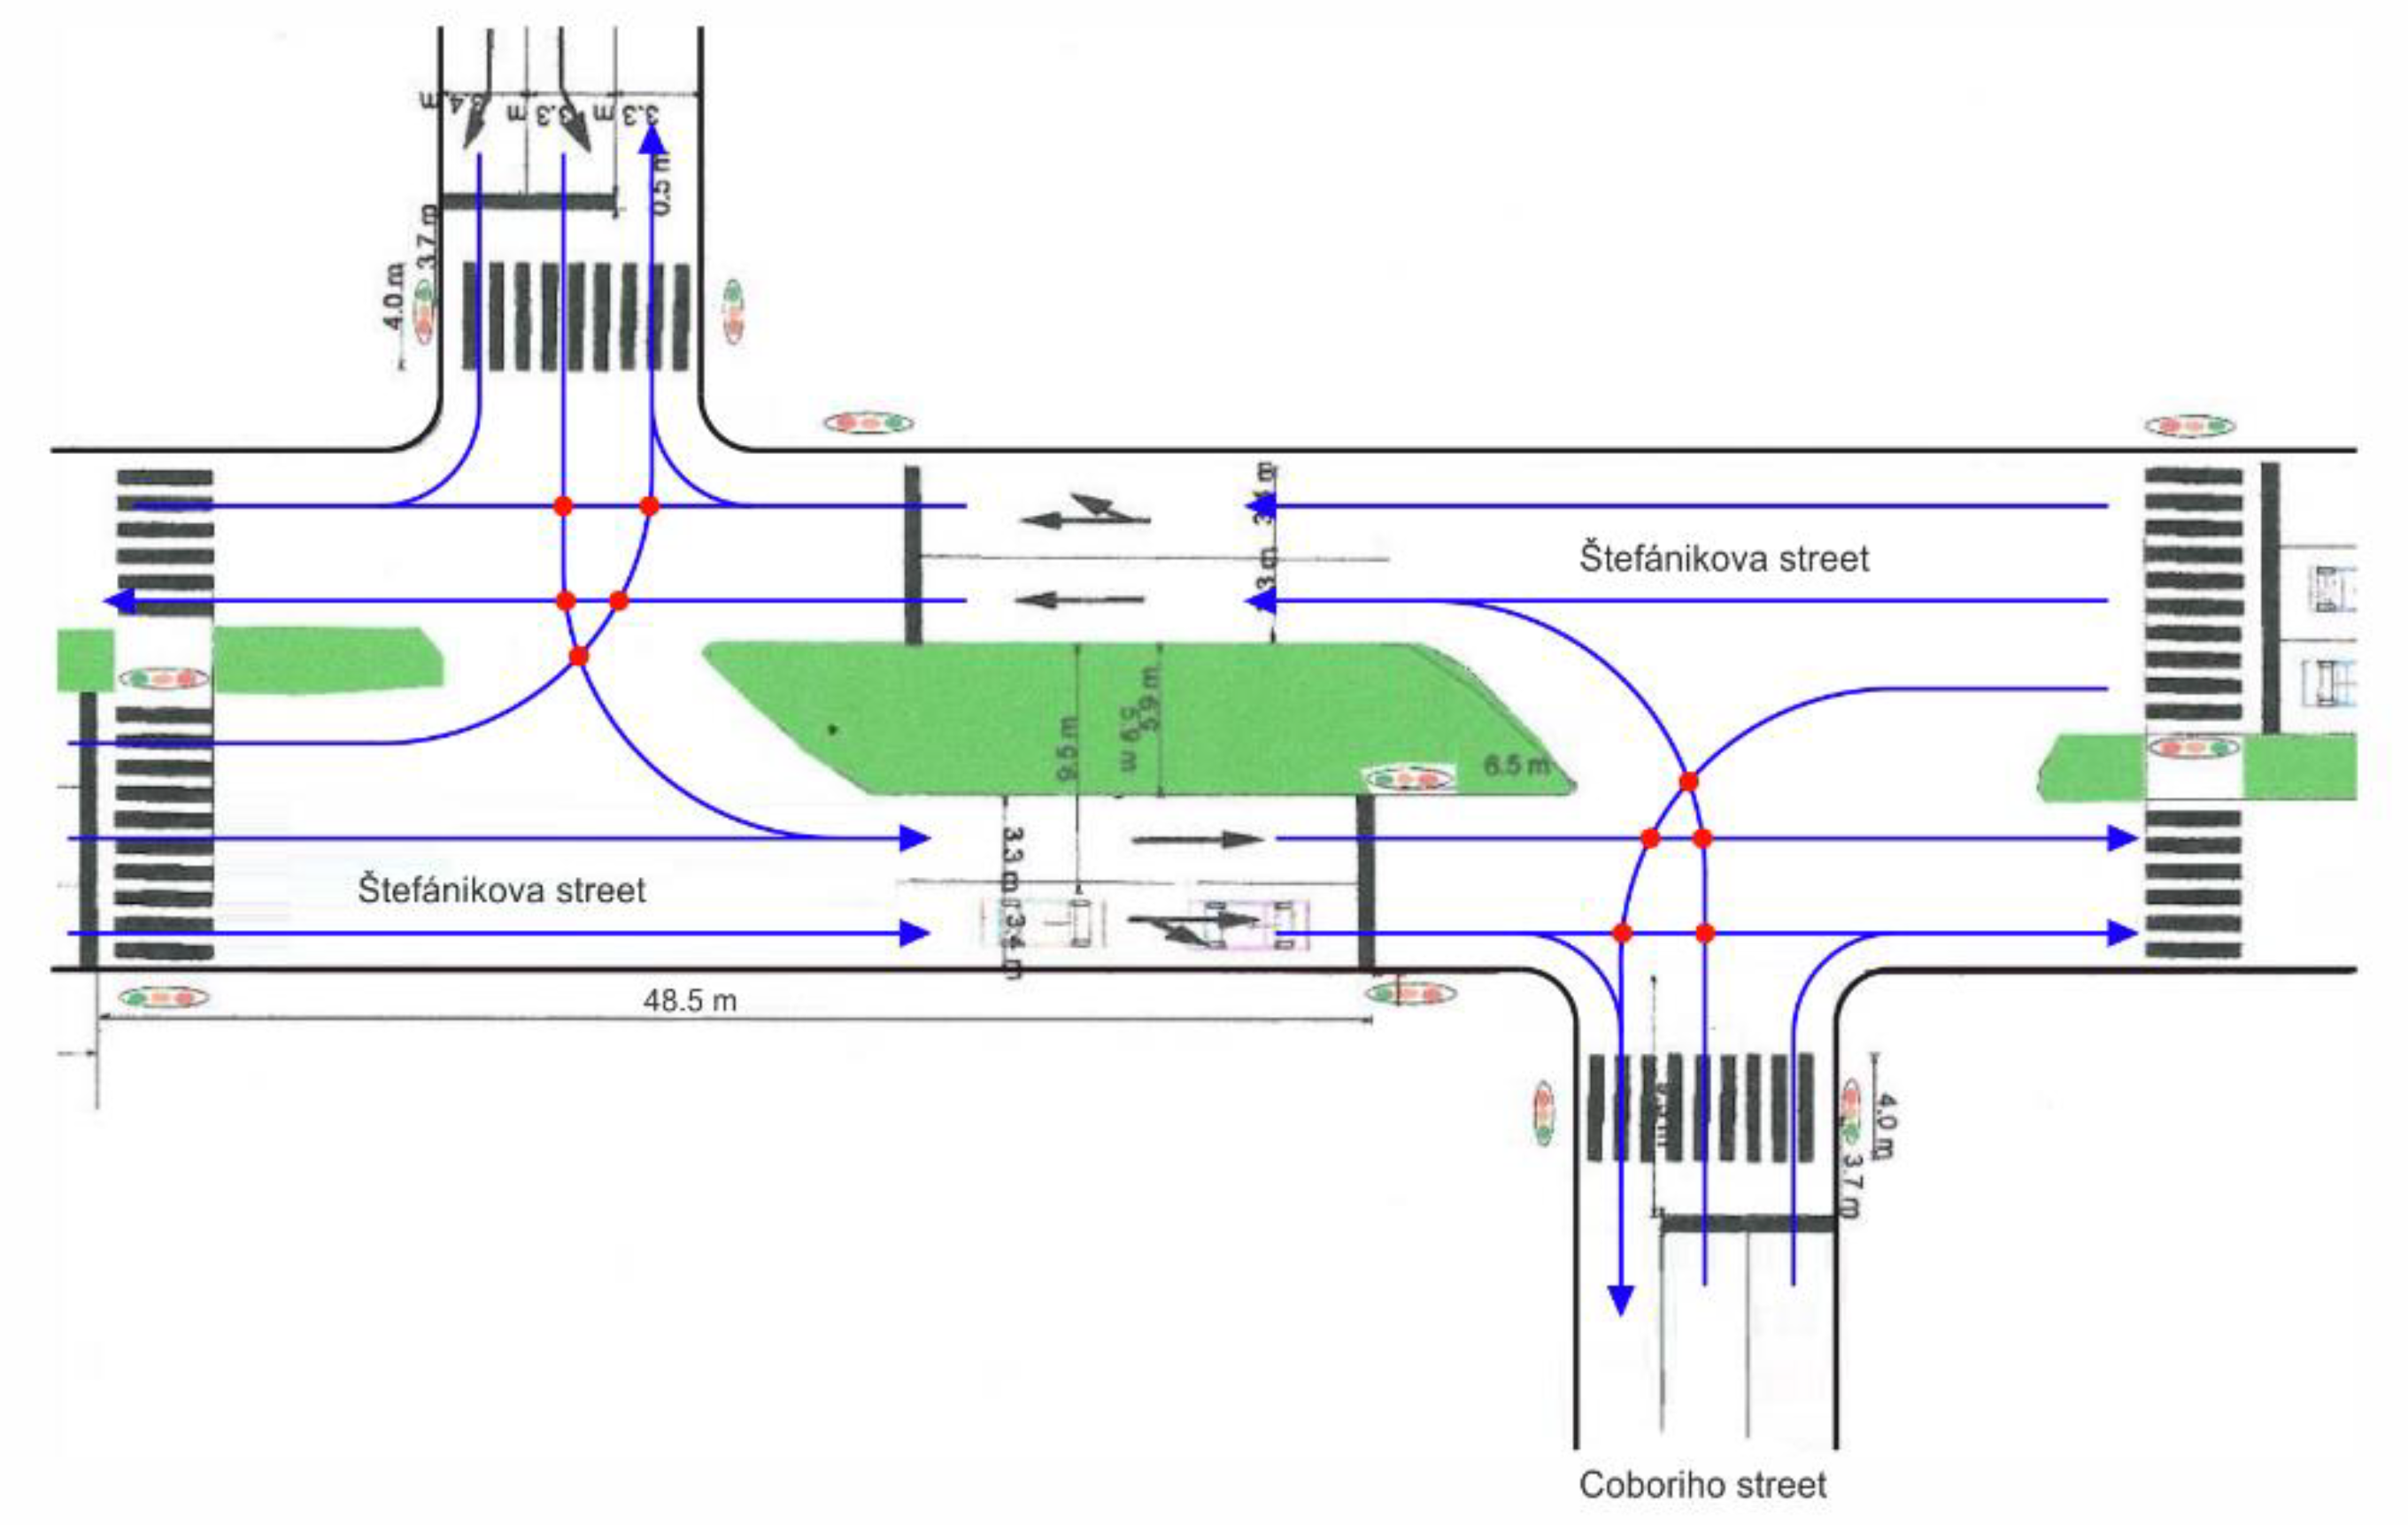
In the following section, we introduce the procedure methodology of the application for the analysis and evaluation of the road accident at the junction considered here. As a solution sample, we chose an accident during which there was a collision of an Opel Omega and a Škoda Octavia at a T-shaped junction. This junction is preceded by a junction of the same type at a distance of approximately 48 m (see
Figure 5).
The Opel was moving down Štefánikova Street and the Škoda was approaching the junction via Coboriho Street.
To solve the accident problem, it is necessary to fulfill two basic tasks:
4.1. The Accident Analysis
Firstly, based on the information contained in the investigation file and the vehicle technical data, the accident analysis was carried out, the result of which is the definition of the collision speed of the vehicles and the speed of the vehicles before the accident.
Defining the collision speed was carried out by means of the PC-Crash program [
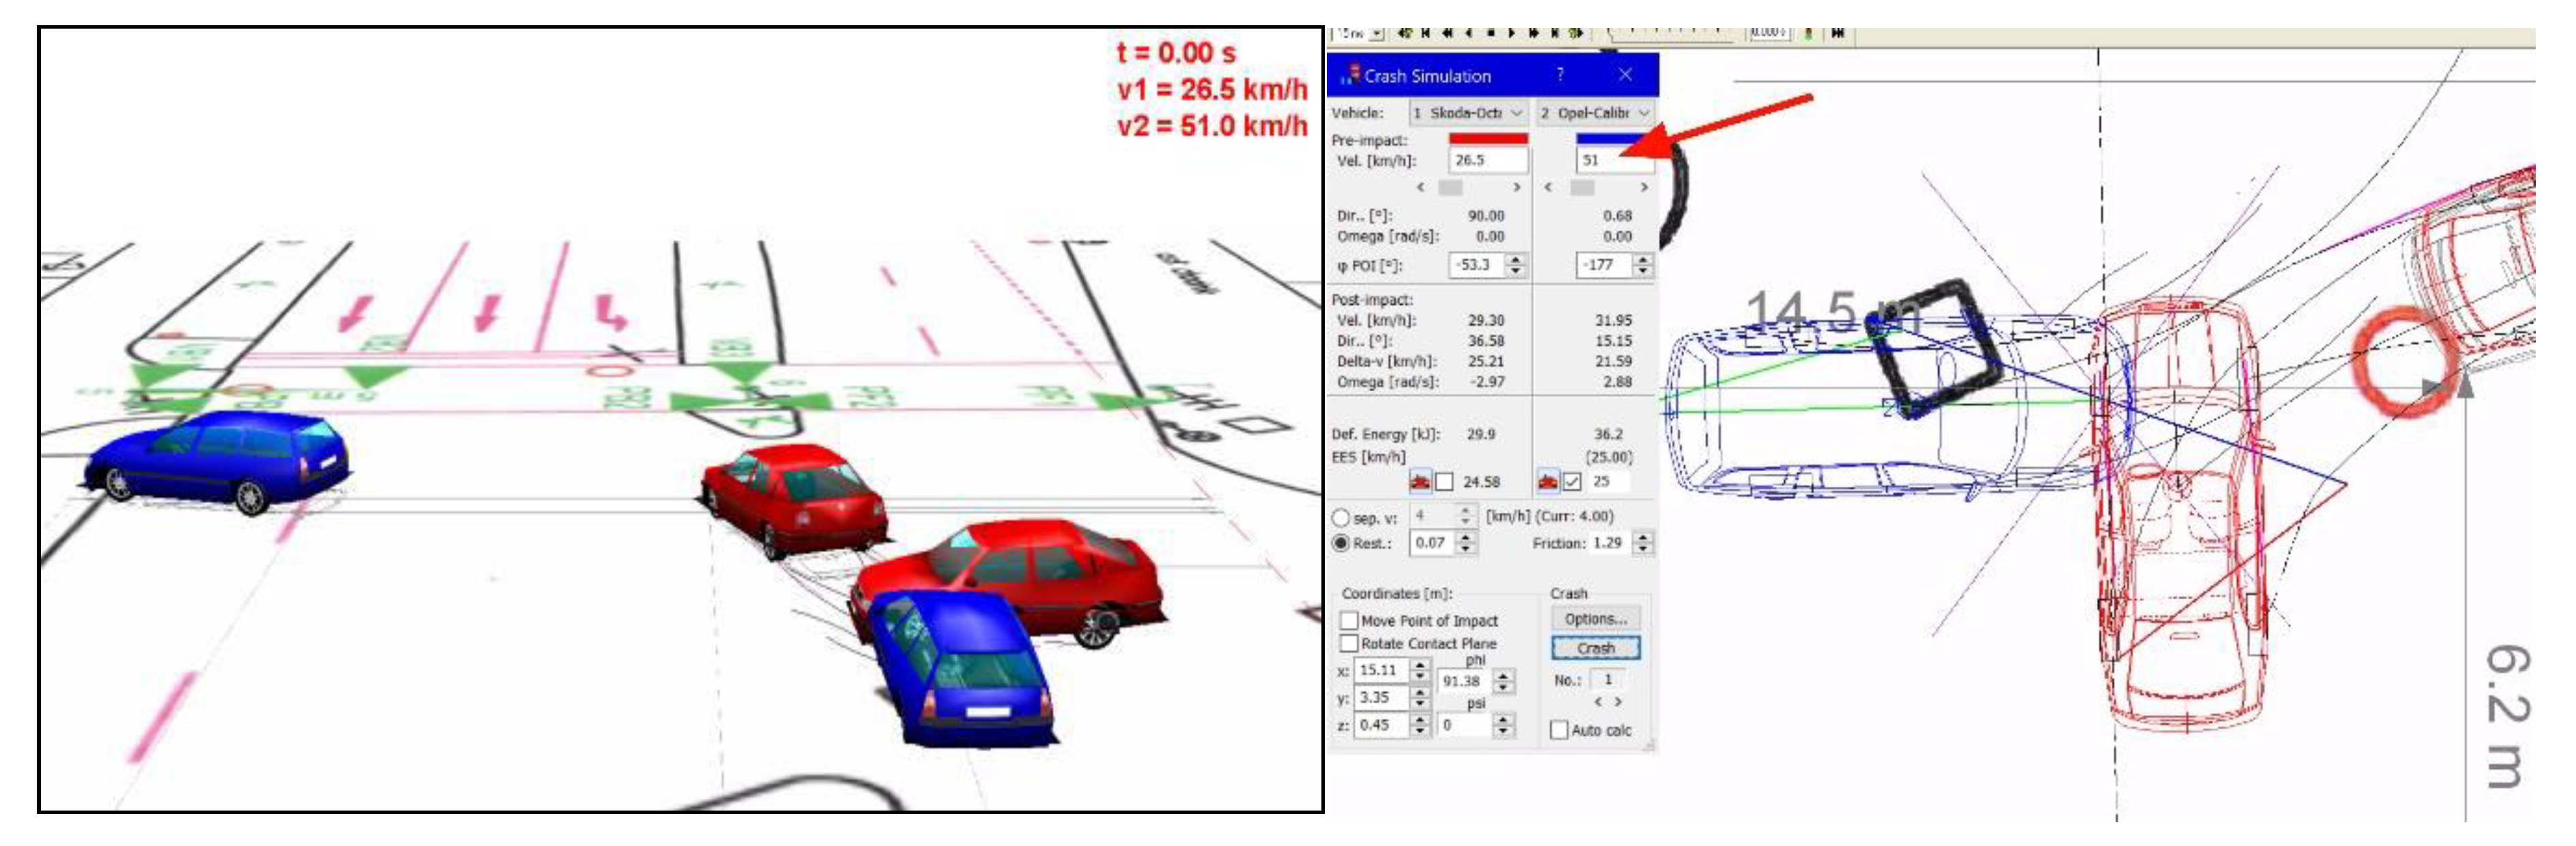
22]. The respective user should master a certain level of the program and should be able to correctly perform the analysis and the simulation of the accident and should also be able to correctly calculate the requested velocities. Thereby, the collision impact speed of the vehicles was specified (see
Figure 6):
- -
The speed of Opel Omega was approximately 51.0 km/h;
- -
The speed of Škoda Octavia was approximately 26.5 km/h.
Before the accident, the Opel Omega was moving at approximately 60 km/h and the Škoda was moving at approximately 36.4 km/h.
The space–time relationship of the mutual vehicle movements before the collision must be considered. The analysis of the before-the-accident course of actions results in mutual vehicle positions in the following key locations:
- -
At the beginning of the drivers’ reactions;
- -
At the location where the vehicles are on the stop line;
- -
At the location from where the accident participants may prevent the collision, as described by the accident participants.
- ⚬
When the green light for the driver of Opel turned on at the previous junction, he was approximately 15 m away from the stationary vehicles and he was driving at about 60 km/h.
- ⚬
The driver of Škoda stated that when he was about 5 m in front of the traffic lights, where the yellow light then turned on, and he was driving at about 30 to 40 km/h.
4.2. Movement of Vehicles in Relation to Light Signaling
In the second part of the analysis, it is necessary to obtain the documents concerning the light-controlled junction, including the following pieces of information:
A junction plan with the geometrical parameters and a definition of collision points (
Figure 7);
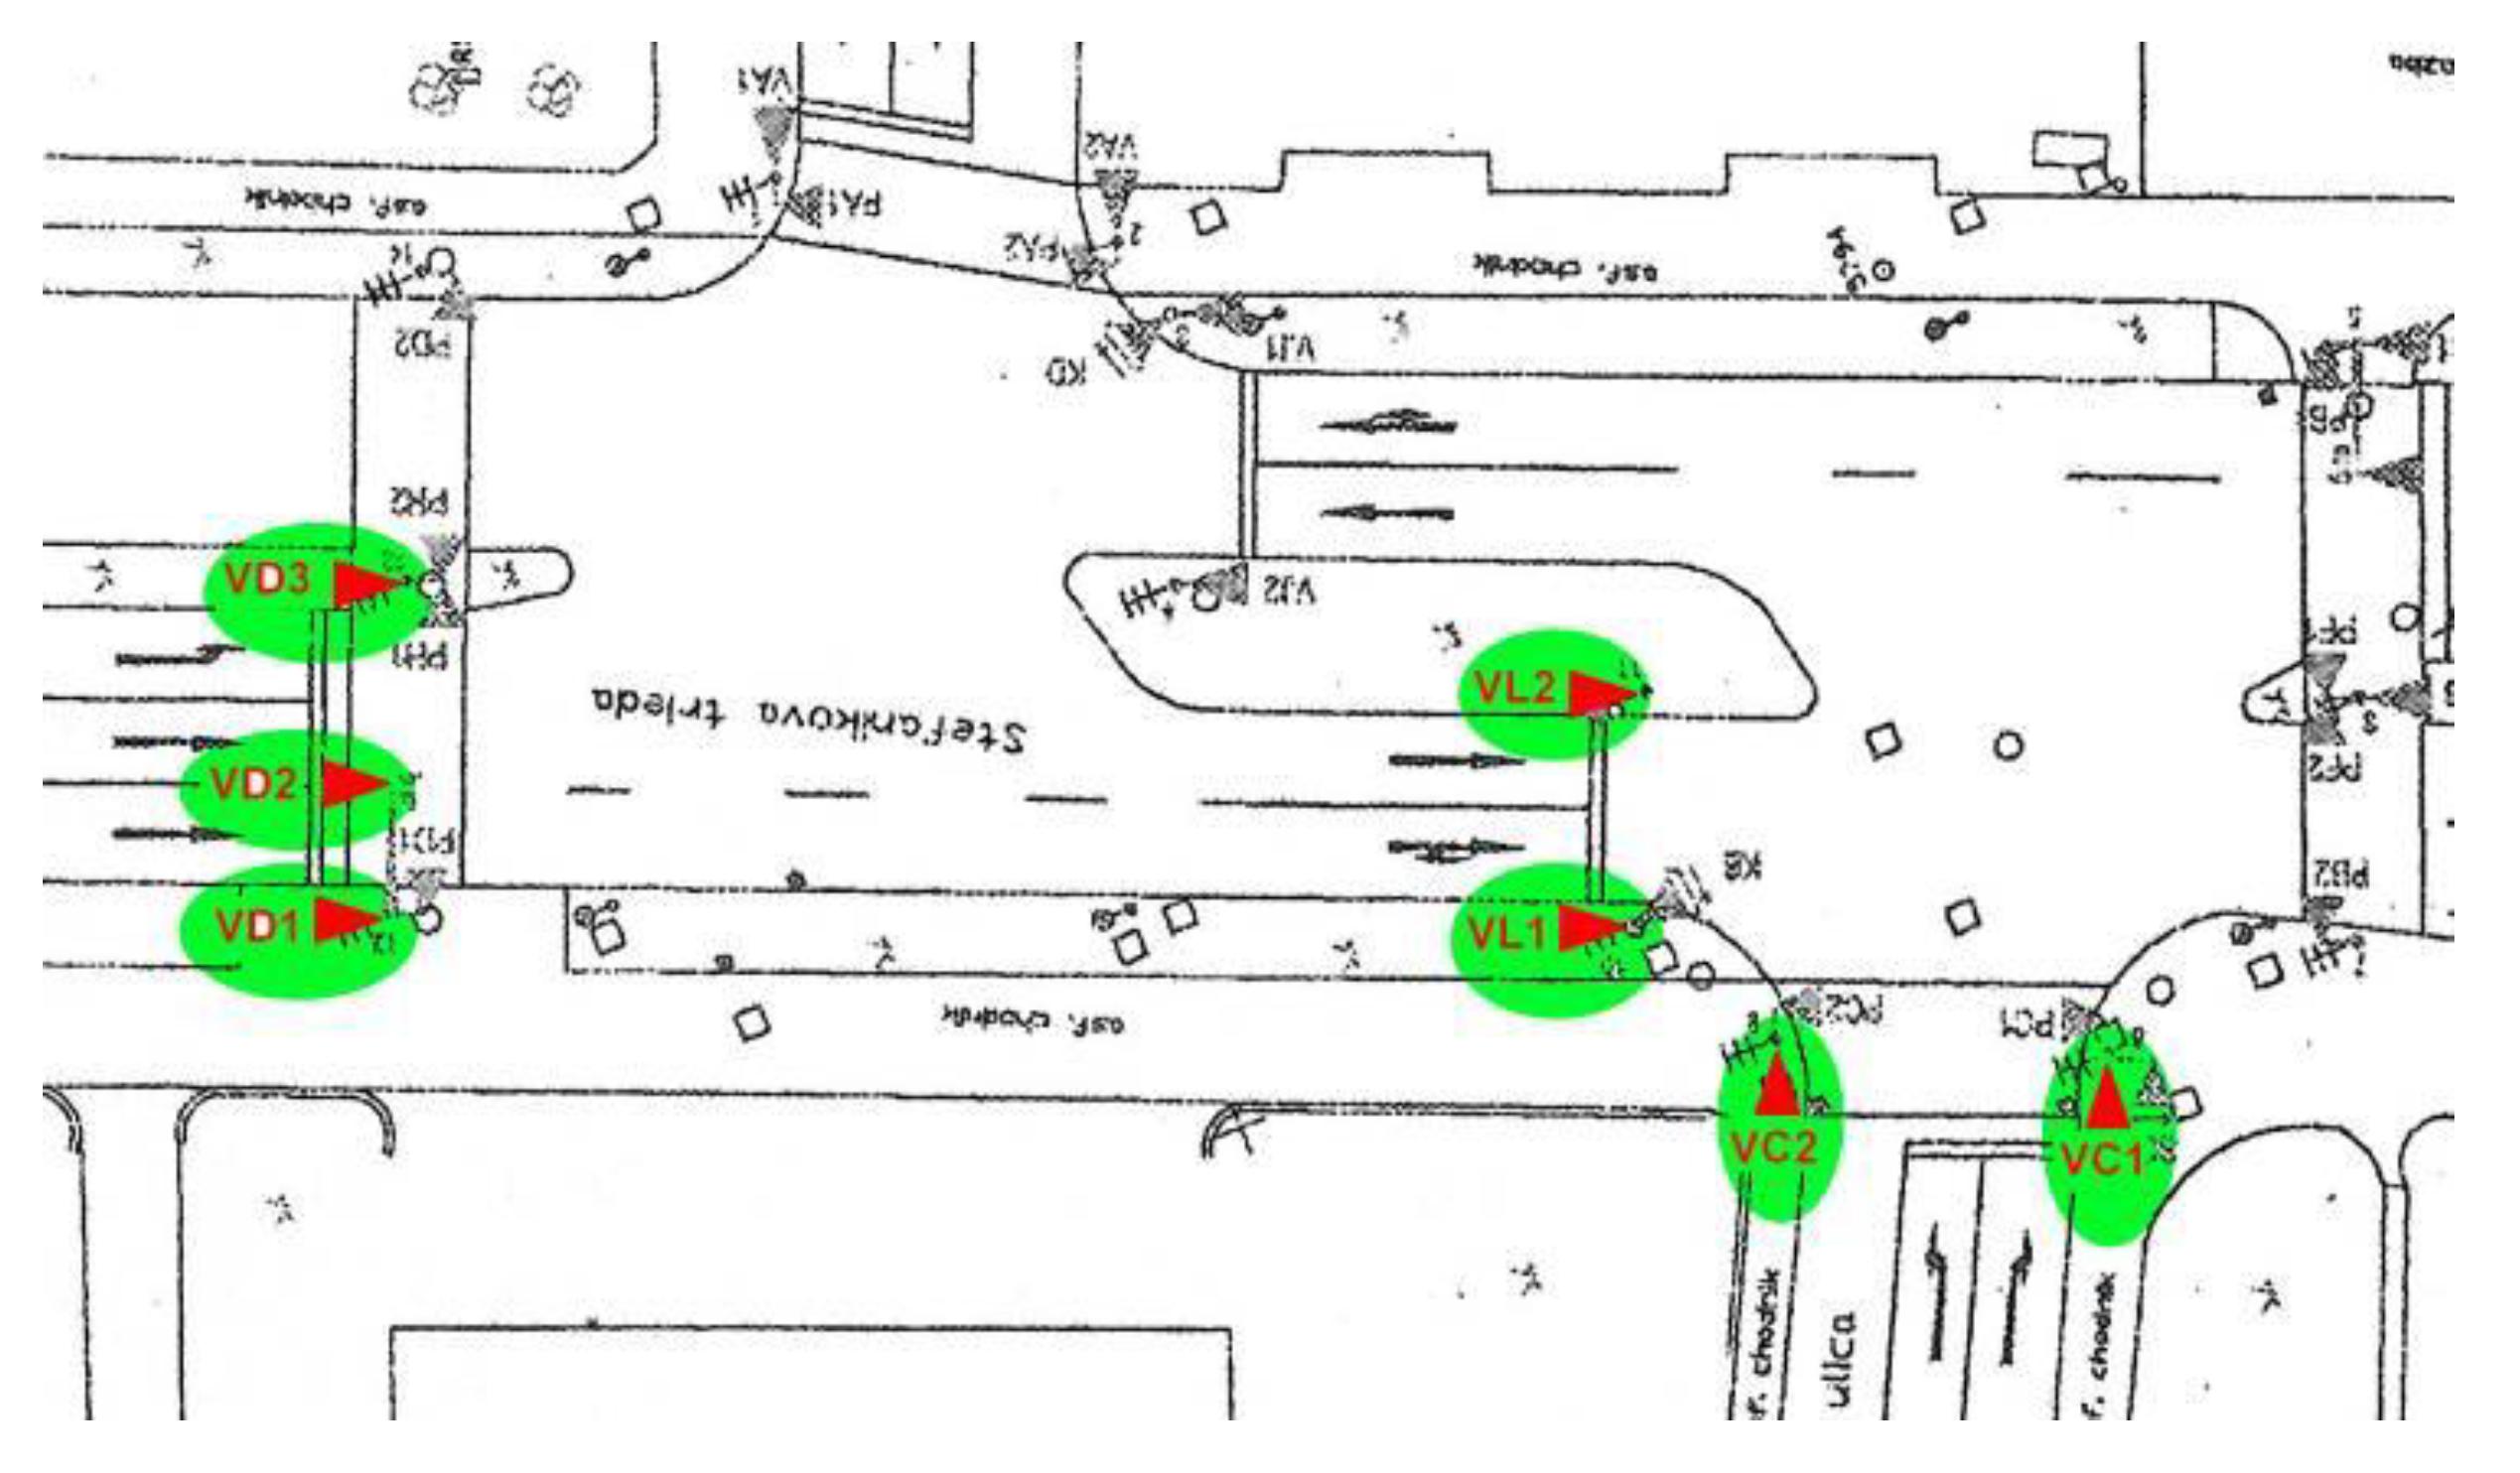
A list and description of signal groups for individual traffic directions and a junction signal light layout scheme (
Figure 8);
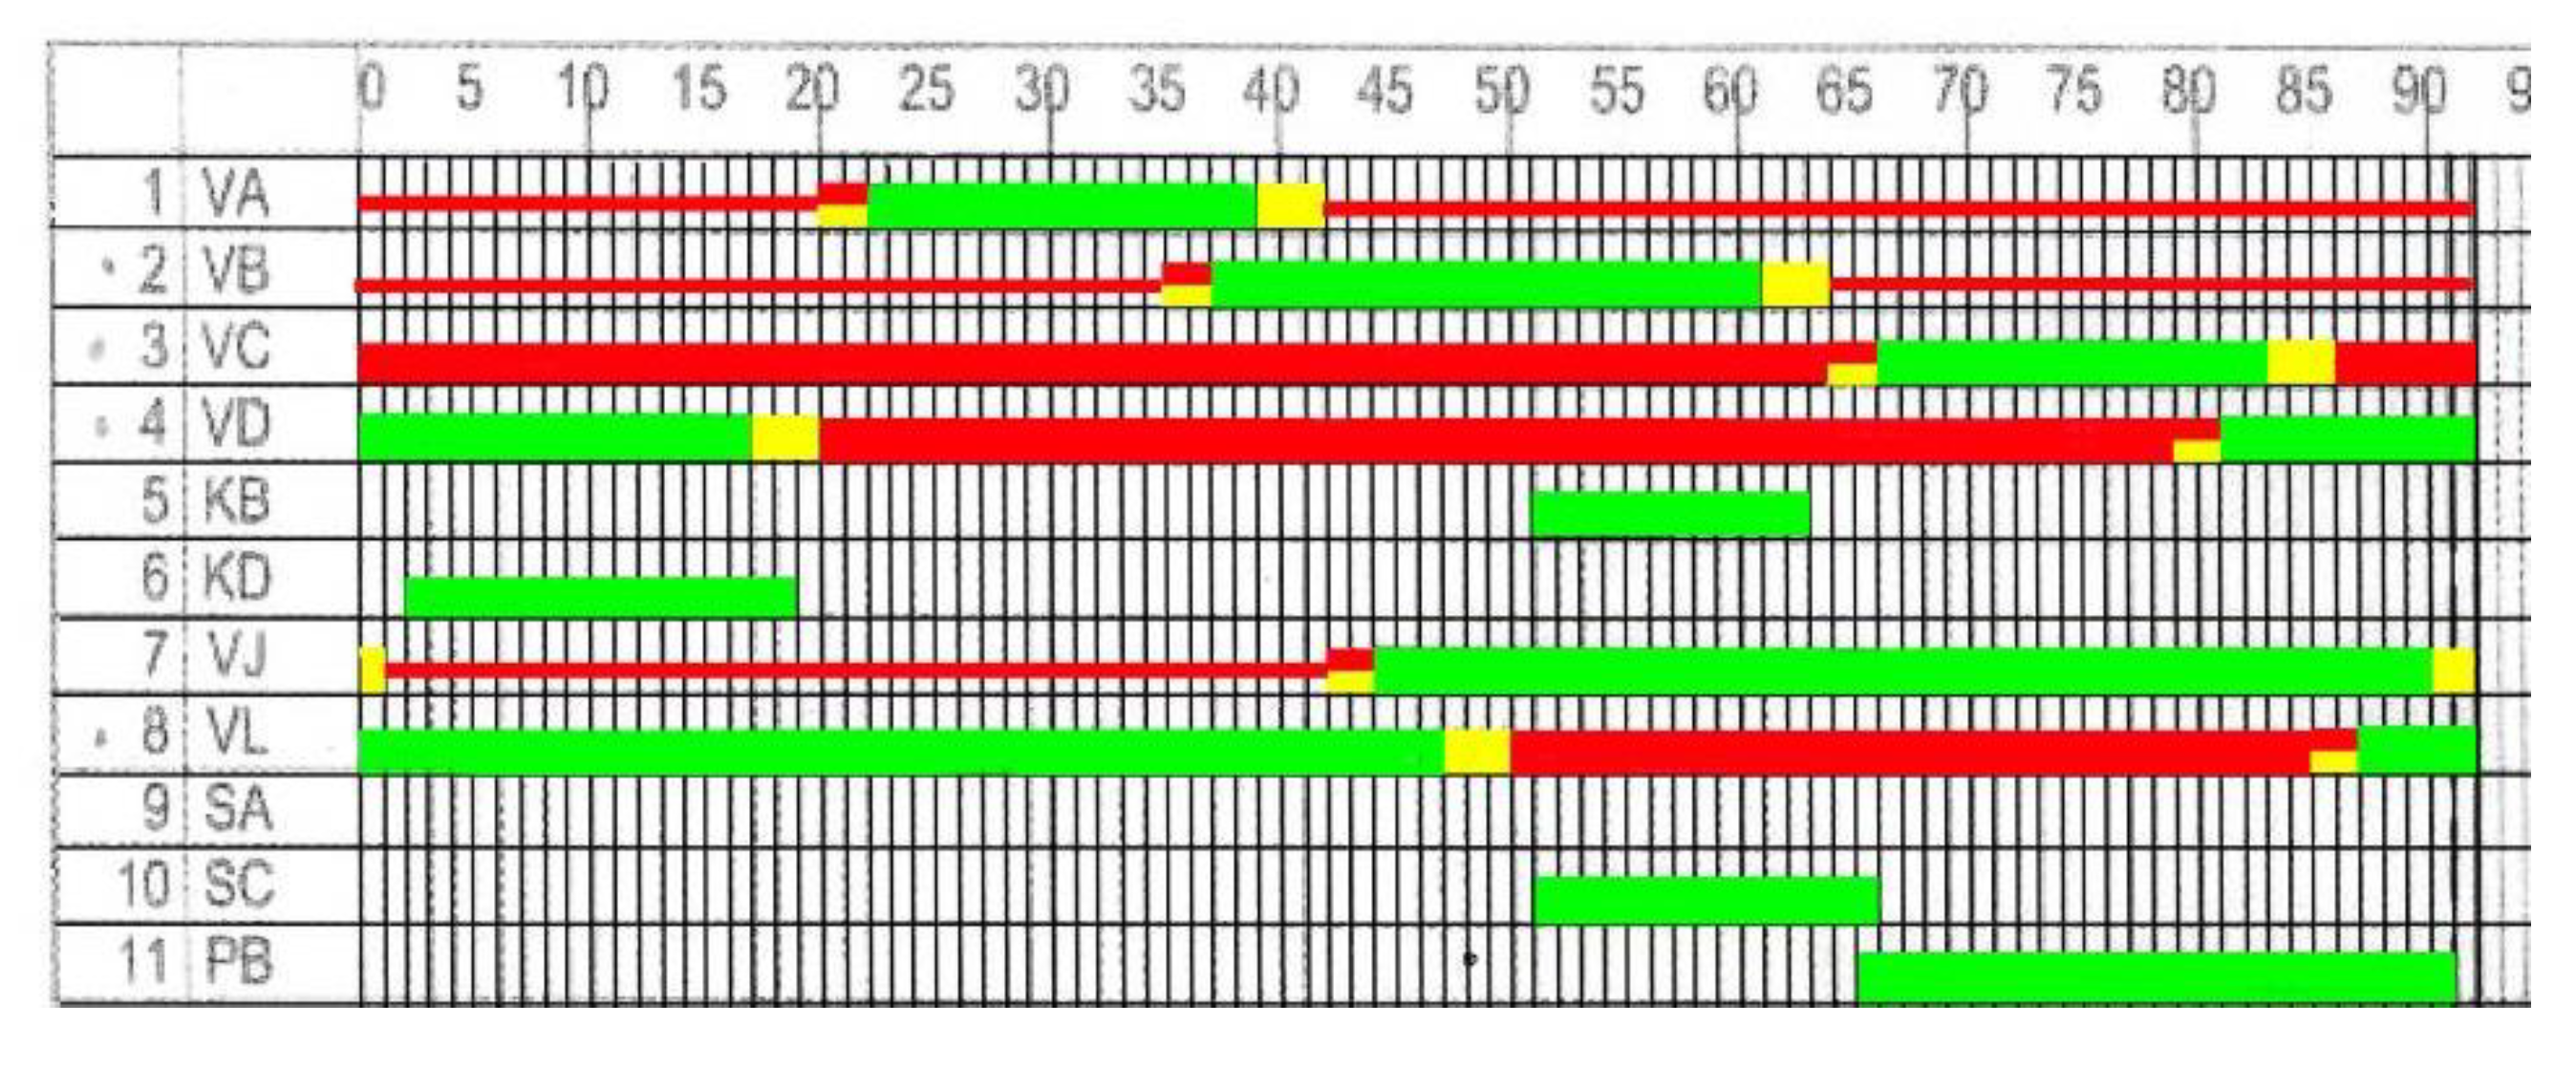
The light signaling device signal plan used at the time of the accident (
Figure 9);
The signaling device light phase layout plan of the junction;
The meantime table;
The identification of the control cycle time;
The obtainment of information about the fixed or dynamic control of the light junction and the mode the junction was operated at the time of the accident.
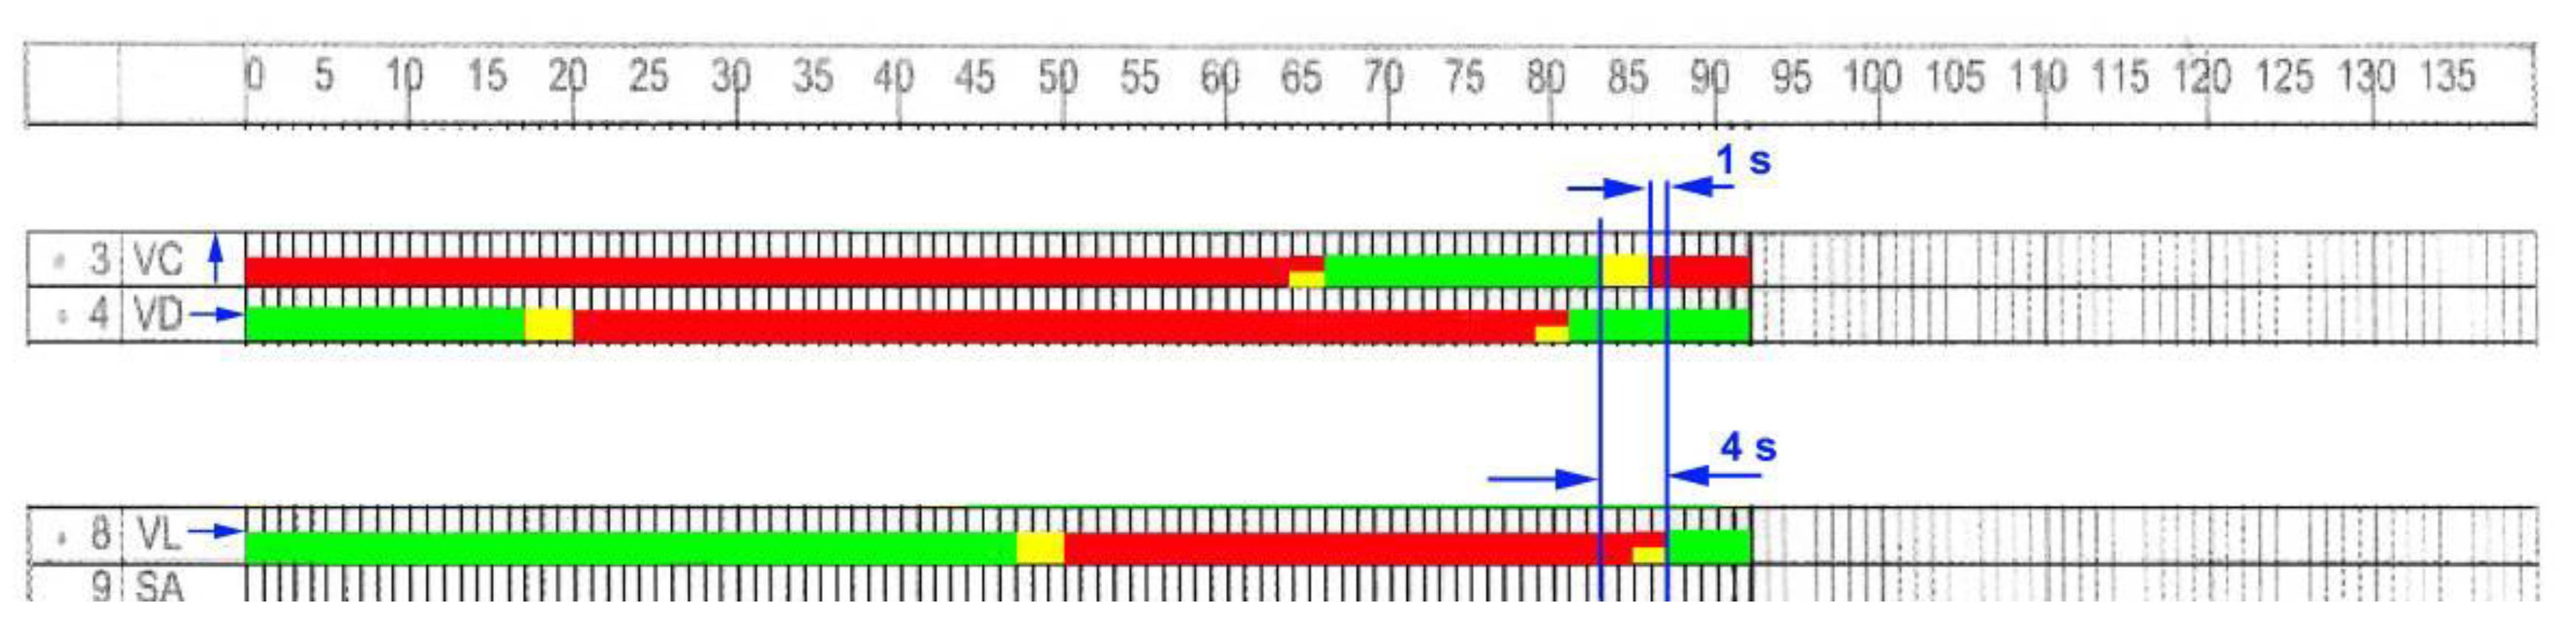
From the stated information, one may assign the respective light groups for the individual directions of movements of the vehicles involved in the accident, as well as choose light sequences for respective light groups from a light signal plan (see
Figure 10).
4.2.1. Solving the Before-the-Accident Action Using an s–t Diagram
After solving the movements of the involved vehicles, we evaluated the accident by means of a graphic method using an s–t diagram, in which we used not only the time course of the vehicle movements for individual directions of movements of the vehicles involved in the accident, but also a graphic presentation of the respective signal group lighting course (see
Figure 11). The scale factor of the time course of the signal group’s lighting must correspond to the scale factor of the time range on the s–t diagram.
The position of the graphic sequences of signal groups lighting into the key time points for individual vehicles involved in the accident enables us to evaluate mutual vehicle positions in the decisive locations (the beginning of a driver’s reaction, the location on a stop line, the location of a possible collision prevention, the location of light signal change, etc.).
This graphic solution requires the paper processing of an s–t diagram using a foil with a marked course of changes of signal group lighting sequences for colliding vehicles. The foil is then positioned into time points, where individual vehicles are in key locations. The said method of the accident graphic processing requires multiple manual constructions of an s–t diagram for each alternative traffic situation.
4.2.2. Solution by Means of PC-Crash Program with a Graphic of a Light Signal Plan
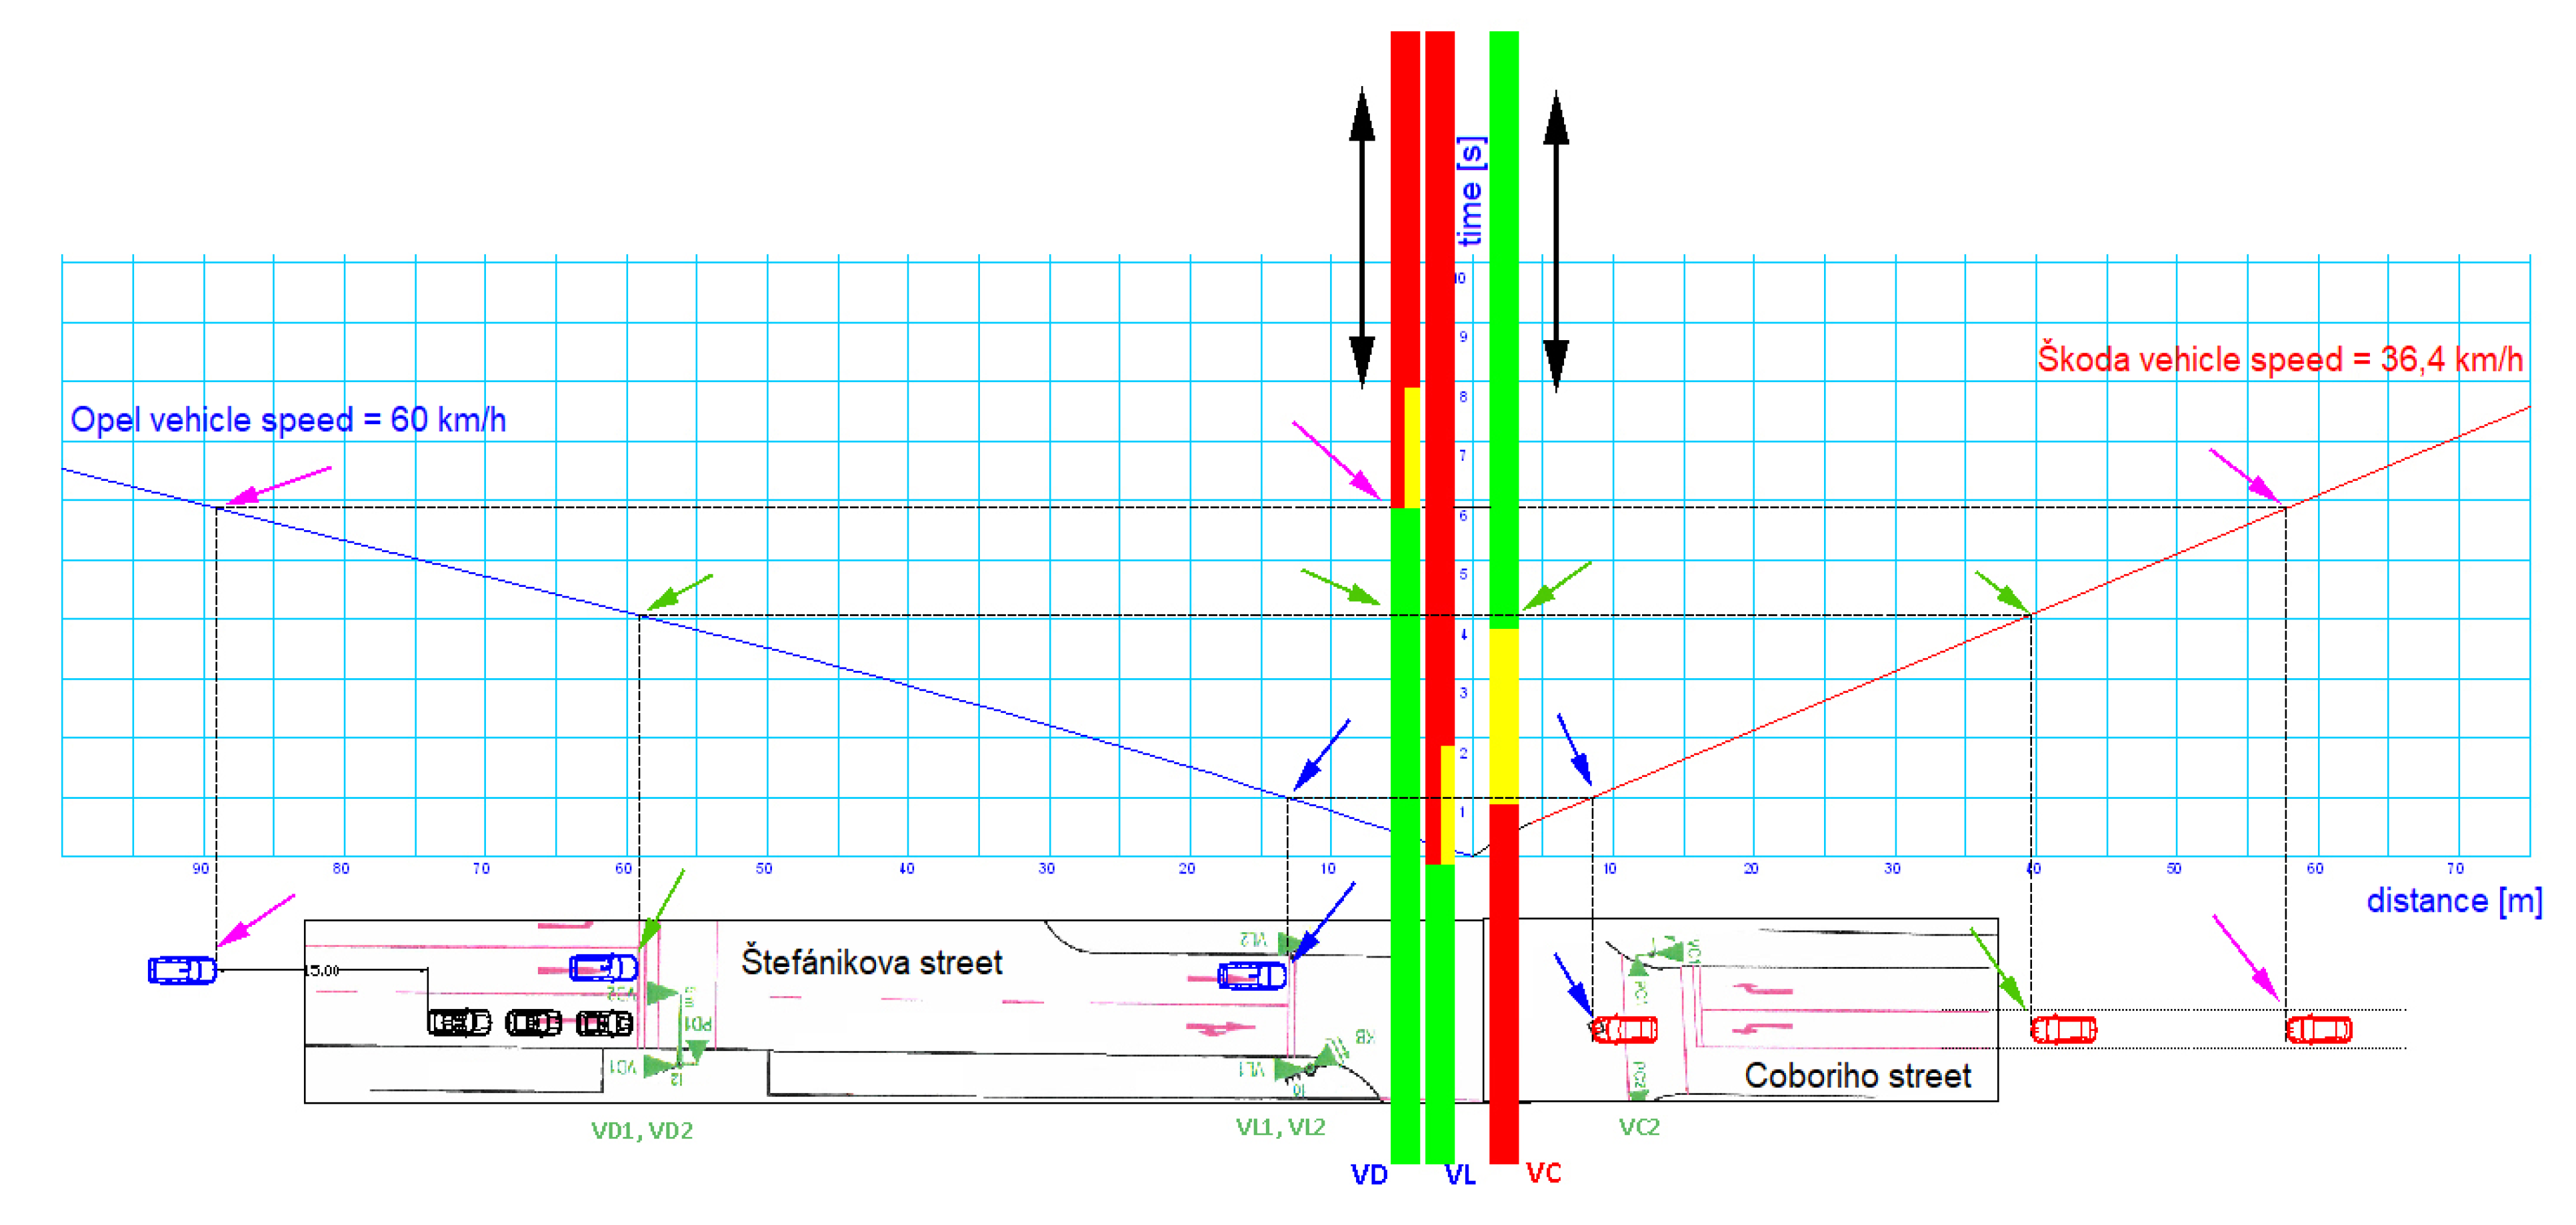
By using modern simulation programs, it is possible to evaluate the course of an accident more progressively and effectively (see
Figure 12).
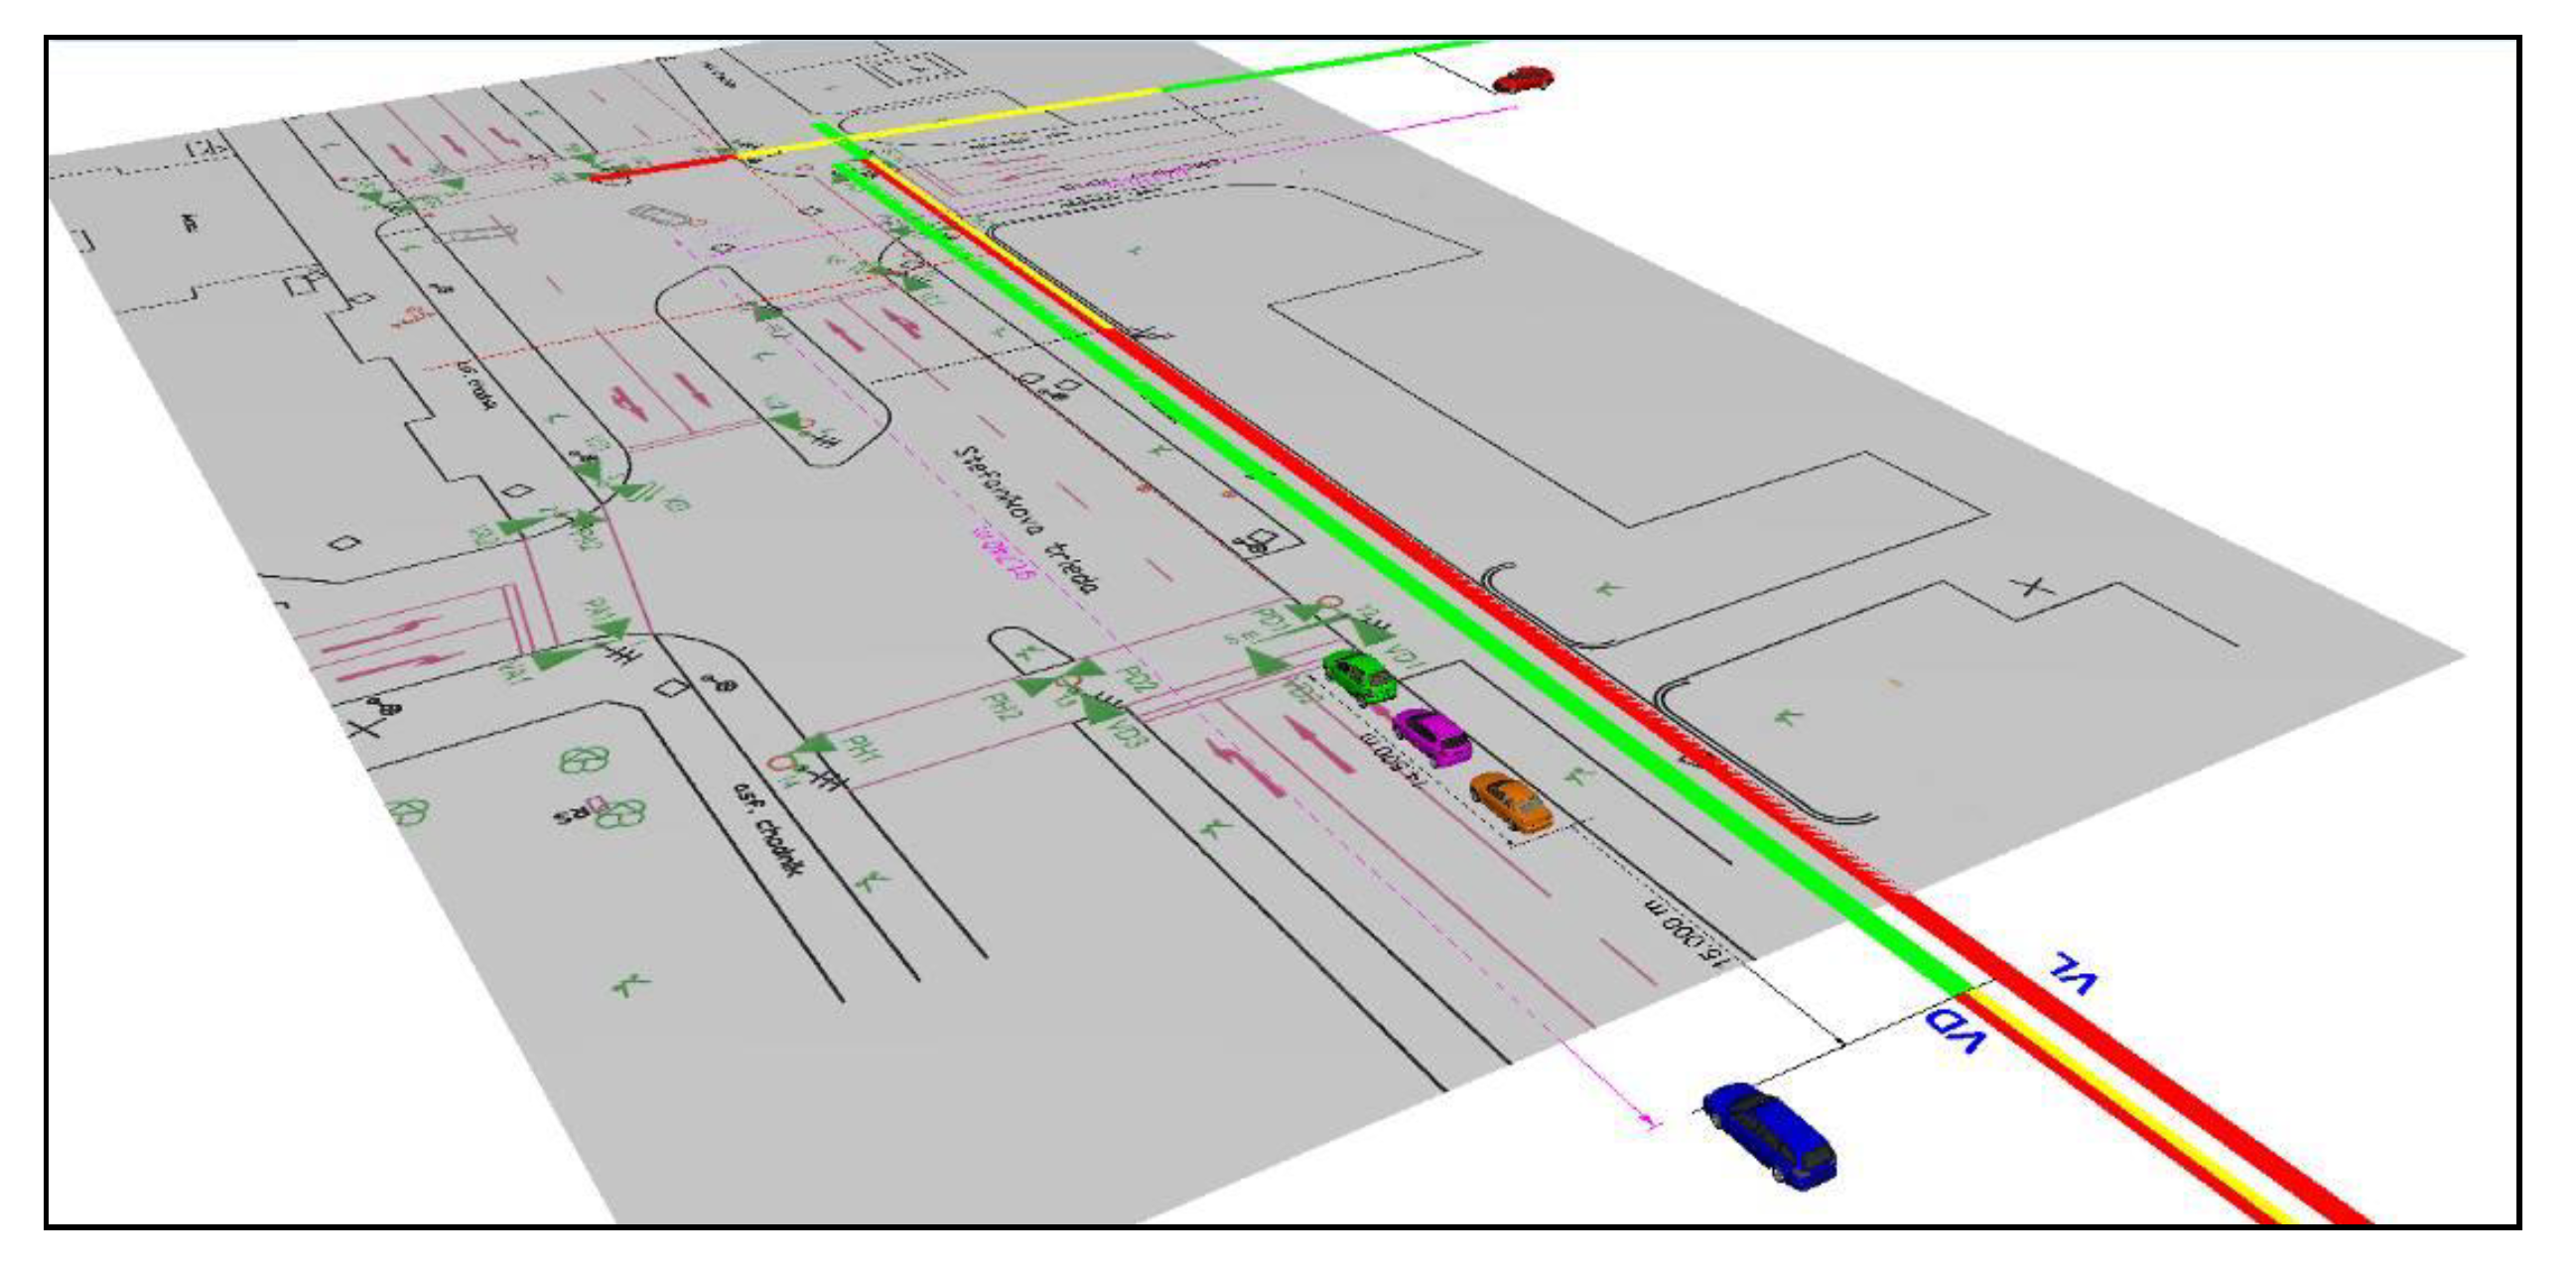
The main advantage of this method is the vehicle movement visualization in relation to the course of changes in signal group lighting, with option variations according to the alternative requirements of traffic situations (positions of vehicles according to individual accident participants and witnesses). Each vehicle position can be evaluated in a dynamic mode, using a 3D model. The simulation program offers the evaluation of mutual vehicle positions from drivers’ points of view (view from the vehicle can be seen in
Figure 13).
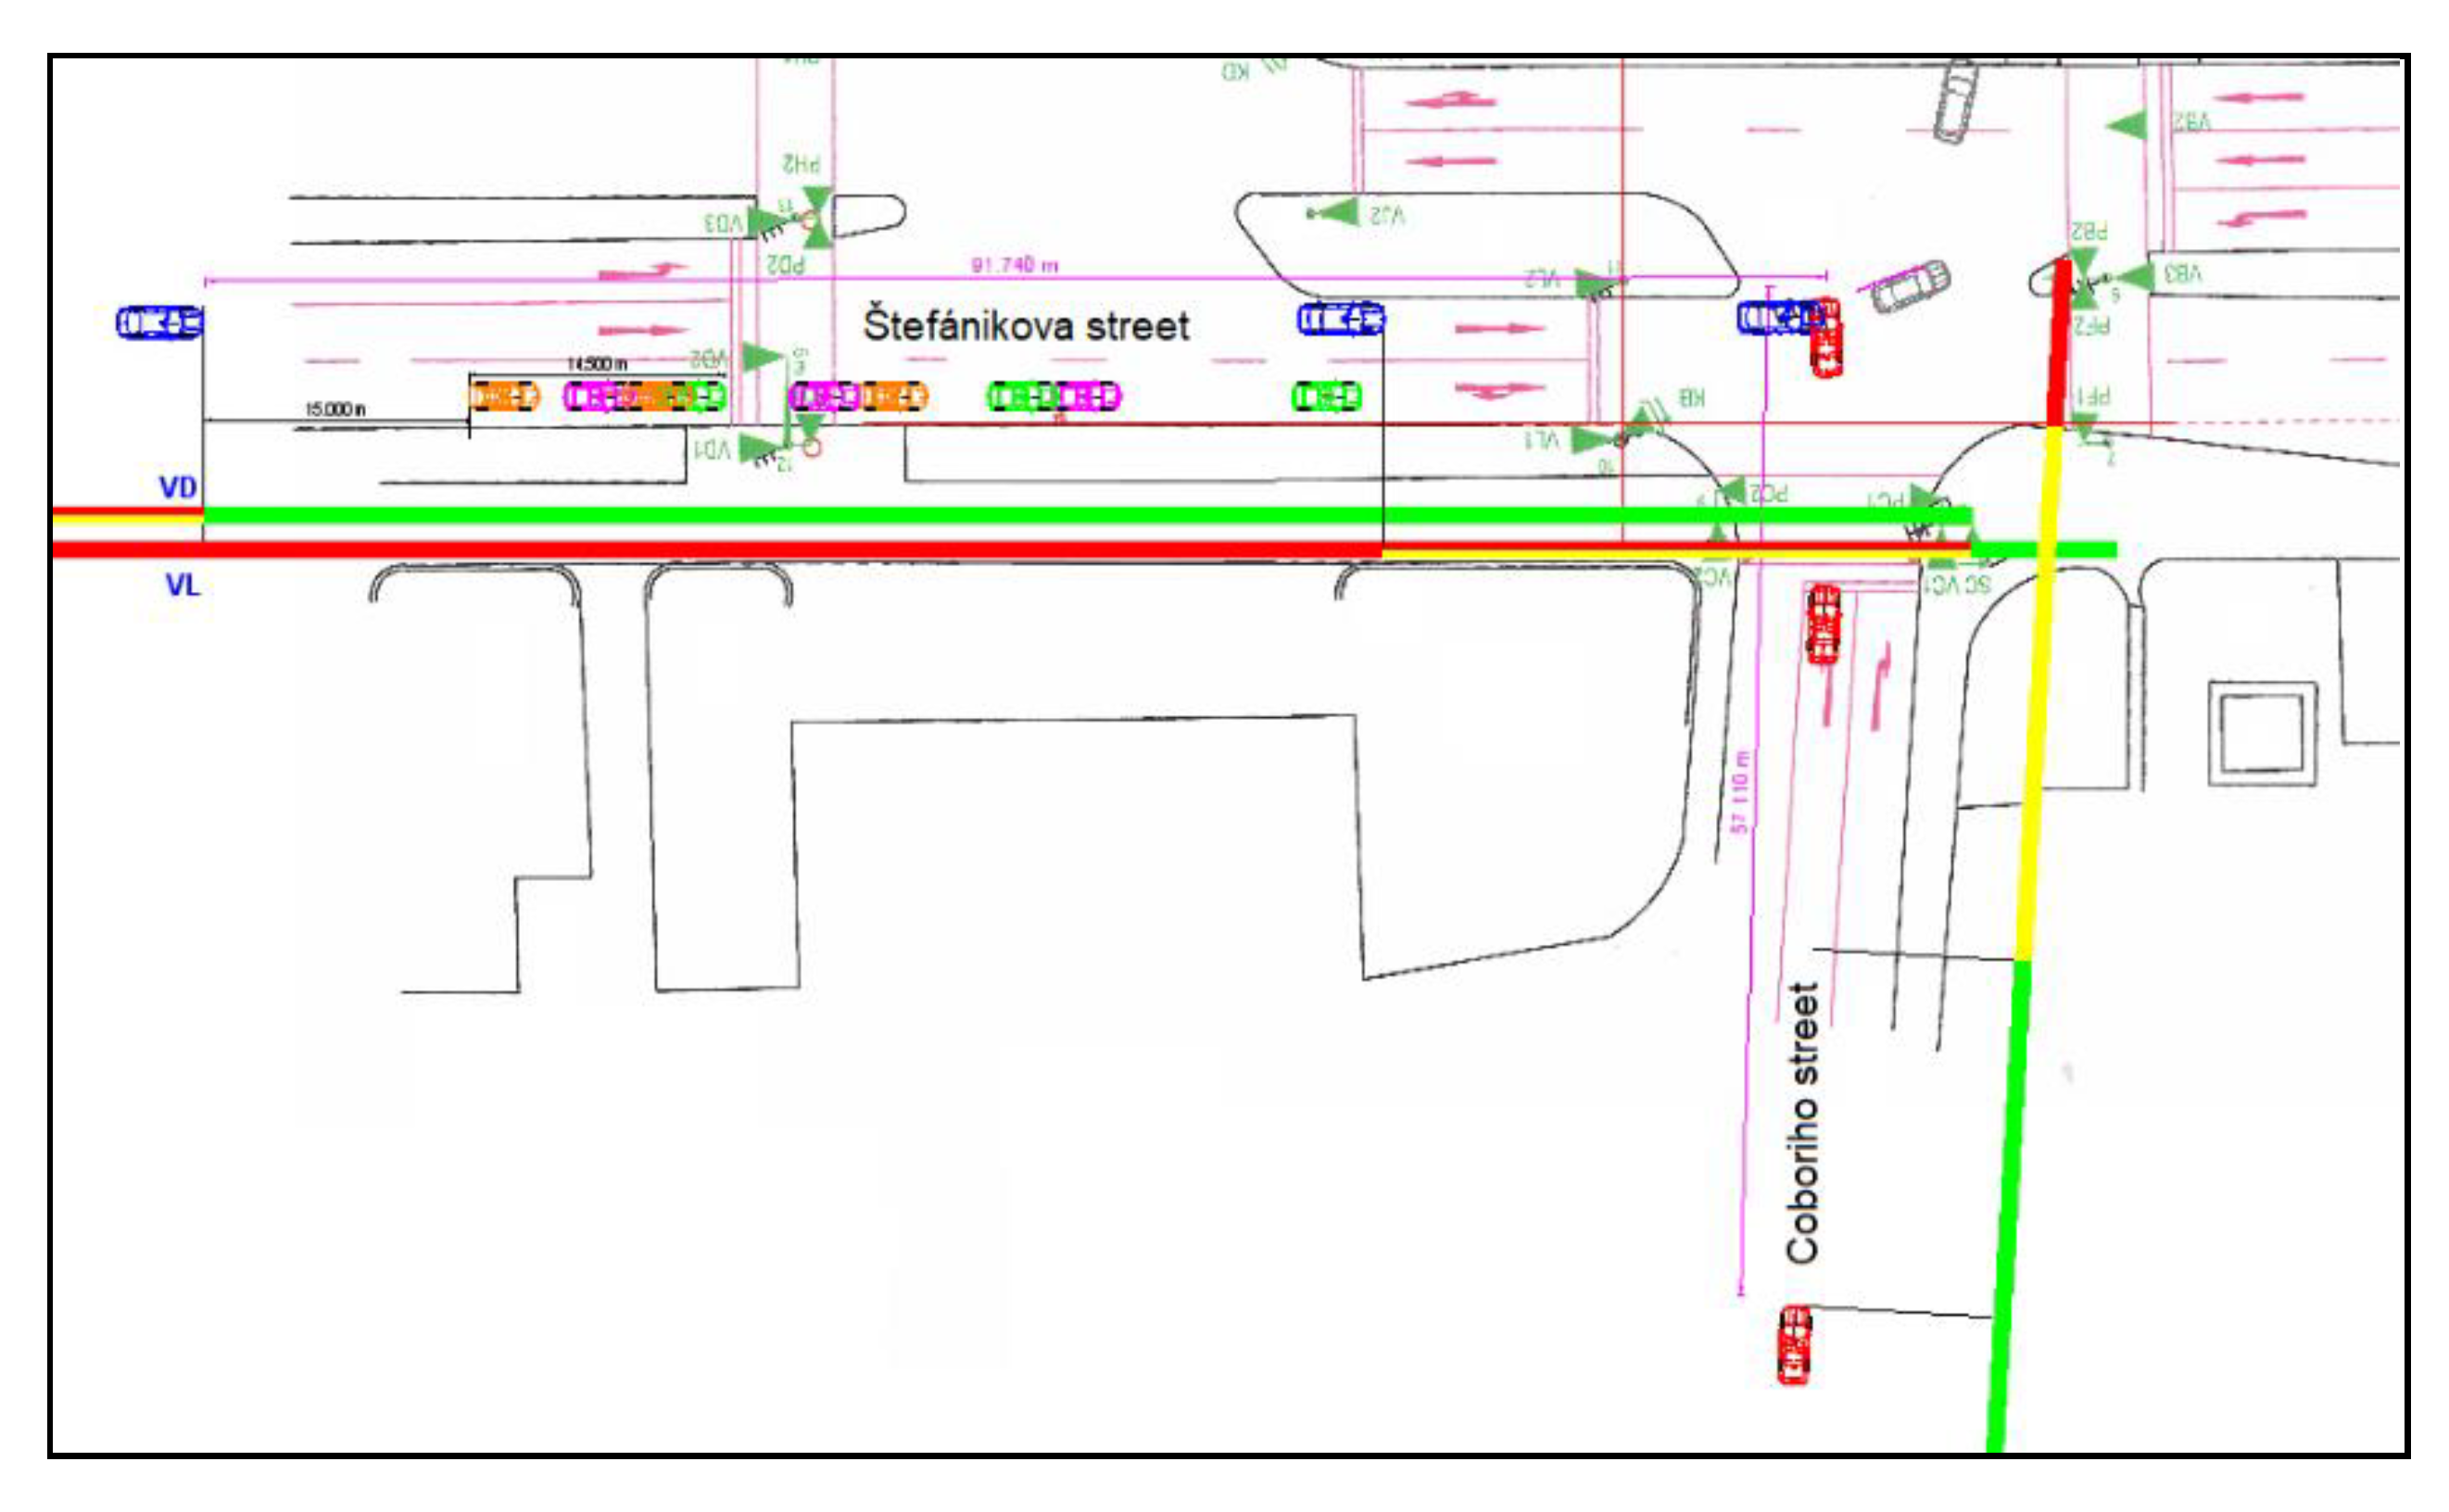
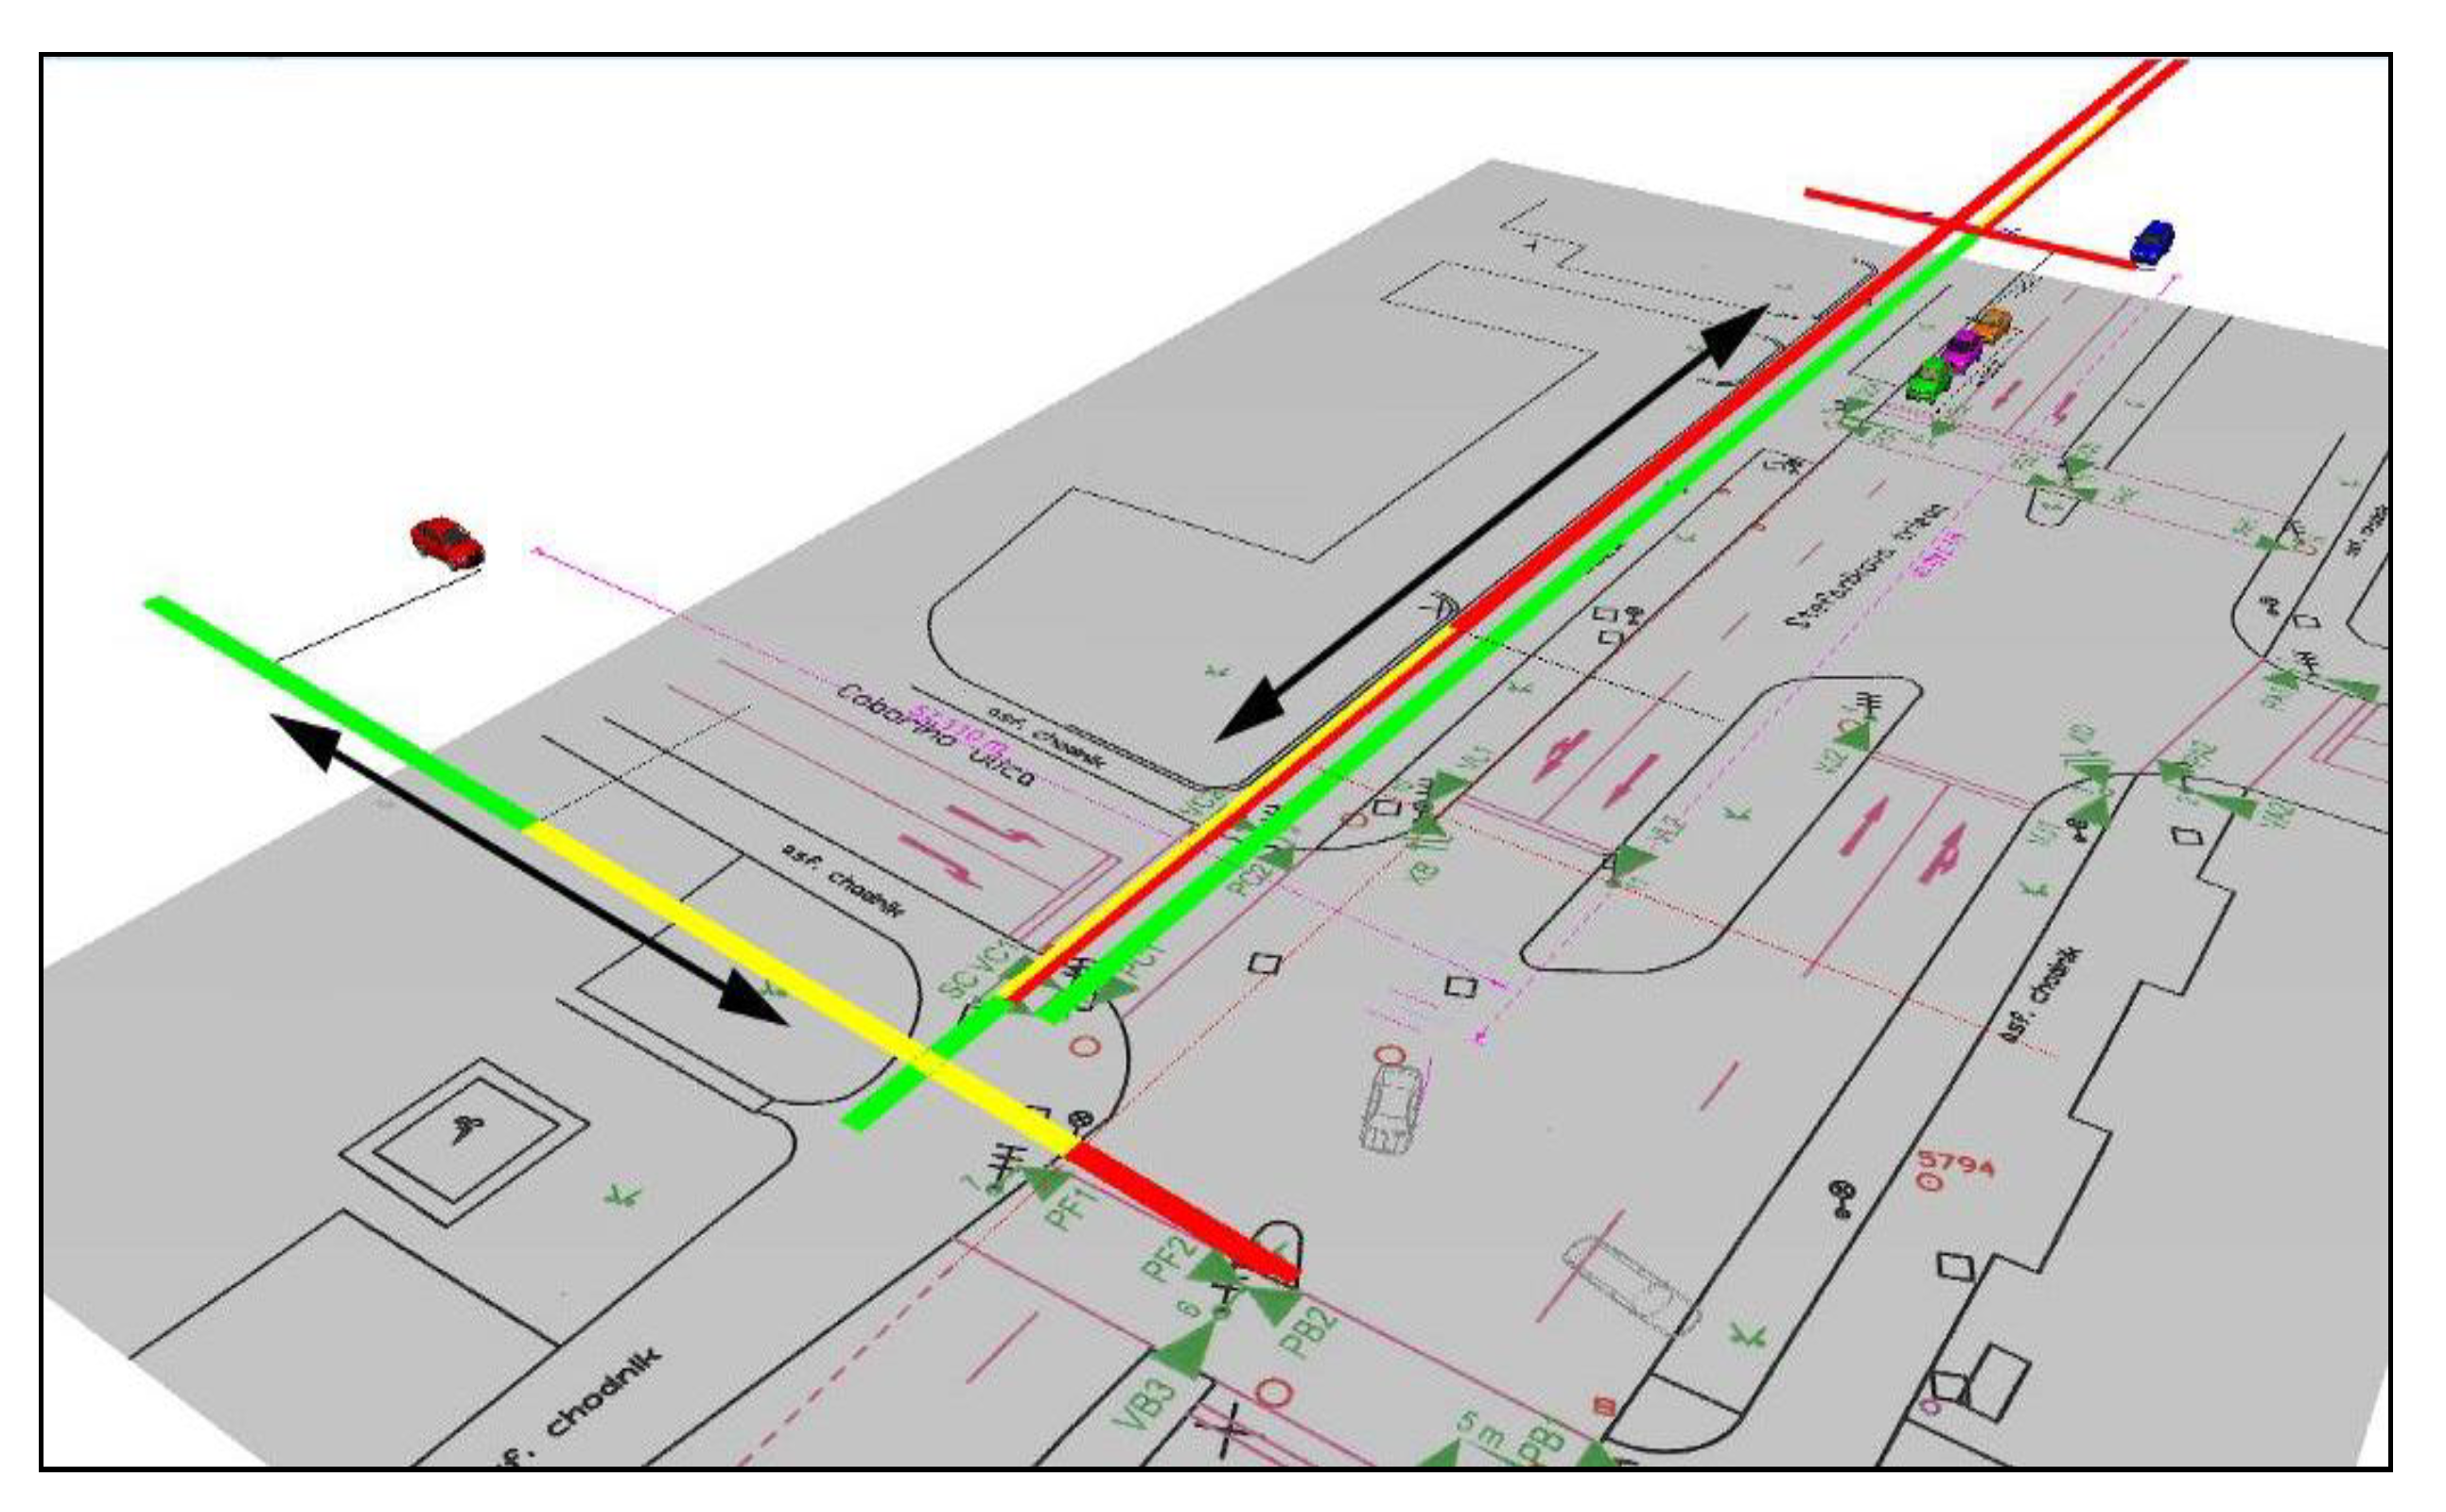
While carrying out the analysis, it is necessary to position the sequence line of light signals for the respective light groups of the respective movement directions of the vehicles involved in the accident (see
Figure 14). The lengths of individual line sections must be true-to-scale and correspond to the distances driven by the vehicles during the lighting of signal groups (red, red–yellow, and green light). The orientation of the lines must correspond to the vehicle position at the time of changing the light in the respective signal group.
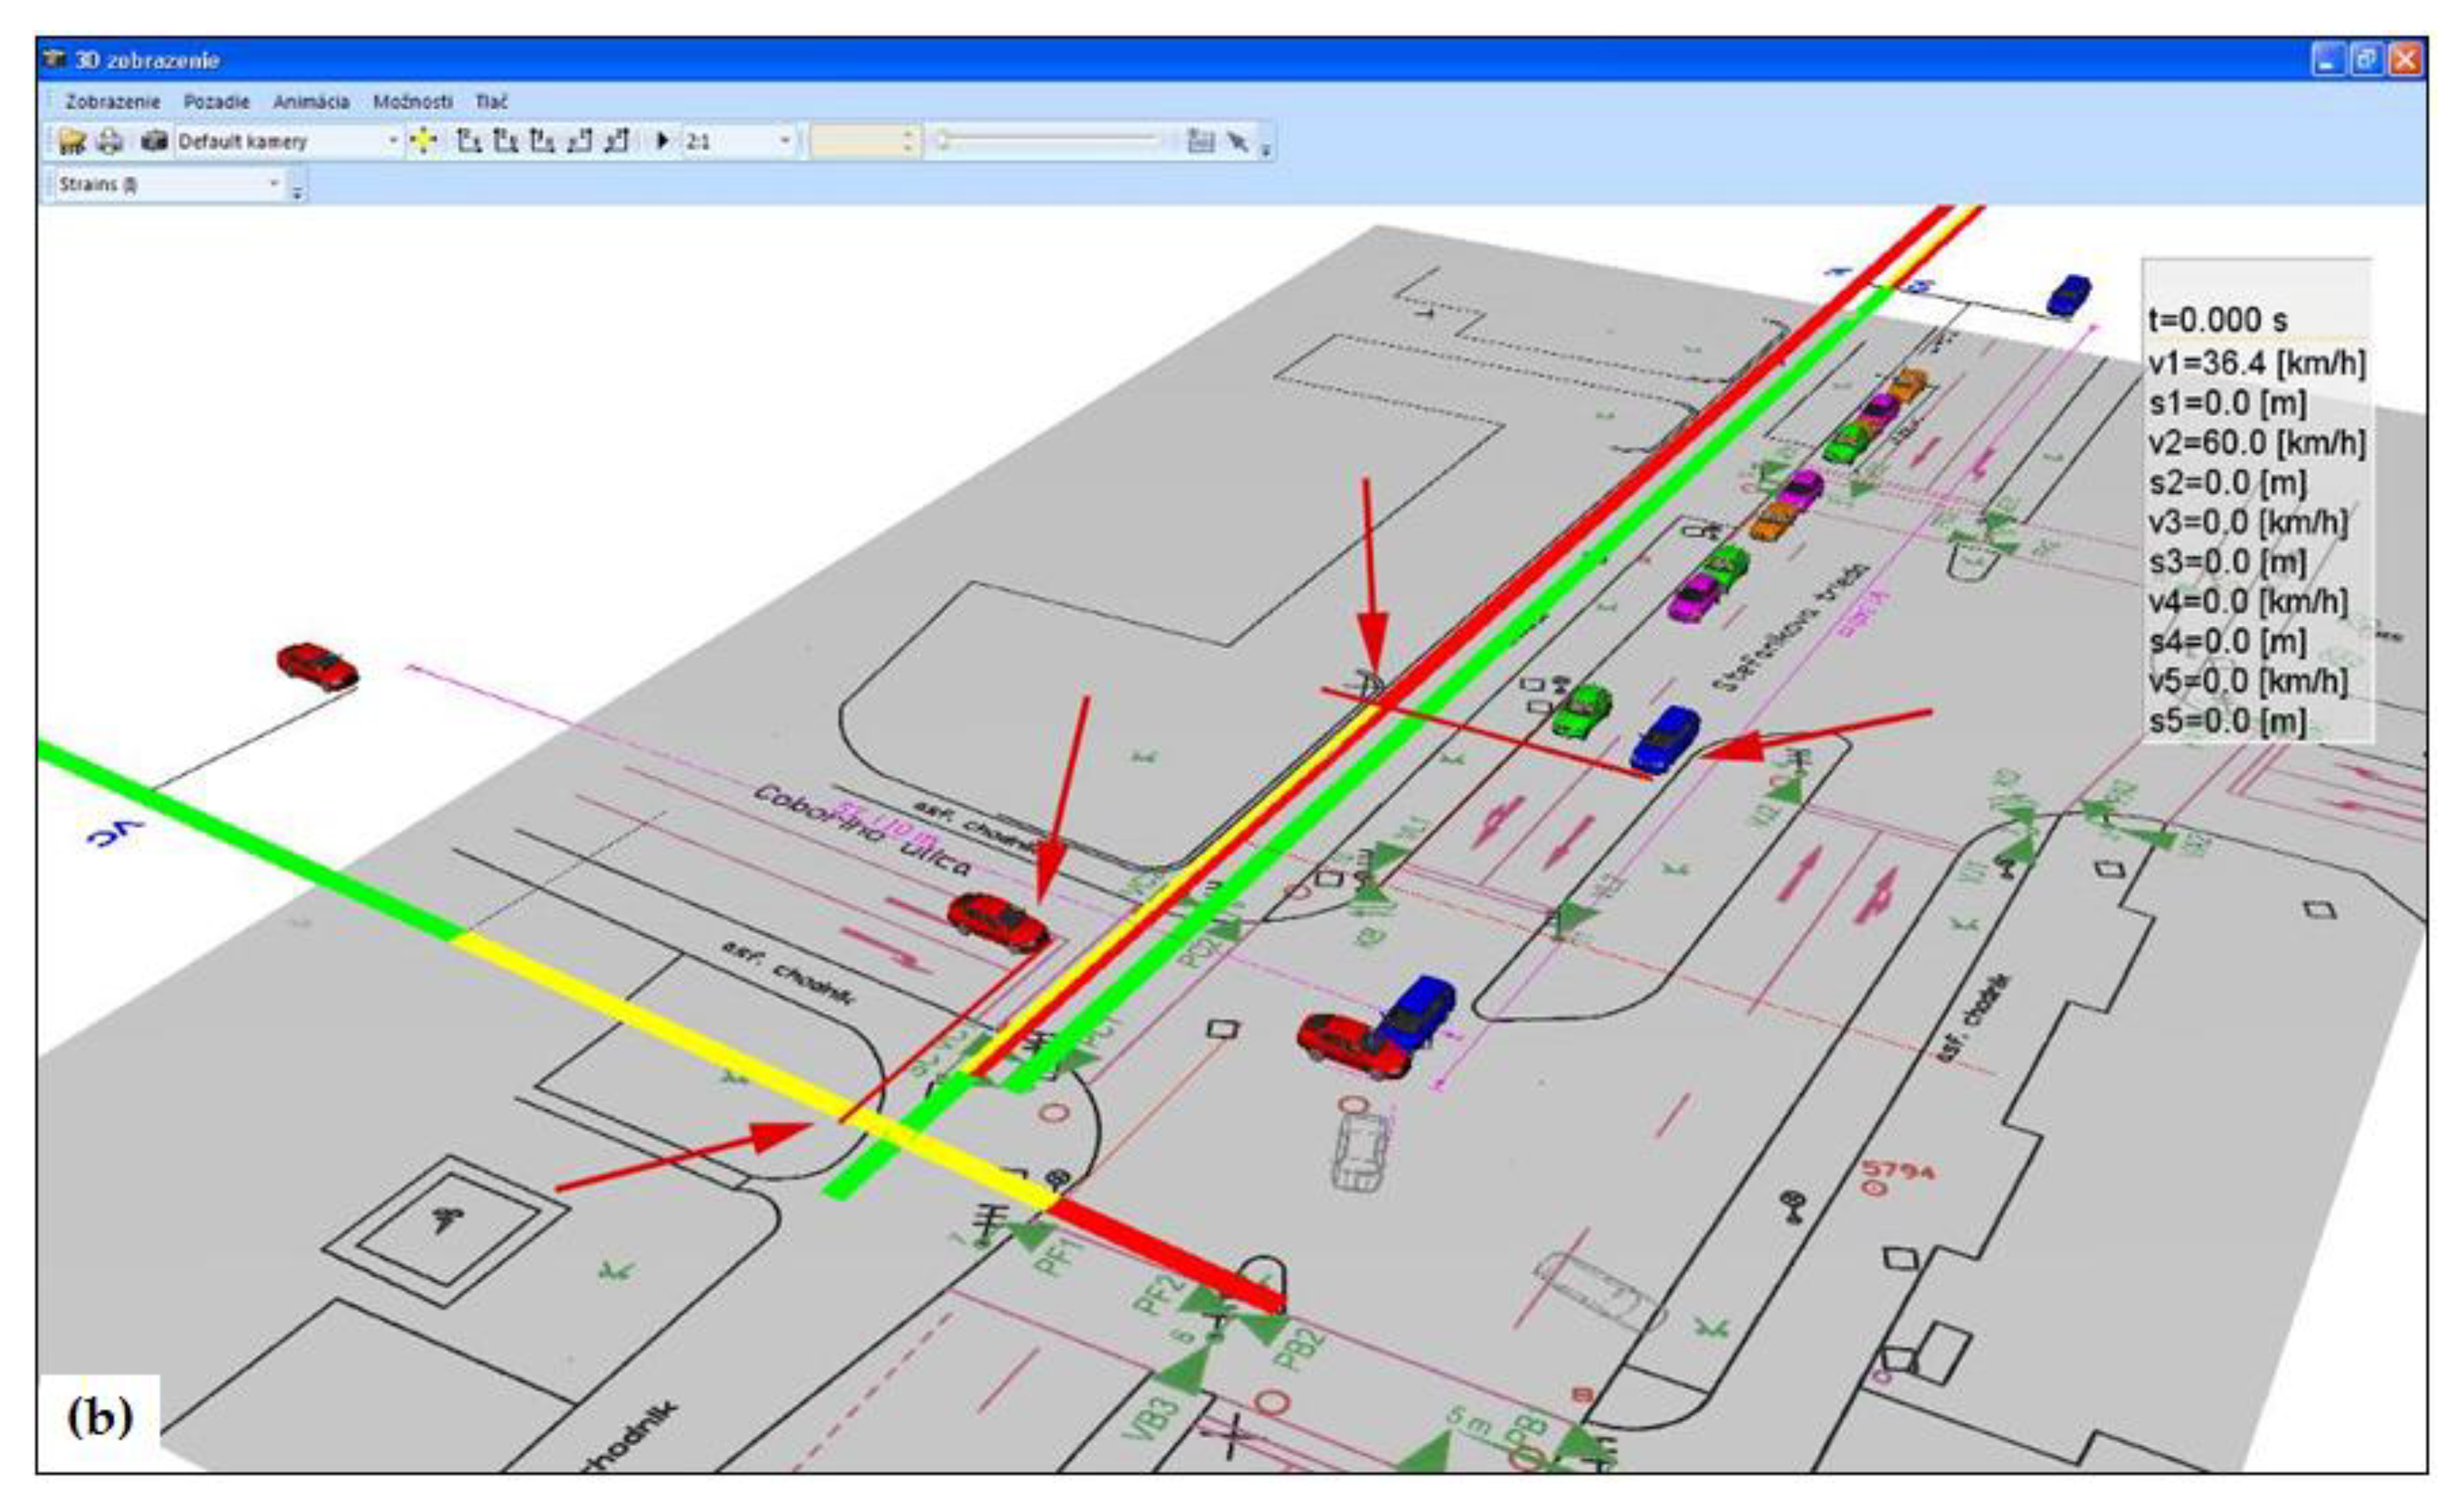
When using this method of accident evaluation, we have an alternative solution with regard to the initial analysis criteria. The advantage of this application is its variability and quick construction of a signal plan as well as its implementation into the graphic environment of the simulation program (see
Figure 15a). Another advantage is the use of the 3D model of a vehicle movement with the evaluation of view conditions from the particular vehicles, together with a simultaneous vehicle position assessment (see
Figure 15b).
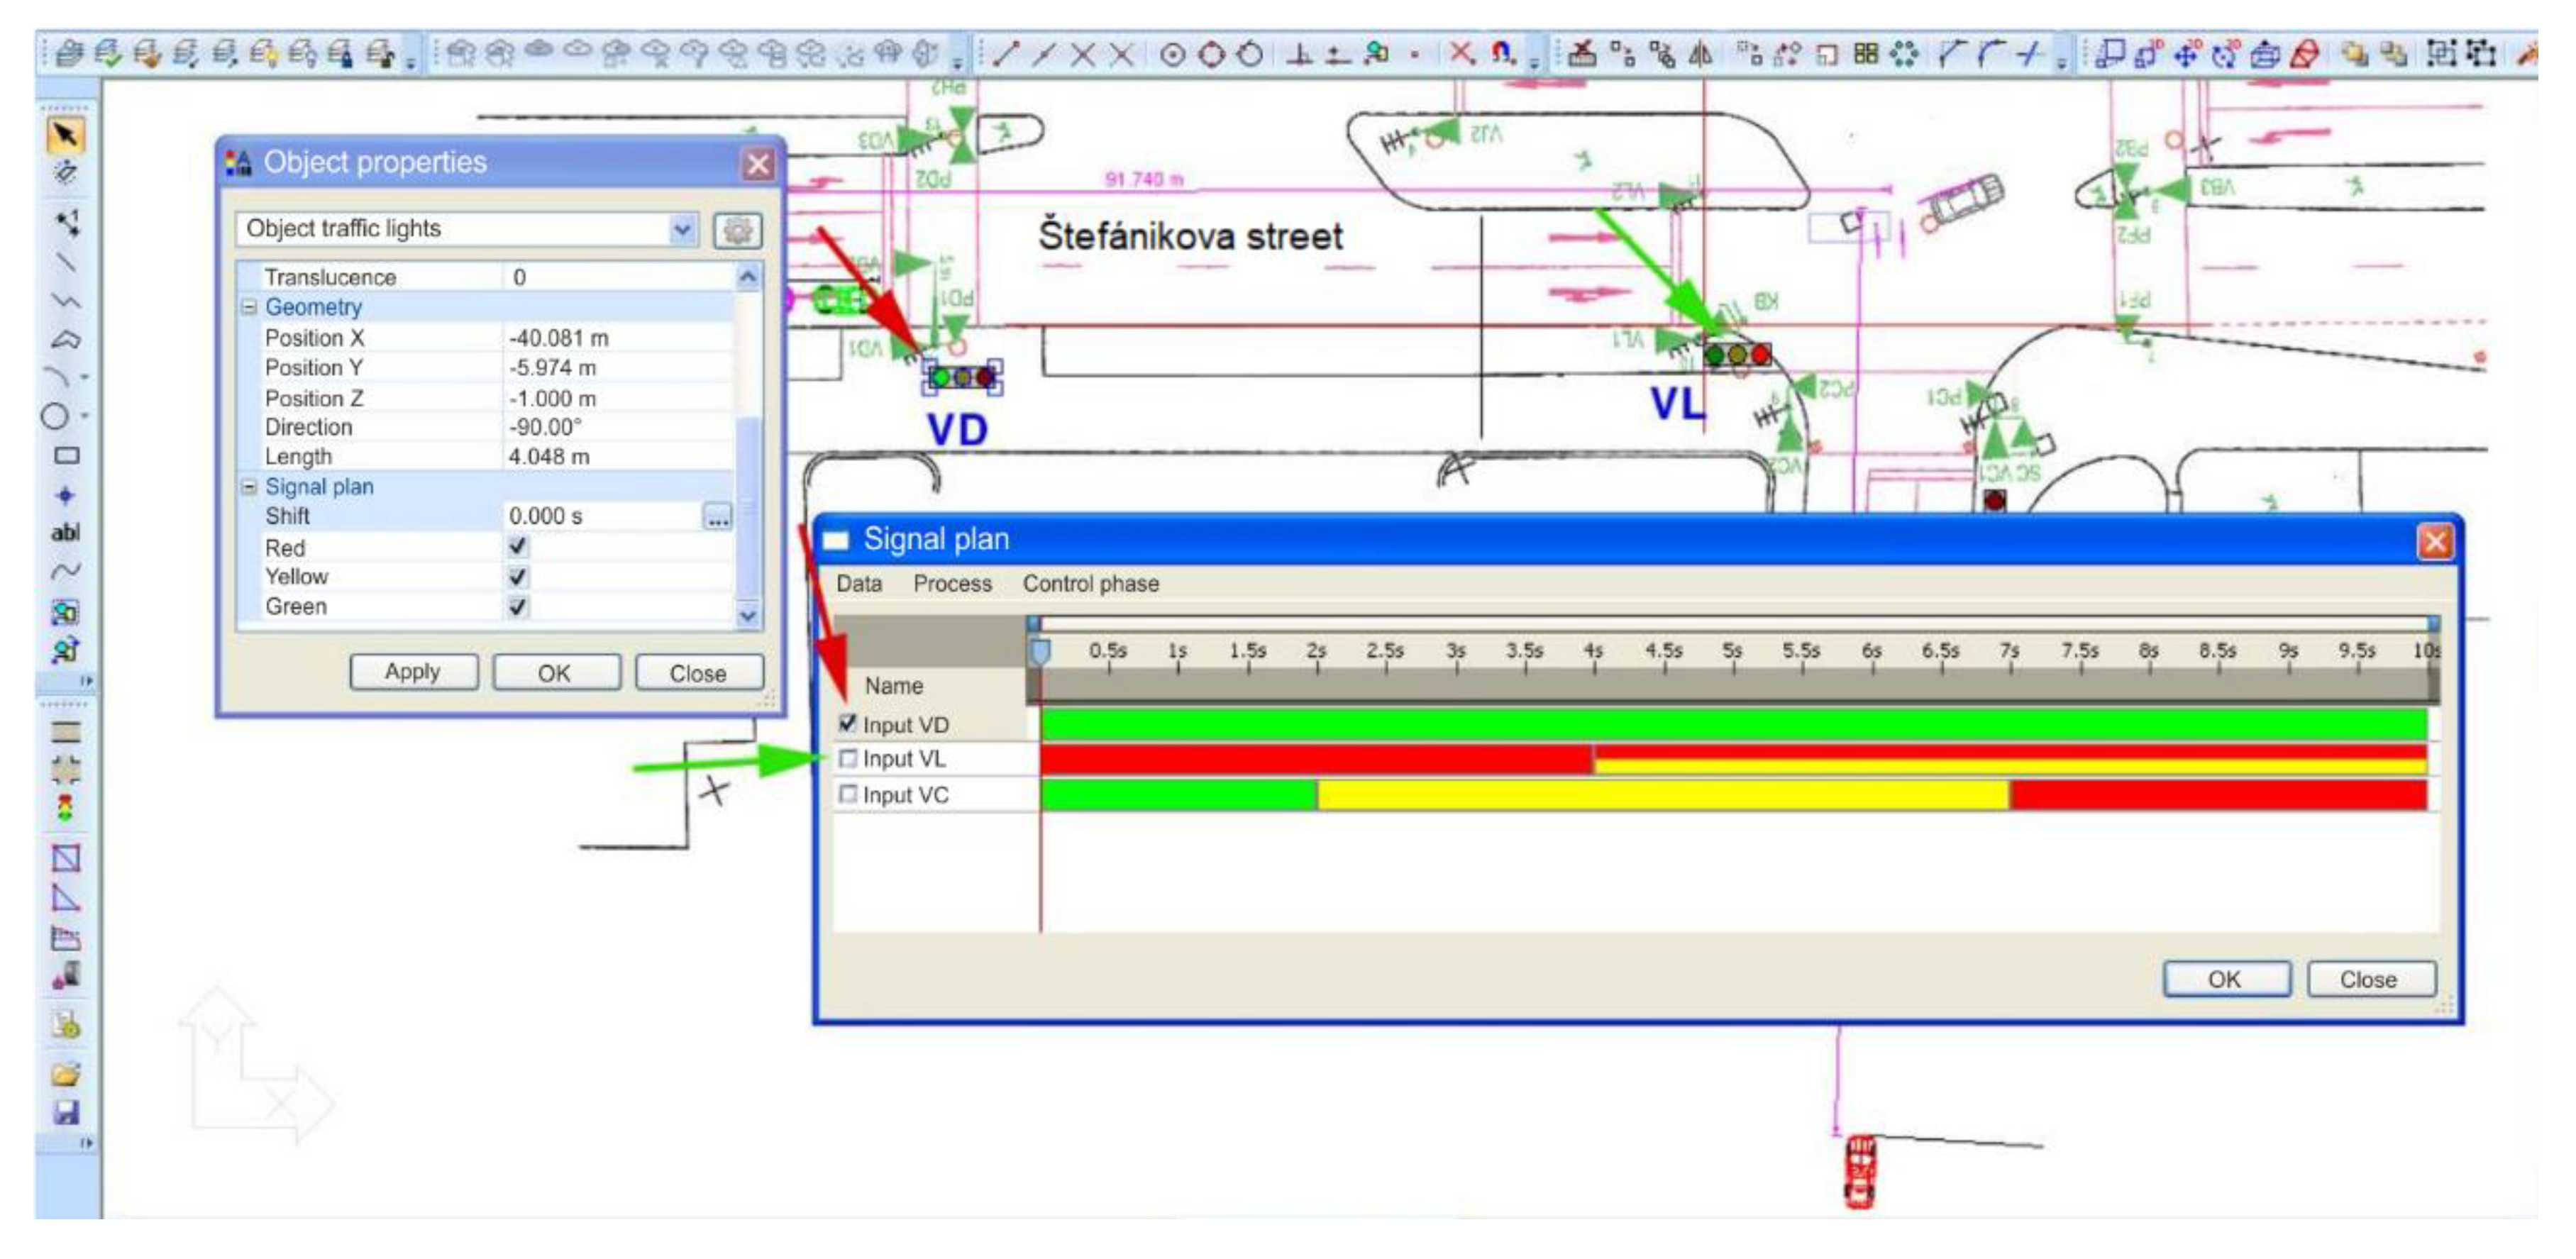
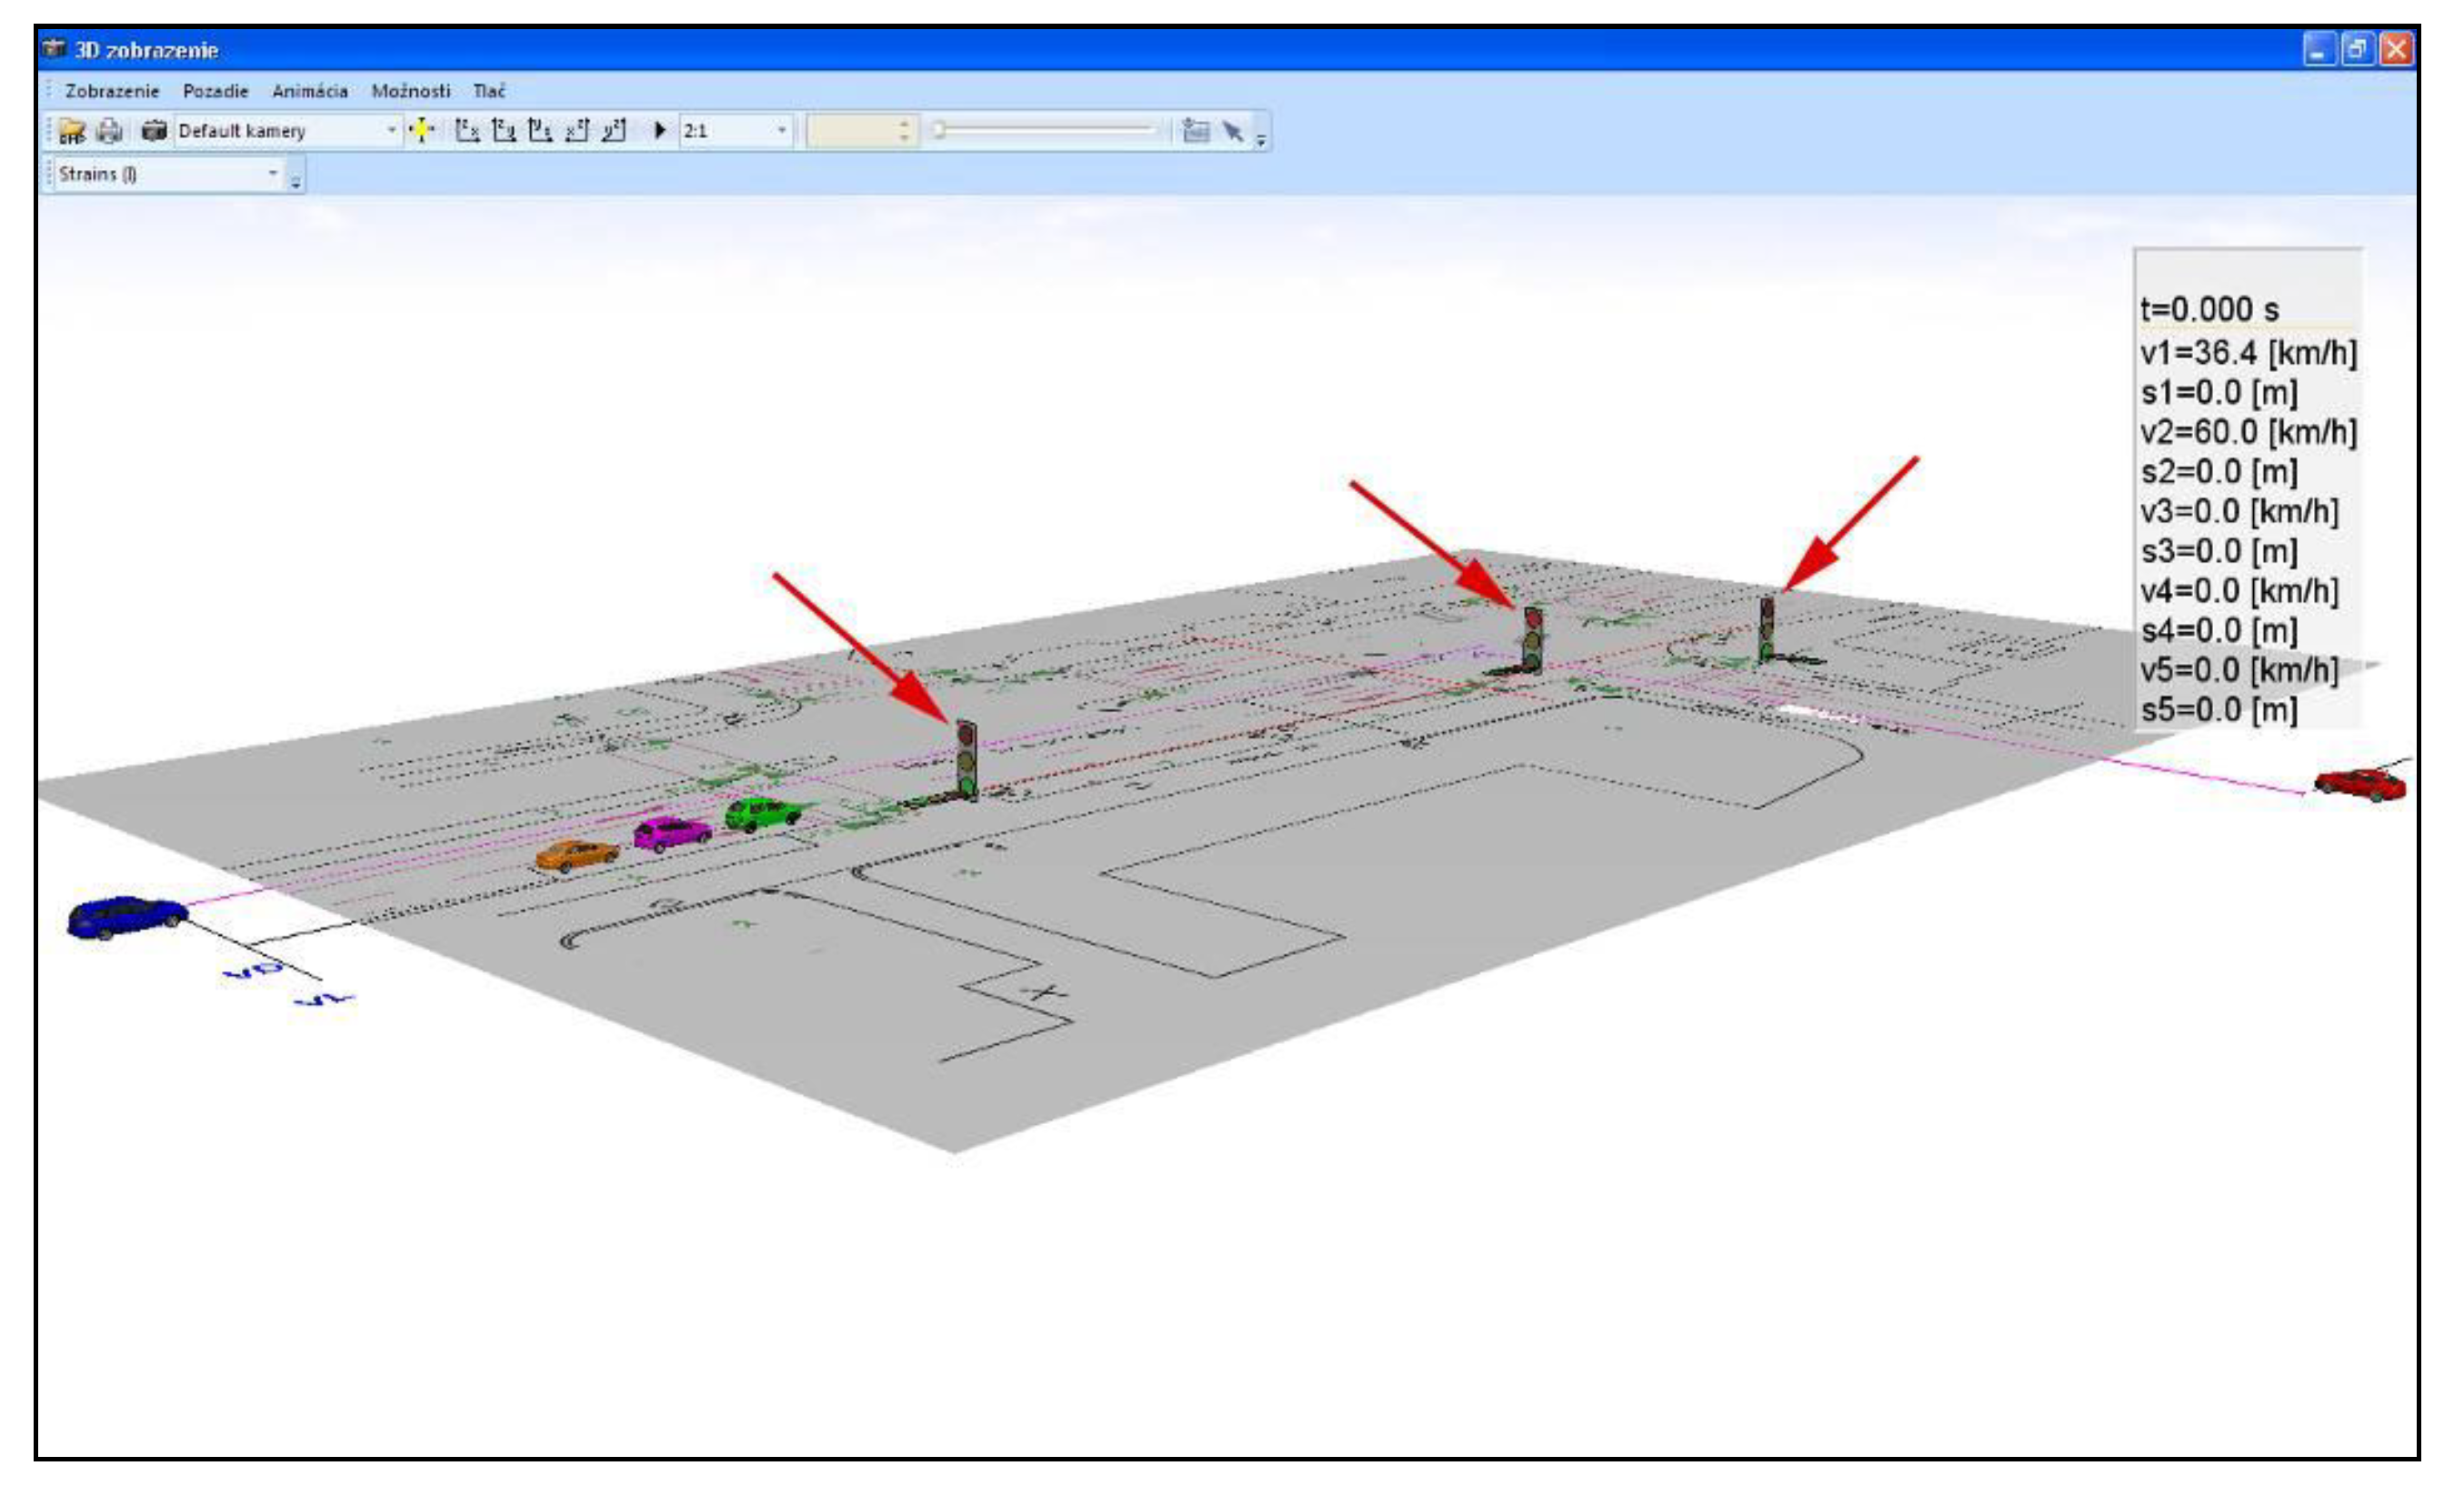
The latest version of the PC-Crash program enables one to define the time set of a signal plan control of traffic lights, as stated in the signal plan project, where there are light groups fitted at a junction for different directions of vehicle movement which change the set of lights according to a defined signal plan at a time with relation to the spatial movements of vehicles (see
Figure 16).
The condition of the proper evaluation of the traffic situation is a necessity to coordinate the beginning of a vehicle movement simulation with a precisely defined moment in a signal plan. In our case, the simulation starts when the Opel is approximately 15 m behind the vehicles that are standing at the previous junction, and, for this direction of movement, the green light signal turns on (see
Figure 17).
In the 3D view, we can evaluate the outlook options of individual drivers with respect to the space–time relationships (see
Figure 18).
5. Discussion
The presented methodology is based on four basic tenets:
The classical traffic accident analysis that is based on evaluation of forensic marks and evidence on the accident scene (braking marks, vehicle and traffic objects damage, end positions) and on the determination of basic physical parameters of accident (particularly impact speeds);
The realization of simulation of crash and post-crash phase in simulation software;
The analysis of the signal plan for given intersection crossing and integration of its phases into the sequences of the simulation software PC-Crash;
The simulation of the pre-crash phase with an integrated signal plan, evaluation of the driving technique of the involved traffic accident participants, and determination of possible traffic accident variants.
Advantages of the methodology:
- -
The possibility to utilize available means for accurate analysis;
- -
The possibility to perform time synchronization of events within traffic accident as well as time synchronization of the traffic accident participants with real status of intersection control;
- -
The possibility of more accurate reconstruction of traffic accident based on the synthesis of key control accident elements;
- -
Theoretical basis of the methodology enables simple implementation of subsequent modern control elements of roads and vehicles (dynamic control of intersection crossing, utilization of active vehicle safety devices, CDR data analysis);
- -
The methodology offers further improvement in accident reconstruction if video recording (from CCTV camera or dashcam) is present and qualitatively analyzed (using e.g., the methodology presented in [
42]);
- -
The methodology offers a theoretical framework for the creation of an integrated module for simulation software for its fast and easy utilization in these types of traffic accidents.
There was no such complex and comprehensive methodology for solving the specific traffic accidents at the intersections elaborated in the respective research area. Therefore, it is possible to compare only the selected methodology tenets. Probably the most important aspect is the tenet three (traffic signal phasing and timing). Compared to the study [
17], our methodology considers only the use of the static signal plan. Additional analyses of signal timing in real-time are needed for the dynamically controlled intersections (but when the traffic signal is determined the methodology is fully functional). Another option for the dynamically controlled intersections is a modern utilization of the traffic signal data loggers study [
18], where the outcome is an online data collection and evaluation of the signal timing.
The disadvantage of the methodology is the following: when the signal plan is integrated into the accident reconstruction, it is only possible to evaluate the expected behavior of participants. The methodology cannot directly assess a mistake in human driving behavior and reactions; but, within the total synthesis and subsequent better time–distance analysis of all accident data is the considerably easier and more exact selection of critical elements.
The other studies [
13,
19] use electronic data such as GPS, video, passenger vehicle airbag modules, commercial vehicle engine control modules, or traffic data logger information, as their source data, when analyzing the accident. As modern technology continues to proliferate, opportunities arise to combine multiple sources of electronic data, such as interconnecting video imagery with data logger recorded events, or combining vehicle-based GPS or electronic data recorder information with the signal-based data logger.
The described reconstruction procedure was verified with several comparable accidents. Besides the technical and forensic analysis, this has also been carried out by the subsequent court procedure, where it has, as a rule, been confirmed by the very participants of the accident. The application of this methodology therefore significantly extends the tools of reconstructing such accidents, achieving far more precise results. Such an achievement also instantly supports the following:
- -
More precise analysis of the course of the accident supports transport safety, also by means of the improved time tuning of the signal plan of the intersection, the organization of transport, and the remaining transport and technical measures;
- -
Data regarding the course of the accident enable the analysis of possible scenarios for the correct tuning of the signal plans in the case of the co-occurrence of standard, semi-autonomous, and fully autonomous vehicles, significantly enhancing both safety and the sustainability of transport;
- -
More adequate legal evaluation of the event, supporting legal reliance;
- -
In addition to an optical record of the accident, this methodology offers sufficient information to check the accuracy of the simulation.
6. Conclusions
Transport sustainability is closely connected with increased traffic safety. Launching autonomous vehicles will become a real challenge to traffic control, particularly during the transition period where they are gradually being put to use. Most difficulties are expected to appear in complicated traffic nodes and particularly at intersection crossings. Besides safe solutions, sustainability will ask for the objective evaluation of traffic accidents and thus offer legal reliance.
Modern methods of analyzing accidents allow for a rather precise reconstruction. Such reconstruction is based on the precise specifications of the forensic evidence. Among the most basic of these are tracks and marks left at the place of the accident, damage to the respective vehicles, and objects (including persons involved), and their mutual positions occupied after the accident. With regard to such source data and material, we can determine the impact speed very precisely. To evaluate the accident, we also have to determine the speed of the involved vehicles at the time of the reaction of the drivers. It is only possible to determine this in accidents at light-controlled intersections if the signal plan of the intersection is implemented into the accident scenario.
The presented article introduced a new forensic approach and pointed out the prospective possibilities of analytical methods for solving road accidents at traffic light junctions by means of simulation, considering light signals. The methodology is based on the analysis of the mutual time–distance parameters of vehicle motion in relation to the traffic signal plan. Application of the simulation software PC-Crash was featured here. Such a procedure has to become a standard for modern analysts. This application represents a progressive method of accident process evaluation.
Current simulation programs are adapted for the above type of accident analysis, while the current ambition is to head toward an increase in accuracy, simplification of data entry, and possible transfer of data from vehicles and traffic control systems. By means of implementing the real-time signal plan into the simulation program environment, it is possible to get a very good overview of the individual phases of an accident and the relative positions of its participants with respect to the operation of the junction control system. The results of the simulation and the evaluation of the distance–time diagrams clearly show that the collected data regarding the accident are in accordance with all marks and traces of the accident, as well as with the signal plan of the intersection and with all expected logical psychomotor reactions of the drivers. Based on the stated information, it is also possible (besides accident technical analysis and the determination of basic parameters such as vehicle speed) to achieve a better legal assessment of the case.
The methodology can be used immediately. It possesses a very good accuracy ratio, it is easy to interpret, and its principles will comfortably be utilizable in the future, all while maintaining transport sustainability. After the review of the already published recourses regarding accidents at intersections, it is evident that a complex procedure like the above, enabling the detailed reconstruction of this type of accident, has not yet been published. The procedure has used the simulation program PC-Crash, yet, its methodology can be applied with any modern simulation program having comparable properties.
Current progress in all types of recording equipment (recording equipment in vehicles, for example, an event data recorder (EDR), more in reference [
43]), traffic engineering control systems, and visual recording equipment) will considerably increase the accuracy of the analysis of this particular type of accident. We may also expect easier use of the respective data in simulation programs and automatic processing for the purposes of analysis. However, the basic construction components of this methodology will remain unchanged.
Author Contributions
Conceptualization, T.K.; formal analysis, J.O. and E.K.; methodology, I.D., J.O., E.K., and T.K.; supervision, T.K. and E.K., validation, J.O. and T.K.; software simulation, E.K., T.K., I.D., and Ž.Š.; writing—original draft preparation, E.K., T.K., and J.O.; visualization, I.D. and T.K.; writing—review and editing, J.O., T.K., E.K., and I.D.; resources, Ž.Š. project administration, J.O. All authors have read and agreed to the published version of the manuscript.
Acknowledgments
This manuscript was supported within solving the research project entitled “UNIZA Grant System: Determination of the driver’s reaction time within motor vehicle accident appearance”, VEGA number 1/0436/18: externalities in road transport, an origin, causes, and economic impacts of transport measures.
Conflicts of Interest
The authors declare no conflict of interest.
References
- Kalasova, A.; Kuculjakova, J. The Future in the Telematics Applications as Support for Increased Safety. Transp. Probl. 2012, 7, 103–109. [Google Scholar]
- Nitsche, P.; Thomas, P.; Stuetz, R.; Welsh, R. Pre-crash scenarios at road junctions: A clustering method for car crash data. Accid. Anal. Prev. 2017, 107, 137–151. [Google Scholar] [CrossRef] [PubMed]
- Buch, T.S.; Jensen, S.U. Incidents between Straight-ahead Cyclists and Right-turning Motor Vehicles at Signalised Junctions. Accid. Anal. Prev. 2017, 105, 44–51. [Google Scholar] [CrossRef] [PubMed]
- Batishcheva, O.; Ganichev, A. Measures to improve traffic safety at road junctions. Syst. Digit. Technol. Ensuring Traffic Saf. 2018, 36, 37–43. [Google Scholar] [CrossRef]
- Badiger, A.; Shapur, C.; Hongal, R.; Betageri, S.; Kumar, N. Systematic and Automatic Road Traffic Junction. In Proceedings of the 2016 International Conference on Electrical, Electronics, and Optimization Techniques (ICEEOT), Chennai, India, 3–5 March 2016; pp. 3330–3335. [Google Scholar]
- Kohút, P.; Macurová, Ľ.; Sventeková, E.; Ballay, M. Safety Analysis of Pedestrian as the users of Road Traffic in the Slovak Republic. In Proceedings of the International Conference Transport Menas 2019, Palanga, Lithuania, 2–4 October 2019; pp. 446–452. [Google Scholar]
- Robbins, C.J.; Allen, H.A.; Chapman, P. Comparing car drivers’ and motorcyclists’ opinions about junction crashes. Accid. Anal. Prev. 2018, 117, 304–317. [Google Scholar] [CrossRef]
- Wu, P.J.; Meng, X.H.; Song, L.; Zuo, W.Z. Crash Risk Evaluation and Crash Severity Pattern Analysis for Different Types of Urban Junctions: Fault Tree Analysis and Association Rules Approaches. Transp. Res. Rec. 2019, 2673, 403–416. [Google Scholar] [CrossRef]
- Yu, S.W.; Fu, R.; Guo, Y.S.; Xin, Q.; Shi, Z.K. Consensus and optimal speed advisory model for mixed traffic at an isolated signalized intersection. Phys. A-Stat. Mech. Its Appl. 2019, 531. [Google Scholar] [CrossRef]
- Zammit, L.C.; Fabri, S.G.; Scerri, K. Real-Time Parametric Modeling and Estimation of Urban Traffic Junctions. Ieee Trans. Intell. Transp. Syst. 2019, 20, 4579–4589. [Google Scholar] [CrossRef]
- Zhang, G.N.; Tan, Y.; Jou, R.C. Factors influencing traffic signal violations by car drivers, cyclists, and pedestrians: A case study from Guangdong, China. Transp. Res. Part F-Traffic Psychol. Behav. 2016, 42, 205–216. [Google Scholar] [CrossRef]
- Marceau, D.E. Accident Reconstruction at Traffic Signal Intersections; Kinetic Energy Press: Rocklin, CA, USA, 2006; p. 192. ISBN 978-0-9716634-3-5. [Google Scholar]
- Urquhart, S. The Forensic Reconstruction of Road Traffic Accidents. Master’s Thesis, Sheffield Hallam University, Sheffield, UK, 2017. [Google Scholar]
- Steffan, H. Technical and Operating Manuals for the Program PC-Crash. 2011. [Google Scholar]
- Burg, H.; Moser, A. Handbook of Accident Reconstruction; Create Space Independent Publishing Platform, Vieweg & Teubner: Kippenheim, Germany, 2014; p. 506. ISBN 978-1492328421. [Google Scholar]
- Prentkovskis, O.; Sokolovskij, E.; Bartulis, V. Investigating traffic accidents: A collision of two motor vehicles. Transport 2010, 25, 105–115. [Google Scholar] [CrossRef]
- Yang, X.L.; Li, P.; Lv, T.; Liao, X.H. Traffic Accident Reconstruction Technology Research. In Proceedings of the 2nd International Conference on Computer and Information Applications (ICCIA 2012), Taiyuan, China, 8–9 December 2012; pp. 1001–1005. [Google Scholar]
- Przybyla, J.; Rush, T.; Palframan, K.; Melcher, D. Introduction to Traffic Signal Data Loggers and their Application to Accident Reconstruction; SAE Technical Paper 2018-01-0527; SAE: Warrendale, PA, USA, 2018. [Google Scholar] [CrossRef]
- Paliska, D.; Batista, M.; Starin, R.; Fabjan, D. An attempt to attain new information in reconstruction of road traffic accidents applying digital image processing. Promet-Traffic Transp. 2011, 23, 113–119. [Google Scholar] [CrossRef]
- Zou, D.H.; Zhang, X.; Li, Z.D.; Sun, J.; Zhang, J.H.; Huang, P.; Ma, K.J.; Chen, Y.J. Prediction of injury risks and features among scooter riders through MADYMO reconstruction of a scooter-microvan accident: Identifying the driver and passengers. J. Forensic Leg. Med. 2019, 65, 15–21. [Google Scholar] [CrossRef] [PubMed]
- Zammit, L.C.; Fabri, S.G.; Scerri, K. Online state and parameter estimation for a 4-arm traffic junction. In Proceedings of the 2017 25th Mediterranean Conference on Control and Automation (MED), Valletta, Malta, 3–6 July 2017; pp. 737–742. [Google Scholar] [CrossRef]
- Cernicky, L.; Kalasova, A.; Kapusta, J. Signal Controlled Junctions Calculations in Traffic-Capacity Assessment - Aimsun, Omnitrans, Webster and TP 10/2010 Results Comparison. Transp. Probl. 2016, 11, 121–130. [Google Scholar] [CrossRef][Green Version]
- Ma, C.X.; Liu, P.F. Intersection signal timing optimization considering the travel safety of the elderly. Adv. Mech. Eng. 2019, 11. [Google Scholar] [CrossRef]
- Fourati, W.; Friedrich, B. Trajectory-Based Measurement of Signalized Intersection Capacity. Transp. Res. Rec. 2019, 2673, 370–380. [Google Scholar] [CrossRef]
- Zhang, Y.; Gao, K.Z.; Zhang, Y.C.; Su, R. Traffic Light Scheduling for Pedestrian-Vehicle Mixed-Flow Networks. Ieee Trans. Intell. Transp. Syst. 2019, 20, 1468–1483. [Google Scholar] [CrossRef]
- Kalasova, A.; Mikulski, J.; Kubikova, S. The Impact of Intelligent Transport Systems on an Accident Rate of the Chosen Part of Road Communication Network in the Slovak Republic. In Challenge of Transport Telematics: 16th International Conference on Transport Systems Telematics, TST 2016, Katowice-Ustroń, Poland, March 16–19, 2016, Selected Papers; Springer International Publishing: Cham, Switzerland, 2016; Volume 640, pp. 47–58. [Google Scholar] [CrossRef]
- Moghimi, B.; Safikhani, A.; Kamga, C.; Hao, W.; Ma, J.Q. Short-Term Prediction of Signal Cycle on an Arterial with Actuated-Uncoordinated Control Using Sparse Time Series Models. Ieee Trans. Intell. Transp. Syst. 2019, 20, 2976–2985. [Google Scholar] [CrossRef]
- Baldi, S.; Michailidis, I.; Ntampasi, V.; Kosmatopoulos, E.; Papamichail, I.; Papageorgiou, M. A Simulation-Based Traffic Signal Control for Congested Urban Traffic Networks. Transp. Sci. 2019, 53, 6–20. [Google Scholar] [CrossRef]
- Yao, Z.H.; Jiang, Y.S.; Zhao, B.; Luo, X.L.; Peng, B. A Dynamic Optimization Method for Adaptive Signal Control in a Connected Vehicle Environment. J. Intell. Transp. Syst. 2019. [Google Scholar] [CrossRef]
- Vilarinho, C.; Tavares, J.P. Real-time traffic signal settings at an isolated signal control intersection. In Proceedings of the 17th Meeting of the Euro Working Group on Transportation, Ewgt2014, Sevilla, Spain, 2–4 July 2014; Volume 3, pp. 1021–1030. [Google Scholar] [CrossRef]
- Ren, C.X.; Wang, J.B.; Qin, L.Q.; Li, S.; Cheng, Y. A Novel Left-Turn Signal Control Method for Improving Intersection Capacity in a Connected Vehicle Environment. Electronics 2019, 8, 1058. [Google Scholar] [CrossRef]
- Gao, Y.F.; Liu, Y.; Hu, H.; Ge, Y.E. Signal optimization for an isolated intersection with illegal permissive left-turning movement. Transp. B-Transp. Dyn. 2019, 7, 928–949. [Google Scholar] [CrossRef]
- Farhi, N.; Goursat, M.; Quadrat, J.P. The traffic phases of road networks. Transp. Res. Part C-Emerg. Technol. 2011, 19, 85–102. [Google Scholar] [CrossRef]
- Nayaki, K.S.; Krishnan, N.U.N.; Joby, V.; Sreelakshmi, R. Traffic Light Synchronization. In Advances in Computing and Information Technology, Vol 2; Meghanathan, N., Nagamalai, D., Chaki, N., Eds.; Springer: Berlin/Heidelberg, Germany, 2013; Volume 177, pp. 97–106. [Google Scholar]
- Manolis, D.; Pappas, T.; Diakaki, C.; Papamichail, I.; Papageorgiou, M. Centralised versus decentralised signal control of large-scale urban road networks in real time: A simulation study. Iet Intell. Transp. Syst. 2018, 12, 891–900. [Google Scholar] [CrossRef]
- Lee, S.; Wong, S.C.; Varaiya, P. Group-based hierarchical adaptive traffic-signal control part I: Formulation. Transp. Res. Part B-Methodol. 2017, 105, 1–18. [Google Scholar] [CrossRef]
- Xu, M.T.; An, K.; Vu, L.H.; Ye, Z.R.; Feng, J.X.; Chen, E.H. Optimizing multi-agent based urban traffic signal control system. J. Intell. Transp. Syst. 2019, 23, 357–369. [Google Scholar] [CrossRef]
- Lee, S.; Wong, S.C.; Varaiya, P. Group-based hierarchical adaptive traffic-signal control Part II: Implementation. Transp. Res. Part B-Methodol. 2017, 104, 376–397. [Google Scholar] [CrossRef]
- Software PC-Crash. Available online: http://www.dsd.at/index.php?option=com_content&view=article&id=512:pc-crash-deutsch-sicherung-2&catid=37&lang=en&Itemid=159 (accessed on 21 January 2020).
- Schejbalova, Z.; Micunek, T.; Schmidt, D. Biomechanical Analysis of the Dummy Responses in Case of Child Pedestrian/Cyclist Collision with Passenger Car. Neural Netw. World 2013, 23, 609–622. [Google Scholar] [CrossRef][Green Version]
- Schejbalova, Z.; Kvasova, A.; Micunek, T.; Marek, Z. Simulation of a Collision between Passenger Car and Child Pedestrian. Promet-Traffic Transp. 2012, 24, 109–118. [Google Scholar] [CrossRef][Green Version]
- Kolla, E.; Ondruš, J.; Vertaľ, P. Reconstruction of traffic situations from digital video-recording using method of volumetric kinetic mapping. Arch. Automot. Eng. Arch. Motoryz. 2019, 84, 147–170. [Google Scholar] [CrossRef]
- Böhm, K.; Paula, D.; Wech, L.; Schweiger, H.-G. Event Data Recorder (EDR) for Accidents with Automated Vehicles—The Accident Analysis of the Future; VDI-Bericht zur 12. VDI-Tagung, Fahrzeugsicherheit—Fahrzeugsicherheit im Umfeld von neuen Rating- und Gesetzesanforderungen; VDI Wissensforum GmbH: Berlin, Germany, 2019; pp. 349–364. [Google Scholar]
Figure 1.
Traffic movements at junctions [
24].
Figure 1.
Traffic movements at junctions [
24].
Figure 2.
Example of defining a collision area at a junction [
22].
Figure 2.
Example of defining a collision area at a junction [
22].
Figure 3.
An example design of control phases for an intersection with a four-legged junction (processed by the authors).
Figure 3.
An example design of control phases for an intersection with a four-legged junction (processed by the authors).
Figure 4.
Example of a signal plan of a three-phase junction [
37].
Figure 4.
Example of a signal plan of a three-phase junction [
37].
Figure 5.
The PC-Crash simulation, including a layout plan of the accident, specifying vehicle movement directions before the accident (processed by the authors).
Figure 5.
The PC-Crash simulation, including a layout plan of the accident, specifying vehicle movement directions before the accident (processed by the authors).
Figure 6.
Solution of movement and impact speed of vehicles to end positions in the PC-Crash simulation program (processed by the authors).
Figure 6.
Solution of movement and impact speed of vehicles to end positions in the PC-Crash simulation program (processed by the authors).
Figure 7.
Schematic solution of vehicle movement trajectories in colliding directions with a definition of entrance distances from a collision point (processed by the authors).
Figure 7.
Schematic solution of vehicle movement trajectories in colliding directions with a definition of entrance distances from a collision point (processed by the authors).
Figure 8.
Light groups of interest pertaining to the respective vehicles involved in the car accident (processed by the authors).
Figure 8.
Light groups of interest pertaining to the respective vehicles involved in the car accident (processed by the authors).
Figure 9.
Signal plan used at the time of the accident (processed by the authors). Abbreviations explanation: VA, VB, VC, VD, KB, KD, VJ, VL, SA, SC, PB—signal plans for individual traffic lights.
Figure 9.
Signal plan used at the time of the accident (processed by the authors). Abbreviations explanation: VA, VB, VC, VD, KB, KD, VJ, VL, SA, SC, PB—signal plans for individual traffic lights.
Figure 10.
Selection of signal light groups (processed by the authors).
Figure 10.
Selection of signal light groups (processed by the authors).
Figure 11.
Graphic solution of the traffic situation using an s–t diagram in the PC-Crash simulation program (an alternative with the start of the green signal for the Opel, approximately 15 m away from the stationary vehicles). Figure processed by the authors.
Figure 11.
Graphic solution of the traffic situation using an s–t diagram in the PC-Crash simulation program (an alternative with the start of the green signal for the Opel, approximately 15 m away from the stationary vehicles). Figure processed by the authors.
Figure 12.
The use of a graphic solution of the light signal plan in the PC-Crash simulation program in relation to the vehicle movement as a planar solution (processed by the authors).
Figure 12.
The use of a graphic solution of the light signal plan in the PC-Crash simulation program in relation to the vehicle movement as a planar solution (processed by the authors).
Figure 13.
The use of a graphic solution of the light signal plan in the PC-Crash simulation program in relation to the vehicle movement as a 3D visualization (processed by the authors).
Figure 13.
The use of a graphic solution of the light signal plan in the PC-Crash simulation program in relation to the vehicle movement as a 3D visualization (processed by the authors).
Figure 14.
Positioning of light signaling lines for individual directions of vehicle movements in the PC-Crash simulation program (processed by the authors).
Figure 14.
Positioning of light signaling lines for individual directions of vehicle movements in the PC-Crash simulation program (processed by the authors).
Figure 15.
The PC-Crash simulation. (a) Examples of mutual positions of vehicles in key points. (b) The simulation in in spatial terms as a 3D visualization. Figure processed by the authors.
Figure 15.
The PC-Crash simulation. (a) Examples of mutual positions of vehicles in key points. (b) The simulation in in spatial terms as a 3D visualization. Figure processed by the authors.
Figure 16.
Definition of lighting sequences of light signal groups directly in the simulation program for selected traffic lanes in the PC-Crash simulation program (processed by the authors).
Figure 16.
Definition of lighting sequences of light signal groups directly in the simulation program for selected traffic lanes in the PC-Crash simulation program (processed by the authors).
Figure 17.
Positioning of light signal groups (traffic lights) into real positions at junctions in the PC-Crash simulation program as a 3D visualization (processed by the authors).
Figure 17.
Positioning of light signal groups (traffic lights) into real positions at junctions in the PC-Crash simulation program as a 3D visualization (processed by the authors).
Figure 18.
The PC-Crash simulation, showing a spatial evaluation of the viewing options of drivers with respect to changes in light signaling. Figure processed by the authors.
Figure 18.
The PC-Crash simulation, showing a spatial evaluation of the viewing options of drivers with respect to changes in light signaling. Figure processed by the authors.
© 2020 by the authors. Licensee MDPI, Basel, Switzerland. This article is an open access article distributed under the terms and conditions of the Creative Commons Attribution (CC BY) license (http://creativecommons.org/licenses/by/4.0/).


