1. Introduction
Driving is a complex task that requires the driver’s full attention. When the driver is not completely engaged within this task, many factors can reduce his/her ability to detect and to react to risky situations. Drowsiness is a dangerous state that has been proven to have a significant impact on road safety, reflecting drivers’ unsafe behavior. Williamson et al. (2014) [
1] conducted a study in a driving simulator and found that drivers who reported higher levels of sleepiness were more likely to have crashes and centerline crossings. In addition, slower reaction times were associated with drowsy drivers in studies by He et al. (2017) and Morris et al. (2015) [
2,
3].
Drowsiness and fatigue are major causes of road crashes, leading to an enormous number of injured people, deaths, and economic costs to society. The National Highway Traffic Safety Association (2017) [
4], revealed that, in the United States alone, 795 people died and more than 90,000 car crashes occurred because of drowsy driving. Collisions can be multifactorial in their origin, and drowsiness and fatigue are not measurable in the same way as the breath alcohol content. Due to this, statistics can be even more worrying than current estimates [
5,
6].
As expected, several factors have influence the drowsiness and fatigue evolution during driving. Ting et al. (2008) [
7] identified time-on-task as the most well-known cause of driver fatigue. Additionally, other studies correlated an increasing driving time with increasing subjective sleepiness and fatigue, longer blink durations, and increasing steering wheel movements [
8,
9,
10,
11]. Sleep deprivation is also a strong factor that clearly induces higher sleepiness levels, and even mild levels of sleep deprivation (2 h) can result in driving performance impairment [
12]. Similarly, light settings, the landscape or geometry’s monotony, traffic conditions, or the temperature are examples of external factors with influence on the drowsiness development. On the other hand, some studies introduce sociodemographic information in order to analyze if there is any correlation between driver characteristics and his/her behavior. Age and gender are basic information that can be easily obtained and analyzed, as long as the study has a representative sample. For example, Wang and Xu (2016) [
13] mentioned, in their study, that group characteristics (such as age and gender) were controlled, but added that “if it can be demonstrated that group characteristics exist, we can build group-specific models that would simplify the model training process by group determinants”. As the authors mentioned, these group-specific models are important to analyze and determine the behavior of specific groups like women, men, or elderly people, for instance. Another study stated that young drivers (30 years or less) showed a better reaction time performance than elderly drivers, after 2 to 4 h of driving, but this scenario changed after 8 h. This probably indicated that young people are more vulnerable to fatigue [
14]. In addition, in a follow-up carried out in 2004, young drivers showed a 70% decrement in reaction time, compared to 15% for the elderly group [
15]. This study showed that there is a positive correlation between driving duration and fatigue, and warned about the risks of overestimating driving performance during sleep loss, mainly among groups of young drivers. To overcome this issue, in view of promoting safe driving among the younger population, innovative and computer-based education programs for those who are pre-licensed are beneficial tools to elucidate the danger of driving in non-desired conditions, like drowsiness states, and, especially, on dangerous roads that are more likely to induce those conditions [
16].
Fatigue is not easy to measure externally, so it is crucial for drivers to be alert and learn to understand their own sleep needs and self-evaluate their fatigue and drowsiness. One tool that has been widely used to evaluate drowsiness is the Karolinska Sleepiness Scale (KSS). This method helps to measure the subjective sleepiness level at a particular time, where the driver uses a 10-point scale (1- Extremely alert, 2- Very alert, 3- alert, 4- Rather alert, 5- Neither alert nor sleepy, 6- Some signs of sleepiness, 7- Sleepiness, but no effort to keep awake, 8- Sleepiness, but some effort to keep awake, 9- Very sleepy, great effort to keep awake, fighting sleep, and 10- Extremely sleepy, cannot keep awake). Despite being a subjective measure, generally, results from this scale revealed great correlations with objective measures such as those provided by driving performance and drivers’ biometric monitoring. As reported by Ahlström et al. (2018) [
17], when sleepiness indicators revealed drowsy drivers (a higher blink duration, slower speed, and lane crossing), the KSS values were also higher, which suggests that the KSS is a reliable indicator of sleepiness. Previously, Otmani et al. (2005) [
18] also studied the effect of partial sleep deprivation and driving duration on subsequent alertness and performance in car drivers. Regarding the KSS scores before and during the test, they were higher in the sleep-deprived conditions. Furthermore, sleep deprivation had strong interactions with the driving time, which was reflected in increasing drowsiness levels with the time-on-task.
Besides the existence of several technologies that aim to alert drivers engaging in drowsiness states, most of these systems have poor inputs, resulting in a high number of false alarms [
19]. In this context, the present study aims to improve those inputs by presenting a sensitive analysis of the influence of drivers’ attributes on drowsiness evolution and the consequent impacts on driving performance. A better knowledge of this topic will contribute to the development of more reliable technologies, tailored for each driver at any time, and which are able to detect drowsiness and emit a warning before the driver engages in erratic behavior.
This research is supported by the results from the KSS and explores two main issues, driver characteristics and driving performance, by using distinct statistical models. In the first case, KSS is the dependent variable which the driver characteristics will influence, and in the second case the KSS is an independent variable that impacts the driving performance. Additionally, in both analyses, the driving time is included in order to consider the impact of the time passing in addition to the effect of drowsiness. The findings of this study provide new insights about the KSS relationships by using robust statistical models rather a simple variance analysis. In the next section, the experimental design used in the study is described. The methodological approach used to statistically analyse the KSS is presented in a separated section. After that, the results of the models are provided, followed by a Discussion section in which interesting insights are discussed. Finally, the conclusions and limitations of the study are shown.
2. Experimental Section
2.1. Participants
Fifty participants (31 males and 19 females) with mean ages of 36.2 ± 16.4 took part in a driving simulator session. The subjects were healthy and had a valid driver’s license. Ingestion of substances with alcohol or caffeine presence was forbidden in the hours before the experiment, and all participants had lunch previously.
2.2. Apparatus
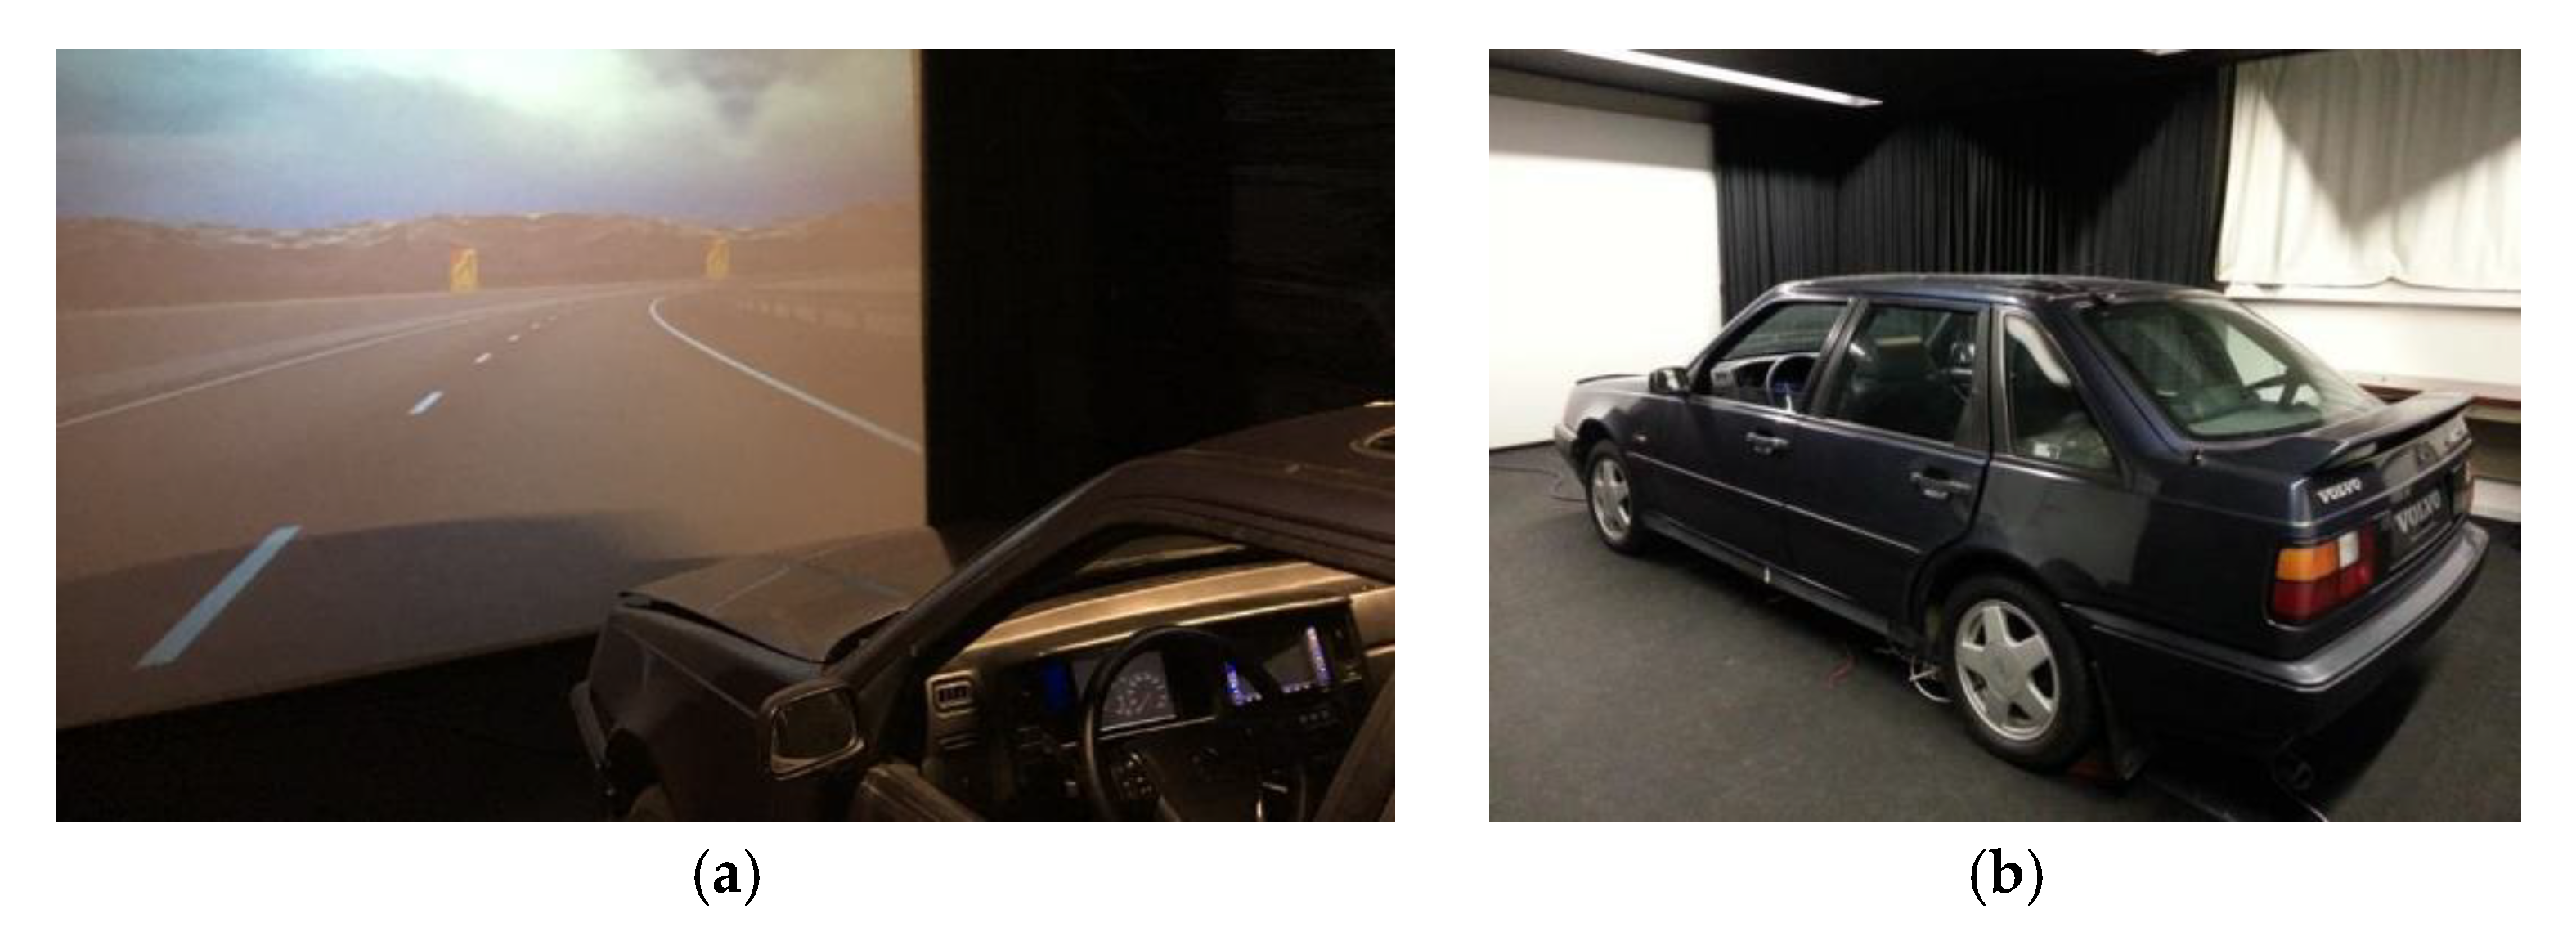
The experimental session was conducted in the high-fidelity and fixed-base driving simulator DriS, located at the Faculty of Engineering of the University of Porto. The simulator was developed by members and co-workers of the faculty, which allows full control of the scenario and simulation conditions. Regarding the scenario, a monotonous freeway with rural surroundings was chosen. The route consisted of a closed circuit, composed by long straight sections and curves with large radii. The posted speed limit was set to 120 km/h. Moreover, each lane had a 3.75-m width and no exits existed in the entire route, making it mandatory to always drive in the same direction. However, there was some simulated traffic; to obtain a more realistic behavior, the participant was allowed to overtake.
Figure 1a shows the scenario adopted for the experiments and
Figure 1b shows the driving simulator DriS.
2.3. Experimental Design and Procedures
All the sessions started by filling out a consent form and a general information questionnaire. The questionnaire was the source of basic personal information. With this information, it is possible to identify if any biological characteristic, habit, or recent event may have interfered with the results. Moreover, information about real driving experience, frequency, and average mileage was collected.
The experiments were preceded by a few minutes of pre-driving in order to make the participant comfortable with the driving simulator. Subjects were instructed to drive safely, respecting traffic rules, and behaving as close as possible to a real situation. When the participant felt adapted, the driving simulation started and was extended for 75 min. Procedures were prepared to begin the driving session around 2 pm. This made it possible to englobe all the driving within the period of 2 pm to 4 pm, where it has been scientifically proven that the circadian rhythm renders a person more likely to get drowsy [
20].
Aside from the driving task, participants were told to rate their levels of drowsiness/alertness through the KSS, in 15-minute intervals. The measurement was associated with an attention sign that appeared inside the vehicle screen, without making any sound, and the answer was in a loud voice.
2.4. Data
This study uses data collected by three sources: (1) questionnaires with personal information and habits; (2) results from the KSS; and (3) driving dynamic parameters.
The personal information questionnaire includes data such as the age, gender, height, weight, and profession. Additionally, information such as the hours slept during the night before the driving, physical activity habits, health history, medications ingestion, and occurrence of recent abnormal stress events were collected. Regarding medication ingestion, according to the obtained responses, three categories were created. A group contained people who took medication to control depression/anxiety or took muscle relaxants for problems such as fibromyalgia or rheumatism. Another group, which we named “other”, was formed with participants who took medication not recognized for having secondary effects on alertness. In this group, we can find, for instance, medication for cholesterol, hypertension, or hormonal regulation. Finally, the larger group represented those who did not take any medication in the 24 h before the experiment.
The results from the KSS were registered every 15 min and represent a number between 1 and 10. The value of 10, “extremely sleepy, can’t keep awake”, was only registered when the participant was sleeping at the moment that he should have responded to the questionnaire.
Driving dynamic parameters are automatically acquired by the driving simulator DriS. The software collects information about trajectory, instant speed, steering wheel movements, and accelerator and brake pedals pressure.
3. Materials and Methods
The analyses applied in this study have two perspectives. First, we aimed to understand if there is any relationship between drivers’ personal aspects and their predisposition to become drowsy. A second approach focused on the consequences of drowsiness on driving performance.
For both analyses, the NLOGIT 5 was used as the statistic tool. In the first case, and considering that the study goal was to understand if a specific characteristic made the driver more or less prone to get drowsy, a Binary Probit Model (BPM) was used, considering the binary variable Y = 1 if the driver got drowsy (KSS ≥ 6) and Y = 0 otherwise (KSS < 6). The threshold of KSS=6 was selected because it was the score where the labels’ description mentioned drowsiness for the first time as “Some signs of sleepiness”. The probabilities associated with the model category, which are gathered in a vector x to define the decision between the categories, are represented as follows:
where Y represents the category of the dependent variable (1 if drowsy or 0 if non-drowsy), x is the vector of independent variables, and β is the vector of coefficients to be estimated. β reflects the impact on the probability of changes in x. A suitable model for F(x,β) is assumed, usually considering a normal or logistic distribution. The question of which distribution to use has been widely analyzed, with the conclusion that the two distributions tend to give similar probabilities, except in the tails [
21,
22]. After analyzing both distributions in the present study, we chose the normal distribution, because a small improvement in terms of the Akaike Information Criterion (AIC) and the McFadden pseudo R
2 was detected in the model outcomes, giving rise to the Probit model, as follows:
where ɸ(.) is the commonly used notation for the cumulative normal distribution function.
Table 1 shows a summary of the variables introduced in the model.
To study the effects of drowsiness on driving performance, the choice of the models was based on the dependent variable. For this application, and after trying several hypotheses, the driving performance was represented by the speed and the number of lane departures. For the latter, we counted the number of situations for each 15 min of interval when the mirror of the driving simulator was totally outside the lane, for any of the sides. The average of the speed was also obtained for each of the five 15-minutes interval. On the other hand, the independent variables were the KSS and time. To guarantee a more sensitive analysis, since the KSS was now an input, we used the original KSS data, on a scale from one to ten. The time (five intervals, as previously mentioned) when the KSS was collected was also considered to capture the effects of drowsiness independently of the time.
Considering that the speed values were all positive and continuous, a generalized linear model (GLM) with a log link function and gamma distribution was used. In this case, a logarithmic relationship exists as following:
where E(y|x) is the expected outcome for a set of independent variables x, β is the vector of coefficients, and μ is the mean. In GLM modeling, one specifies a mean and variance function for the observed raw-scale variable y, conditional on x with the general structure:
where in the case of a gamma structure υ(y|x) = k(μ(x))
2, and k > 0; that is, the standard deviation σ is proportional to the mean μ(x;β). The coefficients were estimated using the maximum likelihood estimation method in all models.
Regarding the lane departures, the values are a non-negative integer, which leads to count-data modeling techniques. Count data are generally modeled with a Poisson regression. One requirement of the Poisson distribution is that the mean of the count process equals its variance. When the variance is significantly larger than the mean, the data are said to be overdispersed. In order to test this latter hypothesis, the overdispersion test were applied, revealing that the null hypothesis of the variance being equal to the mean was accepted, because the resulting values in this case (
[g(λi) = λi]: 3.511 and
[g(λi) = λi2]: 3.136) were lower than the critical value from the χ
2 table for one degree of freedom (3.84). For this reason, the Poisson regression was applied for the analysis of the lane departures. The Poisson regression specifies that each observation
yi is drawn from a Poisson distribution with the parameter
λi, related to a vector of explanatory variables
Xi [
22]. The Poisson probability of the outcome
Y =
yi can be expressed by:
where the parameter
λi represents the mean number of lane departures (LD) for observation
i (
λi = E{
Y}). The log-linear function used to link
λi with
Xi is given by:
where
β is a vector of coefficients of the independent variables.
Table 2 represents a summary of the variables introduced in both models for which the independent variables are common.
5. Discussion
Some results from the BPM were consistent with previous studies. Fewer hours slept in the night before driving corresponded to drivers that self-rate themselves as drowsier during the session. This result has logical reasons, and several researchers already proved that sleep deprivation significantly increases sleepiness levels during driving. To illustrate the approach, Jackson et al. (2016) [
23] conducted a study where, after 24 h of sleep deprivation, drivers presented more drowsiness symptoms, such as longer eyelid closures, higher variations in the lane position, and more attentional gaps when compared to after a normal night of sleep. Moreover, in the study of Williamson et al. (2014) [
1], the majority of participants who were in sleep-deprived conditions reported increasing sleepiness levels, increasing the likelihood of falling asleep and of crashing.
Regarding age, there is evidence that young adults are a group that is more vulnerable to fatigue, for a number of reasons, which was compatible with the findings of Lowden et al. (2009) [
24], among others. Dahl (2008) [
25] adds that youths have a high sleep need because of their ongoing cognitive and physical development. Biologically, youths also tend to have shorter sleep schedules during the week and try to recover lost sleep during the weekend. This pattern has consequences on fatigue, which increases cumulatively over time [
26]. This fact is alarming, given that young people have a propensity for altered risk perception specifically when it comes to driving.
Men and women had significant differences in their drowsiness development. Studies have proven that gender can have notorious impacts on lifestyles, stress levels, and more in general on all aspects of human behavior [
27]. These aspects can be justified by biological purposes, whereas medical studies evidenced differences involving cognitive and psychophysiological physiognomies [
27]. To illustrate this issue, Armitage et al. (2001) [
28] compared the responses of men and women after sleep deprivation and found that the homeostatic pressure to sleep increases more quickly in women, which may lead to a stronger necessity for sleep in women than in men. In addition, studies found that sleep need is usually greater in women than in men and stated that “These results seem to indicate a greater ideal sleep requirement in women that results in an advanced sleep-onset time” [
29]. These finding are consistent with our results, and the fact that women self-evaluate as sleepier than man can be related to a stronger need for rest, which can be later reflected in sleepiness episodes during the day.
With respect to smoking habits, the results were not in line with some studies. For instance, Phillips & Danner (1995) [
30] studied the relationship between cigarette smoking, poor sleep habits, and sleep complaints. The conclusions achieved in their study were that cigarette smokers were more prone to report difficulties in getting and remaining asleep, which could reflect later episodes of daytime sleepiness. On the contrary, our results showed that smokers reported being more alert. Anxiety can be one possible justification for this outcome. Given the start time and duration of the session, a driver who smokes may feel the necessity to have a cigarette and may feel impatient until the end of the session. The anxiety caused by this need makes it difficult for the participant to relax, which reflects on the drowsiness levels not being too high.
Regarding the BMI, the model results showed a negative correlation, which means that sleepiness had higher values as the BMI decreased. These results go against what we found in the literature. Mokhber et al. (2016) [
31], for instance, studied a sample that contained 55 obese people (case group) and 55 non-obese people (control group) and found a significant association between the BMI and sleepiness in the case group. Furthermore, their likelihood of reporting sleepiness increased significantly as their BMI increased. In another study, Maugeri et al. (2018) [
32] found out that those who reported excessive daytime sleepiness had a higher BMI. It should be noted that, in our study, we did not collect data such as the percentage of fat or muscular mass, which means that participants that could be labeled with a higher weight were not necessarily obese people. Indeed, if we assume the BMI as an indicator of robustness, a valid outcome is that more robust people were more likely to stay alert. Nevertheless, the sample needs to be extended for it to be possible to make clear conclusions about this variable.
Regarding the relationship between medication and drowsiness, Pagel (2009) [
33] says that “sleepiness is the most commonly reported side effect of pharmacologic agents that act on the central nervous system”. The author adds that some medical drugs are associated with decreased performance on driving tests and increased levels of next-day motor vehicle incidents attributed to daytime sleepiness (sedating antihistamines, longer-acting benzodiazepines, and sedating antidepressants, for instance). Our results are consistent with these findings, and it is possible to notice significant differences among those who took medication related to depression/anxiety/muscle relaxants and those who did not take any medication, where the first group reported higher sleepiness levels.
In this study, it is worth noting that the variable stress does not represent instantaneous stress. The question was formulated as “Have you had any abnormal stress in the last 24 hours?” and the answer was “yes” for five participants. A limitation concerning this question is that it is impossible to know if the stress situation occurred on the morning of the driving session or on the day before. For these last cases, it is reasonable to assume that stress may have interfered with sleep patterns. For that reason, we analyzed the correlation between stress and hours slept during the night before the driving, but the value was too low to assume a significant correlation (0.06). However, quantity is not quality, and the data only represent the hours slept and not the quality of the rest, which is expected to be poorer in a stressful situation.
With respect to the Lognormal and Poisson Models results, we measured and analyzed separately two variables that represent driving performance. Several authors have studied the drowsiness effects on speed. However, this indicator still does not follow a pattern, and the conclusions can be diverse. In a driving simulator study that aimed to understand the effects of light settings on driving performance, the results showed that it had significant effects on speed [
17]. In the darkness, where it was proven that the drowsiness levels were higher, the speed was 0.9 km/h slower. The authors also revealed that speed decreased while driving at night. This behavior might be associated with an increase in carefulness during sleepiness. On the other hand, the results from the present study showed an increase in speed in drowsiness states. This conclusion is also consistent with some previous studies. For instance, Du et al. (2015) [
34] studied the effects of road geometry on drowsiness and fatigue and found that “the mean speed was consistently higher in fatigued driving than in alert driving”, and these effects were stronger on curves. In addition, Hargutt et al. (2000) [
35] showed that participants tend to adopt higher speeds with an increasing time driving on a simulator. The European Commission (2015) [
36] stated that “by changing speed drivers may change sensory input which may spur the body and mind to put in extra effort to notice and respond to signals from the environment”. The presented explanation suggests that, by increasing the speed, the drivers are forcing themselves to be more attentive, which is a way to fight sleepiness and boredom.
Lane position is a strong predictor of drowsiness, leading to the development of alert technology based on this variable. To illustrate the approach, Caponecchia and Williamson (2018) [
12] conducted a study that found that sleep-deprived drivers had increasing lane deviations. The research’s outcomes were in line with previous studies [
3,
23,
37,
38]. In our study, we used lane departures, since it is a measure that indicates when the driver is out of the lane, which only occurred in deep sleepiness levels (please note that participants had a pre-driving for adaptation to the driving simulator, and lane exits were not related to the control loss of the vehicle). The results showed that the higher the reported KSS level, the higher the number of lane deviations. Other studies found that lane departures/deviations were higher during night-time driving [
17] and for participants who showed more frequent sleepiness signs such as “eye strain”, “heavy eyelids”, “difficulty focusing”, and “difficulty keeping the eyes open” [
39]. Finally, the driving time showed an impact on all of the analysed variables. Note that this variable is not highly correlated with KSS (0.34), and therefore, we assume that it does not measure drowsiness but rather other factors such as boredom and anxiety to finish the task, which in time can influence the occurrence of drowsiness. Indeed, the BPM showed that the probability of being drowsy (KSS > 6) occured after 30 min of continuous driving, increasing in the next intervals; however, in the last 75 min the increase was lower than during the previous interval. Of course, this threshold of 30 min cannot be compared to real driving, but past studies, such as the one from Philip et al. (2005) [
40], also showed that the subjects became drowsy within 20 to 25 min of driving in a simulator.
Additionally, and besides the drowsiness effect, the driving time also had an impact on speed and lane departure after only 30 min and 45 min of driving, respectively. The driving time increased both the speed and lane departure.
As expected, these findings contradict the observation made by Thiffault & Bergeron (2003) [
41] that stated that, in a real environment, the duration of the drive does not impact the performance during the first two hours.
6. Conclusions
In sum, this study shows that sleepiness is strongly affected by the drivers’ lifestyle and the duration of the driving task. In addition, it was possible to find a great influence of sleepiness levels on the speed and on the position of the drivers in the lane, represented by their deviations outside the road. Statistical analyses were applied, and we verified that both approaches were consistently related to subjective sleepiness. The KSS was already validated in previous studies, showing potential as a predictor of sleepiness.
Nevertheless, some limitations can be pointed out. The sample of 50 participants does not represent the general population or a group of the population. In fact, it was not possible to consider participants of all ages, which limited the analysis based on typical age-groups. Another limitation is related to the way that the KSS is collected. When a message is received by the participant to make an auto-evaluation and respond loudly, it is expected that the participant will increase his/her instant alertness [
20]. Nonetheless, this subjective measure has shown reliable results in previous studies, which overtakes its limitations. Here, further work is suggested on this topic. To overcome one of our limitations, a work could be completed with a larger and representative sample. Furthermore, an interesting approach would be to compare the KSS with other measures collected by driver biometric monitoring, in particular with novel technological devices.
Overall, this research confirms previous findings and presents novel outcomes that contribute to the assessment of existing technologies and that guide future developments on drowsiness detection systems. In this sense, this research provides better and structured knowledge on driver behavior that feeds into the evolution of tailored technology for drowsiness detection and warning according to drivers’ characteristics.

 ,
, 

