Article

Socio-economic Study to Improve the Electrical Sustainability of the North Tower of Instituto Superior Técnico

by
Beatriz Durão
1,
João Paulo N. Torres
1,2,*,
Carlos A. F. Fernandes
1,2 and
Ricardo A. Marques Lameirinhas
1,*
1
Department of Electrical and Computer Engineering, Instituto Superior Técnico, 1049-001 Lisbon, Portugal
2
Instituto de Telecomunicações, 1049-001 Lisbon, Portugal
*
Authors to whom correspondence should be addressed.
Sustainability 2020, 12(5), 1923; https://doi.org/10.3390/su12051923
Submission received: 7 February 2020 / Revised: 25 February 2020 / Accepted: 1 March 2020 / Published: 3 March 2020

Abstract

:
In this paper, an autonomous photovoltaic system is going to be designed for the North Tower of Instituto Superior Técnico through the application of solar panels on its windows, using them as producers of electricity based on solar energy. The main objectives of this paper are: (1) to make the building energetically autonomous, using an integrated system of solar photovoltaic technology; (2) check the system behaviour and comment on possible system impacts on the user’s lifestyle. Two solutions are going to be proposed to cover/substitute the windows of the Tower, one using amorphous silicon panels and the other using crystalline silicon panels. Taking into account this type of solution, it is possible to recognize that there are positive impacts, such as the reduction of transmission lines/grids or the decentralisation of energy supplies. However, there are also disadvantages such as the need to have an energy storage system to guarantee the continuous supply. This study, for this building in particular, shows that organic photovoltaic cells have enormous advantages in the future in terms of our environment and social needs, but they do not yet produce the energy needed to meet today’s needs. Both solutions present a return estimative time of seven years, with an initial investment of approximately two million euros, but the produced energy will not be enough to create an off-grid system.

1. Introduction

Energy is the foundation of modern economies and a central need for modern life. It is a prerequisite for economic growth, improving living conditions and alleviating poverty. Therefore, access to energy is considered an important development goal [1].
In 2010, there were globally 1267 million people without access to electricity, out of which the majority lived in remote and isolated rural areas. To make the scenario more difficult, people are sparsely populated in these places. Out of many other reasons for not being electrified are very low power demand and economic burden to the government to build infrastructure [2]. Thus, renewable energy technologies offer a unique opportunity to provide affordable and sustainable energy to millions of people. Therefore, it is believed that modern standard of welfare, education, and health cannot be maintained without sufficient energy [3]. In addition to this, the awareness of climate change explains why the global investment in renewable energy sources for energy supply has grown continuously during the past decades and it is expected that it will increase considerably in the next decades as global demand for energy increases.
The sun serves as a giant nuclear furnace in space, constantly bathing our planet as a free energy supplier. The average amount of solar energy arriving at the top of our atmosphere is 1330 W/m2, however about half of this energy is absorbed by the atmosphere [4]. Among several solar energy technologies of sustainable energy sources, photovoltaic (PV) appears quite attractive for electricity generation, because it is noiseless, it has no carbon dioxide emission during operation, it is scalable, and it requires simple operation and maintenance processes [5]. Furthermore, the solar energy is costless, it does not need fuel and it is very abundant and it is easily achievable in many parts of the world. The required systems are cheap in comparison with other energy sources that are more limited sources with more expensive systems. Many scientific developments have allowed PV to be an economically and technically viable solution for many applications, from satellites to remote telecommunication systems and pocket calculators. These systems are called autonomous systems, since they produce electricity for one specific need, with no other input need [6].

2. CO2 Sources and Its Availability in Portugal

A significant percentage of global greenhouse gas (GHG) emissions are from fossil fuels commonly used to produce electricity. The latest official Portuguese report on GHG emissions (APA, 2017) indicates that in 2015 the GHG net emissions in Portugal had been 1.58% lower than the emission levels verified in 1990. GHG emissions from energy and industrial processes have increased 18% and account for 80% of total emissions in Portugal [7].
Based on 2015 GHG levels, the total GHG emissions in Portugal will need to be reduced until 2050. To meet these goals, Portugal faces the challenge of reducing its GHG emissions by 87% in the next 35 years. The energy sector, and particularly the power sector, will play a major role in this path towards lower GHG emissions [7].

Possible Solution

Portugal is strongly dependent on foreign countries in what concerns to fossil fuels but is also a country with plenty of natural resources, allowing the development and the use of renewable energies [8]. Portugal has one of the best yearly solar radiation in the whole Europe, which gives a huge advantage for the country, because the electricity produced in Portugal can cost 40% less than the other Europeans countries.

3. The Future of Solar Panels

“Imagine a world where we could generate electricity using the surface of our windows, smartphones, our cars sunroof or the glass roof of our office building. What sounds like a far-away dream, is on its way to become reality thanks to transparent solar panels” [9]. Sun light is available for free almost everywhere, but the guarantee of using light to generate power was restricted to solar farms and rooftop panels. Recently, transparent solar cells (TSC) caught the attention of scientists due to their variety of possible applications in our daily lives. TSC are already in use for these applications in some countries, while others are for the far future, once their efficiency is improved. Building Integrated Photovoltaics (BIPV) is the nearest application for TSC. If all the buildings with 90% glass on their surface used TSC printed on their glass surface, the solar cells have the potential to power more than 40% of their energy consumption [10].

Organic Photovoltaic Urban Facades
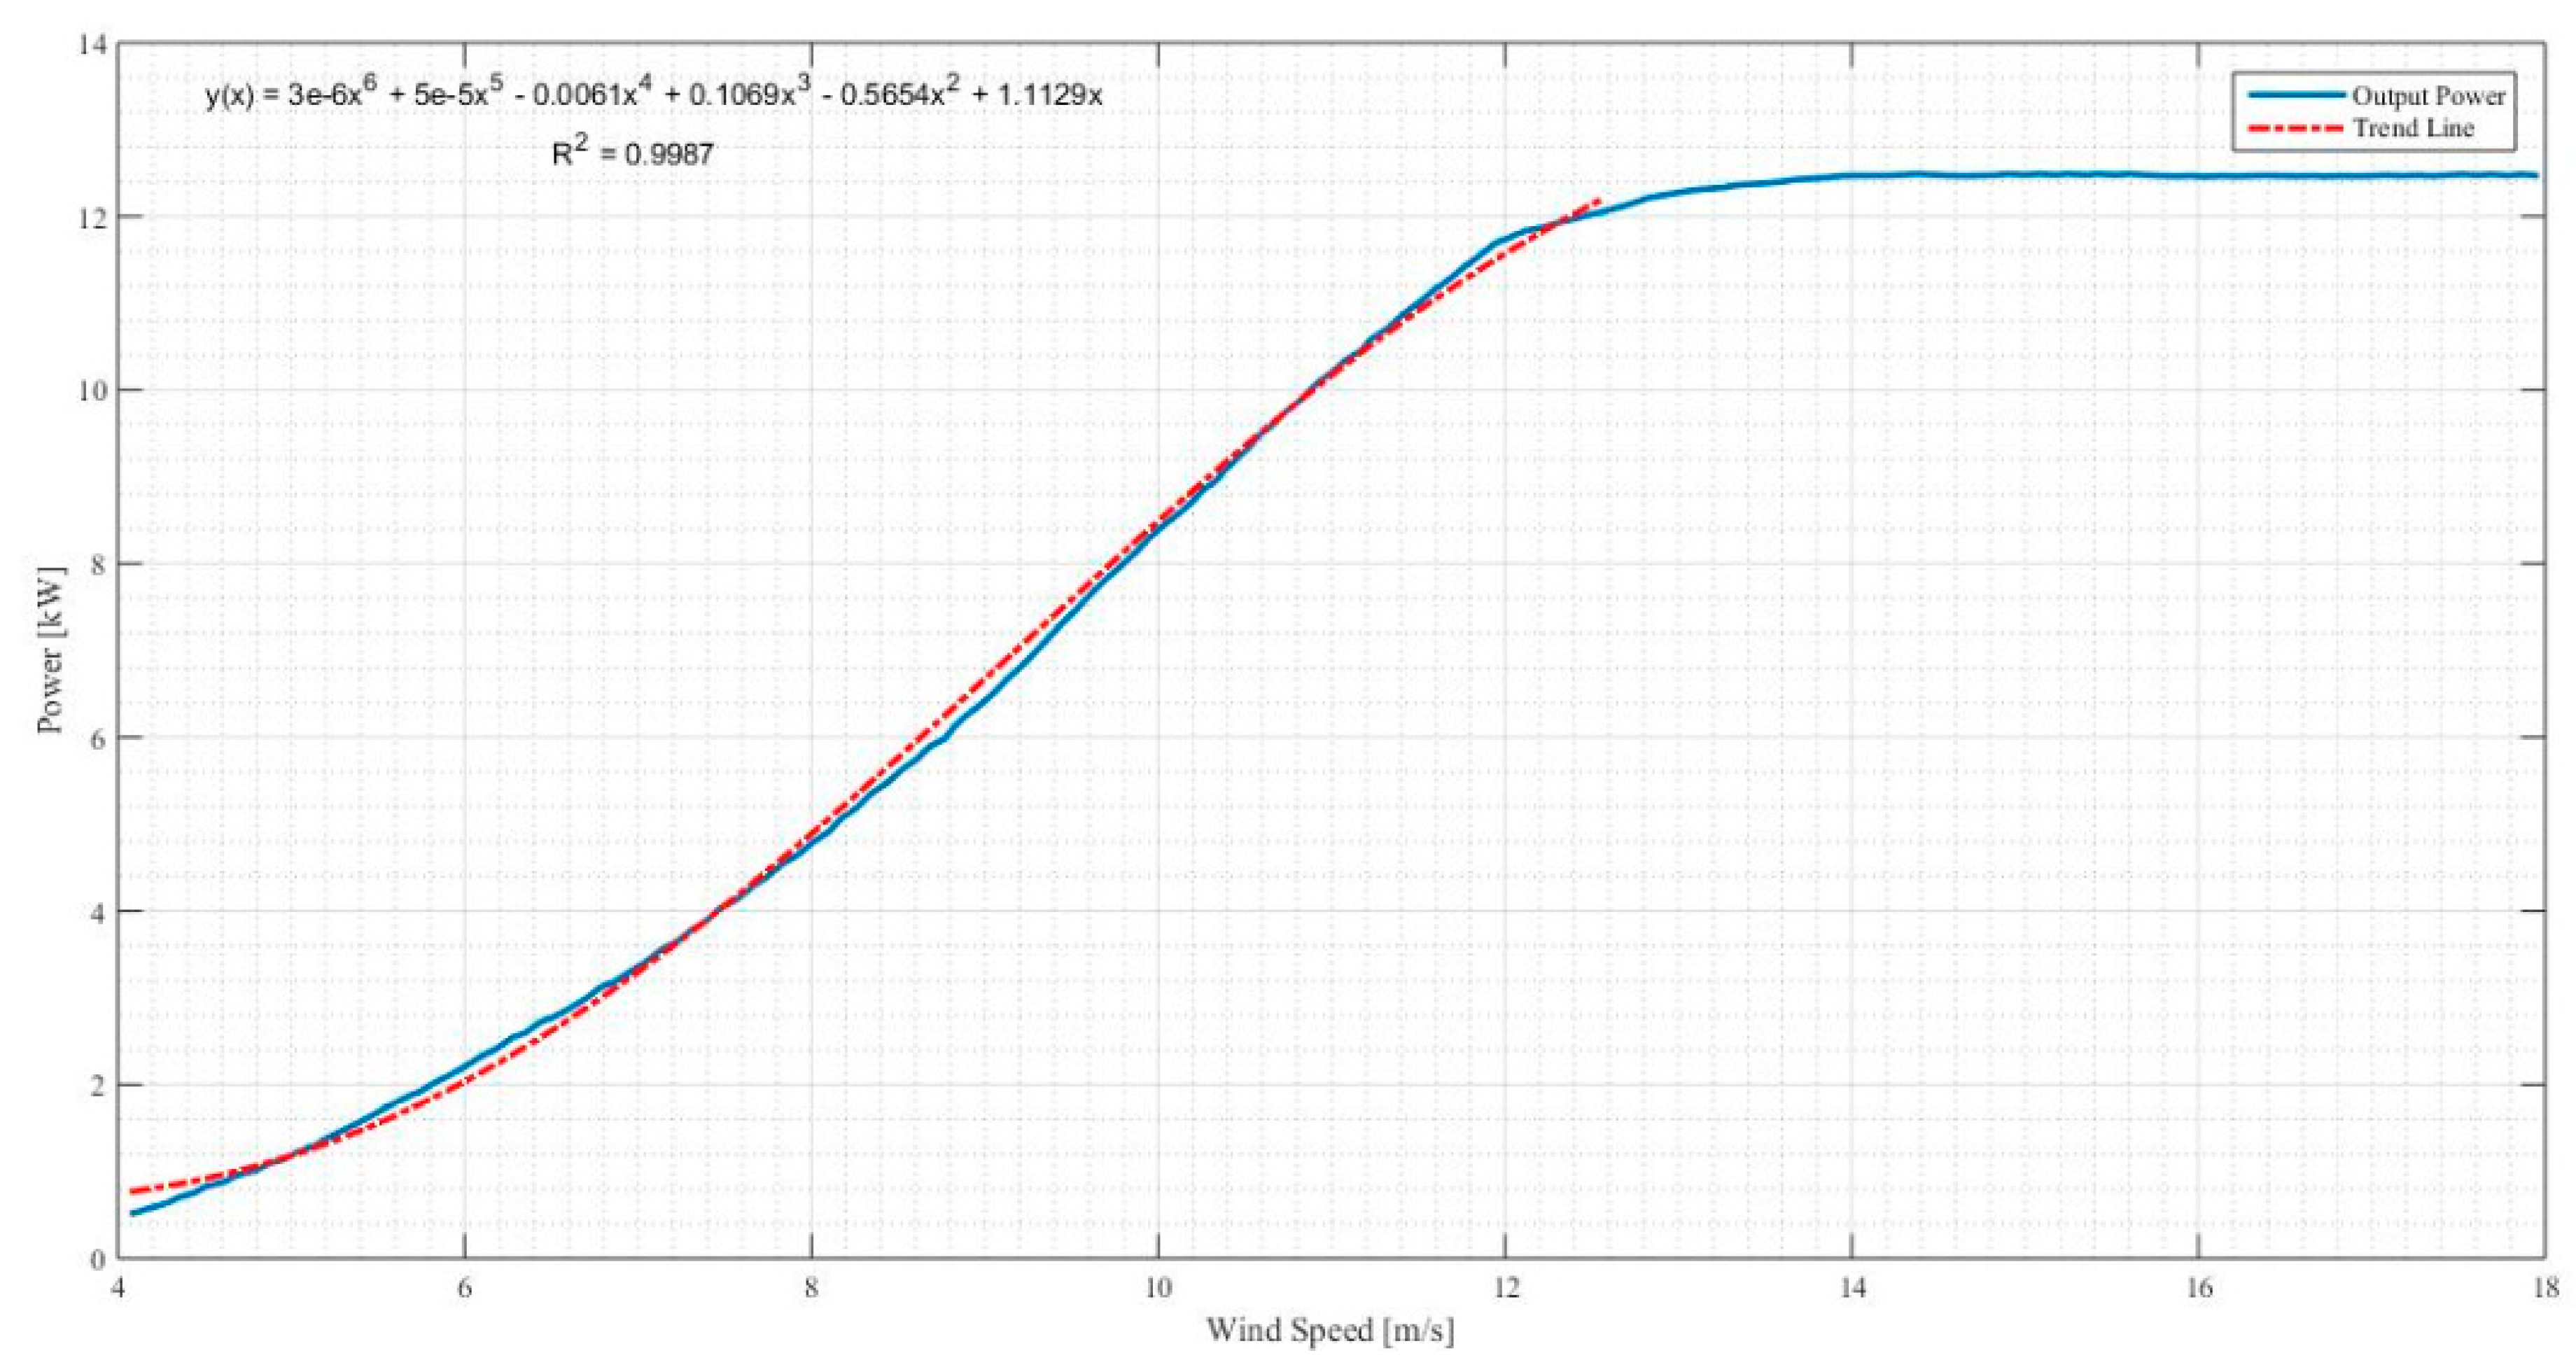
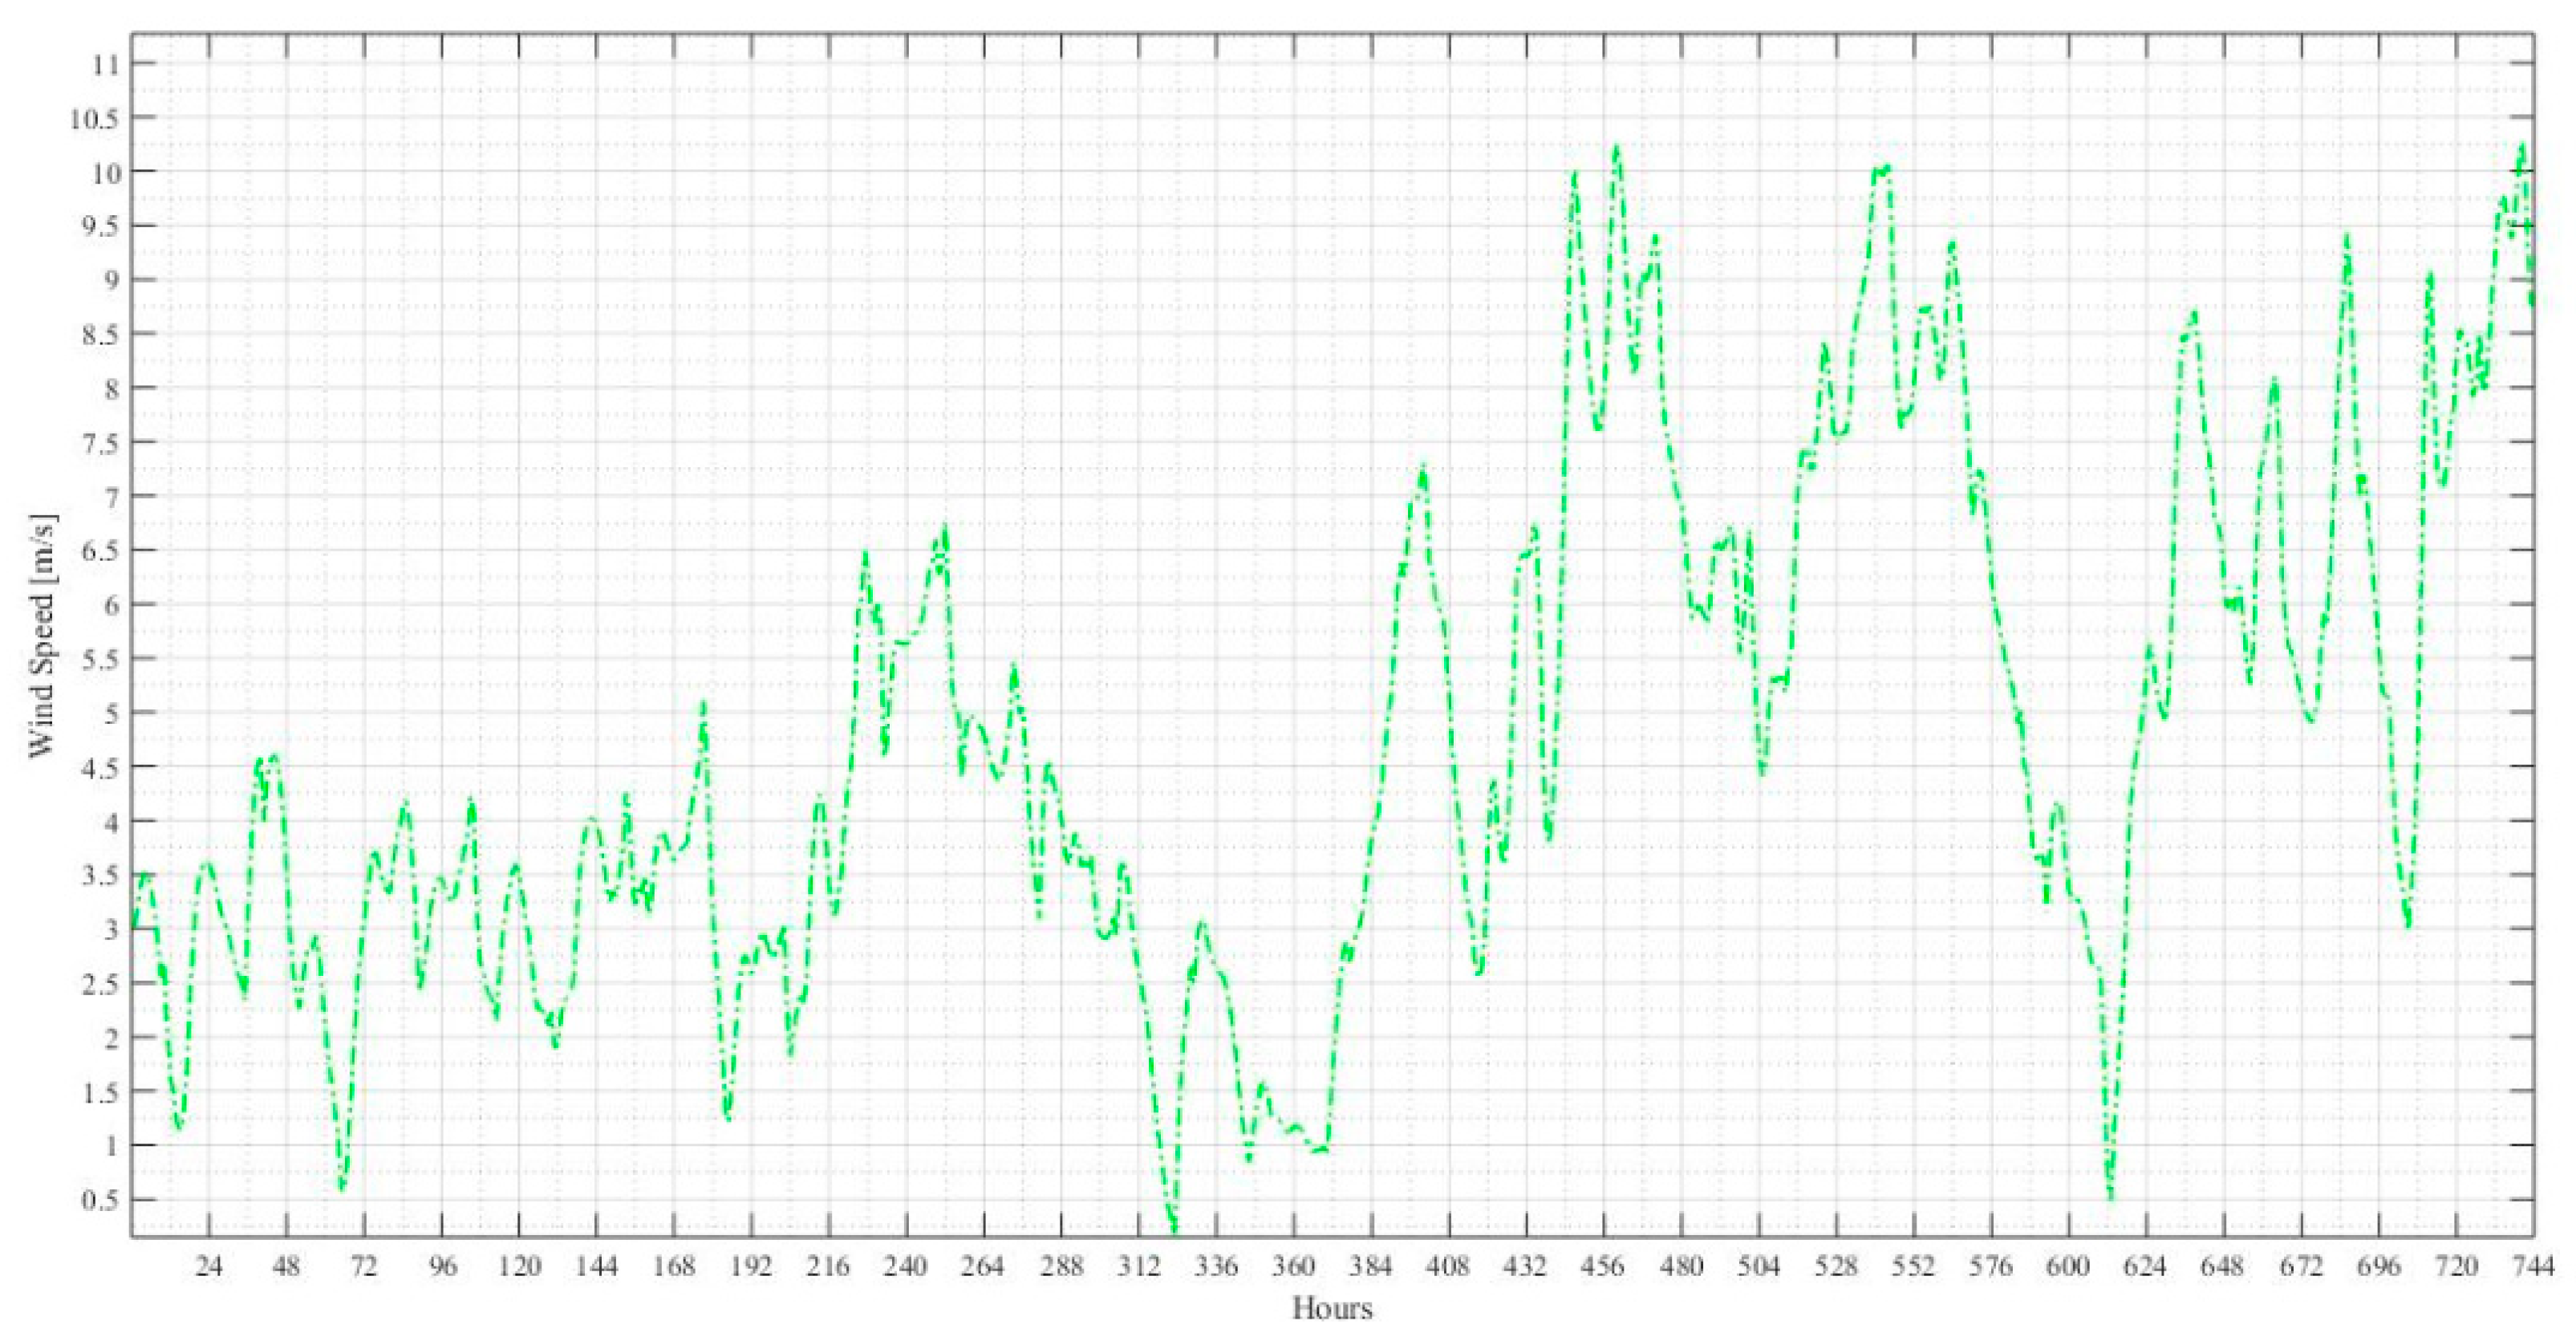
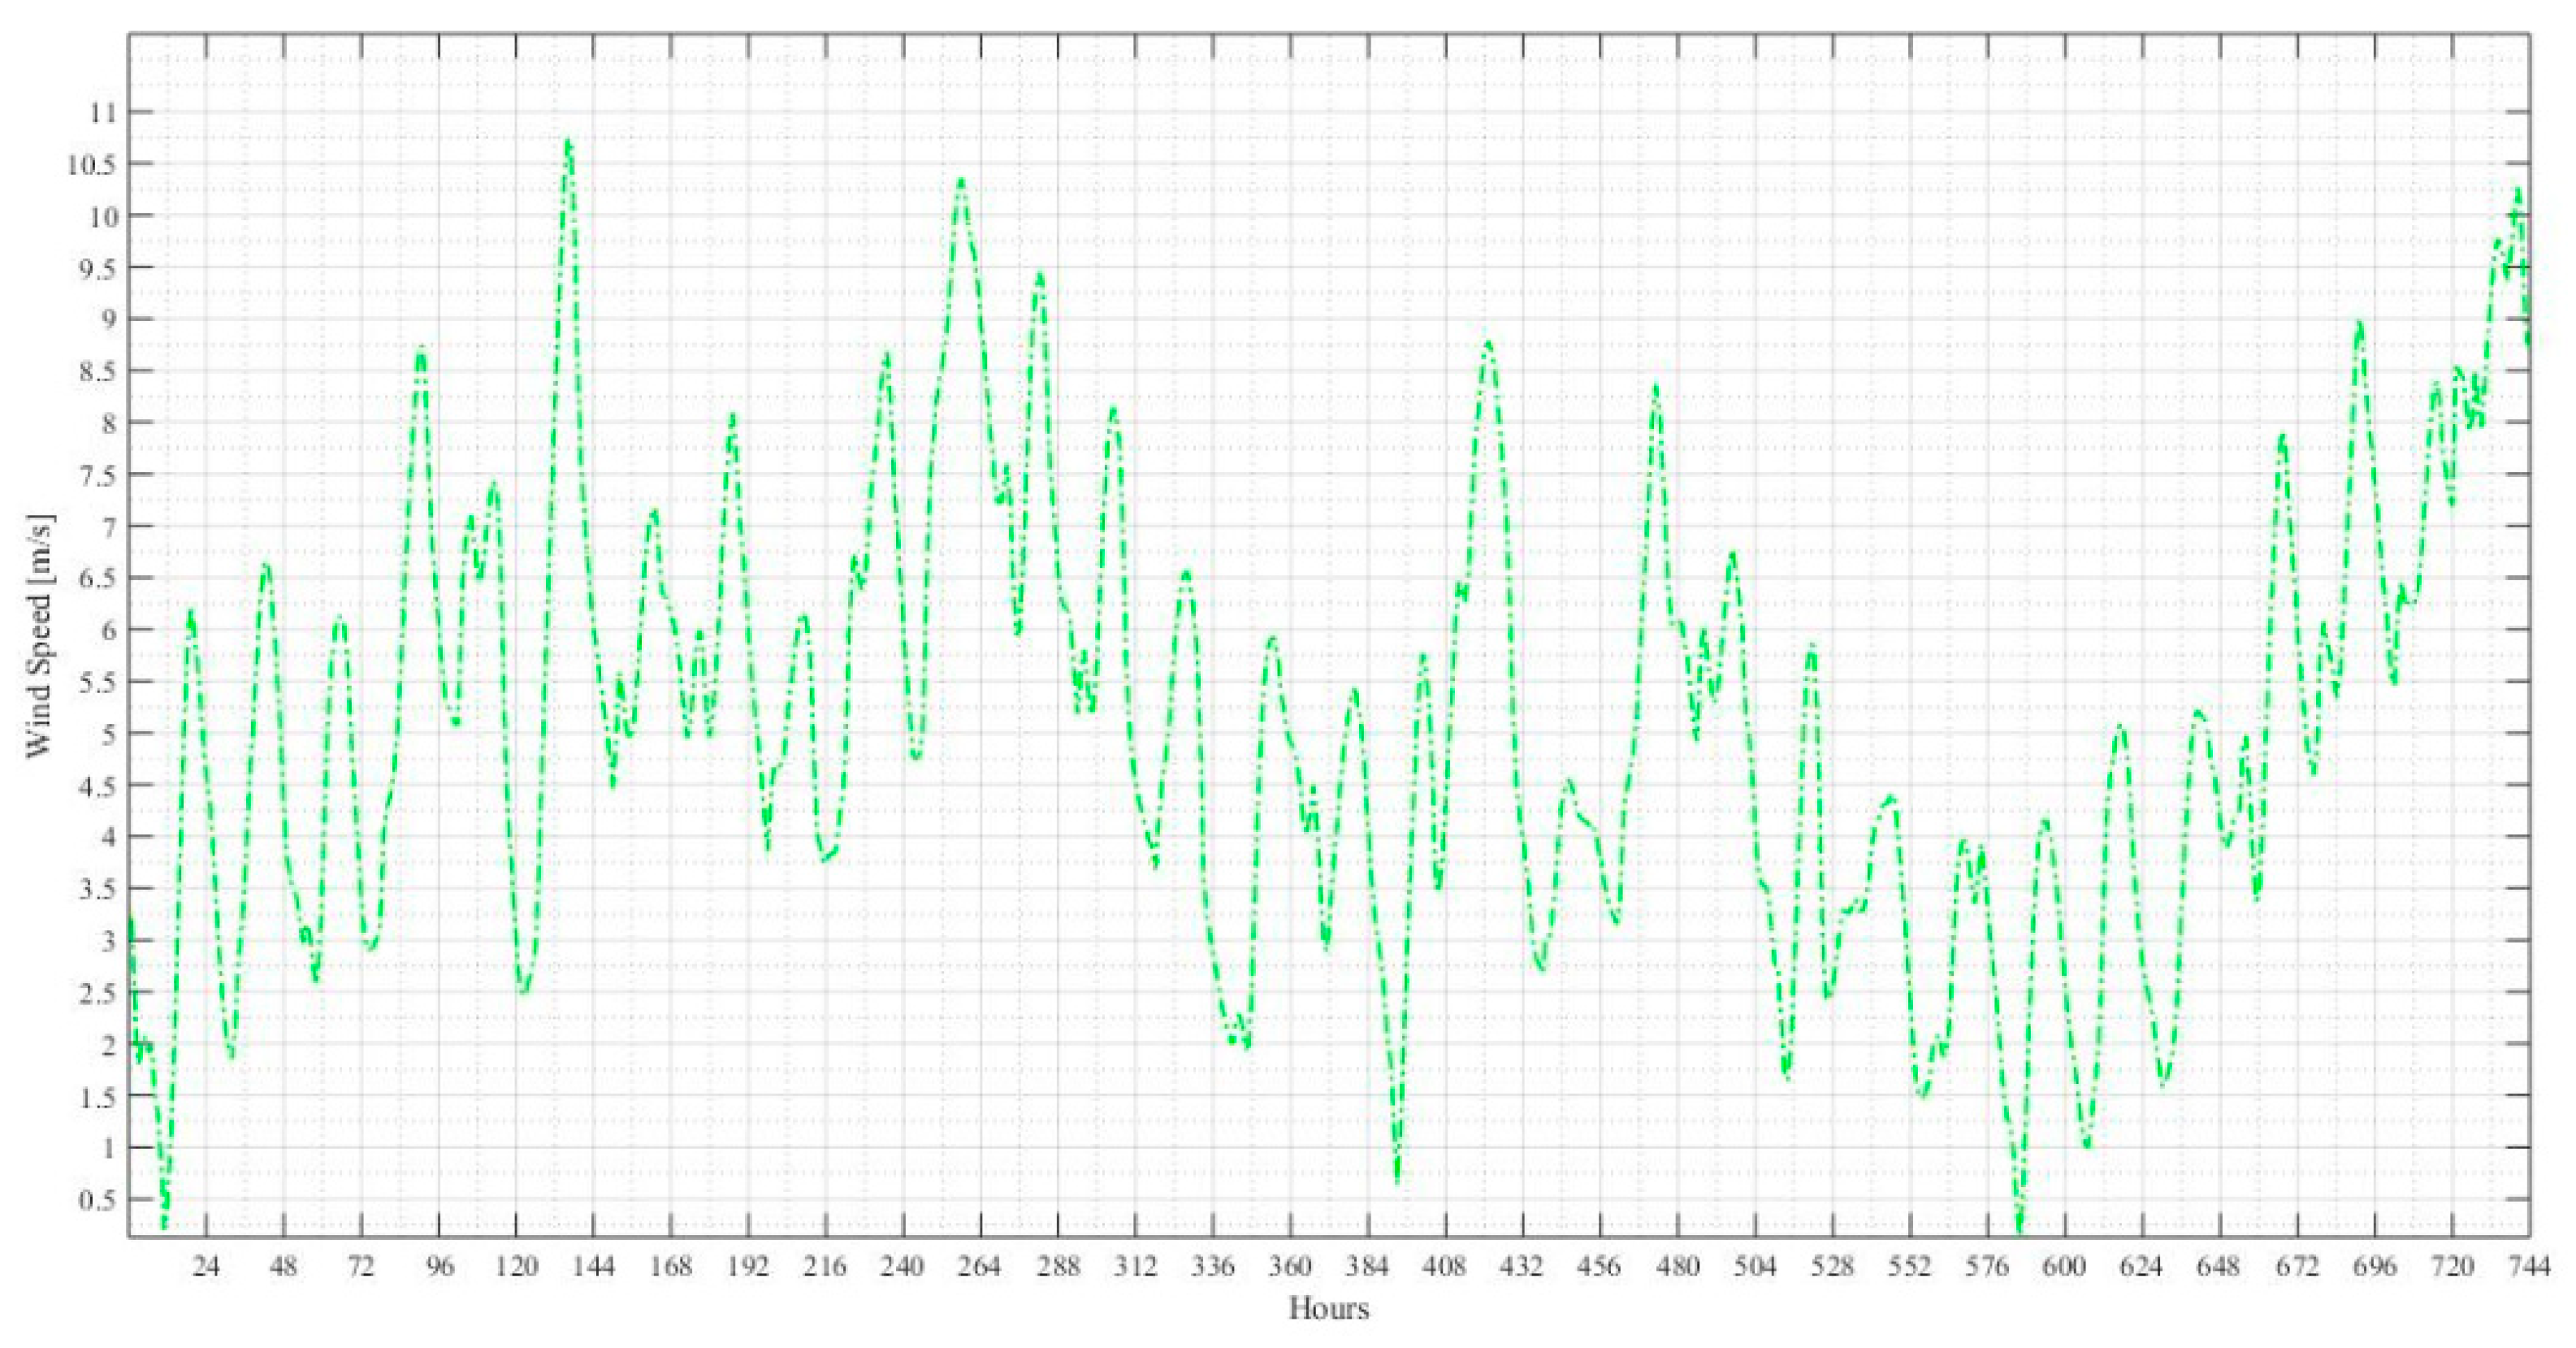
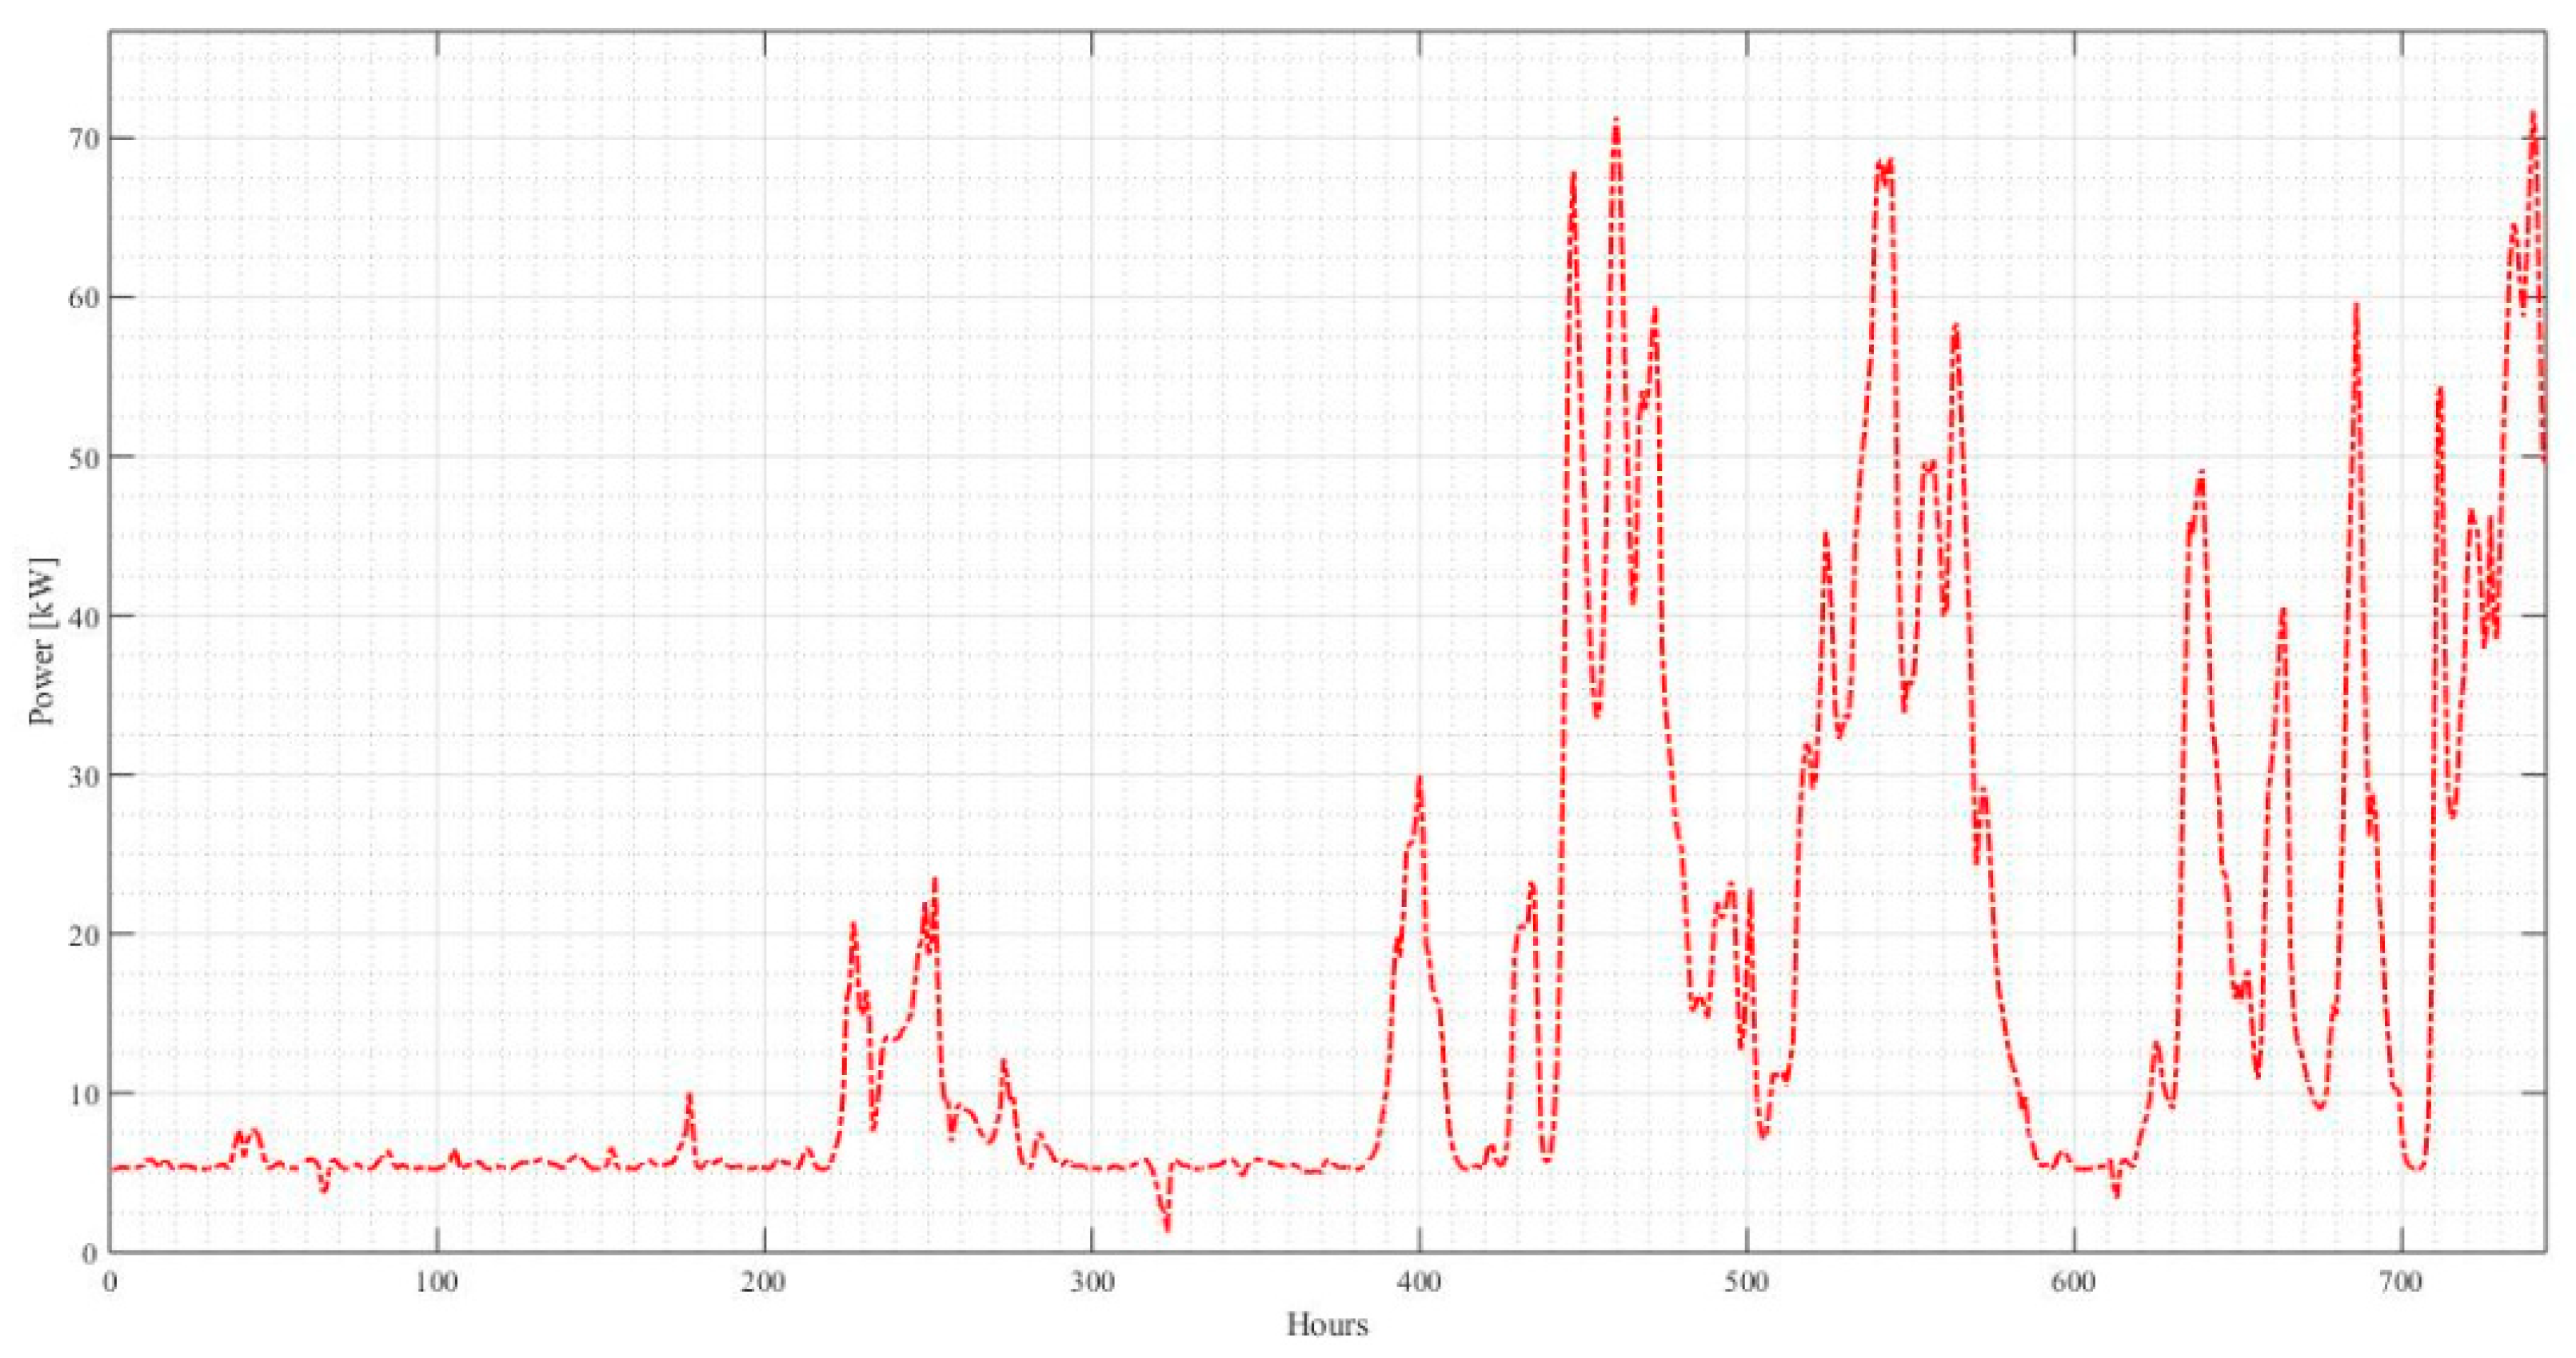
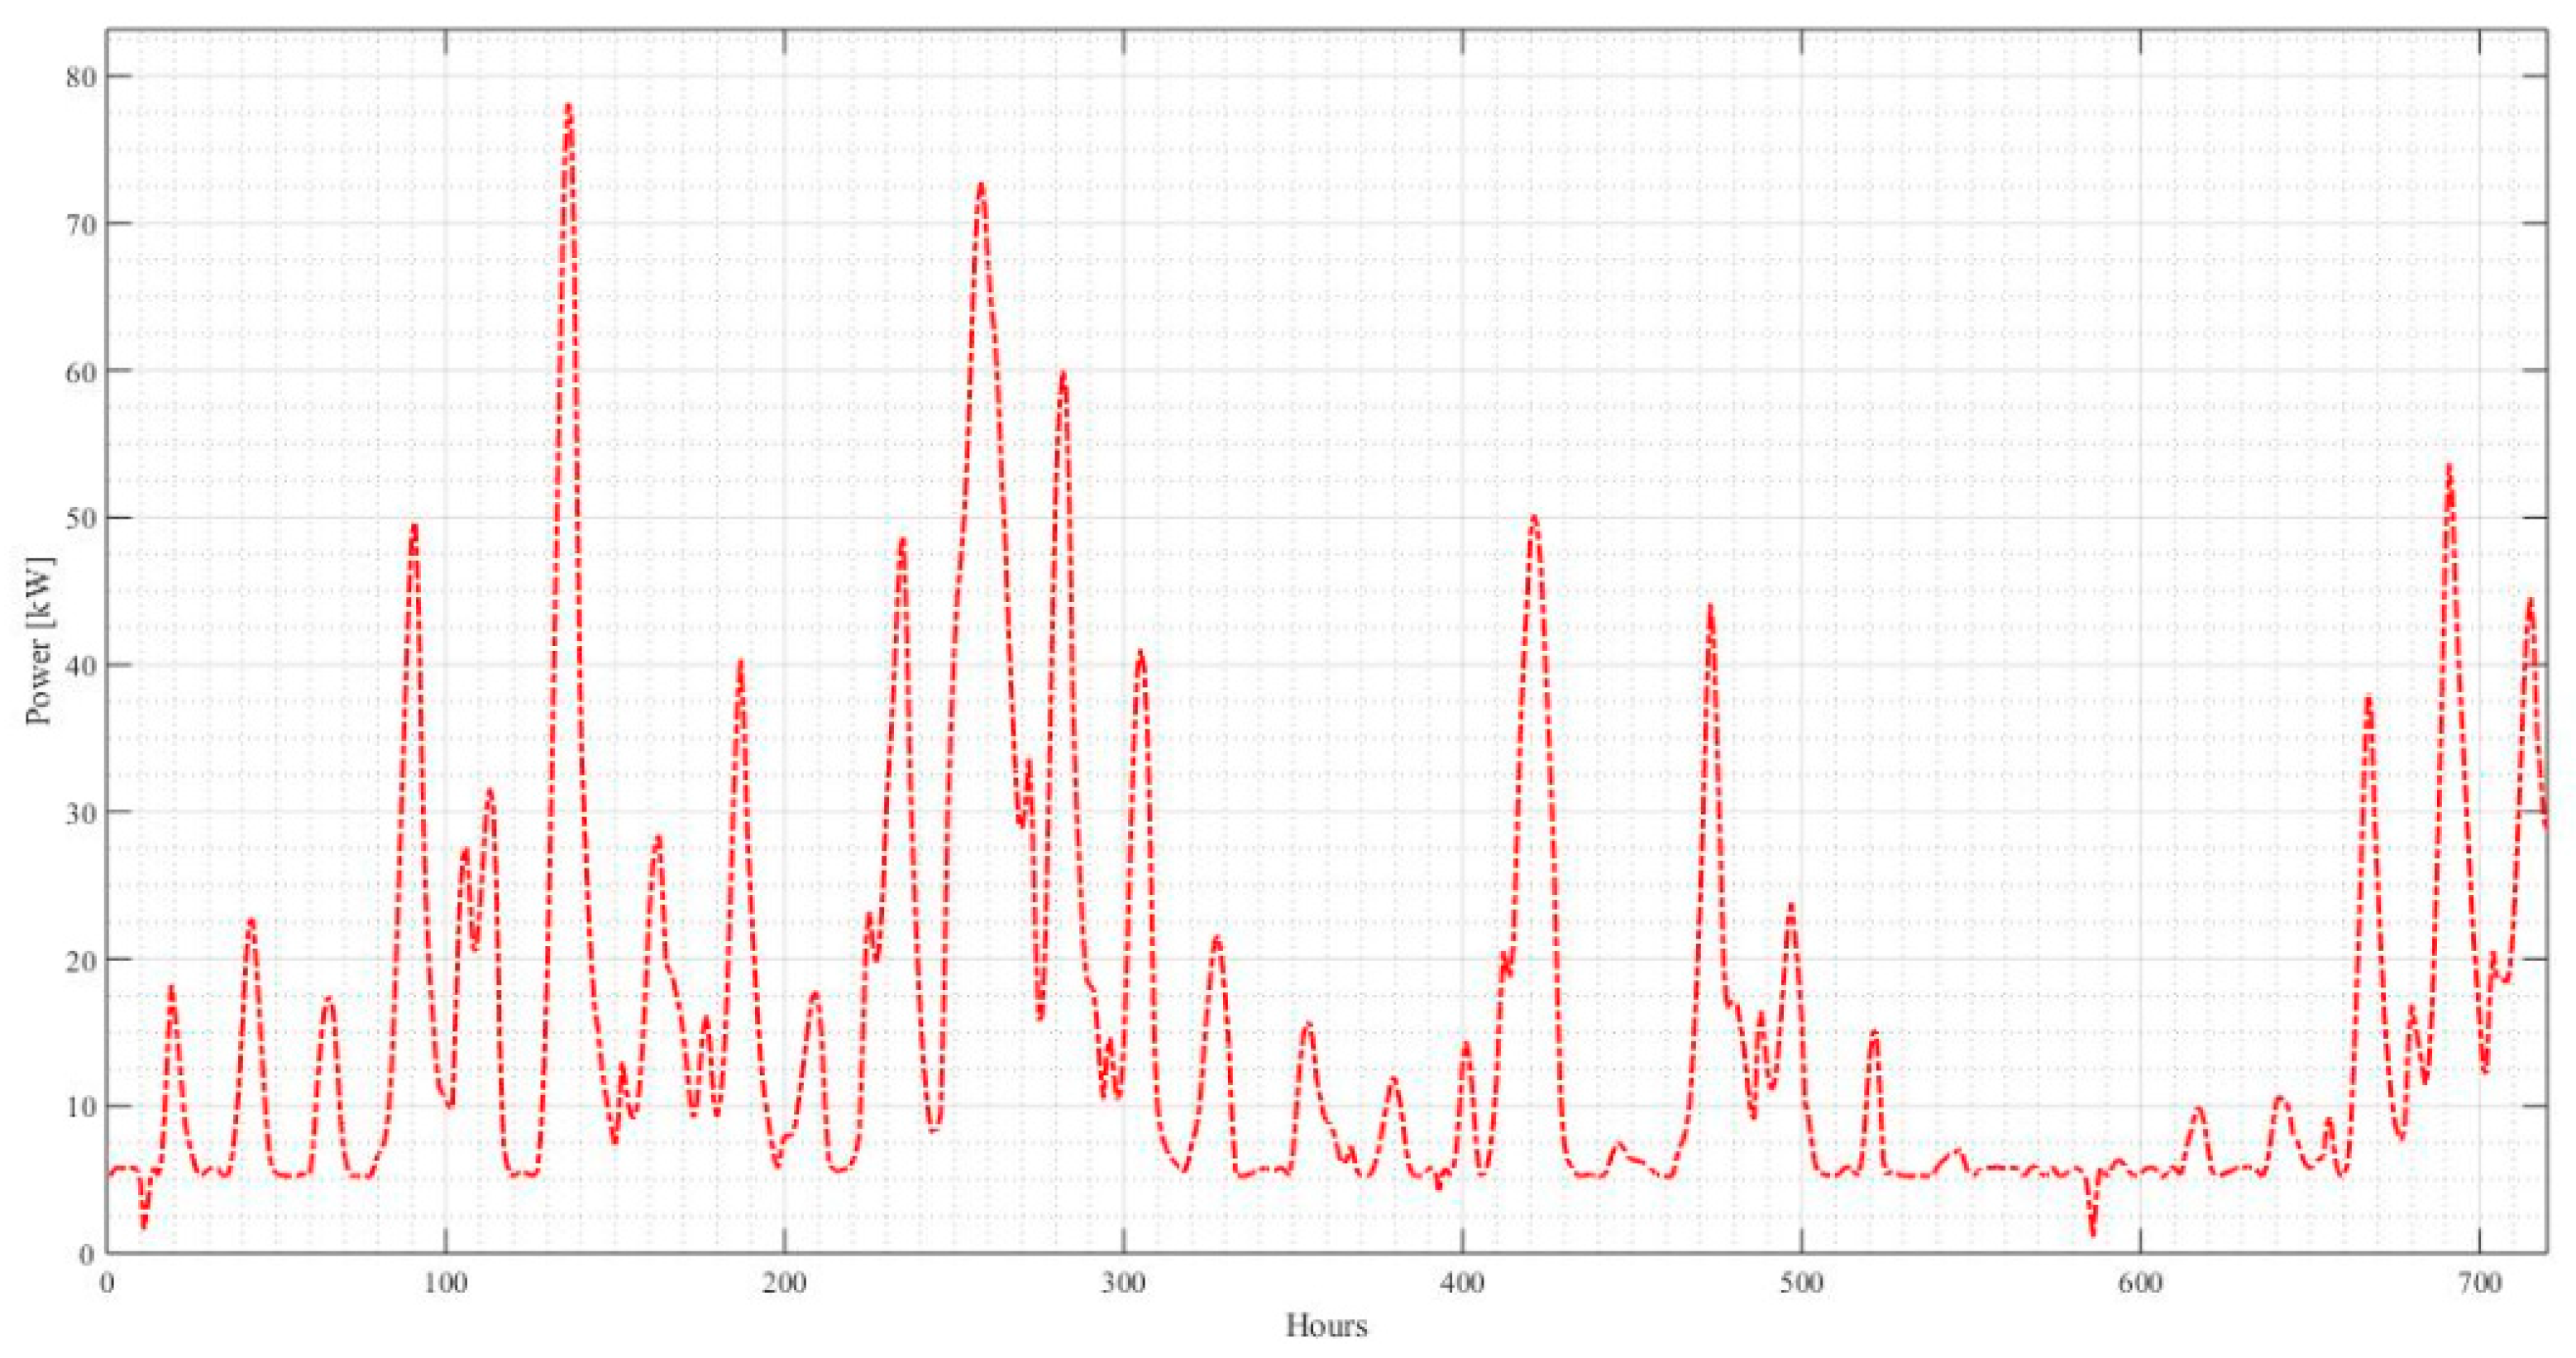
Relatively to organic photovoltaic (OPV), there are many important advantages of OPV technology, especially with respect to the use as BIPV. OPV modules do not show the performance drop usually observed with traditional inorganic photovoltaics, in diffuse lightning conditions and under elevated temperatures, which are usual conditions for a facade [11]. One aim of integrating OPV technology into facade elements is to reduce both the energy consumption and CO2 emissions of the building [12]. Compared to classic PV technology, OPV are better in both functional and aesthetic demands of designers and architects while also enabling the use of BIPV. OPV modules have been integrated into various glass facades and into structural membrane architectures [12]. However, organic solar cells have very low efficiencies compared to conventional silicon cells. Therefore, a lot of scientific research is currently being done in order to develop these cells properties because of their various advantages in other branches, as mentioned above.

4. Wind Turbines

A short introduction to wind turbines will be made, because these devices will be considered as an alternative to installing solar panels on the rooftop. Building’s rooftops can be an excellent location for wind turbines, both because the electric power generation is close to the user and because they allow to take advantage of fast winds while reducing the cost of support towers. However, the identification of the turbines position must be preceded by a thorough analysis of available winds, because turbulence or calm areas, generated by surrounding buildings or different obstacles located on the roofs (air conditioning systems, antennas), could lead to an energy production significantly lower than expected [13].
Wind energy technologies can be classified into two categories: (1) Macro wind turbines that are installed for large-scale energy generation such as wind farms; (2) Micro wind turbines used for local electricity production.
Micro wind turbines are suitable for application at the building scale and are called building-integrated wind turbines. The main components of a wind turbine include blades, rotor, gearbox and generator. Small wind turbines were originally designed with a horizontal axis, also known as horizontal axis wind turbines (HAWTs). To reduce the need for a high tower, and for aesthetic reasons, vertical axis wind turbines (VAWTs) become increasingly popular for integrated building applications. Furthermore, VAWTs are also quieter (resulting in less noise nuisance) than HAWTs during operation [13,14].
Wind turbines can be grid-connected or off-grid. Off-grid systems require battery storage to store surplus electricity, thereby providing a more stable electricity supply. Their application is most suitable for rural and remote areas, such as remote villages and small isolated islands, where grid power is not available. Conventionally, grid-connected systems require power converters to convert the generated DC to AC power in order to be compatible with power grid and AC power-based appliances. As technologies improve, modern wind turbines can also directly generate AC power [14].
Recent developments in building integrated wind turbine technologies involve improving reliability, improving efficiency at low wind speeds and lowering capital cost. Wind turbine blades are now designed with lightweight materials and aerodynamic principles, so that they are sensitive to small air movements. Furthermore, the use of permanent magnet generators, based on rare earth permanent magnets, results in lightweight and compact systems that allow low cut-in wind speeds. In this way, electricity can be generated with wind speeds as low as a few metres per second.
To be more attractive for integrating into buildings, micro wind turbines are also being designed to be more visually attractive, without compromising their performance. Another objective is to reduce or even eliminate the noise associated with blade rotation and the gearbox/generator noise. This can be achieved by using low-noise blade designs, vibration isolators to reduce sound and sound absorbing materials around the gearbox and generator. Lastly, simplifying wind turbine components also adds to the attractiveness of wind turbine application and reduces maintenance costs. To lower the product costs, advanced blade manufacturing methods, such as injection moulding, compression moulding, and reaction injection moulding, are being applied to reduce labour and increase manufacturing quality [14].

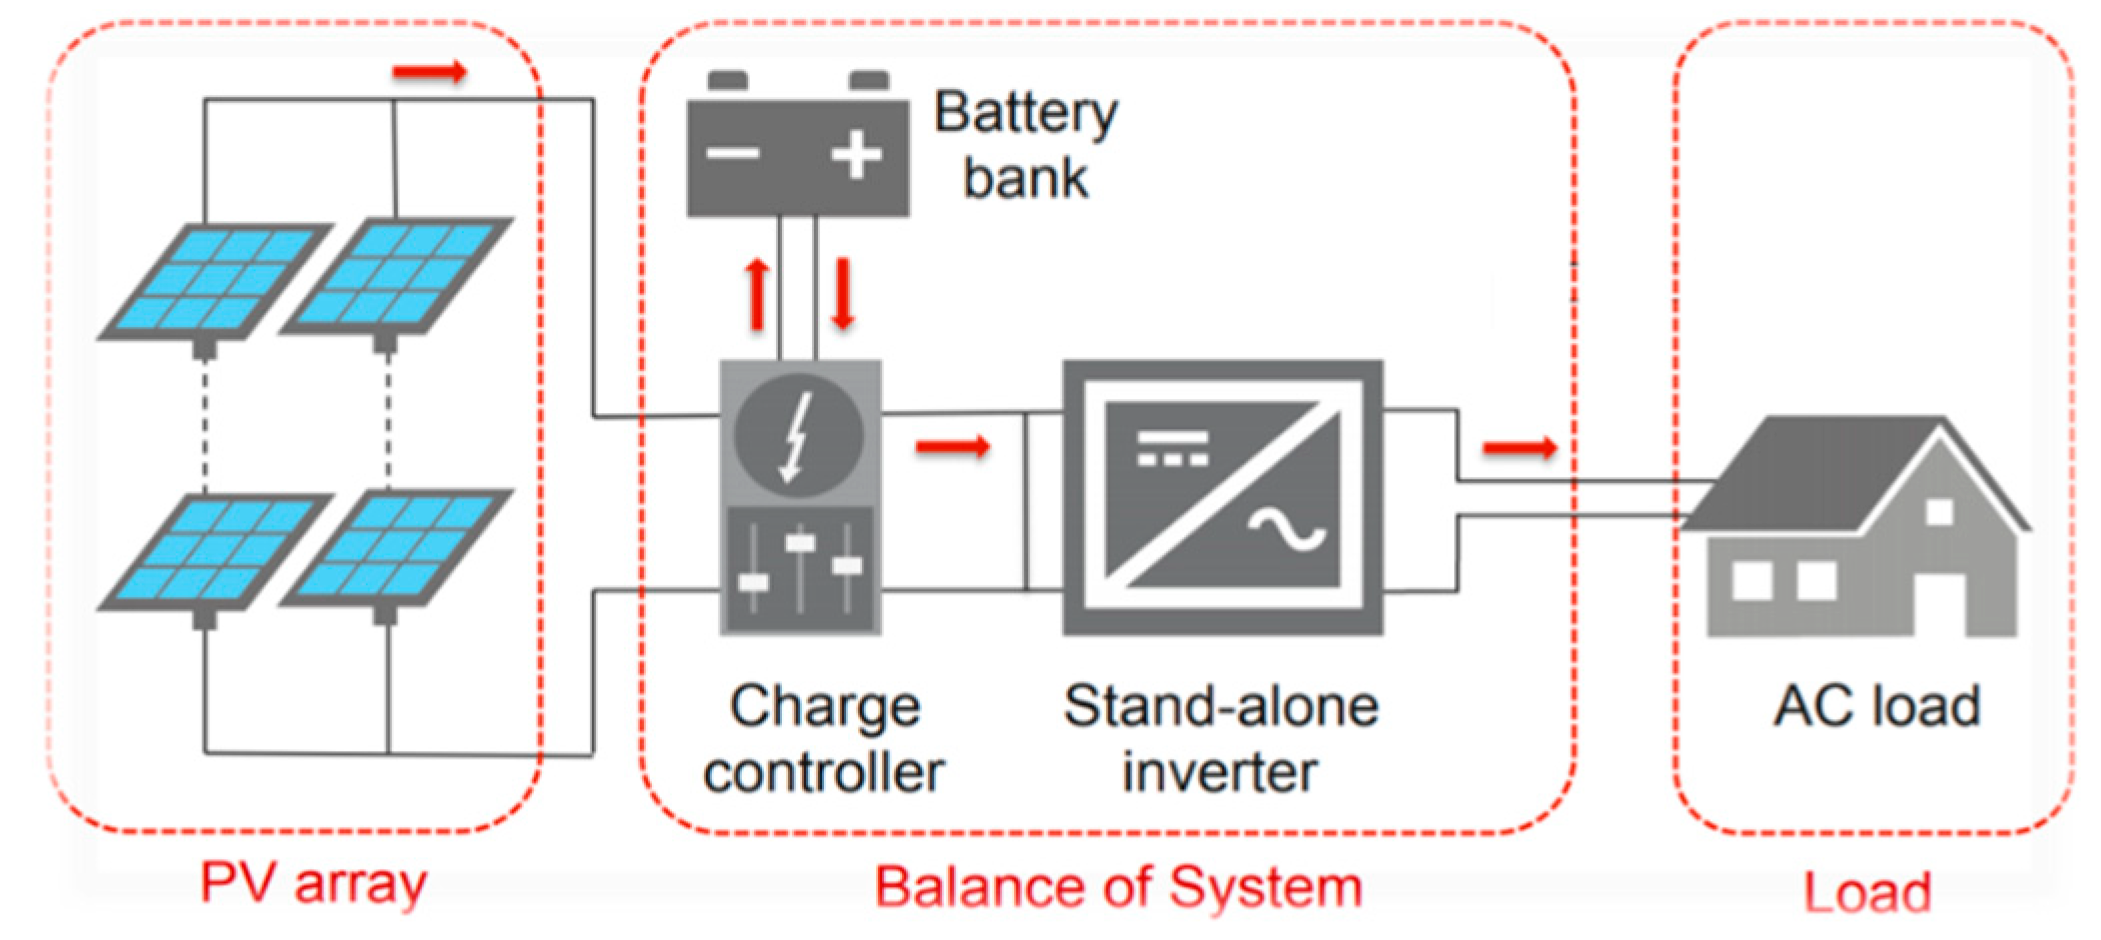
5. Design of an Autonomous Photovoltaic System the North Tower
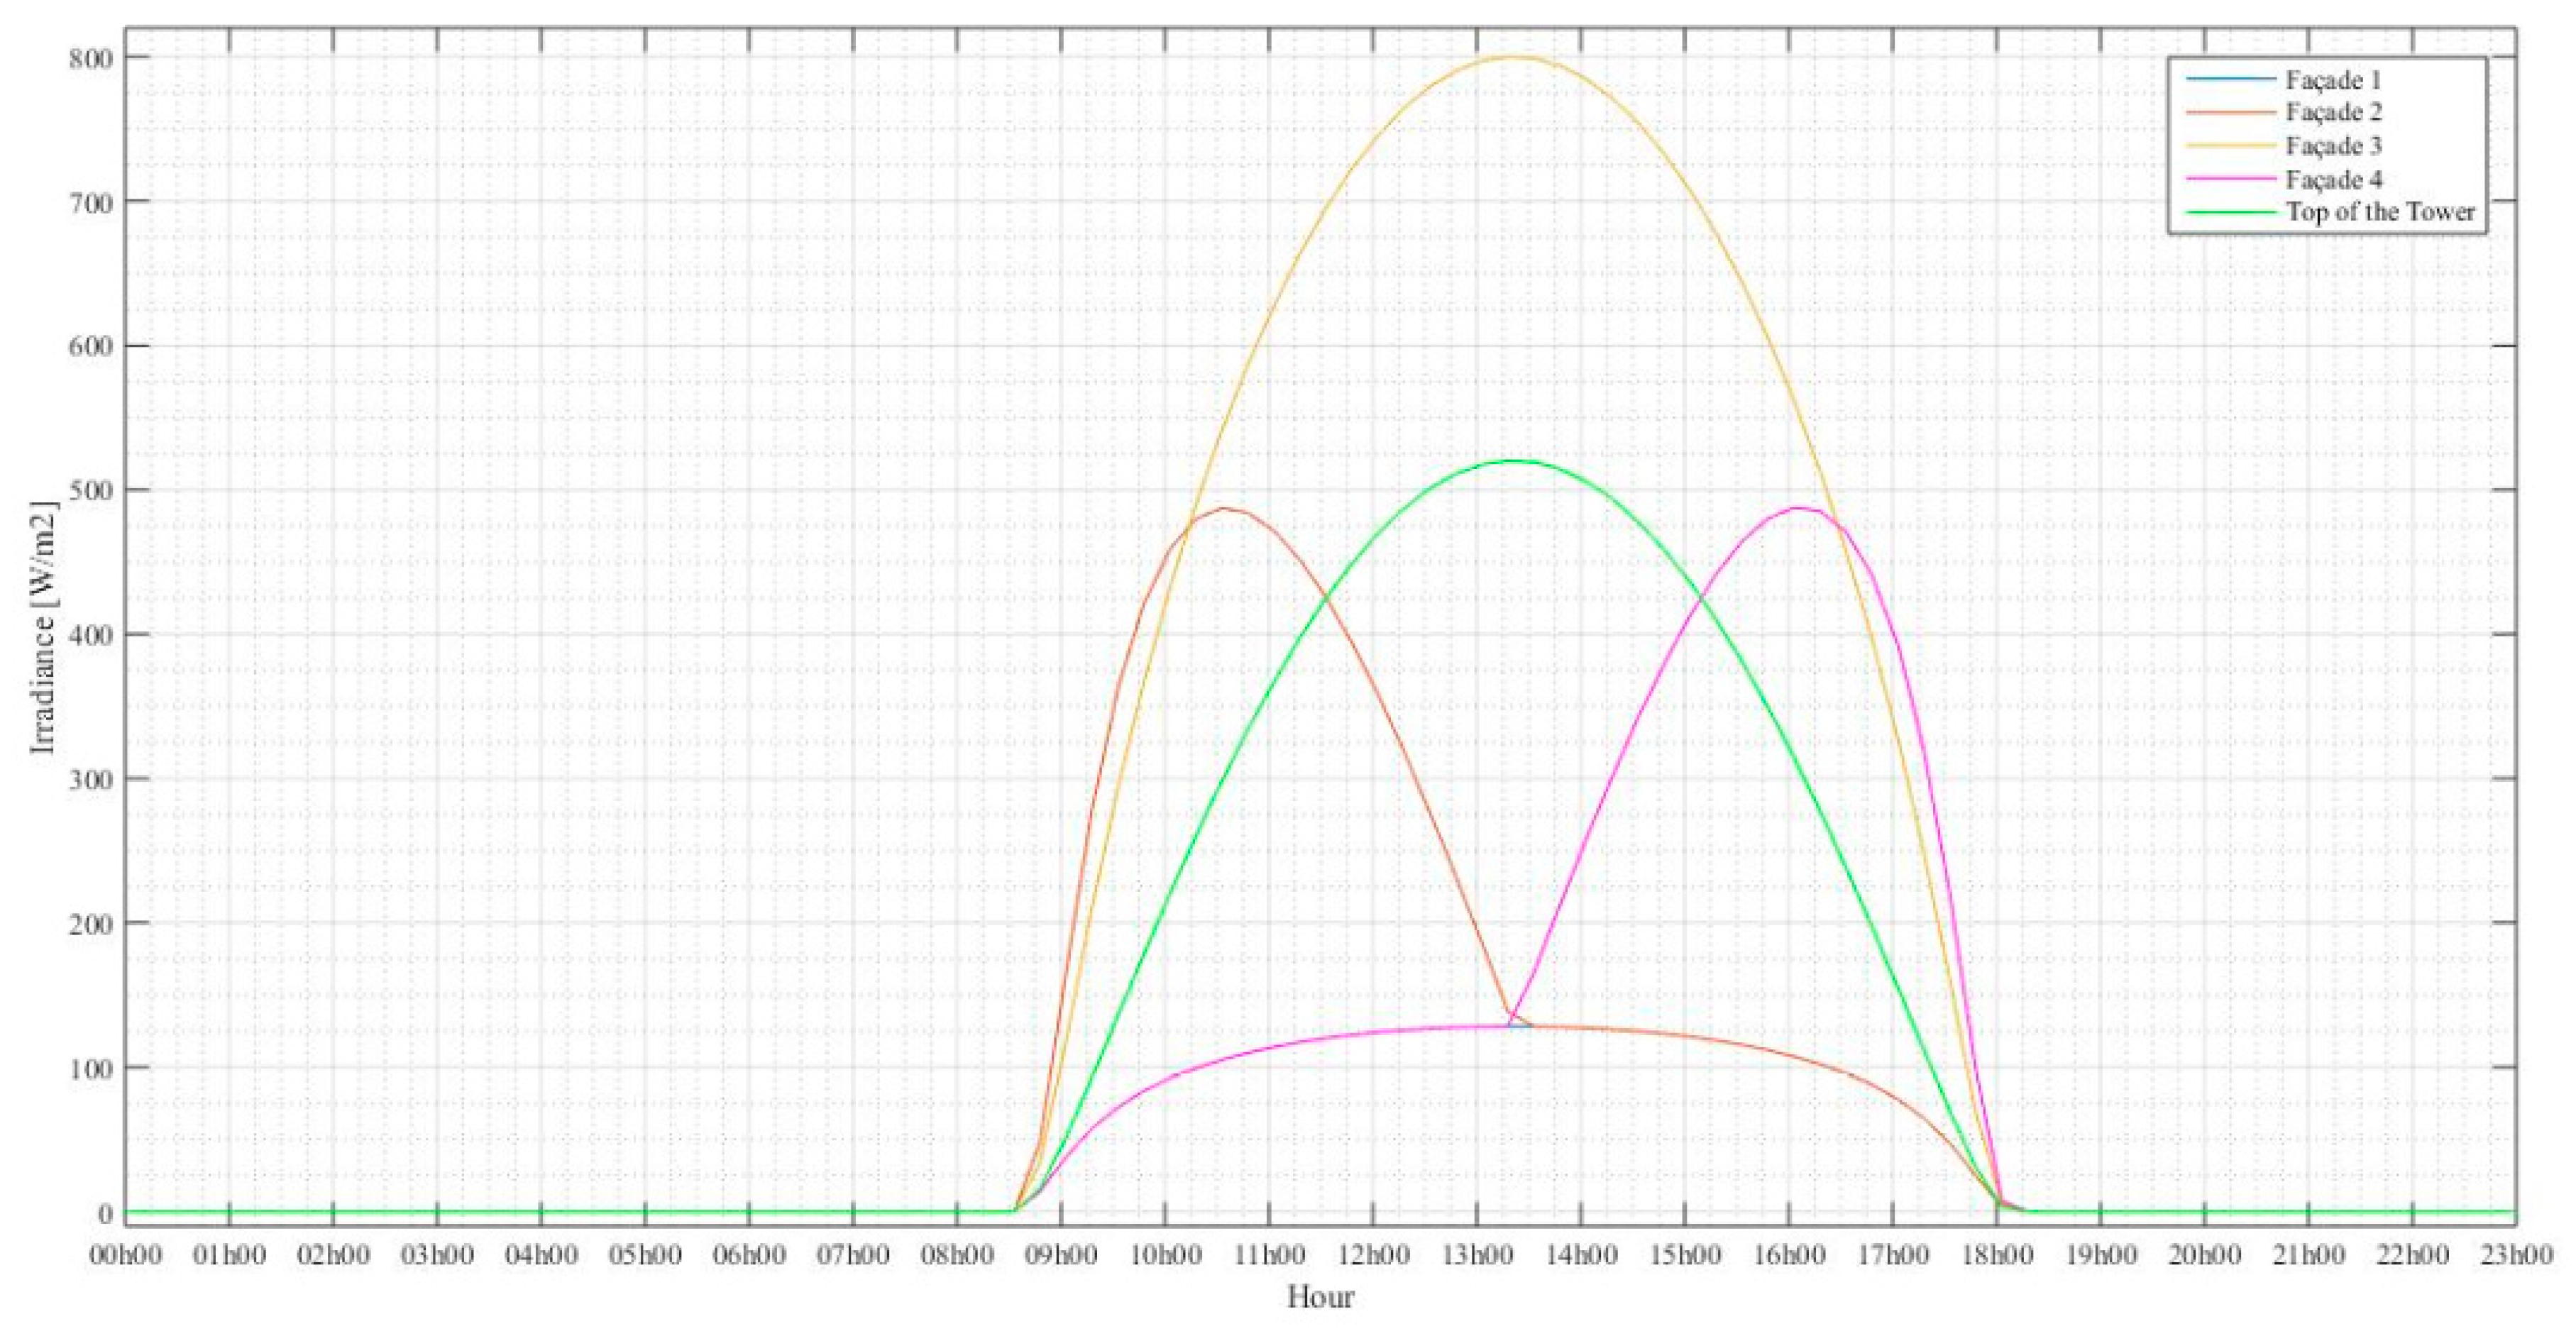
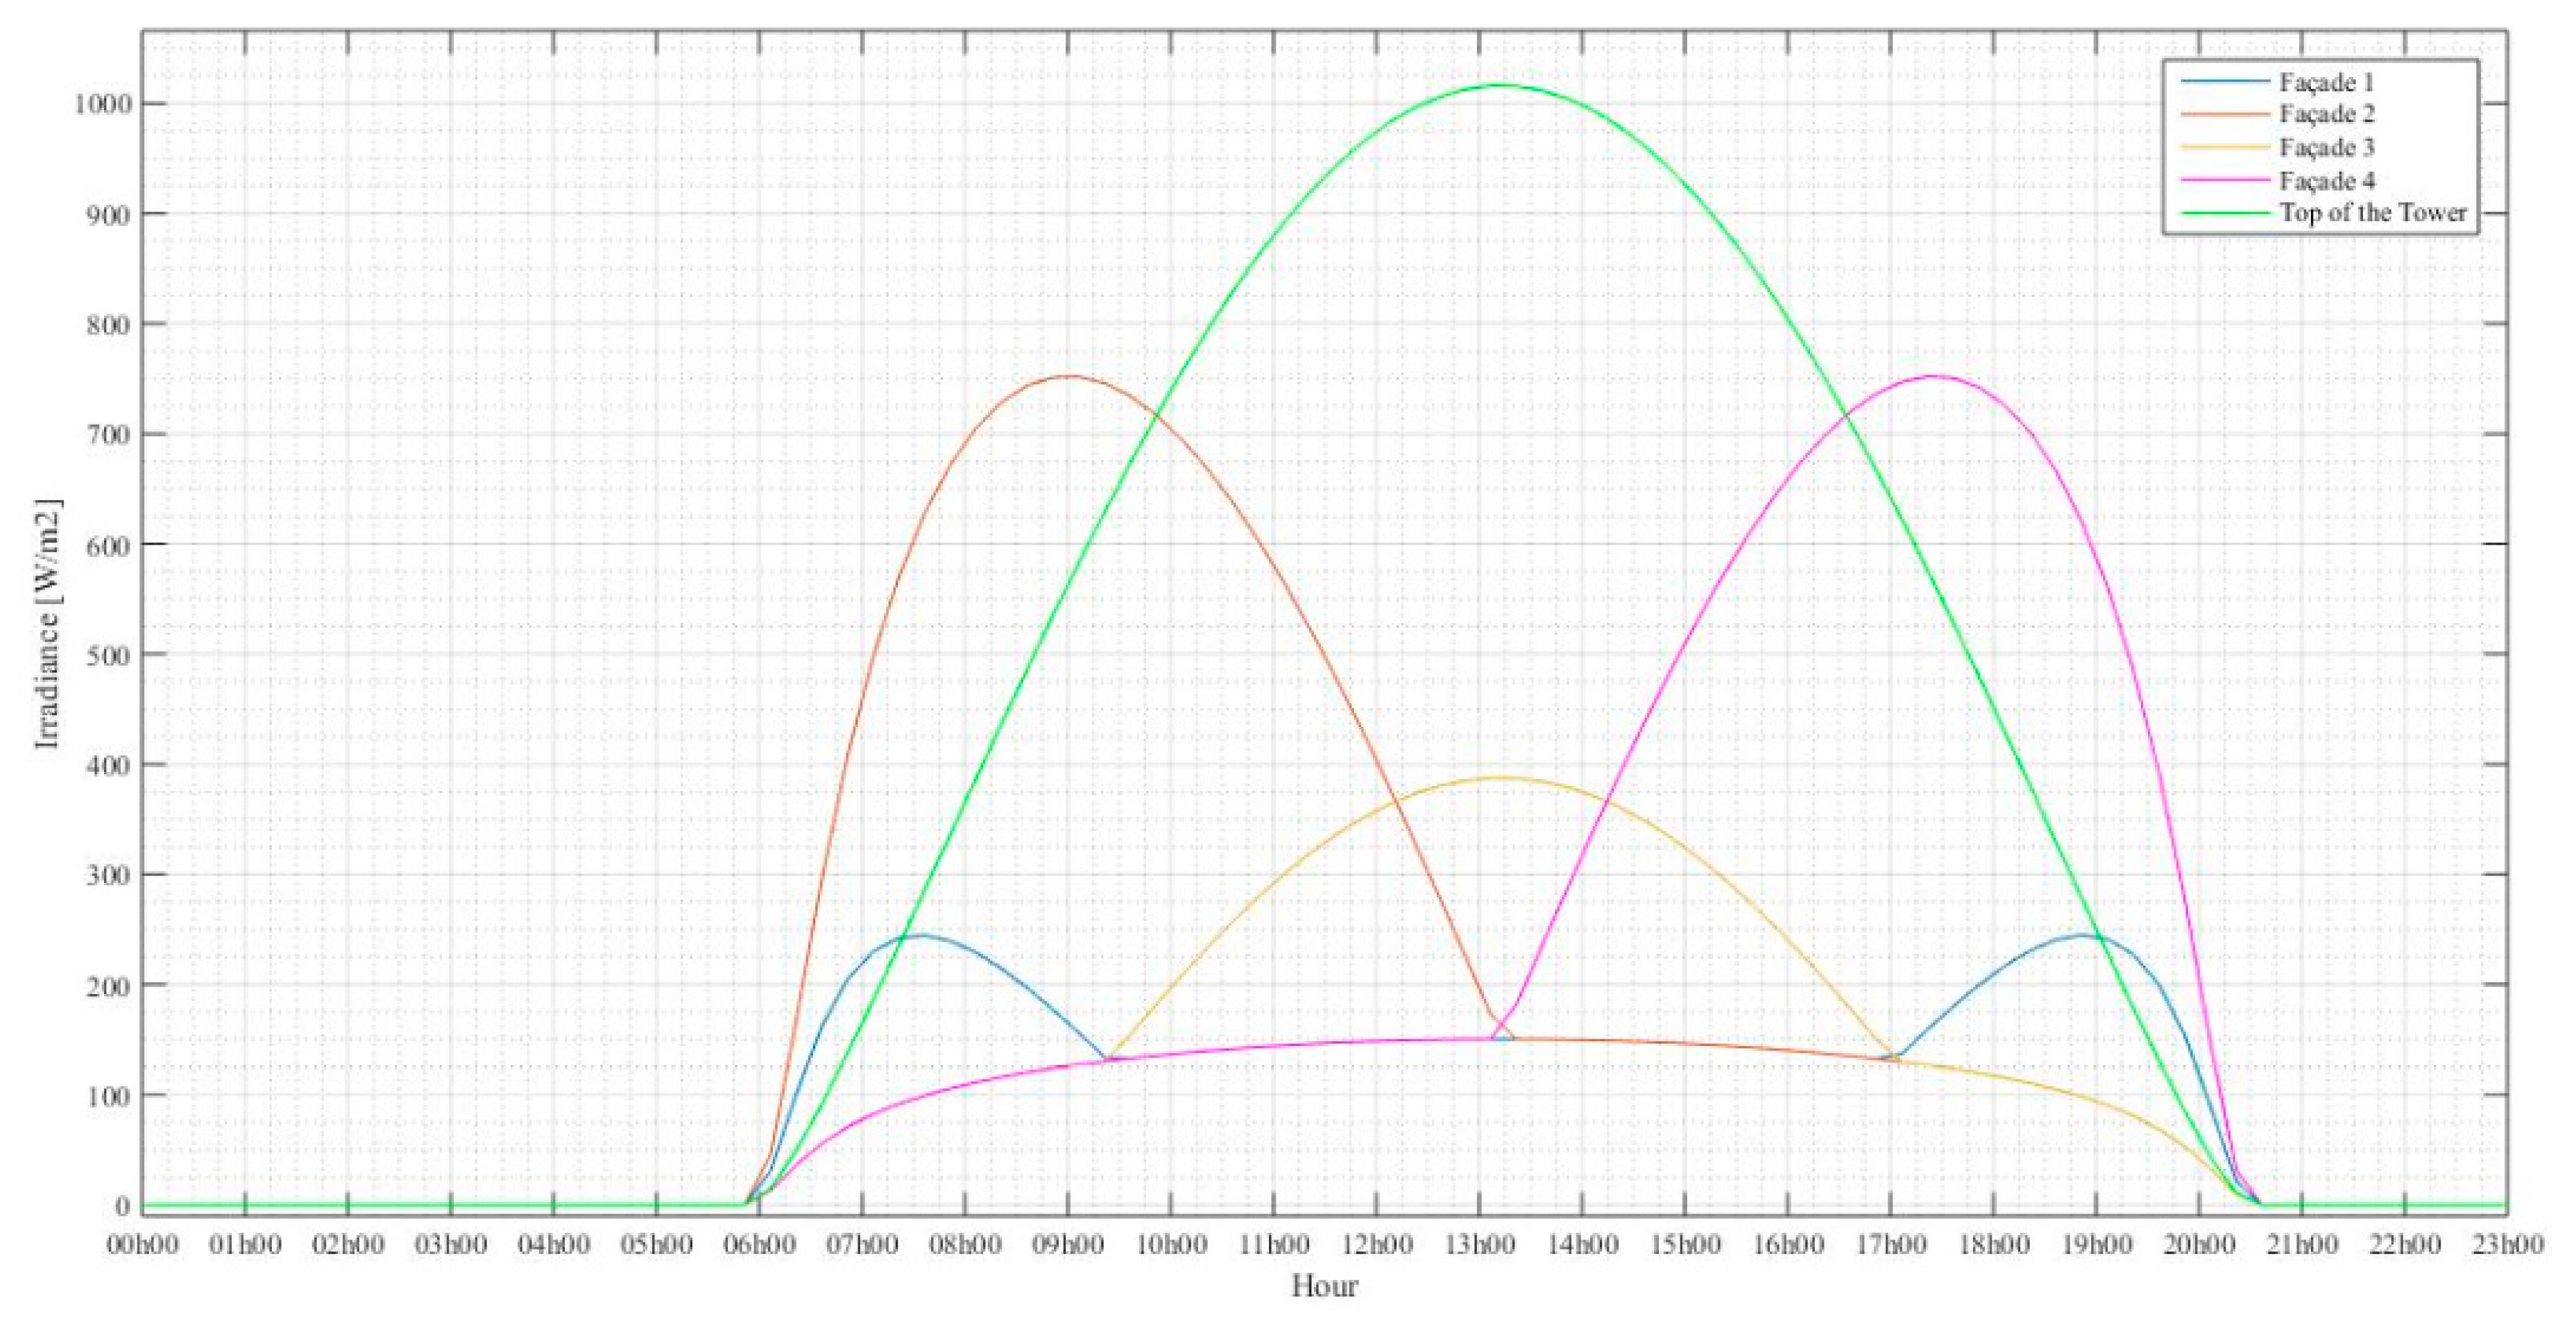
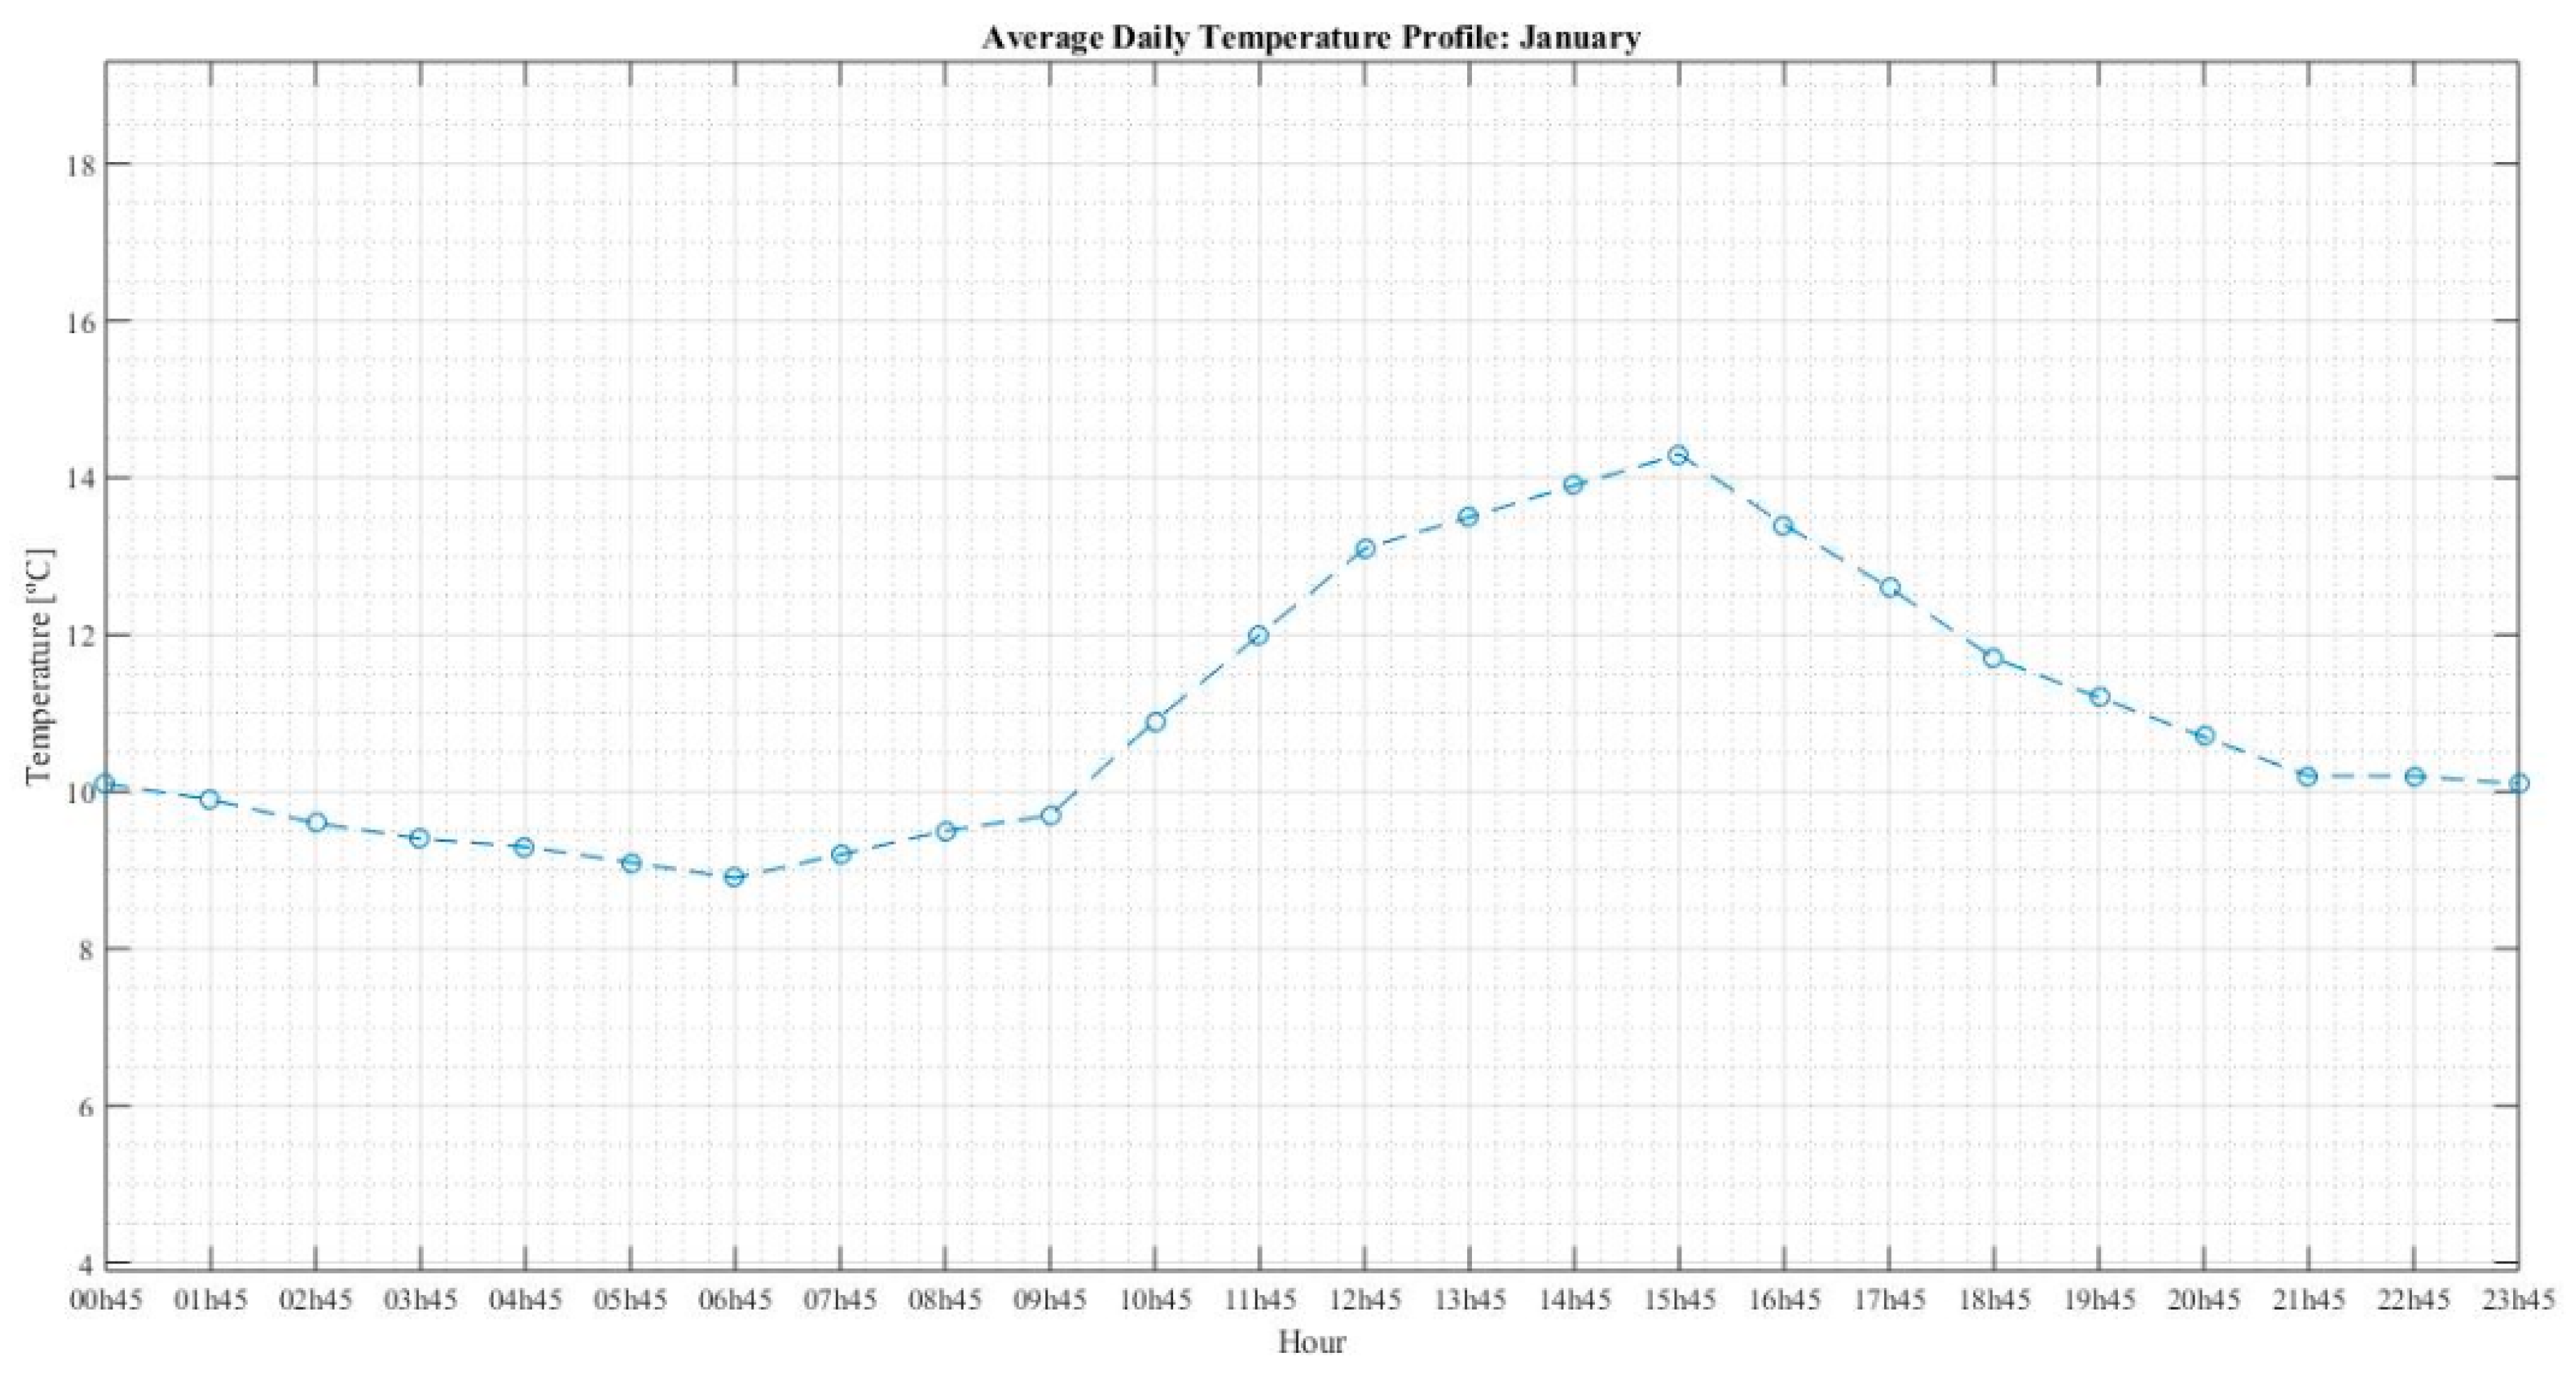
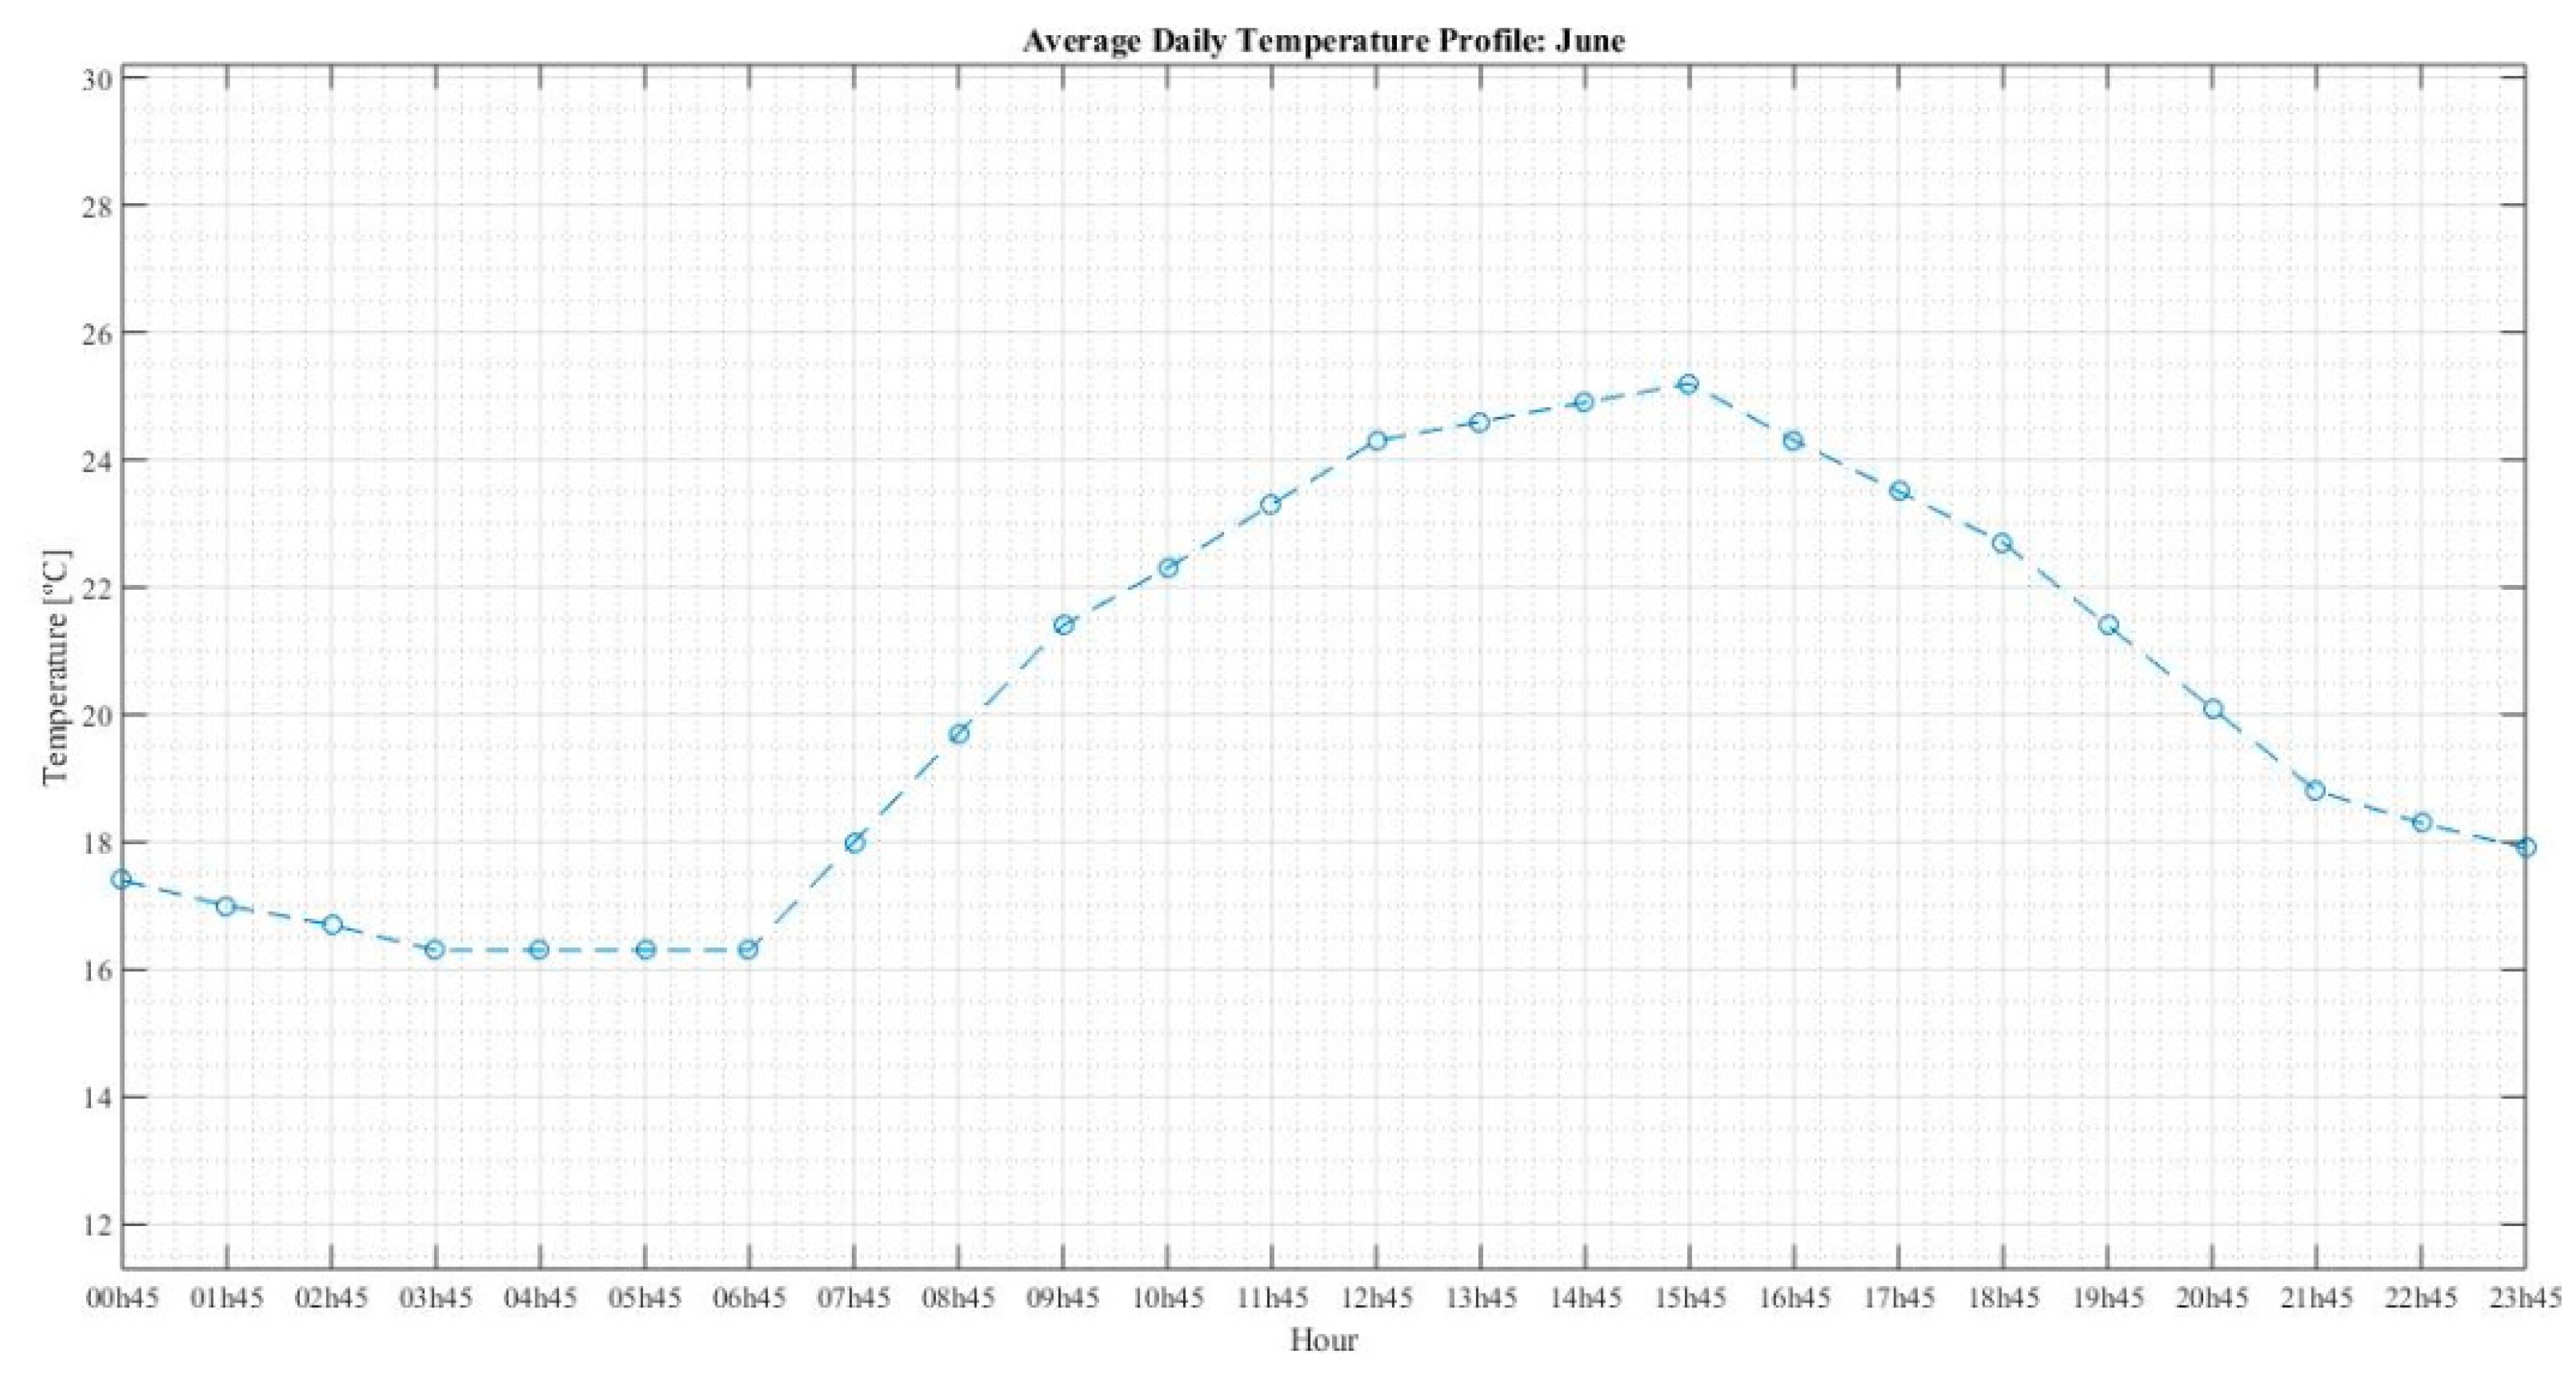
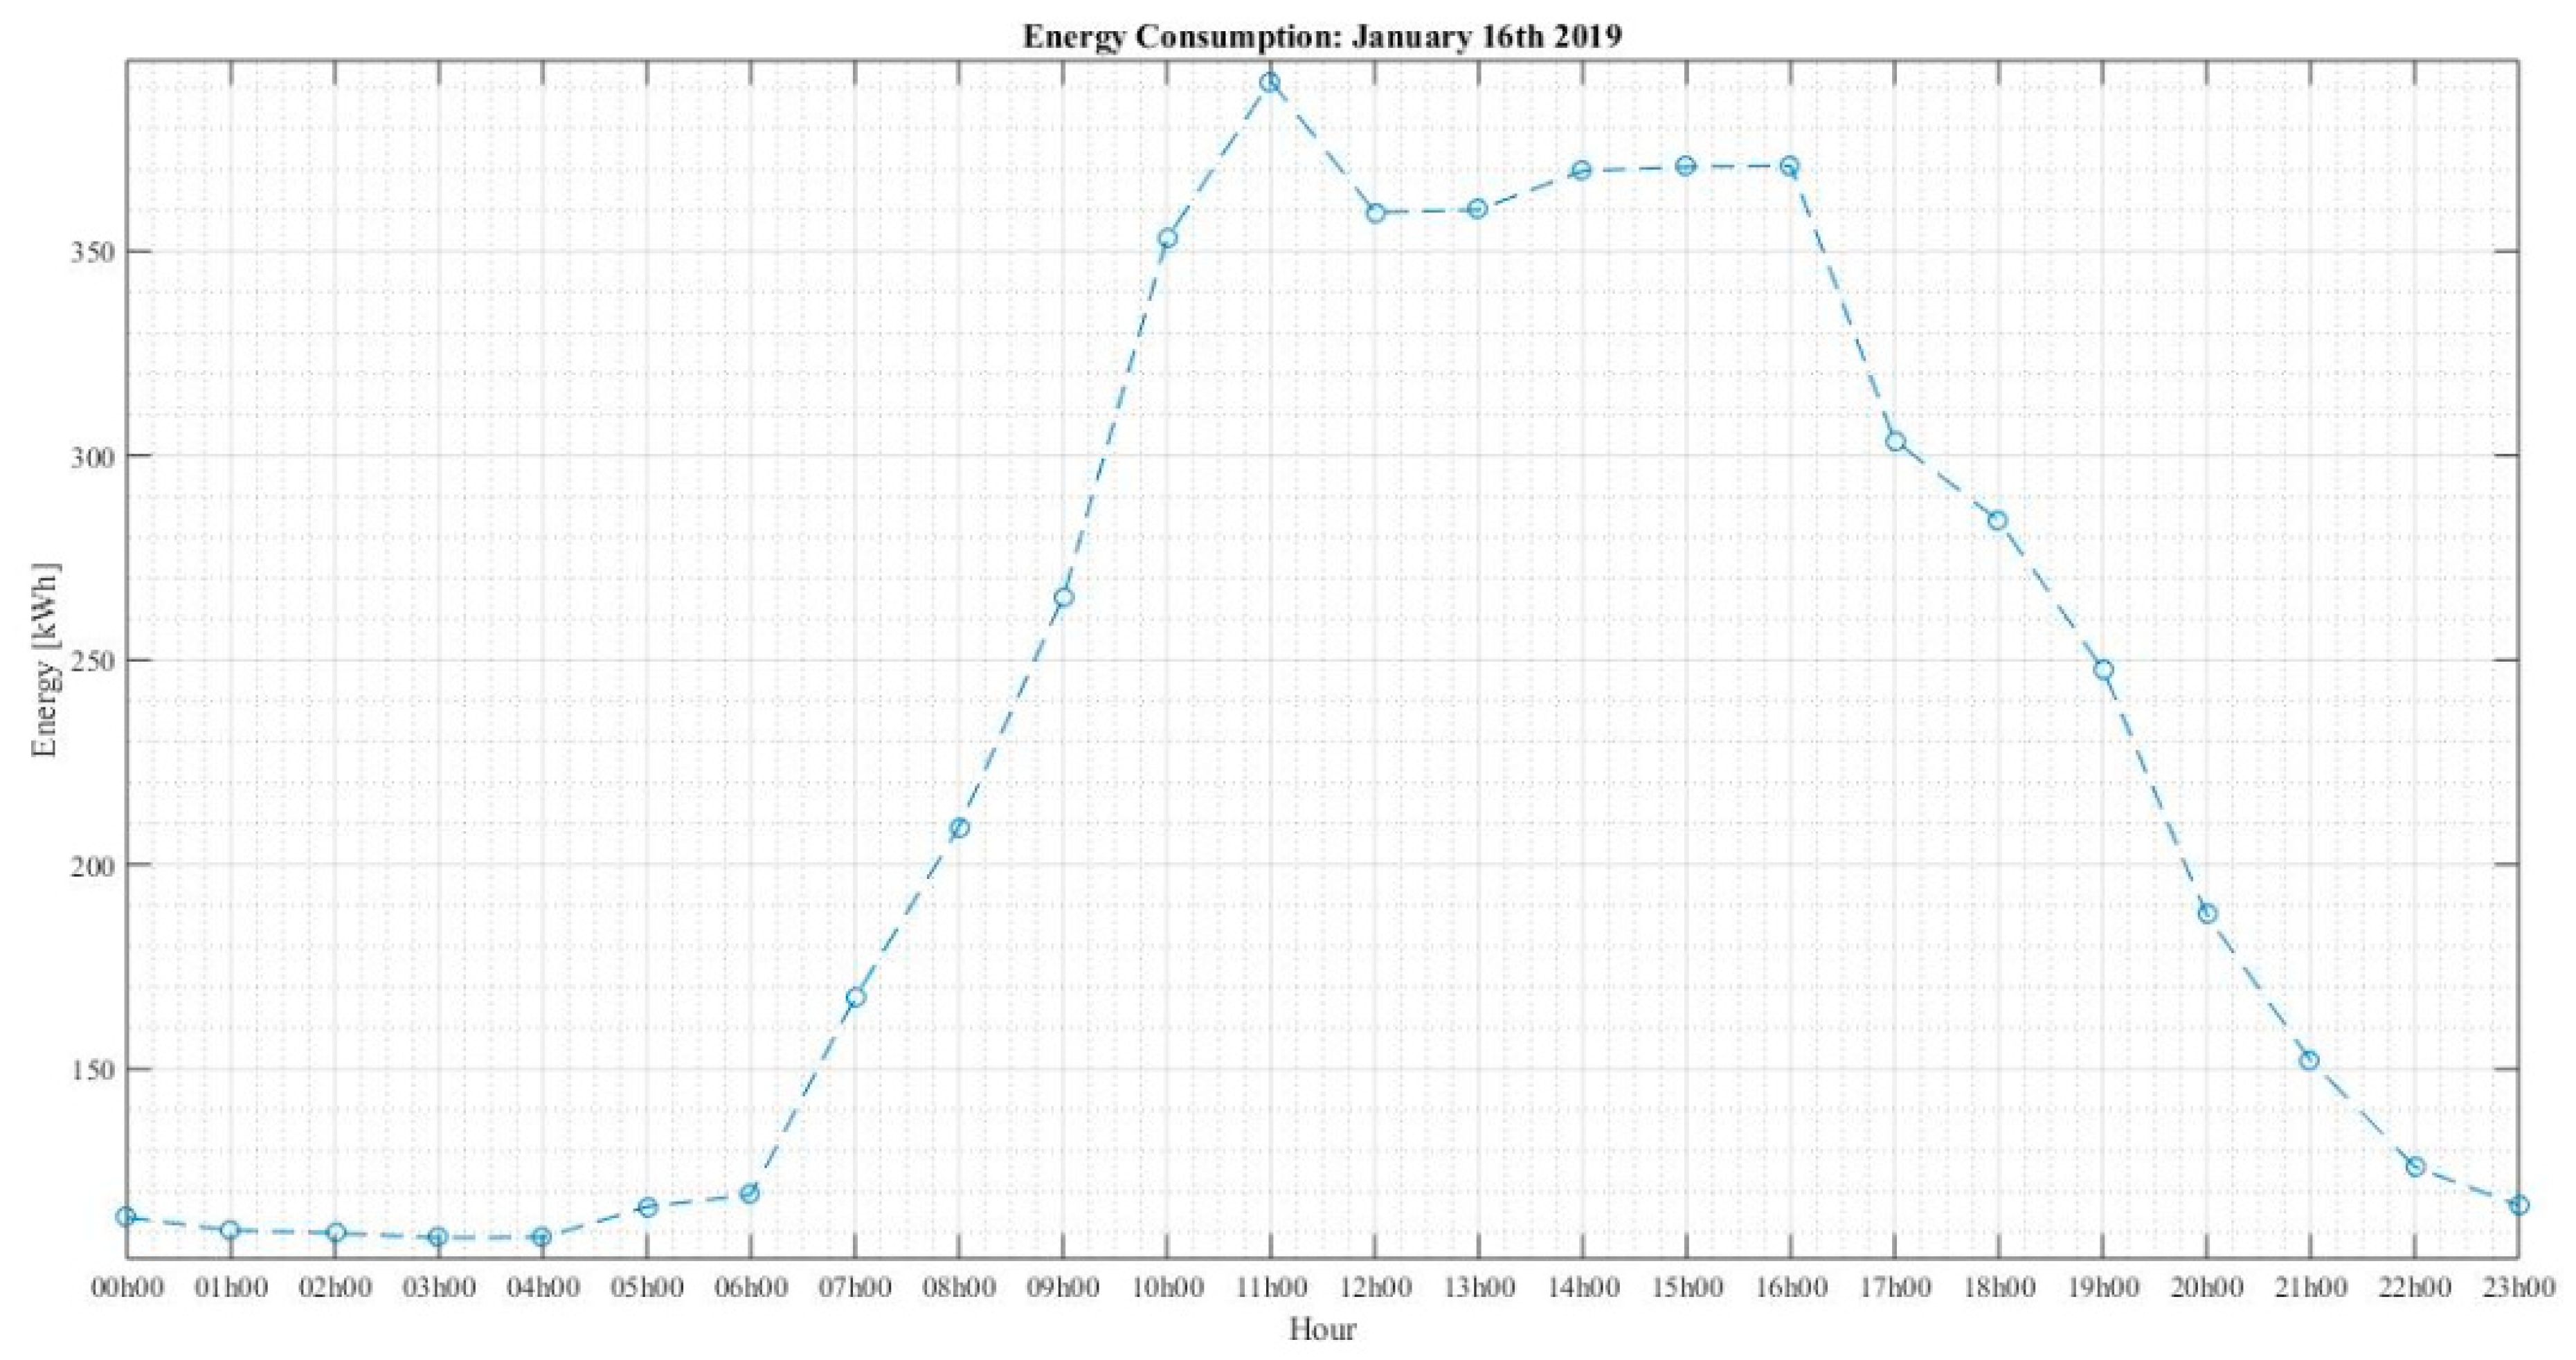
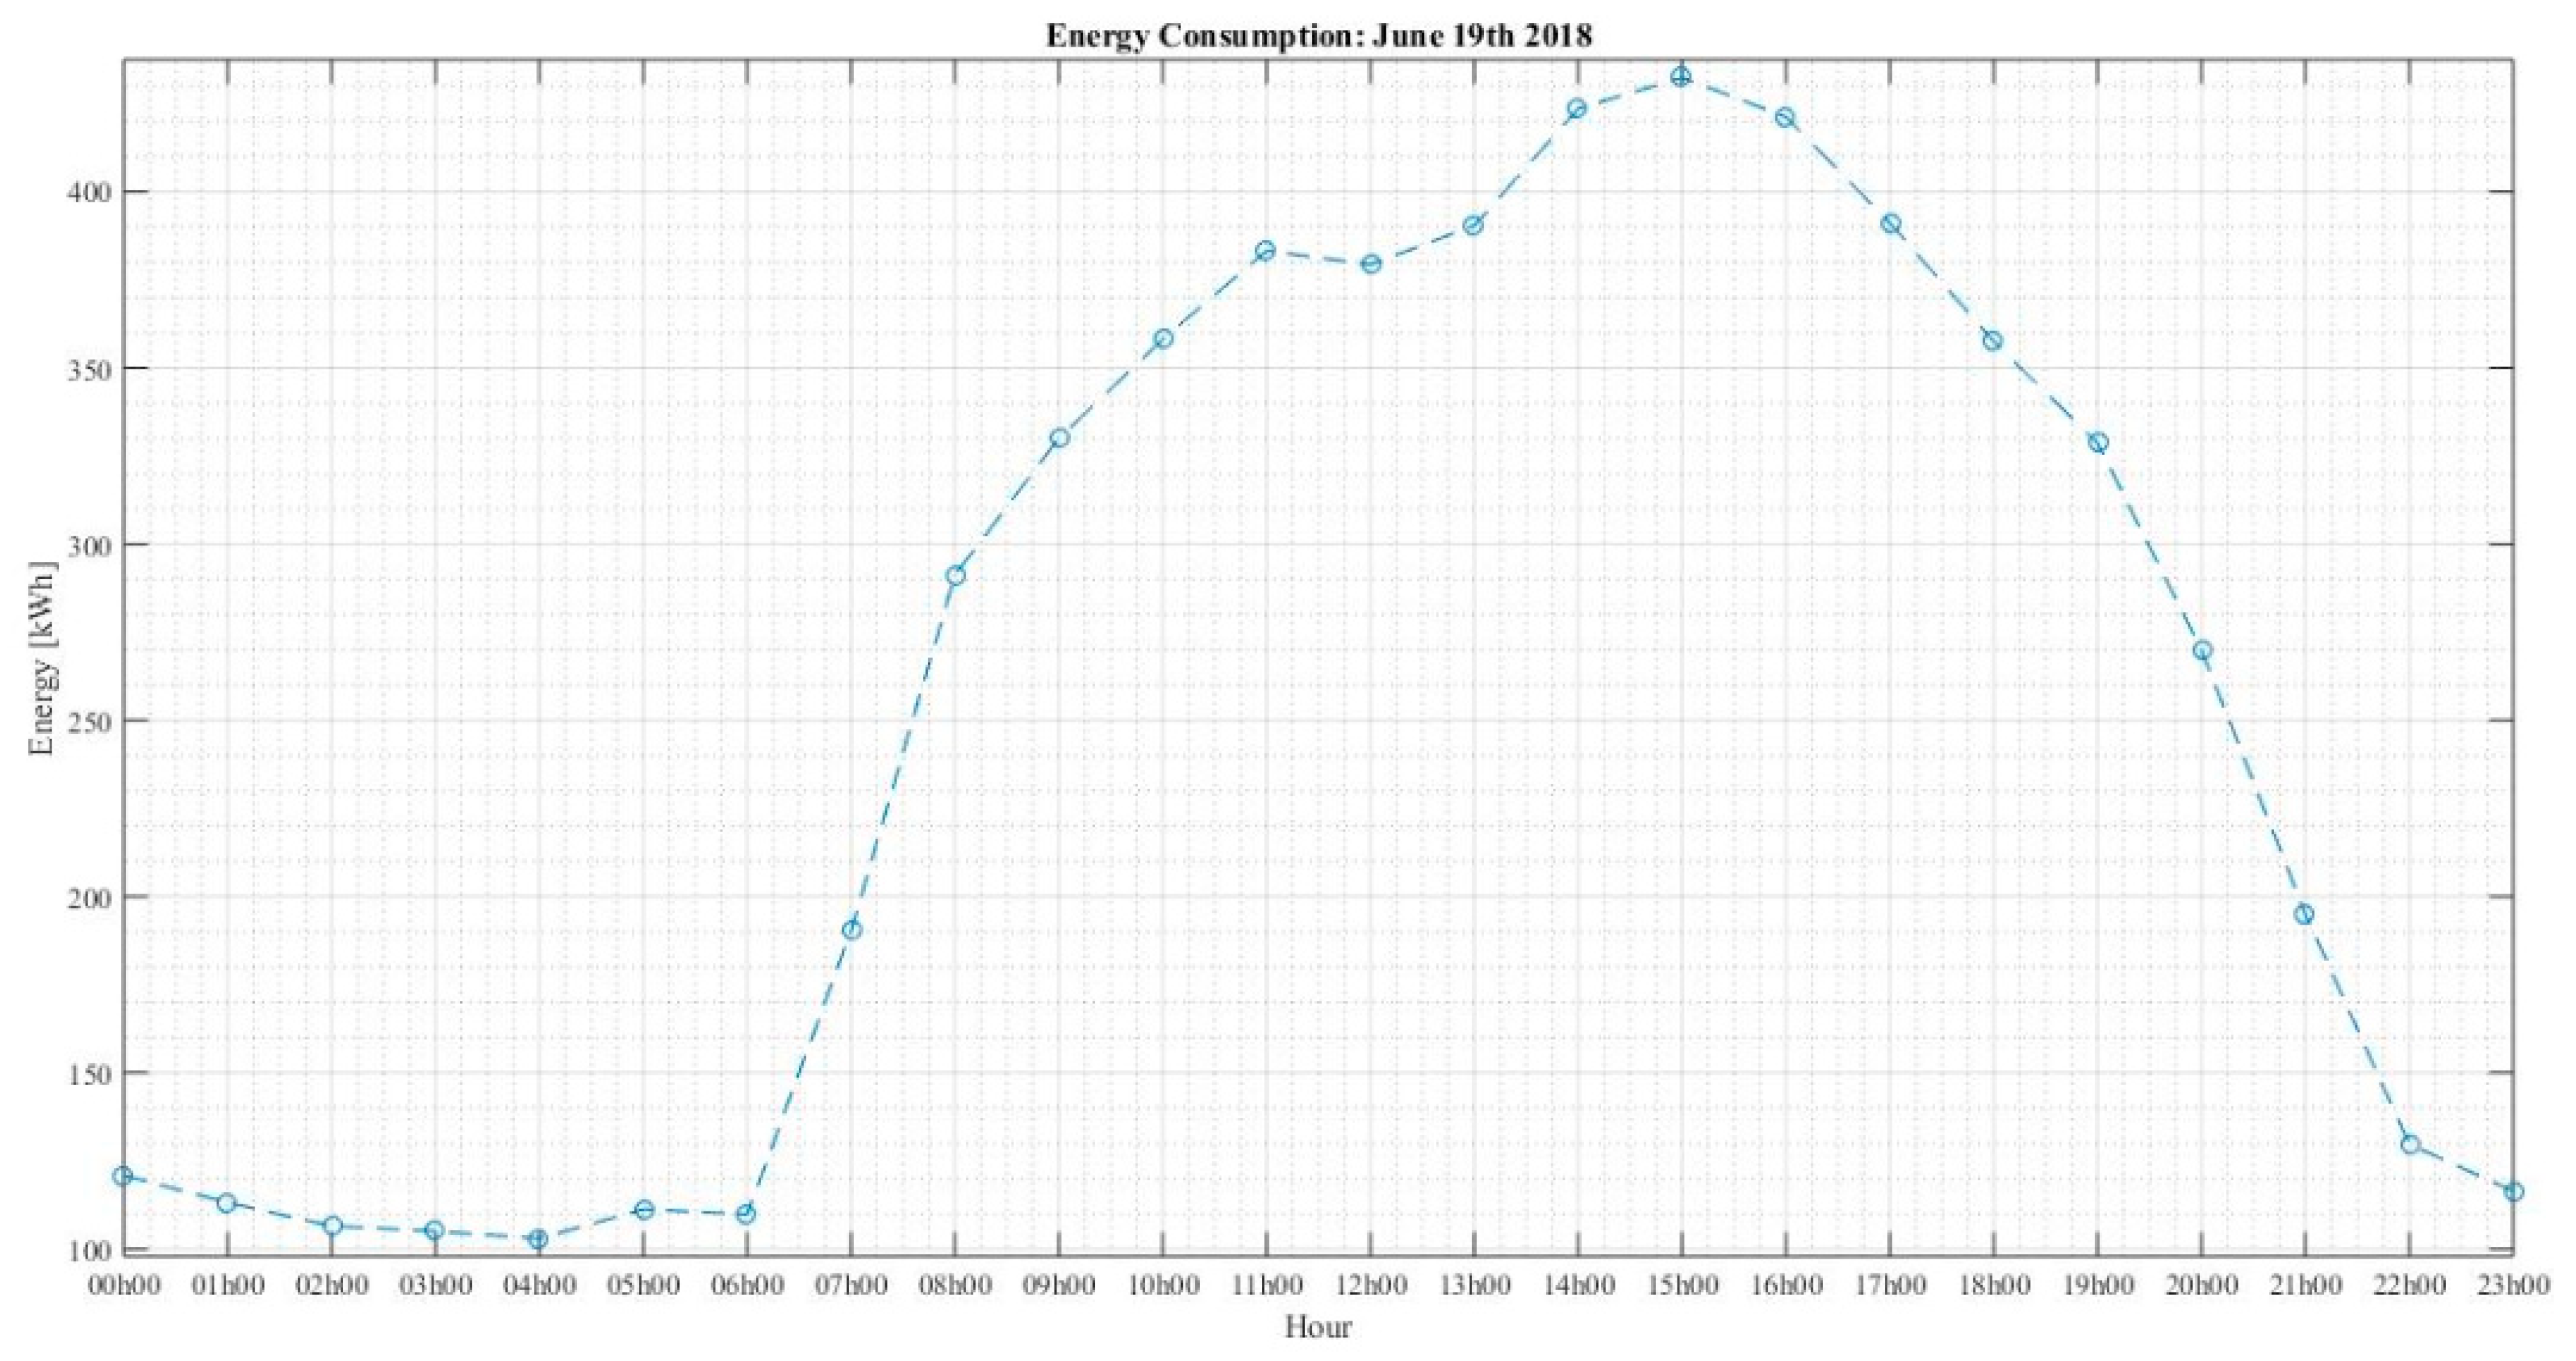
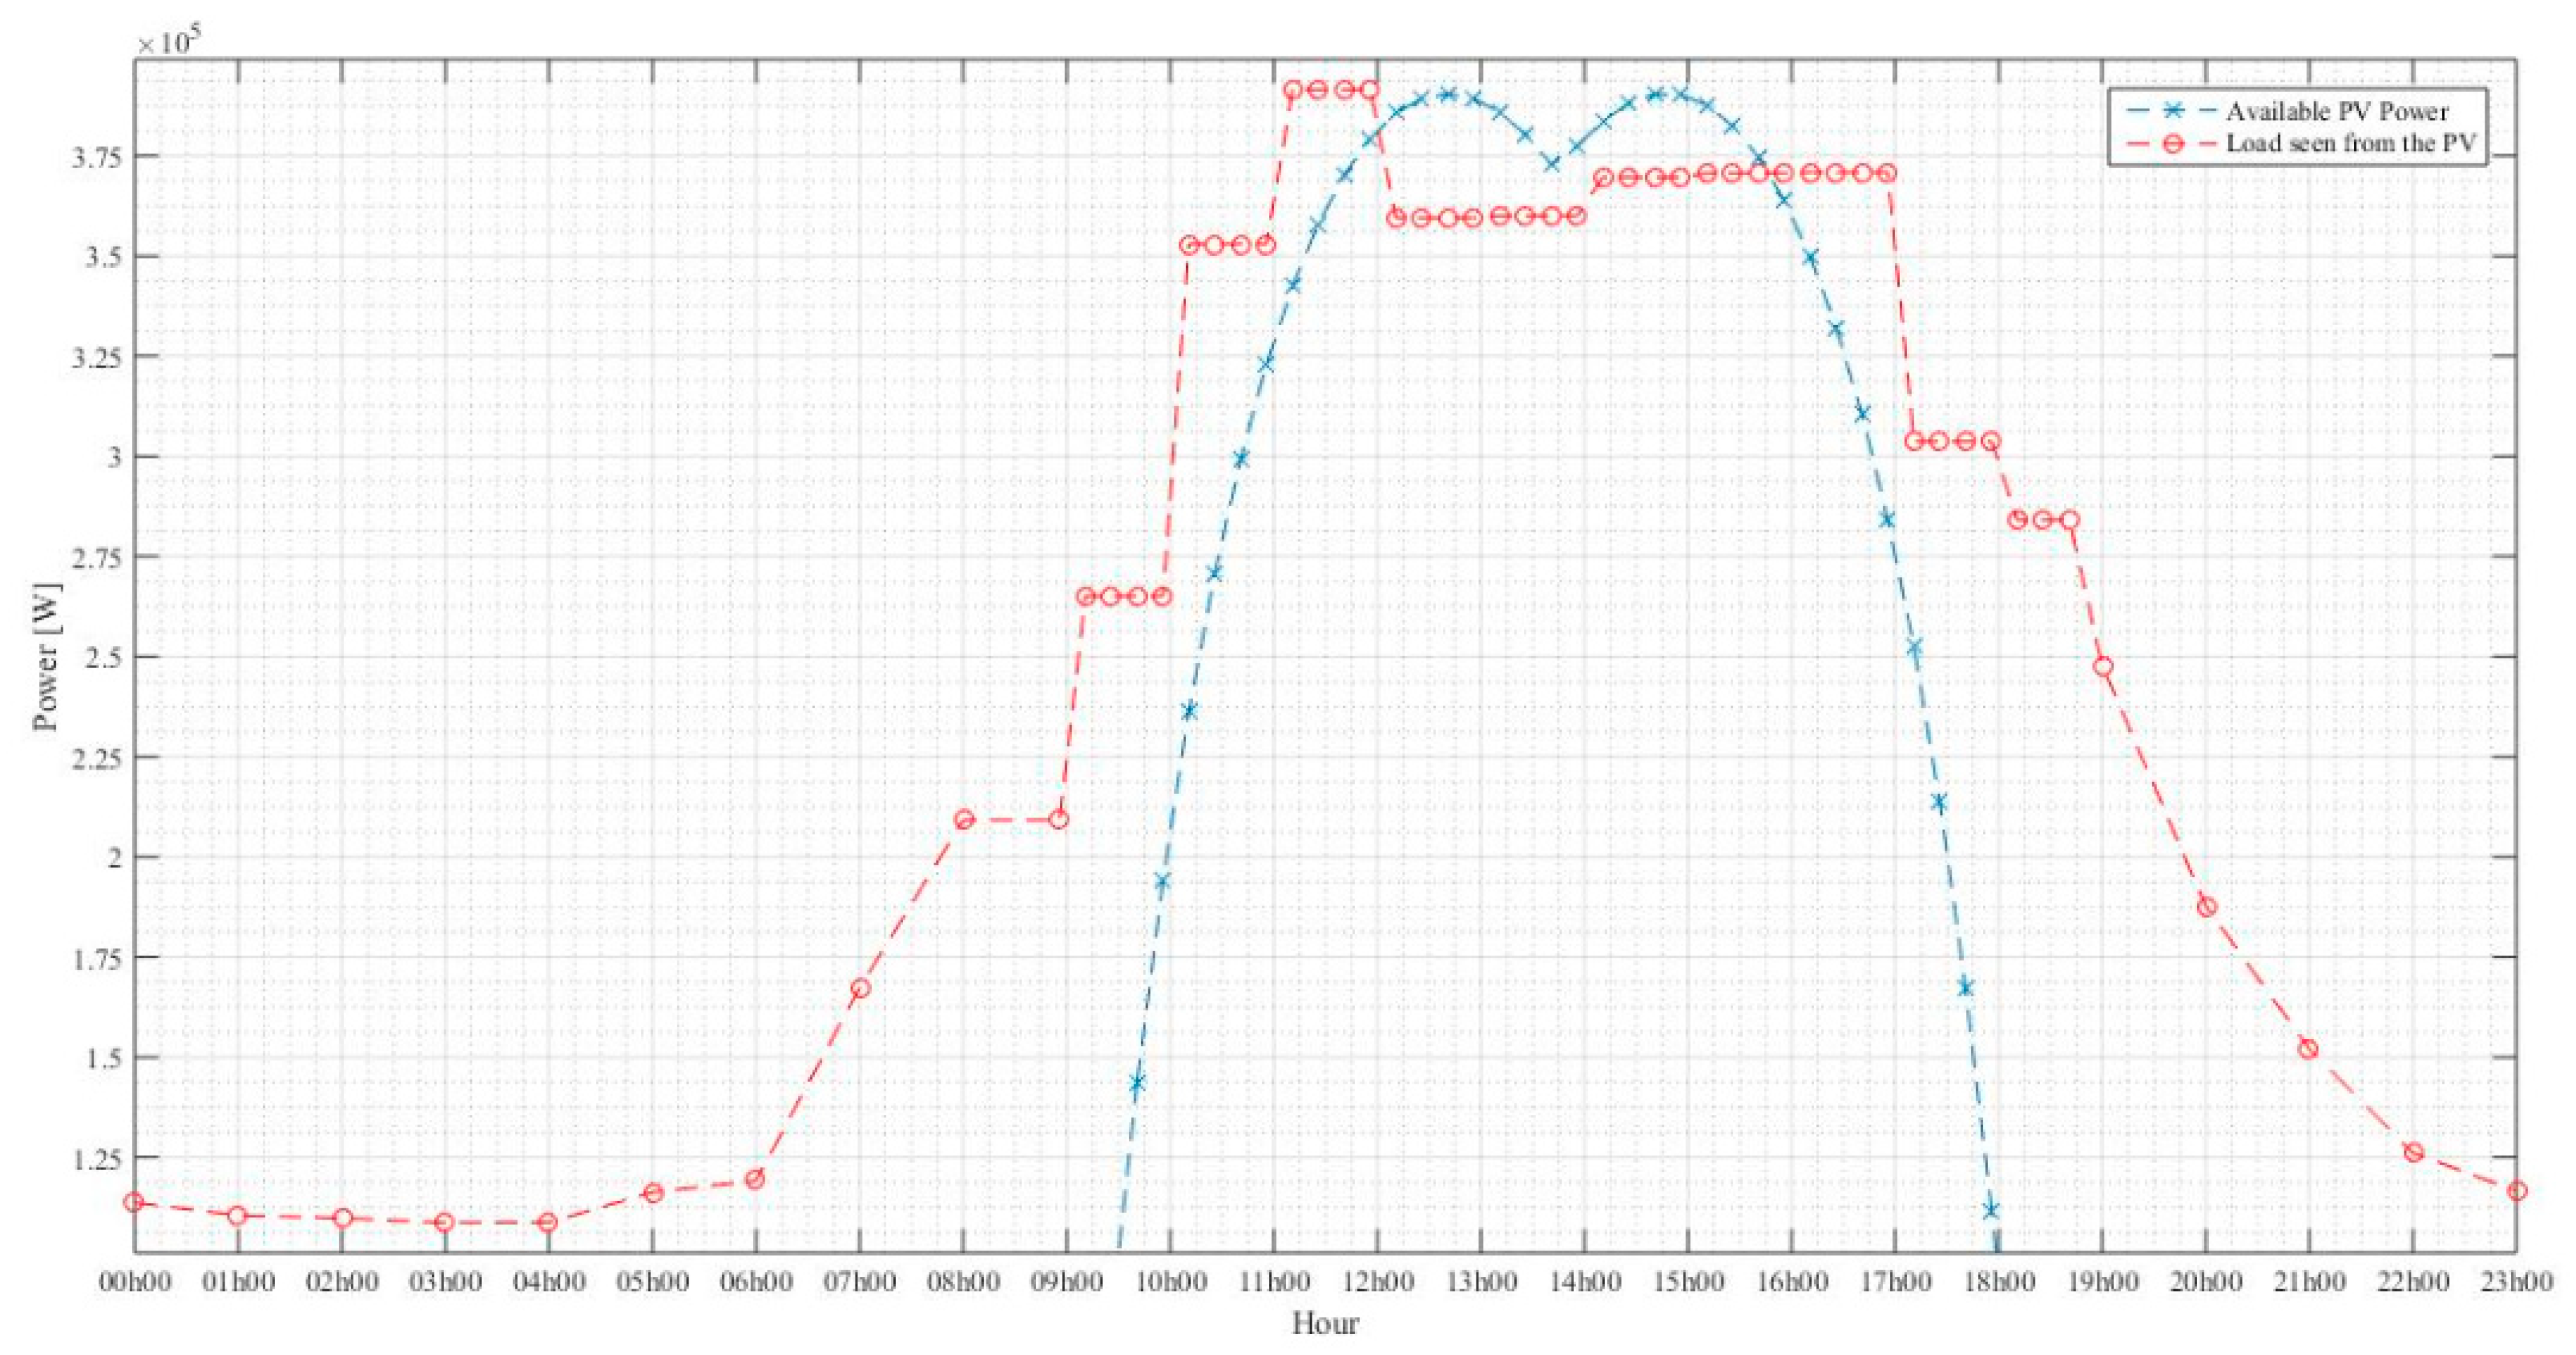
5.1. Methedology

As mentioned before this is called autonomous system, since it produces electricity without being connected to the national grid. The considered photovoltaic system is presented on Figure 1. To design this system, it is needed to analyse the building in terms of its energy consumption and also it is needed to determine the irradiance and temperature characteristic at its localisation. After it, a comparison between different technologies must be done in order to choose photovoltaic panels to cover the windows and the top, taking into account for example the budget, the produced power, the occupied area or the building aesthetic. Furthermore, the balance system (the system among the panels and the load) should be designed, considering the produced power, the consumptions and also the electrical specifications of all of its devices. On top of that, the socio-economic study should be done in order to analyse if the solution or which solution should be implemented.

5.2. Sizing the Project

Using the windows as solar panels has the big advantage of enabling the use of as much space as possible to produce more electricity. In this case the North Tower of Instituto Superior Técnico (IST), localised in Lisbon, Portugal is the chosen building. Its construction was completed in 1995 and it is marked by a volume on a building that works as a base, and is thus high, presenting the facade on a curtain facade system, adopting the exterior glass casting (EGC) solution type [15]. This block, part of the Campus Alameda, has 4 facades and each facade has approximately a width of 33.11 m and a height of 36.58 m, which makes approximately a total surface area of 5939.8 m2.
In order to determine the maximum power produced by the panels, it is necessary to study the irradiance and the temperature. Taking into account the North Tower coordinates (Latitude: 38.73758208; Longitude: −9.13859305), the irradiance and the temperature throughout the year were studies through the following site: https://meteoexploration.com/products/SolarCalculator.html. Here, it was checked that August was the month with higher values of average daily temperature and irradiance, and that January was the month with lower values. Despite these being the months with the highest and lowest irradiance values, it turns out that the electrical consumption in the tower is more significant in January and June, because in August the IST is closed. Thus, it was considered that June is the best month to represent the summer and January is the best month to represent the winter. Also, it was taken into account the fact that the facades have non-uniform illumination throughout the day due to their different slope orientation (orientation of the surface, if looking north it will be 0˚, if looking south will be 180˚ and it varies between 0˚ and 360˚) and the slope tilt (inclination of the surface with respect to the horizontal, 0˚ is flat, 90˚ is completely vertical and it varies between 0˚ and 90˚). Thus, the solar radiation values in each facade and in the top of the tower are different. The daily average irradiance values for January and June are presented on Figure 2 and Figure 3, respectively.
Moreover, the daily average temperature values for January and June are presented in Figure 4 and Figure 5, respectively.
It is also necessary to analyse the average energy consumption of the tower in these considered months in order to obtain the required number of batteries and photovoltaic panels (PVs). The obtained values are presented in Figure 6 and Figure 7 for the months of January and June. For each month, it is chosen the worst day, or in other words, the day with higher energy consumption.
In the article it is considered two different solutions to install in the facades of the tower, all the panels specifications are presented on Appendix A, Table A1. First, an amorphous silicon panels solution with an intermediate price and secondly, a crystalline silicon panels solution. It was chosen the PS−M−NX panel, as the amorphous silicon panel and the PS−PC−SE glass panel for the crystalline solution, both from Polysolar.
To coat the top of the tower, PS−MC−SE panels, also from Polysolar are positioned with a slope tilt of 30˚ and a slope orientation of 180˚, leading to a panel orientation to south. With this position, it is possible to capture more irradiance and consequently produce more energy.
The other needed devices to constitute the system are batteries, a charge controller and an inverter. In the tower it is necessary to install 5 systems like the one presented on Figure 1, one for each facade and one for the top, due to the characteristics of the chosen technologies. The chosen pack of batteries is from Crown, the chosen charge controller also has a MPPT (maximum power point tracking), it is named TriStar MPPT, and it is from MORNINGSTAR, while the chosen inverter is a high input voltage industrial DC−AC sine wave inverter and is from ABSOPULSE Electronics Ltd.
First, it will be calculated the required number of PV panels to coat the top. The number of panels should be adequate to feed the load during the day and to charge the batteries, to store energy that can be useful during the night. The real temperature of a panel can be given by:
T p v =   T + G × ( T N O C T T r e f N O C T ) G N O C T ,
and its maximum power is determined by:
P m a x =   P m a x _ P V + G G N O C T × ( 1 | α T | × ( T P V T N O C T )
where T N O C T = 50   ° C   ( f o r   t h e   c h o s e n   p a n e l ) ,   T r e f N O C T = 20   ° C   a n d   G N O C T = 800   W / m 2 . Also, | α T | is the temperature coefficient, G is the irradiance, T is the temperature, and P m a x _ P V is the maximum power for the chosen panel.
Considering the maximum open circuit voltage of the PS−MC−SE panel, presented in Appendix A, Table A1, which is 47.18 V, the maximum open circuit voltage of the charge controller, 600 V, and the aforementioned surface area of the top of the tower, it is possible to determine the maximum number of panels in series and in parallel to install on the top. The number of panels in series, N p v s , is determined as:
47.18 V   ×   N p v s     600 V     N p v s   12   p a n e l s .
To calculate the number of panels in parallel it is necessary to be more careful, in order to take into consideration, the slope of each panel (30˚), so that the area occupied by the panels will be different, to reduce the probability to cause shade to the adjacent panels. This distance can be determined using Pythagoras’s theorem and it corresponds to the adjacent leg of the angle, that the panel makes to the horizontal axis, being the hypotenuse the panel’s length of 0.992 m, which is also presented on Appendix A, Table A1. Thus, this width, d, is given by,
cos ( 30 ° ) =   d 0.992 d = 0.859   m
and, finally, the number of rows in parallel is determined by taking into account the width of the tower, w = 31.16 m, and the width previously determined:
w d 36   r o w s .
In total, 432 panels (36 × 12) are going to be install, producing a total average energy produced of 3599.84 kWh (determined by expressions (1) and (2) for the aforementioned worst case scenario in terms of power generation, that is Winter−January, with high consumption and low irradiance). However, this value is smaller than 15632.36 kWh, which corresponds to the sum of the energy consumption in each hour considered in a day in January. Here, it is necessary to point out that this produced energy will not only be used to feed the tower but also to charge the batteries. So, imagining that there are no batteries and do not taking into account some shadow effect throughout the day, only the panels installed on the top would feed around 23% of the building’s energy consumption.
Another important point to note is that the considered slope of the panel and the considered distance between panels may not be the ideal to capture the maximum irradiance and thus producing a greater amount of energy.
Now, considering the characteristics of the amorphous silicon panels with an intermediate price and the previous formulas, the power produced by one PS−M−NX panel is obtained, considering its specifications presented on Table A1 of Appendix A. Once again, it must be taken into account that the maximum open circuit voltage of each PS−M−NX panel is 170 V, in order to not exceed the PV input operating voltage range of the charge controller (600 V). Thus, the maximum number of panels in series per facade, N p v s , and the number of rows of panels in parallel are determined through the following:
170   V   ×   N p v s   600   V     N p v s   3   p a n e l s ,
h l = 36.58 1.4 26   r o w s ,
where h is the height of the tower and l is the panel length.
Thus, for the 4 facades a total of 312 panels (26 × 3 × 4) will be installed, producing a total average energy of 636.2 kWh, which is also smaller than the total of 15632.36 kWh, that is the average consumption of the tower. Adding this energy to the energy produced by the panels at the top of the tower makes a total of 4236.04 kWh, which corresponds approximately 27.1% of the building’s energy consumption.
Considering now the other solution for the facades that presents panels with levels of transparency of 10%, 20%, 30%, 40%, and 50%. Relative to the energy produced, it is becoming smaller and smaller as transparency increases. It is necessary to mention that the panel considered in this next solution is not made with the ideal materials. The ideal situation would be to use panels made of amorphous silicon, like those that were considered in the previous option. However, this panel made of crystalline silicon is being considered to show that, nowadays, these panels still produce much higher amounts of energy compared to panels made of amorphous silicon.
This solution will be sized with the PS−PC−SE panel with a transparency level of 10% and characterized with an open circuit voltage of 45.49 V and a length of 0.992 m, as it is detailed on the specification Table A1 presented on Appendix A. By the same reasoning in the solutions with the panels made of amorphous silicon, one arrives at the following:
45.49   V   ×   N p v s   600   V     N p v s   13 p a n e l s ,
36.58 0.992 36   r o w s .
Thus, a total of 1872 panels are going to be install in the 4 facades (13 × 36 × 4) producing a total average energy produced of approximately 7636.01 kWh which is smaller than the average consumption of the tower. Adding this energy to the energy produced by the panels at the top of the tower makes a total of 11,235.86 kWh, which corresponds approximately 71.9% of the building’s energy consumption. It can be concluded that with this type of solution, the average energy produced per day is more than the double of the energy produced by the panels of the previous solutions. However, with this solution it is still not possible to produce the energy needed to feed the entire tower.
After this, it is necessary to calculate the required number of batteries to store energy and thus provide the necessary power at night. For that, the average energy consumption of the tower at night in January was obtained, because it is on the winter nights that the highest consumption occurs. Knowing the inverter and the charge controller efficiencies and the capacity of each battery pack, the necessary energy for batteries to store is calculated:
E b a t t e r y   s y s t e m = E n i g h t J A N η i n v × η C C = 2487.24   k W h 0.85 × 0.979 2988.9   k W h .
With this, the total number of battery banks is calculated through the following:
n b a t t e r y = E b a t t e r y   s y s t e m E b a t t e r y = 2988.9   k W h 20.64   k W h 145   b a t t e r y   p a c k s .
These battery packs shall be placed in parallel so that the output voltage does not exceed the battery operating voltage range of the charge controller. Based on the load curve in January and on the PV available power, presented on Figure 8, it is possible to obtain the evolution of the battery power (positive when discharging and negative when charging), presented on Figure 9. Also, it is possible to obtain the evolution of the battery state of charge (SOC) considering that it is 100% at 18 h, as illustrated on Figure 10. To study these two evolutions, only the solution with panels made of crystalline silicon will be considered.
In Figure 9 it can be observed that even in daylight hours it is used power from the batteries to feed the load because the power produced by the panels is not enough, as shown in Figure 8. Relatively to Figure 10, it can be concluded the following: imagine that as soon as the system is assembled, the power produced by the panels is immediately used to charge the batteries. These are fully charged, with SOC = 100%, at 18 h, as it was previously assumed. Further, by the observation of Figure 8, at 18 h, the power consumption of the tower is already higher than the power produced by the panels, so the batteries automatically start to feed the tower, whether it is night or not. With this, the batteries discharge over the hours until they get 0% energy, as can be seen in Figure 10. As soon as this happens, it is also verified that it is no longer possible to charge the batteries because the energy produced by the panels is not enough to cover all the energy consumed during a day in the North Tower. Therefore, in Figure 10 it is only considered for the moment when the system is installed in the tower which is when it is possible to get the batteries at 100%. This happens, because, normally stand-alone systems (systems not connected to the utility grid) require batteries to store the generated excess of power, but as in this case no excess power is generated, the SOC of the batteries is always at 0% and with this it is concluded that with these solutions it is not yet possible to have completely independent systems as they do not produce the energy needed to power the tower. Therefore, it is necessary to connect these systems to the grid so that the grid supplies the difference between the total energy consumption and the power produced from the PV system.

6. Economic Study of the Presented Solutions

Considering the schedule of peak, full, and empty hours during the summer (represented by June) and during the winter (represented by January), as presented in Table 1, a total electricity cost per year of approximately 365,500 € is obtained. In the North Tower, the tariff is tri-hourly due to the contracted power, according to the Portuguese tariffs.
Knowing that the return years is given by the fraction between the total investment and the total electricity cost per year, it is possible to make the economic study of both solutions. Just to mention that in the difference between them are the costs of the panels used to cover the facades. Thus, the economic study for the first solution (facades cover with amorphous panels) is presented in Table 2, and the one for the second solution (facades cover with crystalline panels) is presented in Table 3.
By observing the previous tables and taking into account which solution produces a greater amount of energy, it is immediately apparent that the best solution is the one with the crystalline silicon panel at the facades (second solution), because it is the solution that presents the highest values of energy produced and is also the one that presents the least number of years of return, being a consequence of a lower investment.
Another thing that must be mentioned is the fact that the installation and maintenance costs should be considered. Thus, according with the data from some specialized companies, some money reserves should be allocated [16,17]. In addition to the total value presented in Table 2 and Table 3, a 10% reserve of the panels costs should be allocated to the installation process and a 30% reserve of all system costs should be estimated to the system maintenance costs [16,17]. Considering all these costs, both solutions lead to a return estimative of seven years.
Also, the second solution this is not at all what one wants to install in the tower. The ideal would be, as is often mentioned in this article, to install glass windows (windows with panels of amorphous silicon) capable of producing a reasonable amount of energy in order to feed the entire tower. But to do this still many challenges lie ahead.
As seen in the previous theoretical study, the energy produced by the panels during the day is not sufficient to power the tower at night, so in the following section a solution for the production of energy at night through the installation of wind turbines in the top of the tower is going to be presented.
As an alternative for energy production at night it will be considered wind turbines, which as the name implies, are devices that produce energy through the action of wind. Further, as it is theoretically known, wind speed is higher at night, both in summer and winter.

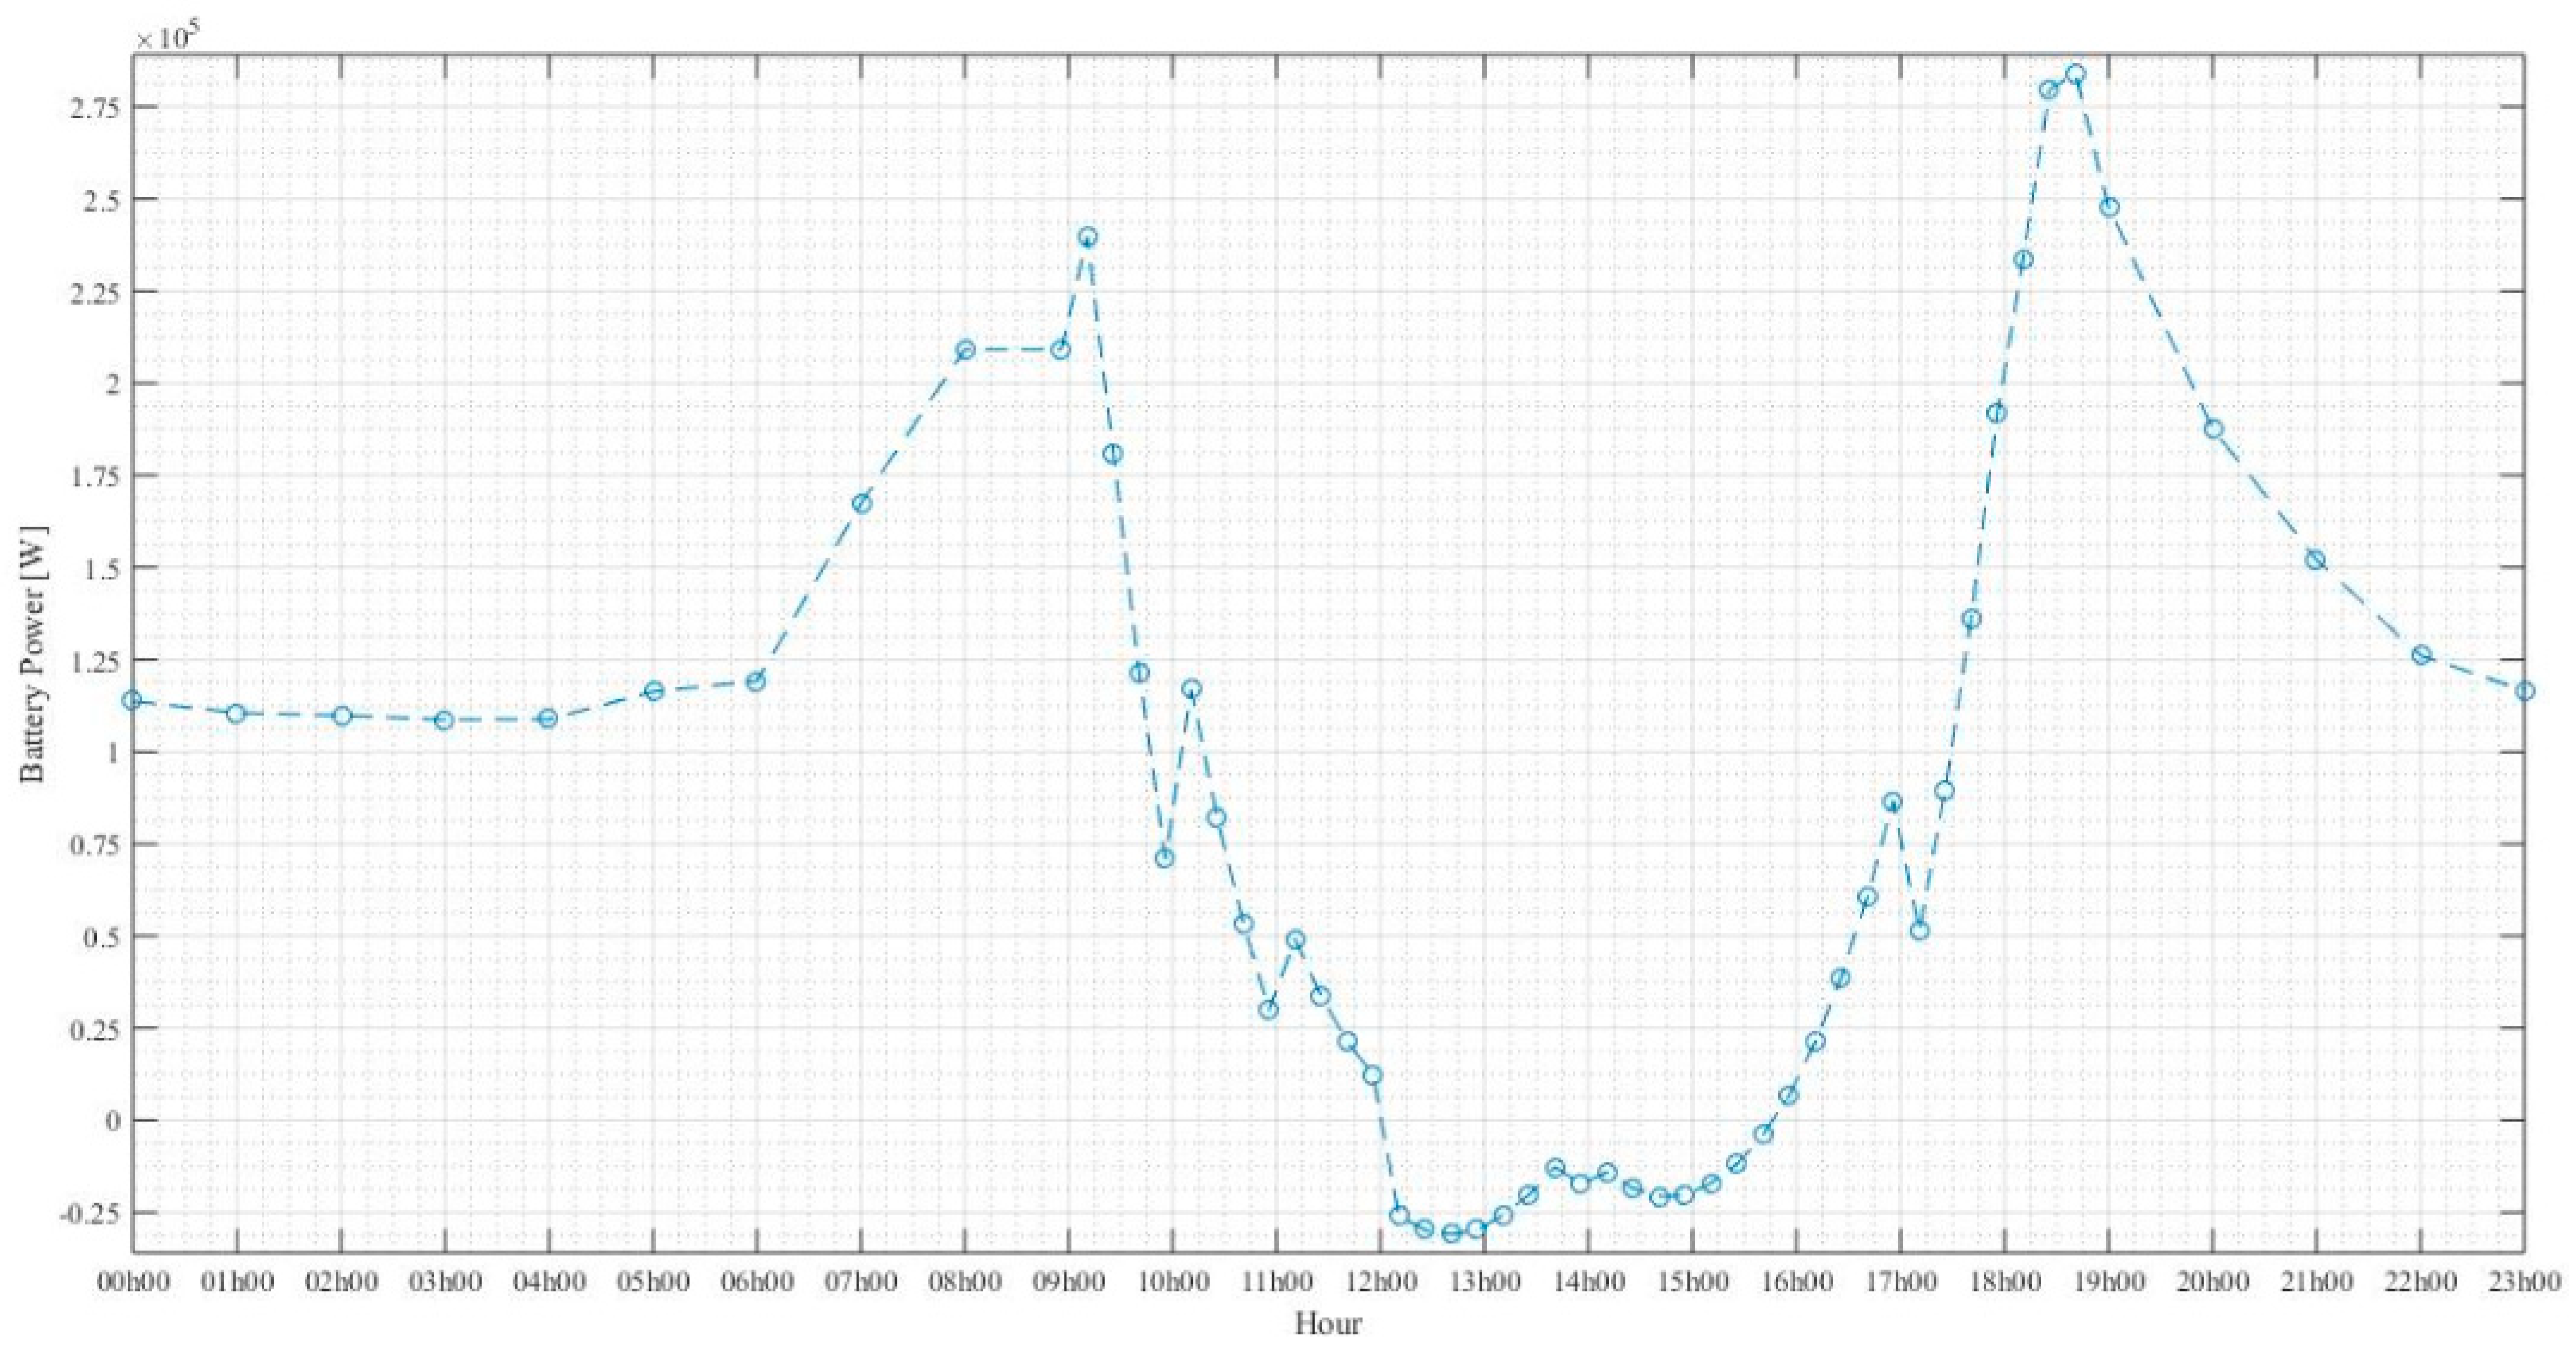
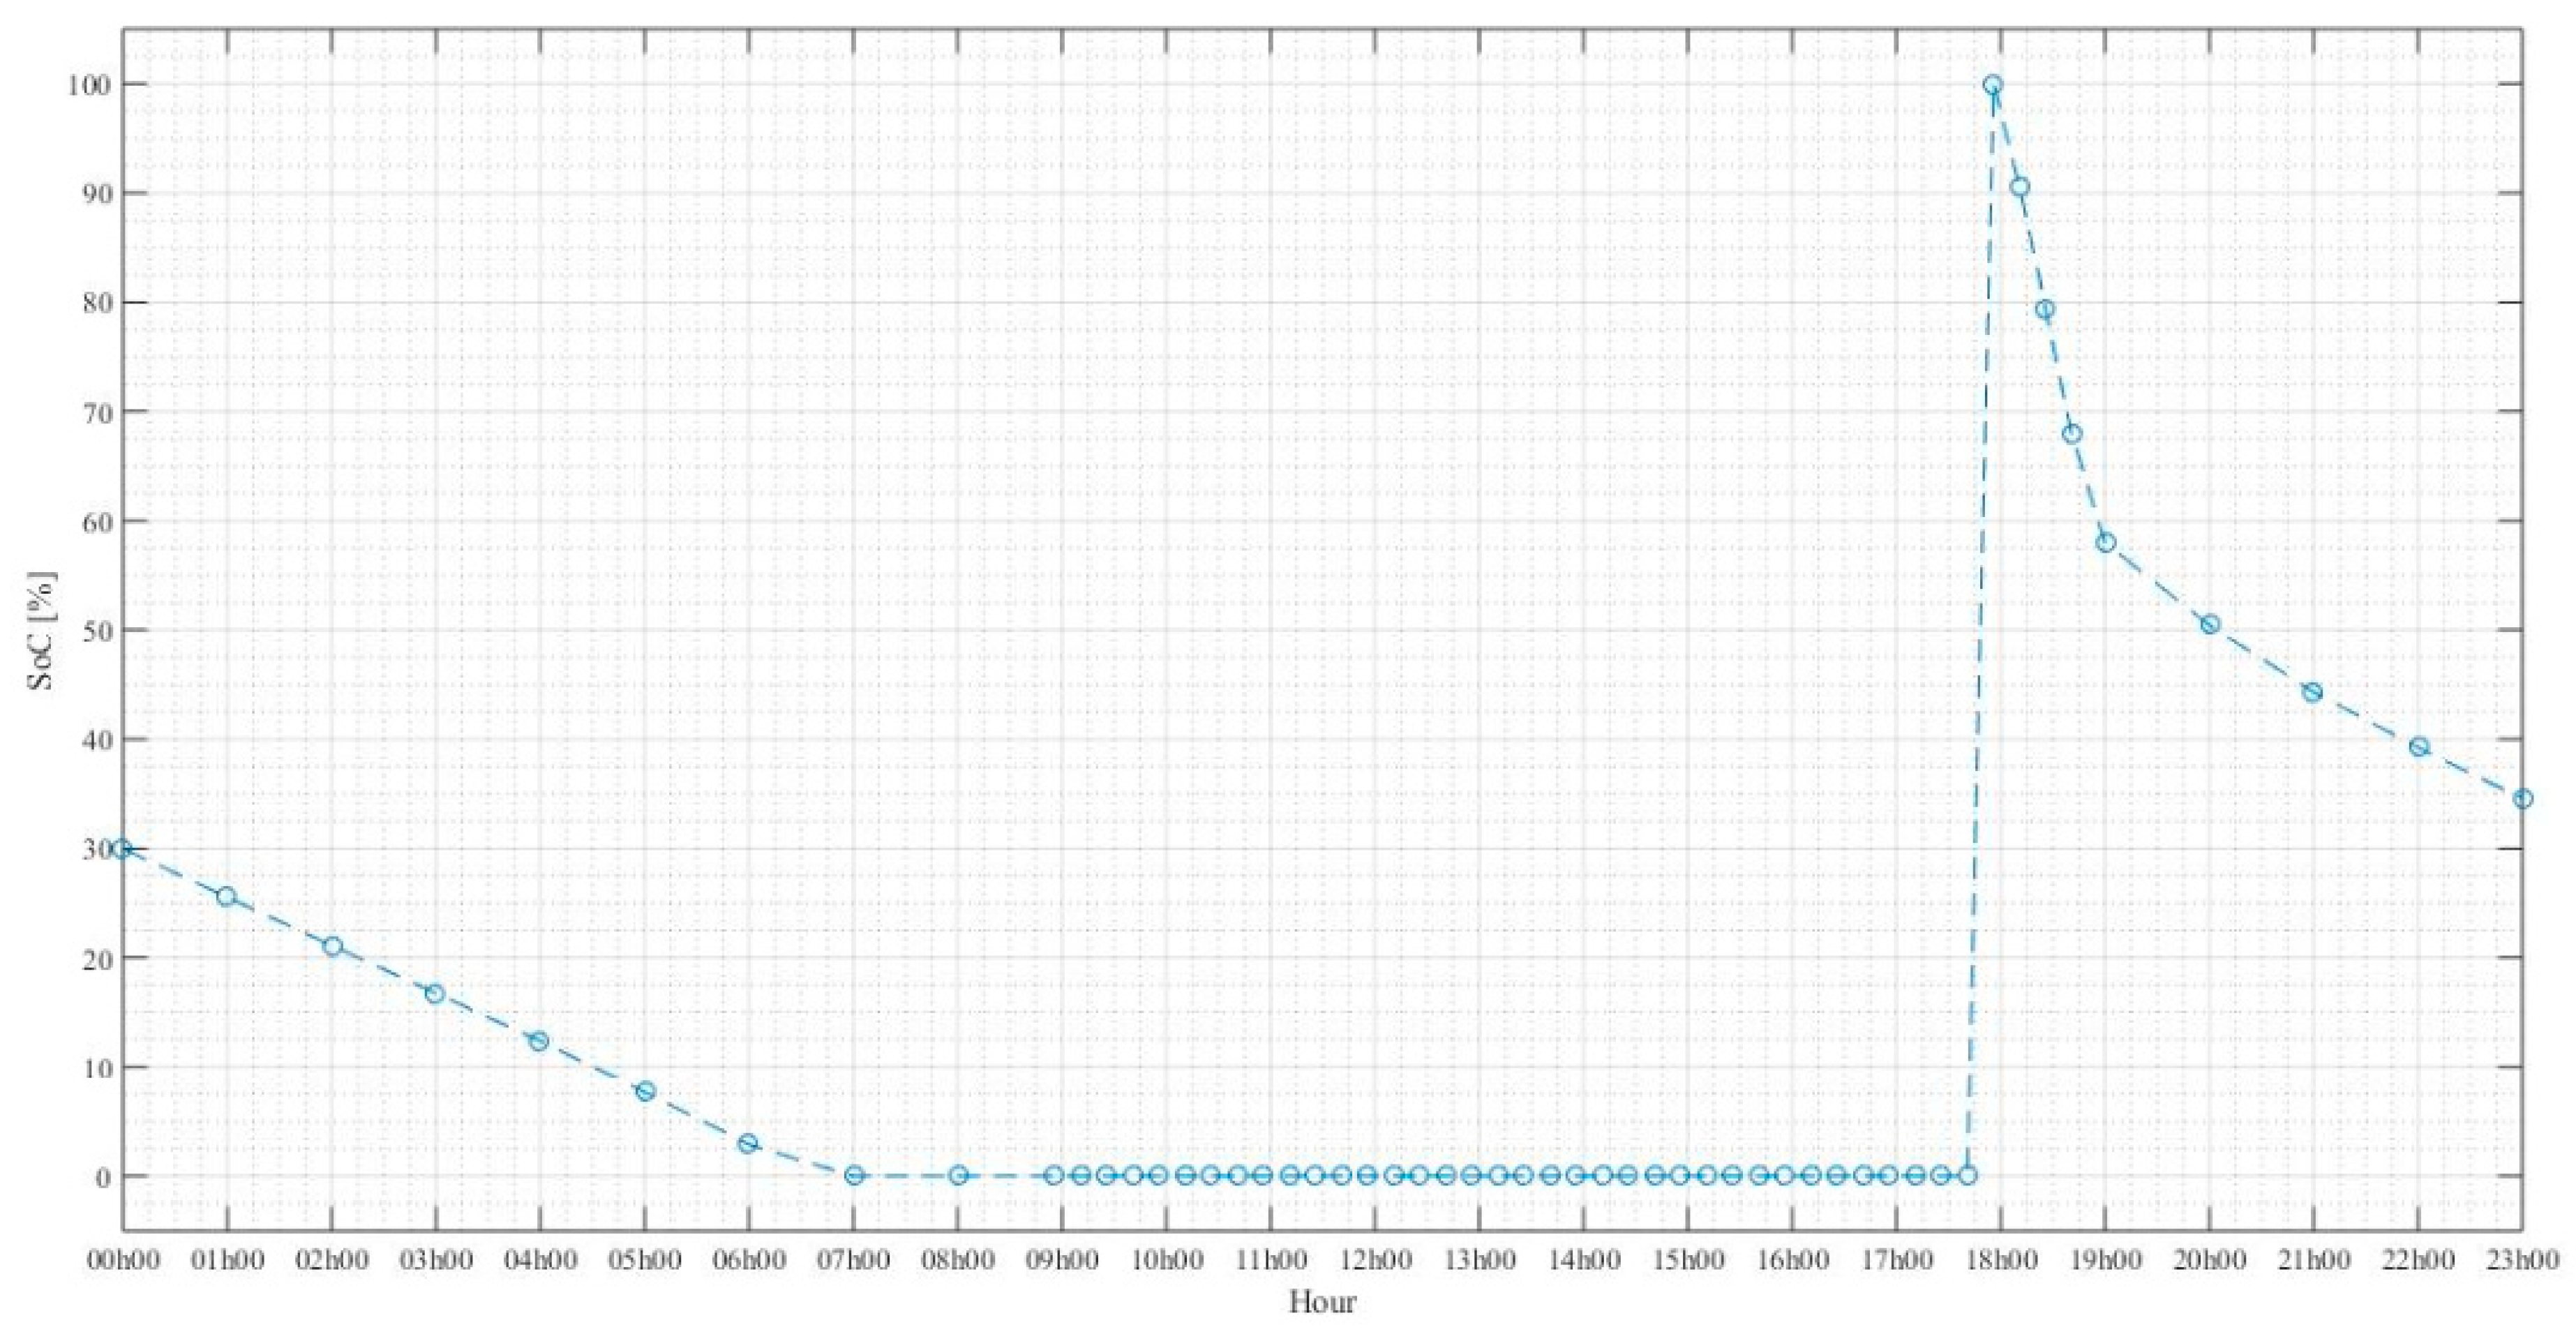
7. Alternative for Overnight Energy Production

It is also important to mention here that the turbines in this solution will not only be used at night but also during the day as a complement to the panels installed on the facades. Also, because there is wind during the day, so the turbines can theoretically run 24 h a day.
Following the introduction of wind turbines at the beginning of this article, it is clear that the most suitable turbines to install in this building under consideration are micro wind turbines. After some research and based on some references it was chosen the Talon 10 wind turbine from A&C Green Energy, which is characterised by an output power in function of the wind speed illustrated on Figure 11 and having the specifications detailed on Table A2 of Appendix A. It is possible to obtain the power produced by one wind turbine by finding the power curve trend line equation, which in this case is the equation presented in Figure 11, where y corresponds to the power in kW and x corresponds to the wind speed in m/s. To determine the trend line of the power curve, several approximations were verified, such as linear or polynomial. However, it was found that the polynomial approximation is the closest to the specification values, presenting a coefficient of determination, R2 of 0.9987, that is 99.87%. This means that this trend curve equation is a good approximation to use to determine the power output of a wind turbine.
To calculate the daily average output power, the daily average wind speed for the months of January and June must be determined and they are presented in Figure 12 and Figure 13, respectively.
In order to have micro-siting, that is the strategy that places the wind turbines in locations where maximum power production is possible throughout the year, certain minimum distances between the individual wind turbines have to be observed. Obviously, in view of the need for wind power plants to maintain a minimum distance between the generators (at least four times the diameter), the possibility of installing more turbines depends on the geometry of the roof and the available power may be less than the one reached by the use of a photovoltaic system installed on the same surface. Then, taking into consideration the dimensions of the top and one turbine, it has been found that it is possible to install four turbines in series on the top of the tower. For safety reasons it will be considered only two rows of four turbines in series, that is eight turbines in total and thus produce the energy over the months of January and June presented in Figure 14 and Figure 15, respectively.
By observing the previous figures, it is immediately apparent that the energy produced by the turbines, in these months, is not enough to power the tower, so that a completely independent system cannot be installed, or in other words, it is needed to have connection to the grid. Thus, if the turbine cannot deliver the amount of needed energy, the grid makes up the difference. If, for instance, the wind system produces more electricity than the household requires, the excess is sent to the grid. As in this case the system is connected to the grid, the only additional equipment required is a power conditioning unit (inverter) that makes the turbine output electrically compatible with the utility grid, since wind turbines generate DC power. In these cases, batteries are not usually required.
Relatively to costs, each turbine costs 24,514.89 €, which makes a total cost, only of turbines purchase, of 196,120 €. Adding the cost of the panels used to cover the tower facades, considering in this case the panels of the second solution, since they are the amorphous silicon panels with the highest percentage of energy production, plus the cost of the inverters, cables and protections, it gets up a total initial investment of approximately 400,000 €. Here, it should be noted that the investment price is much lower, because the system is not independent or not self−sufficient, i.e., it does not produce enough energy to feed the entire tower and to charge the batteries, so it has no batteries or charge controller. Therefore, the system needs to be connected to the national grid.
With this type of solution, the price of the annual energy consumption provided by the grid would decrease as only a percentage of it would be used because the remainder would be provided by the system of panels and turbines.

8. Socio-Economic Impacts

Based on some research and on what is presented in this paper the first and more obvious impact is the environmental one. But the most important and positive effects that PV can bring to a country like Portugal are the social and economic ones. The positive impacts that deserve to be highlighted are a reduction of transmission lines/grids, the decentralisation of energy supplies, the low density off-grid areas, the national energy independency from import, the lower military expenses, its diversification, the jobs creation, the creation of a new, high added value industrial cluster, and an improved image. On the other hand, the negative aspects that must be highlighted are the requirement for energy storage for continuous supply, the economically detrimental subsidies such as uncontrolled and miscalculated feed-in-tariff mechanisms, the intermittent supply issues, the health hazards, and the risks during manufacturing. In short, PV can bring much more benefits than cons. It can benefit the industry, the economy and the environment with long term effects and the security of energy supply in medium term.
Although there has not yet been a theoretical study about organic cells, and knowing that they do not yet produce the energy needed to suppress today’s needs, it is recognized that they will have enormous advantages in the future of our environment. It is necessary to mention that the study was not made due to fact that the sheets found have very few information. Back to the advantages that this type of cells can bring to buildings like the North Tower, it can be highlighted that these modules do not show the performance drop usually observed with traditional inorganic PVs in diffuse lighting conditions found in facades. Also, integrating OPV into facades elements reduces both the energy consumption and CO2 emissions of a building.
Relatively to wind energy, the wind power just like solar power, is a key component of renewable energy utilisation. Implementation of building integrated wind turbines contributes positively to the environment as a climate change mitigation option. In addition to environmental advantages, building integrated wind turbines offer opportunities for local economic development too, including less financial burden to households due to lower electrical costs, opportunities for households/building owners to sell surplus electricity back to the grid, new skills and job opportunities for the local workforce, and mechanisms to grow the local green economy.

9. Conclusions

In terms of manufacturing matter, there is still a long way to go and many challenges lie ahead. The evolution of PV technology and the development of new materials and building components are fundamental pieces in this work. Both the PV sector and construction industry must work together and join their experiences and knowledge in order to develop innovative elements, which in turn comply with all regulations and standards of quality and are in accordance with PV engineering competences. Although an increasing number of BIPV products can be found, looking to the future, collaboration between the PV and construction industries must be reinforced in order to develop innovative and attractive products, easy to installation, reliable, with low environment impact and cost-effective. In particular, new developments of photovoltaic technologies are needed to enable the integration into several materials that make up the skins of buildings today, easy application of photovoltaic cells in conventional materials is imperative because that, in a lot of ways, will allow the development of new solutions and thus make the world a better place.
In this paper, the incorporation of solar panels on the North Tower of Instituto Superior Técnico is studied. Two solutions are presented in order to cover/substitute the windows of the Tower. One solution, where it is used amorphous silicon panels and the other using crystalline silicon panels. Despite the fact that neither the first nor the second solution allow to create an off-grid or stand-alone system, both solutions present a return estimative of seven years, with an initial investment of approximately two million euros. In order to produce more energy, some other solutions can be analysed. One of them is the incorporation of wind turbines, which is also studied in this paper, because, theoretically, wind speed is higher at night, both in summer and winter, being a good complementary sub-system to add to a PV system, since during night PV panels cannot produced energy.

Supplementary Materials

Supplementary File 1

Author Contributions

B.D. was responsible to write the original draft, J.P.N.T. and C.A.F.F. are her supervisors, J.P.N.T. and R.A.M.L. analysed the results and they were responsible to review and editing the final manuscript. All authors have read and agreed to the published version of the manuscript.

Funding

This research received no external funding.

Acknowledgments

This work was supported in part by FCT/MCTES through national funds and in part by cofounded EU funds under Project UIDB/EEA/50008/2020.

Conflicts of Interest

The authors declare no conflict of interest.

Appendix A

In this section, the specifications for the active elements of the aforementioned solutions are summarised. Thus, in Table A1 is presented the specifications for the three panels used on the two solutions studied in this paper. Panel dimensions are detailed, including power, voltage, and current at the maximum power point (mpp). Further, the values for the open circuit voltage and the short circuit current are presented as well as the temperature coefficient. In Table A2, the specifications for the Talon 10 turbine are presented in order to clarify the project designing stage.
Table A1. Photovoltaic panels specifications.
Dimensions [mm] P m p p   [ W ] V m p p   [ V ] I m p p   [ A ] V o c   [ V ] I s c   [ A ] α T   [ % / K ]
PS−MC−SE1988 × 992 × 7.134537.629.1747.189.62−0.47
PS−M−NX1100 × 1400 × 8.91601311.221701.33−0.21
PS−PC−SE1988 × 992 × 7.132036.788.745.499.26−0.46
Table A2. Turbine Talon 10 specifications.
Rated Power10 kW
Peak Power12.5 kW
Rated Wind Speed11 m/s
Start-up Wind3 m/s
Working Speed2.5−25 m/s
Survival Wind50 m/s
Blade Diameter7.62 m
Working Voltage300 V D C
Output Voltage220 V A C
Working Noise Power65 dB
Turbine Main Body Weight500 Kg
Generator Lifespan15 years

References

  1. Ahmad, S.; Ariaratnam, S. A study of socioeconomic impacts of renewable energy projects in Afghanistan. Procedia Eng. 2016, 145, 995–1003. [Google Scholar]
  2. Bhandari, B.; Lee, K.T.; Chu, W.S.; Lee, C.S.; Song, C.K.; Bhandari, P.; Ahn, S.H. Socio-Economic Impact of Renewable Energy-Based Power System in Mountainous Village of Nepal. Int. J. Precis. Eng. Manuf. -Green Technol. 2017, 4, 37–44. [Google Scholar] [CrossRef]
  3. Matungwa, B. An Analysis of PV Solar Electrification on Rural Livelihood Transformation. A case of Kisiju-Pwani in Mkuranga District, Tanzania. Master’s Thesis, Centre for Development and the Environment, University of Oslo, Blindern, Norway, December 2014. [Google Scholar]
  4. Nyandega Onsomu, L. Socio-Economic Impacts of Photovoltaic Solar Installation and Use: A Case Study of Borabu Division in Myamira Country. Master’s Thesis, Department of Geography and Environmental Studies, University of Nairobi, Nairobi, Kenya, 2013. [Google Scholar]
  5. Furkan, D. The Analysis on Photovoltaic Electricity Generation Status, Potential and Policies of the Leading Countries in Solar Energy. Renew. Sustain. Energy Rev. 2011, 15, 713–720. [Google Scholar]
  6. Proena, E. Photovoltaic Solar Energy in Portugal. State-of-theart and Perspectives of Development; Young, M., Ed.; The Technical Writers Handbook: Mill Valley, CA, USA, 1989. [Google Scholar]
  7. Seixas, J.; Fortes, P.J.; Gouveia, P.; Simes, S.G. The Role of Electricity in the Decarbonization of the Portuguese Economy; CENSE Center for Sustainability and Environmental research, Faculdade de Ciências e Tecnologia, Universidade Nova de Lisboa: Lisbon, Portugal, 2017. [Google Scholar]
  8. Virgilio, R.P.P.C. Solar Energy in Portugal. Development Perspectives based on a Comparison with Germany; ISCTE Business School: Lisbon, Portugal, 2009. [Google Scholar]
  9. Transparent Solar Panels. Green Match, last Updated: 01 April 2019. Available online: https://www.greenmatch.co.uk/blog/2015/02/transparent-solar-panels (accessed on 21 September 2019).
  10. Husain, A.A.; Hasan, W.Z.W.; Shafie, S.; Hamidon, M.N.; Pandey, S.S. A review of transparent solar photovoltaic technologies. Ren. Sustain. Energy Rev. 2018, 94, 779–791. [Google Scholar] [CrossRef]
  11. Gray Modules: New Dimension in Organic Photovoltaics for Buildings. Available online: https://www.pv-magazine.com/press-releases/gray-modules-new-dimension-in-organic-photovoltaics-for-buildings_100022152/ (accessed on 15 August 2019).
  12. Morse, G.; Harding, R.; Blouin, N.; Buerckstrummer, H.; Pron, A.; Wieder, S.; Mueller, D.; Berny, S. Organic Photovoltaic Applications for IoT, Architecture, and Wearables. Mater. Matters 2017, 12, 3. [Google Scholar]
  13. Casini, M. Small vertical axis wind turbines for energy efficiency of buildings. J. Clean Energy Technol. 2016, 4. [Google Scholar] [CrossRef] [Green Version]
  14. Wind Energy: Building-Integrated Turbines. Available online: https://www.ctcn.org/collection/climatetechwiki (accessed on 20 September 2019).
  15. Fonseca, A.C.A. Projeto de arquitetura para minimizar as operações de manuteno. Dissertação para obtenção do Grau de Mestre em Construção e Reabilitação. Master’s Thesis, Instituto Superior Técnico, Portugal, Lisboa, January 2013. [Google Scholar]
  16. Solar Panel Maintenance Cost. Available online: https://www.fixr.com/costs/solar-panel-maintenance (accessed on 18 October 2019).
  17. Average Solar Panel Maintenance Cost. Available online: https://www.thumbtack.com/p/solar-panel-maintenance-cost (accessed on 21 October 2019).
Figure 1. Basic structure of an autonomous solar energy system.
Sustainability 12 01923 g001
Figure 2. Daily average irradiance in January.
Sustainability 12 01923 g002
Figure 3. Daily average irradiance in June.
Sustainability 12 01923 g003
Figure 4. Daily average temperature in January.
Sustainability 12 01923 g004
Figure 5. Daily average temperature in June.
Sustainability 12 01923 g005
Figure 6. Energy consumption profile for the worst day in January.
Sustainability 12 01923 g006
Figure 7. Energy consumption profile for the worst day in June.
Sustainability 12 01923 g007
Figure 8. Daily available PV power and daily energy consumption of the tower.
Sustainability 12 01923 g008
Figure 9. Evolution of the batteries power throughout the day (positive when discharging and negative when charging).
Sustainability 12 01923 g009
Figure 10. SOC of the battery system considering 100% at 18 h.
Sustainability 12 01923 g010
Figure 11. Power curve of the chosen wind turbine.
Sustainability 12 01923 g011
Figure 12. Wind speed in January in the North Tower.
Sustainability 12 01923 g012
Figure 13. Wind speed in June in the North Tower.
Sustainability 12 01923 g013
Figure 14. Power produced by the 8 turbines in January.
Sustainability 12 01923 g014
Figure 15. Power produced by the 8 turbines in June.
Sustainability 12 01923 g015
Table 1. Electricity sale tariff for the North Tower.
Fixed Expenditure
(€/Day)
Full Hours
(€/kWh)
Empty Hours
(€/kWh)
Peak Hours
(€/kWh)
1.88680.30100.14420.0731
Table 2. Economic study for the first solution.
EquipmentUnit CostTotal CostReturn
PS−M−NX panels285 €/ m2137,000 €-
PS−MC−SE panels0.188 €/W28,000 €-
Batteries2416 €1,752,000 €-
Charge Controller1183.7 €5918.5 €-
Inverter4820.69 €24,103.45 €-
Cables1.23 €/m6798 €-
Protections270013,500 €-
TOTAL-1,967,000 €5.4 years
Table 3. Economic study for the second solution.
EquipmentUnit CostTotal CostReturn
PS−PC−SE panels0.206 €/W123,000 €-
PS−MC−SE panels0.188 €/W28,000 €-
Batteries2416 €1,752,000 €-
Charge Controller1183.7 €5918.5 €-
Inverter4820.69 €24,103.45 €-
Cables1.23 €/m6798 €-
Protections270013,500 €-
TOTAL-1,953,000 €5.3 years

